6-1 allocating resources to the project. 6-2 introduction 4 projects compete with one another for...
TRANSCRIPT

6-1
Allocating Resources to the Project

6-2
Introduction
Projects Compete With One Another for Resources– resources that are not consumed
– resources that are consumed
Goal of Resource Allocation is to Optimize Use of Limited Supply
Requires making trade-offs– time constrained
– resource constrained

6-3
EXPEDITING A PROJECT
6-4
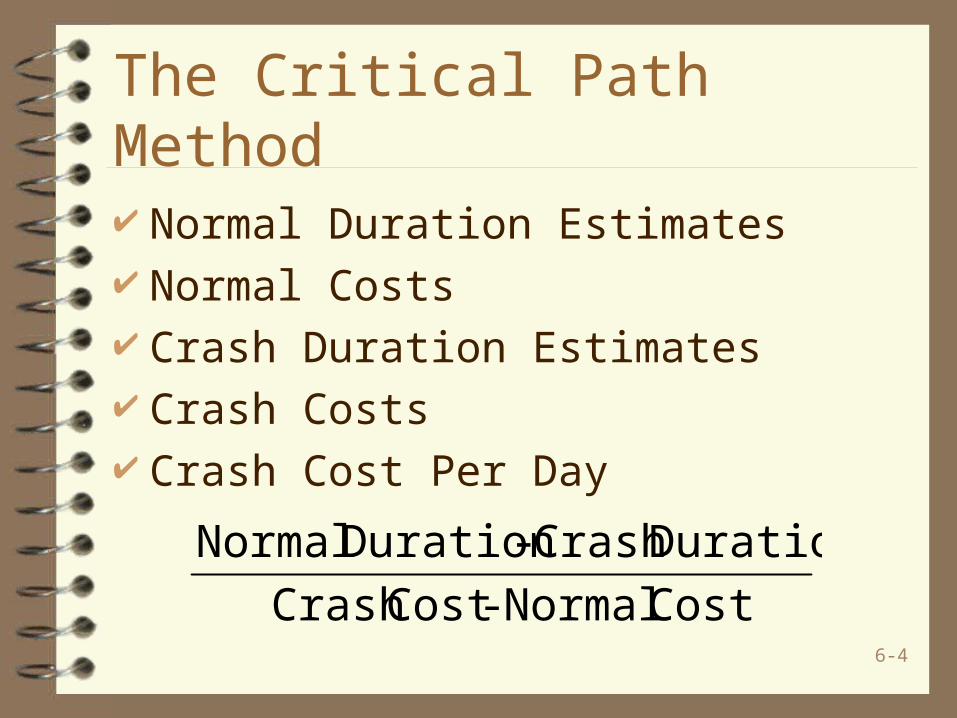
The Critical Path Method
Normal Duration Estimates Normal Costs Crash Duration Estimates Crash Costs Crash Cost Per Day
Cost Normal -Cost Crash
DurationCrash -Duration Normal
6-5
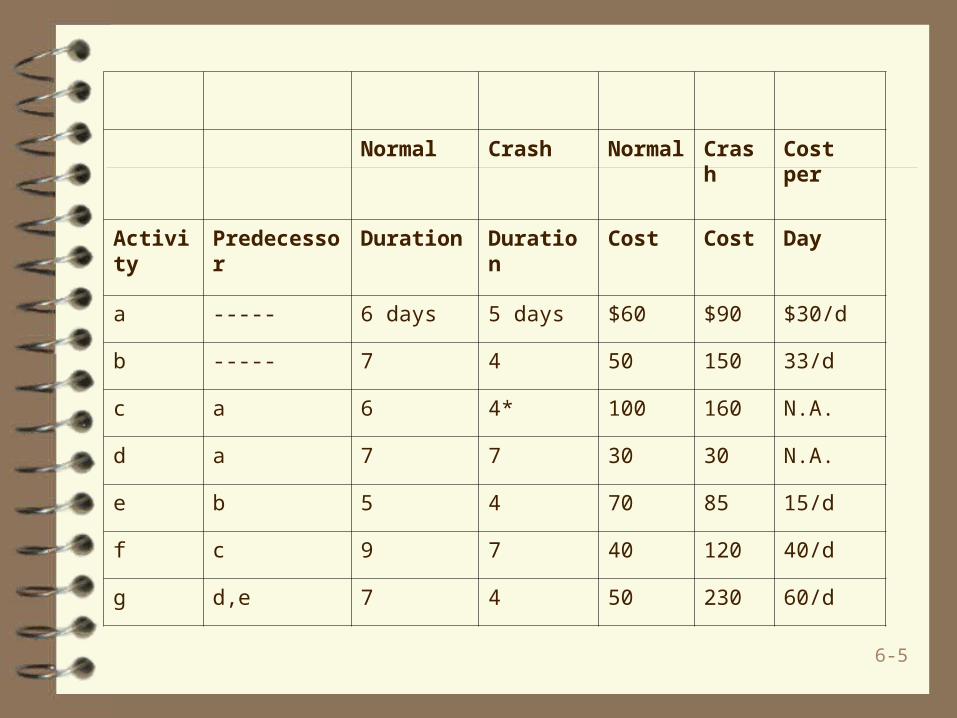
Normal Crash Normal Crash Cost per
Activity Predecessor Duration Duration Cost Cost Day
a ----- 6 days 5 days $60 $90 $30/d
b ----- 7 4 50 150 33/d
c a 6 4* 100 160 N.A.
d a 7 7 30 30 N.A.
e b 5 4 70 85 15/d
f c 9 7 40 120 40/d
g d,e 7 4 50 230 60/d

6-6
Figure 6-1(a) Gantt Chart Crash Problem -- 21-Day Project
6-7
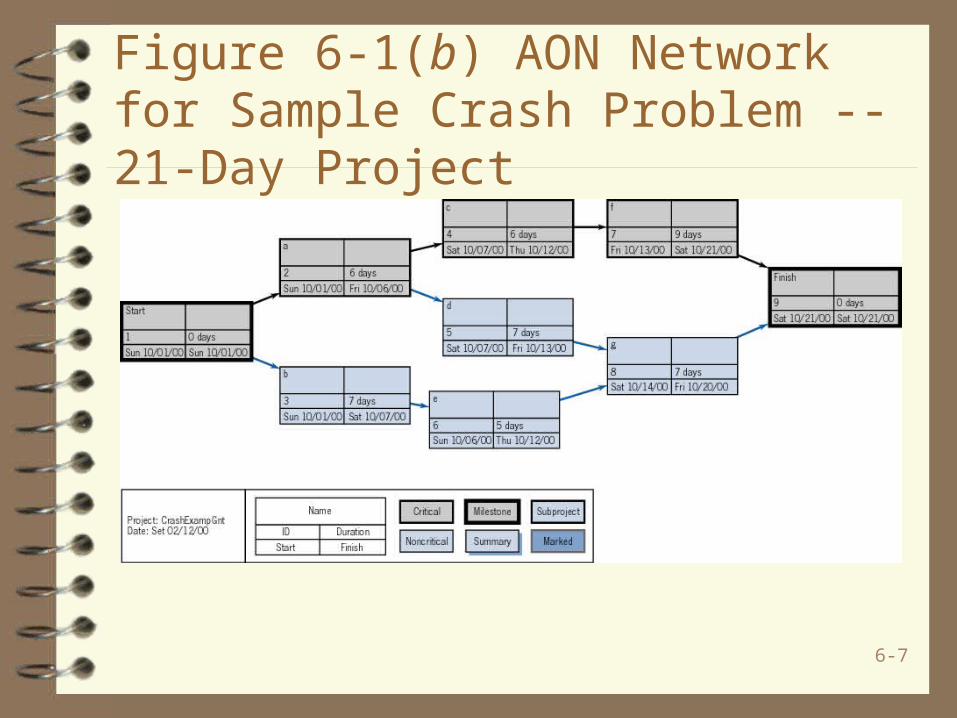
Figure 6-1(b) AON Network for Sample Crash Problem -- 21-Day Project

6-8
Figure 6-2 Gantt Chart for 20-Day Solution to Crash Problem

6-9
Figure 6-3 Gantt Chart for 19-Day Solution to Crash Problem

6-10
Figure 6-4 Gantt Chart for 18-Day Solution to Crash Problem

6-11
Figure 6-5 Gantt Chart for 16-Day Solution to Crash Problem

6-12
Figure 6-6 Project Cost Versus Project Duration for Sample Crash Problem

6-13
Using Excel’s Solver to Crash a Project Target Cell
– minimize crashing costs
By Changing Cells– amount to crash activities– time events occur
Constraints– amount each activity can be crashed– precedence relationships– complete project by specified time– nonnegativity
6-14
Fast-Tracking a Project
Used Primarily in Construction Industry Building phase started before design and
planning phases completed Particularly appropriate when large
proportion of work is routine
6-15
RESOURCE LOADING
6-16
Resource Loading
Amount of specific resources that are scheduled for use on specific activities or projects at specific times.
Usually a list or table.

6-17
Figure 6-10 Action Plan and Gantt Chart for Production of a Videotape
6-18
The Charismatic VP
Subordinates have hard time saying no to well liked boss.
Leads to overcommitted subordinates. Problem further compounded because more
experienced workers tend to be most over worked.
One solution is to set specific limits on amount of overscheduling permitted.

6-19
RESOURCE LEVELING

6-20
Figure 6-10 Action Plan and Gantt Chart for Production of a Videotape

6-21
Figure 6-12 Resource Overallocation Report for Scriptwriter Showing all Activities
6-22
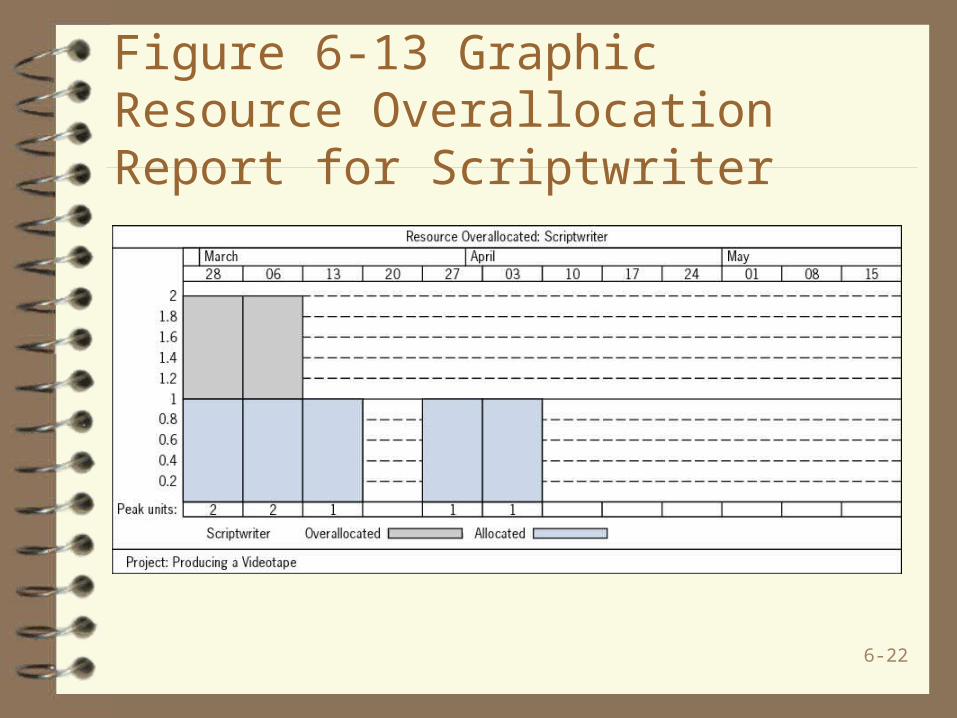
Figure 6-13 Graphic Resource Overallocation Report for Scriptwriter
6-23
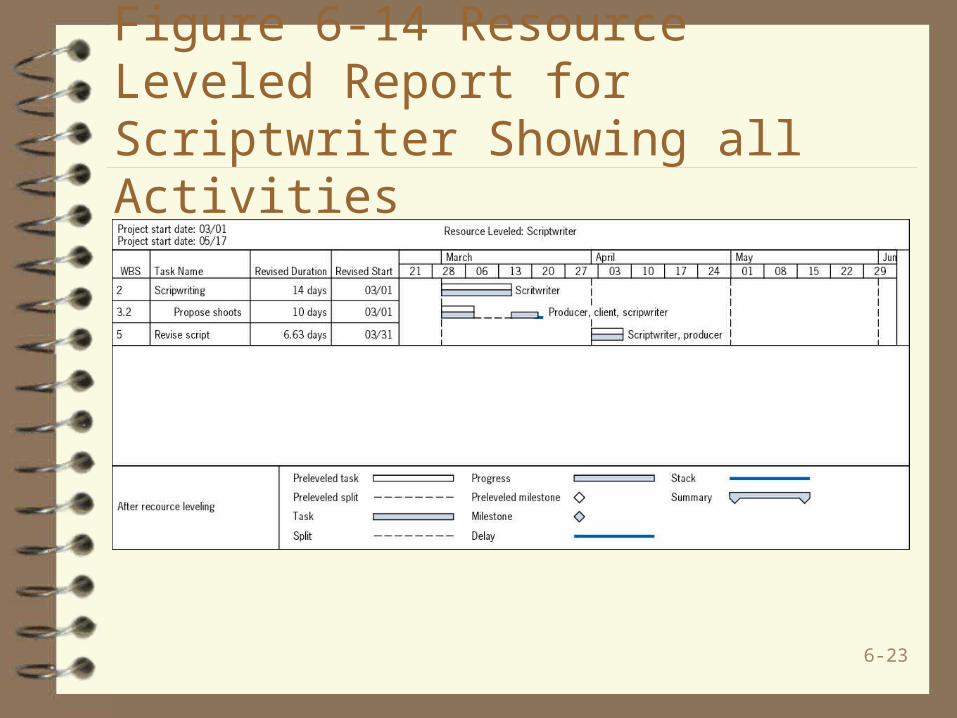
Figure 6-14 Resource Leveled Report for Scriptwriter Showing all Activities
6-24
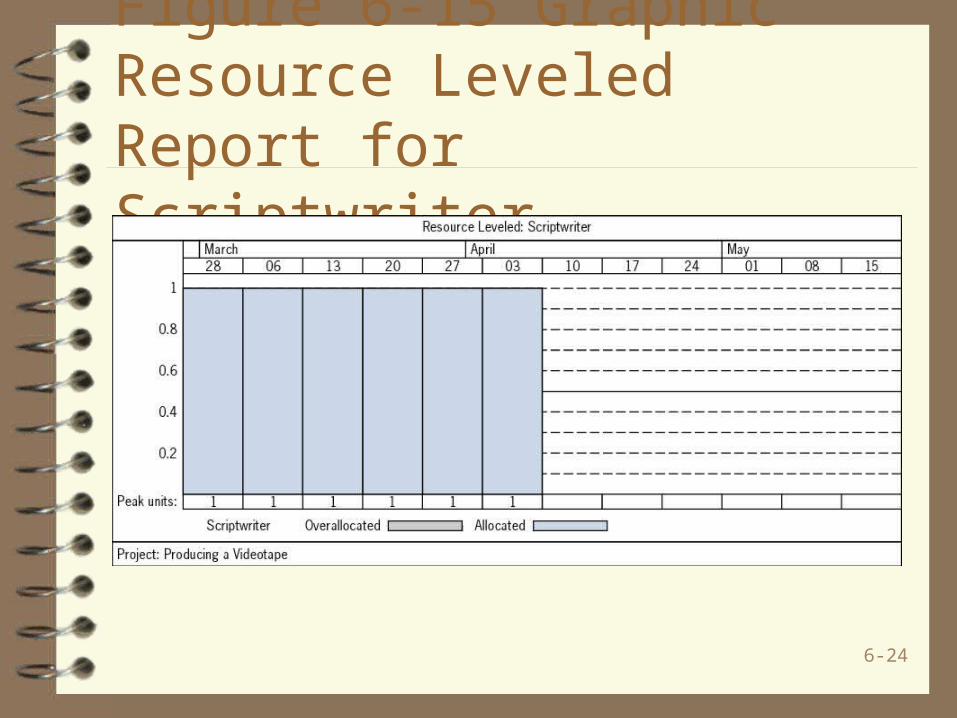
Figure 6-15 Graphic Resource Leveled Report for Scriptwriter
6-25
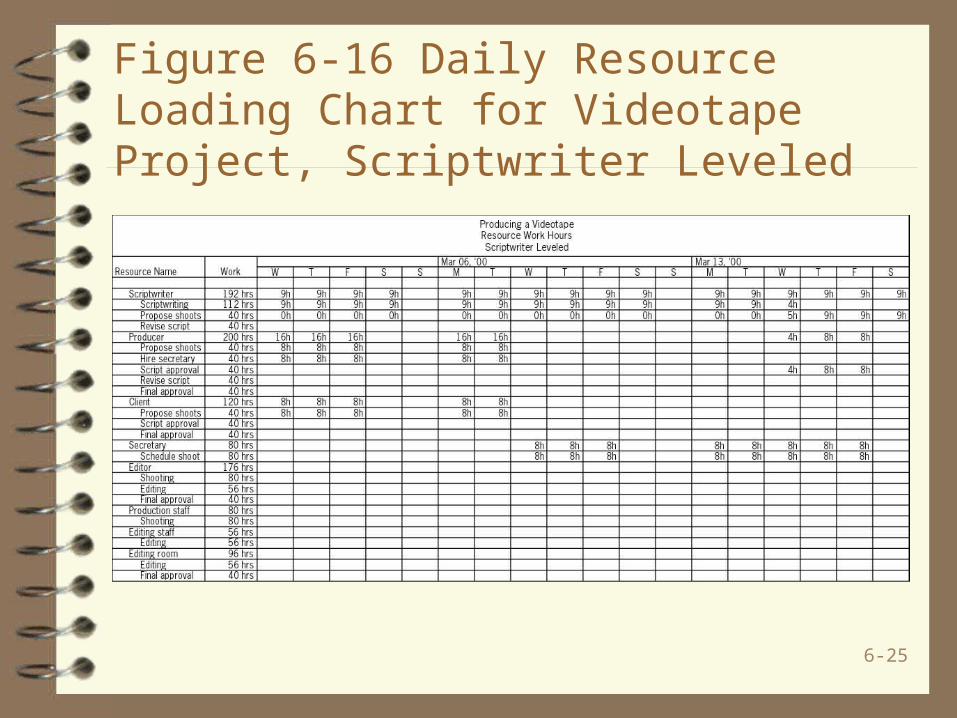
Figure 6-16 Daily Resource Loading Chart for Videotape Project, Scriptwriter Leveled

6-26
Figure 6-17 Final Videotape Project Gantt Chart Schedule, With Two Scriptwriters and Producer Leveled

6-27
Figure 6-18 Thirty-Four-Week Resource Loading Chart for a Software Engineering Group

6-28
Resource Loading/Leveling and Uncertainty 28,282 Hours Needed Group Capacity
– 21 (people) 40 (hrs/wk) 34 wk = 28,560 labor hrs
Correction for Holidays– 21 3 (days) 8 (hours) = 504 labor hrs
Vacations– 11 2 (weeks) 40 = 880 labor hrs

6-29
Resource Loading/Leveling and Uncertainty continued Hours Available
– 28,560 - 504 - 880 = 27,176– about 1100 less than needed – 28,282/27176 = 1.04
What about– Workers getting sick?– Task not ready when worker is ready?– Change orders?
6-30
ALLOCATING SCARCE RESOURCES TO PROJECTS

6-31
Use of Software
Begin with Pert/CPM Schedule Activities examined period by period and
resource by resource In cases where demand for resource
exceeds supply, tasks considered one by one and resources assigned to these tasks based on priority rules

6-32
Some Comments about Constrained Resources Scarcity of resources rarely applies to
resources in general “Walts”
6-33
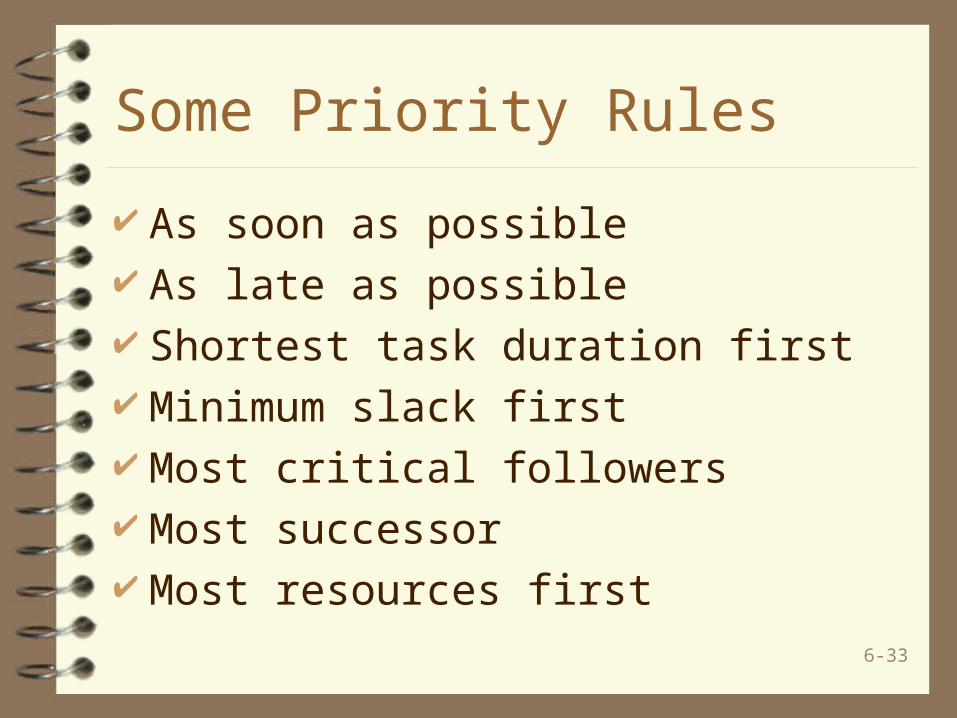
Some Priority Rules
As soon as possible As late as possible Shortest task duration first Minimum slack first Most critical followers Most successor Most resources first
6-34
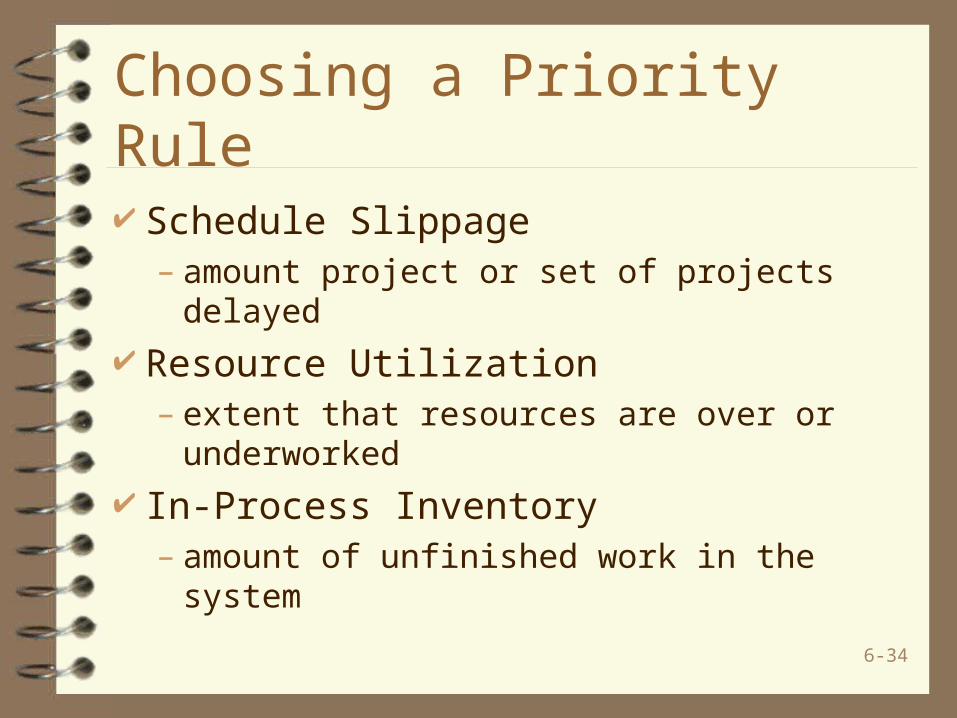
Choosing a Priority Rule
Schedule Slippage– amount project or set of projects delayed
Resource Utilization– extent that resources are over or underworked
In-Process Inventory– amount of unfinished work in the system
6-35
ALLOCATING SCARCE RESOURCES TO SEVERAL
PROJECTS
6-36
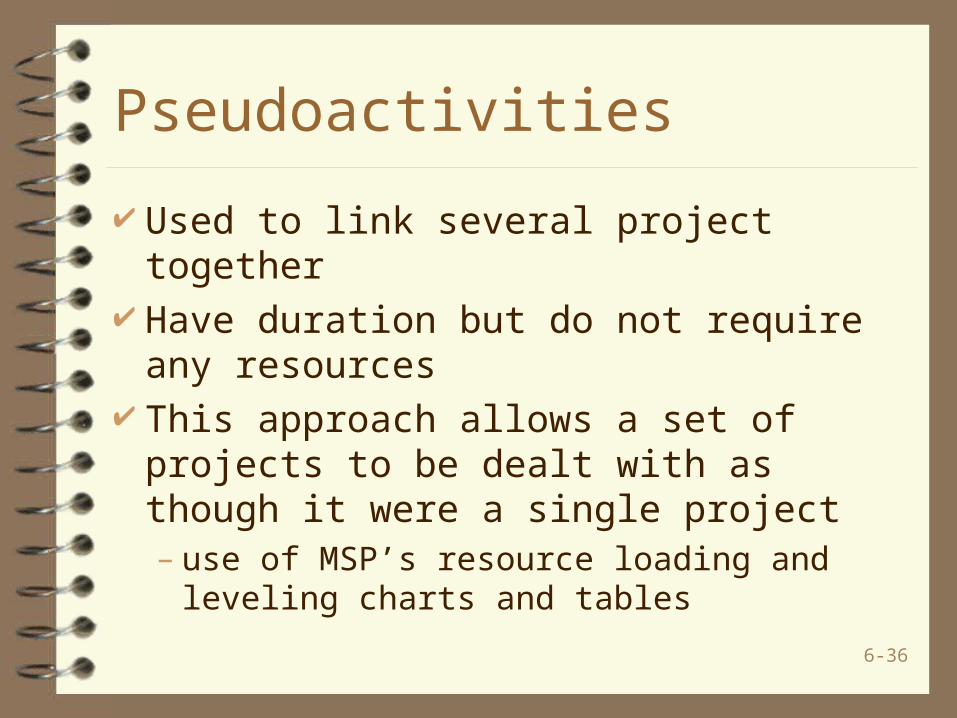
Pseudoactivities
Used to link several project together Have duration but do not require any
resources This approach allows a set of projects to be
dealt with as though it were a single project– use of MSP’s resource loading and leveling
charts and tables

6-37
Figure 6-19 Multiple Projects Connected with
Pseudoactivities Shown on a Time Line
6-38
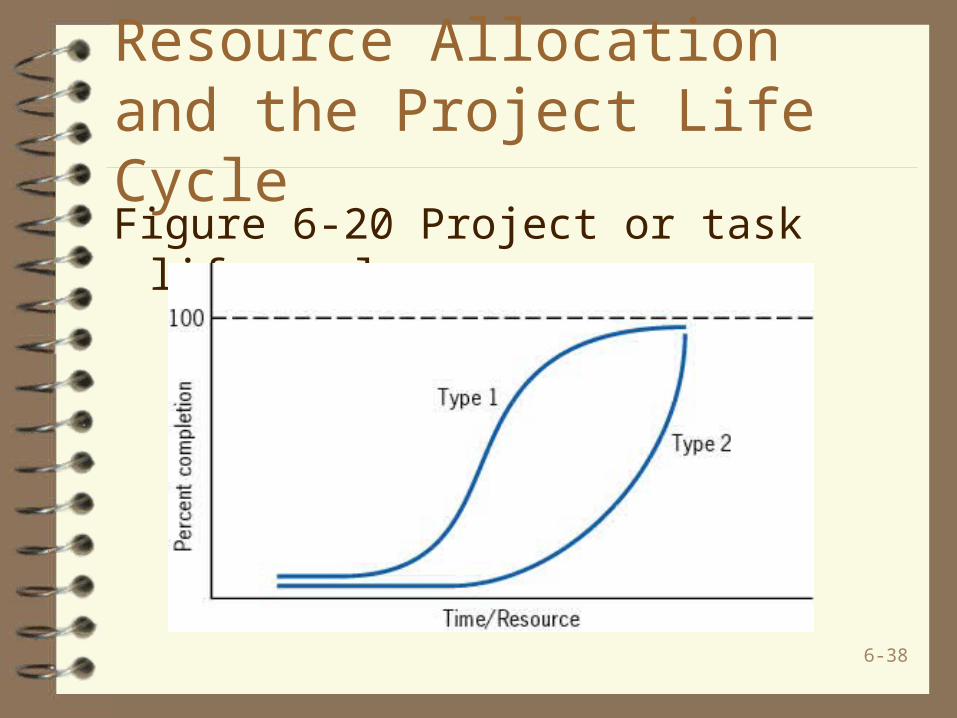
Resource Allocation and the Project Life CycleFigure 6-20 Project or task life cycles

6-39
GOLDRATT’S CRITICAL CHAIN
6-40
Introduction Similar issues that trouble people about working on
projects regardless of type of project– unrealistic due dates– too many changes– resources and data not available– unrealistic budget
These issues/problems related to need to make trade-offs
To what extent are these problems caused by human decisions and practices?

6-41
Figure 6-21 Three Project Scenarios

6-42
Table 6-6 Project Completion Time Statistics Based on Simulating Three Projects 200 Times
Scenario 1 Scenario 2 Scenario 3Average 50.4 51.9 53.4Std Dev 7.1 6.3 5.3Max 69.4 72.7 69.3Min 30.1 36.1 39.3Median 50.0 51.8 53.1
6-43
Observations on Estimating Task Times Average Completion Times Optimistic Completion Times Pessimistic Completion Times Implications of Assuming Known Activity Times Impact of Inflated Time Estimates Shape of the Distribution Worker Time Estimates Student Syndrome
6-44
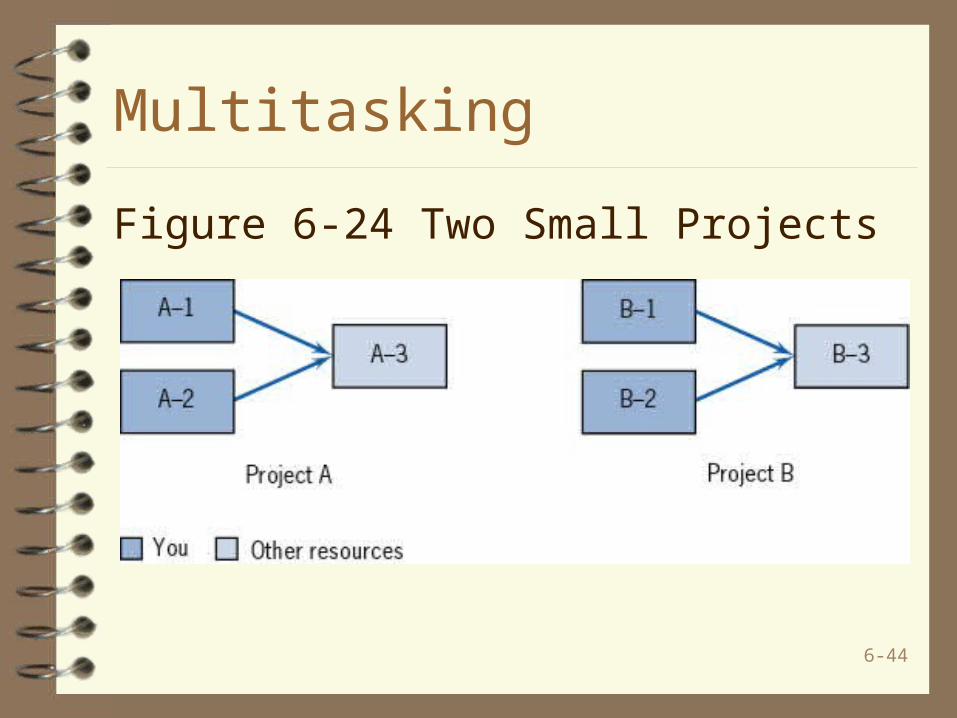
Multitasking
Figure 6-24 Two Small Projects

6-45
Figure 6-25 Alternative Gantt Charts for Projects A and B
6-46
Common Chain of Events
Underestimate time needed to complete project– assumption of known activity times and
independent paths
Project team members inflate time estimates Work fills available time
– student syndrome– early completions not reported

6-47
Common Chain of Events continued
Safety time misused Misused safety time results in missed
deadlines Hidden safety time complicates task of
prioritizing project activities Lack of clear priorities results in poor
multitasking

6-48
Common Chain of Events concluded
Poor multitasking increases task durations Uneven demand on resources also results
due to poor multitasking More projects undertaken to ensure all
resources fully utilized More projects further increases poor
multitasking
6-49
Reversing the Cycle
Reduce number of projects assigned to each individual
Schedule start of new projects based on availability of bottleneck resources
Reduce amount of safety time added to individual tasks and then add some fraction back as project buffer– activity durations set so that there is a high probability
the task will not be finished on time
6-50
The Critical Chain
Longest chain of consecutively dependent events– considers both precedence relationships and
resource dependencies
Project Buffer Feeding Buffer

6-51
Figure 6-26 Sample Network Diagram

6-52
Figure 6-27 Project and Feeder Buffers