5th migration observatory report - centro studi luca d'agliano
TRANSCRIPT

February 2021
5th Migration Observatory Report:“Immigrant Integration in Europe”
Tommaso Frattini (University of Milan and LdA)
with Tommaso Sartori (LdA)
This report is prepared within the Migration Observatory project, jointly carried out by Collegio Carlo Alberto and Centro Studi Luca d’Agliano an This report is prepared within the Migration Observatory project, jointly carried out by Collegio Carlo Alberto and Centro Studi Luca d’Agliano and funded by Fondazione Compagnia di San Paolod funded by Fondazione Compagnia di San Paolo.
February 2021
5th Migration Observatory Report:“Immigrant Integration in Europe”
Tommaso Frattini (University of Milan and LdA)
with Tommaso Sartori (LdA)

5th Migration Observatory Report:“Immigrant Integration in Europe”
February 2021
This report is prepared within the Migration Observatory project, jointly carried out by Collegio Carlo Alberto and Centro Studi Luca d’Agliano and funded by Fondazione Compagnia di San Paolo.

4
EXECUTIVE SUMMARY 7
PART I: IMMIGRANT INTEGRATION IN 2019 7
PART II: IMMIGRATION IN ITALY AND COVID-19 10
INTRODUCTION 13
PART I: IMMIGRANT INTEGRATION IN 2019 - A EUROPEAN OVERVIEW 15
Immigrant population – size 15
Immigrant population – characteristics 16
Labour market outcomes 19
Employment 19
Occupational status 23
Income 25
Immigrants in the EU labour market in the era of COVID-19 28
Migrants’ Occupations: Essentiality 28
Migrants’ Occupations: Teleworkability 30
PART II: IMMIGRATION IN ITALY AND COVID-19 32
Immigration in Italy – size and characteristics 33
Immigrants in the Italian labour market before the pandemic 38
The effect of the COVID-19 crisis on immigrants 45
Regional heterogeneity of COVID-19 effects 49
Conclusions 51
TABLES APPENDIX – Europe 53
TABLES APPENDIX – The Pandemic in Italy 83
TECHNICAL APPENDIX 1 - Europe 108
TECHNICAL APPENDIX 2 – Italy 112
TABLE OF CONTENTS

6 7
Executive Summary
This is the fifth edition of the Migration Observatory annual report on immigrant integration in Europe. This year, we also focus on the labour market consequences of the COVID-19 pandemic for the immigrant population of Italy.As in previous years, in the first part we use data from the latest edition of the European Labour Force Survey (2019) to provide a concise, easily accessible and up-to-date source of reference regarding the size, characteristics, and relative economic performance of immigrants in EU countries, and their exposure to the pandemic shock based on their characteristics before the COVID-19 outbreak. In the second part, instead, we analyse data from the Italian Labour Force Survey, until the second quarter of 2020: first, we describe the main characteristics of the immigrant population in Italy; then, we analyse how the coronavirus crisis has affected the labour market outcomes of immigrants in Italy, and explore individual and geographic heterogeneities.We show that immigrants and natives tend to be employed in different types of jobs, and that their jobs are more likely to be “essential” for the response to the pandemic. At the same time, immigrants are also less likely to be able to work from home, which makes them more vulnerable to job loss and contagion. In Italy, the employment probability gap between immigrants and natives has increased as a consequence of the pandemic. The effect has been stronger for women, for those with low levels of education, and for those living in the South.The key findings are summarized below.
PART I: IMMIGRANT INTEGRATION IN 2019
IMMIGRANT POPULATION: SIZE AND CHARACTERISTICSBOTTOMLINE: More than one in ten residents of the European Union is an immigrant. This ratio increases to 12.5% in EU15 countries, where most immigrants live. The number of foreign residents in the EU has increased by more than six million units between 2015 and 2019. Still, four out of five migrants have been in the host country for five or more years. More than half of the immigrants are European. The share of tertiary educated natives and immigrants is strongly correlated both across countries and across regions.
- In 2019 the number of immigrants in the European Union was 55.5 million, about 11% ofthe total population. Most of them (50 million) live in a EU15 country, where they account for more than 12.5% of the population.
- Immigrant concentration is highly heterogeneous across countries. The share of immigrants ranges from as low as 0.1 or 0.2% in Romania and Bulgaria to as high as 22.2% in Sweden, 31% in Switzerland and above 50% in Luxembourg.
- Most immigrants have been in their current country of residence for a long time: only 20%

8 9
has emigrated within the previous five years. This number rises to more than 30% in Cyprus and Malta, and stays between 25 and 30% in Germany, Luxembourg, Ireland, Sweden and the UK.
- The majority of the foreign-born population (53%) originates from another Europeancountry. EU mobile citizens account for 37% of the foreign-born population of the EU. An additional 16% was born in a European country outside of the EU. Among the other areas of origin, Africa and the Middle East account for 19% of all immigrants, while 17% come from Asia and 11% from the Americas or Oceania.
- The gender composition is on average quite balanced, with only a slight majority of women (52%).
- About one third of immigrants have tertiary education, one third at most upper secondaryand the remaining third has at most completed lower secondary education. However, the educational levels of immigrants vary considerably across destination countries.
- Differences in immigrants’ education across member states reflect the educational level ofnatives: countries with higher shares of university-educated natives also have higher fractions of immigrants with tertiary education and vice versa. For instance, Italy is the country with the least educated immigrants (14% have tertiary education) and the second lowest (after Romania) share of natives with tertiary education (21%). Conversely, Ireland and the UK have among the highest shares of tertiary educated immigrants, respectively 55 and 52%.
- The correlation between education levels is even stronger across regions (correlationcoefficient 0.26) than across countries (correlation coefficient 0.16). Sweden, 30% in Switzerland and even more than 50% in Luxembourg.
EMPLOYMENTBOTTOMLINE: Immigrants have a lower employment probability than natives, especially in central and northern Europe. Portugal, Ireland, Italy and the UK are among the countries with the smallest immigrant-native gap in the probability of being employed. Gaps cannot be explained by differences in age-gender-education profiles.
- On average across Europe, immigrants are 7.7 percentage points less likely to be employedthan natives.
- Employment gaps are larger in central and northern European countries like Sweden (-17.1p.p.), the Netherlands (-15.5 p.p.), Germany (-13.6 p.p.) or Denmark (-13.4 p.p.) and smaller in the UK (-1.6 p.p.) and in Italy (-1.3 p.p.). In Ireland, Luxembourg and Portugal there are no differences in employment probability between immigrants and natives.
- Differences in employment probabilities cannot be explained by immigrants’ age-gender-education profiles.
- EU immigrants have the same probability of employment as natives, whereas immigrantsfrom outside the EU display a disadvantage of 12 percentage points. Such differences do not depend on age-gender education profiles: the same individual would face less difficulties in finding a job if she were an EU rather than a non-EU citizen. Institutional factors like free mobility within the EU play a central role in explaining this difference.
- The probability of employment is higher for immigrants who have spent more time in thehost country. The immigrant-native gap is nine percentage points lower (15 vs 6 p.p.) between immigrants with less than 5 years of residence and those who have been in the country for 6 years or more.
OCCUPATIONAL STATUS AND INCOMEBOTTOMLINE: Immigrants are considerably more likely than natives to be employed in low-pay and low-status occupations, even after accounting for differences in personal characteristics such as education. They are also disproportionately more likely to be in the lowest income deciles. Differences in occupation account for more than 70 percent of the immigrant-native wage gap.
- Immigrants’ occupational distribution is more polarized than that of natives. Immigrantsare as likely as natives to work in high-status and high-paying occupation. They are however much more concentrated than natives in the least qualified occupations and they are absent from the middle part of the occupational distribution (measured by the ISEI index).
- Immigrants are 50% more likely than natives to be in the bottom decile and 27% less likelythan natives to be in the top decile of the wage distribution.
- More than half of the immigrant-native difference in probability of being in the bottomincome decile can be explained by differences in distribution across occupations.
MIGRANTS’ JOBS AND COVID-19BOTTOMLINE: Immigrants are more likely than natives to work in an occupation that the European Commission deems “essential” for the response to the pandemic. They are also less likely than natives to be able to work from home, which makes them more vulnerable to the coronavirus.
- Across Europe about 39% of immigrants are employed in an occupation that is deemed “essential” for the response to the pandemic, which contrasts with 33% of natives.
- The concentration of immigrants in “key” occupations is generally higher in the majority ofWestern European countries, and peaks in countries like Italy and Sweden (+11 p.p.), and the UK (+8 p.p.).
- Immigrants’ jobs are less easily “teleworkable” than natives’ jobs in all EU countries, with theexception of Slovakia, Luxembourg and Romania.
PART I: IMMIGRATION INTEGRATION IN 2019PART I: IMMIGRATION INTEGRATION IN 2019

10 11
- Italy is the country with the highest immigrant-native gap in teleworkability. Said gap isabove the EU average also in Greece, Germany and Spain.
PART II: IMMIGRATION IN ITALY AND COVID-19
IMMIGRATION IN ITALY – SIZE AND CHARACTERISTICSBOTTOMLINE: Immigrants account for about 10% of the Italian population. This share may have slightly decreased in the first semester 2020 relative to 2019. European immigrants (from inside and outside the EU) account for 55% of all immigrants. Northern regions have a higher immigrant concentration. Immigrants are on average less educated than natives; women are more educated than men both among immigrants and natives.
- The share of immigrants in the population has increased from 8% in 2010 to 10% in 2019.The first two quarters of 2020 instead seem to indicate a slight decline in the overall immigrant stock.
- EU mobile citizens represent about 30% of the foreign-born population. Europeans (frominside and outside the European Union) jointly account for 55% of all immigrants. Of the remaining, 18% are from Africa, 16% from Asia and 11% from the Americas and Oceania.
- More than 12% of residents of Emilia Romagna (13.2%), Friuli Venezia Giulia (13.5%) andLombardy (12.2%) are foreign born. The share of immigrants in the population is above the Italian average for all Northern and Central regions (with the exception of Val d’Aosta).
- Only 13% of immigrants and 21% of natives (aged 25-64) have a tertiary education degree.- While 35% of Italians have at most completed lower secondary education, this is the case for
49% of immigrants.- Women have higher levels of education than men, and the educational distribution of
immigrant and natives is more similar for women than for men.
IMMIGRANTS IN THE ITALIAN LABOUR MARKET BEFORE THE PANDEMICBOTTOMLINE: Before COVID-19, immigrants’ employment probability was very close to Italians’. Immigrant workers are disproportionately concentrated in services, and this concentration is especially high for women. Immigrants are four times more likely than natives to be employed in relatively unskilled jobs. Immigrants’ jobs are less teleworkable than those of natives. Although the share of immigrants in key occupations for the response to the pandemic is higher than that of natives, more immigrants than natives were directly affected by the lockdown.
- In 2019, immigrants’ employment probability was 1.3 percentage points lower than natives’ (65.2% vs 66.5%).
- The distribution of immigrants and natives across industries is very different. 22% ofimmigrants are employed in “other services”, including personal care services and domestic work: only 5% of natives work in the same sector. Immigrants are almost twice as likely as natives to work in the hospitality industry and in construction (9% vs 5% in both sectors), and twice as likely to work in agriculture (6% vs 3%).
- 40% of immigrant women are employed in the services sector, which contrasts not only with7% among immigrant men, but also with about 7% among Italian women.
- Immigrant women are more likely to be employed in an elementary occupation thanimmigrant men (33% vs 27%). About 37% of immigrant women are service workers, which compares with about 21% among Italian women, and about 12% among men of all origins.
- Immigrants are more likely than natives to be employed in an occupation that cannot beeasily performed remotely.
- Immigrants are more likely than natives to be employed in a key occupation for the response to the pandemic. 42% of immigrants are key workers, against only 31% of native.
- Despite the higher proportion of key workers among migrants, the share of Italians employed in “essential” sectors, i.e. those industrial sectors that were allowed by the government to remain open during the lockdown is higher among natives than immigrants (58% vs. 50%).
- Immigrants workers are more likely than Italian workers to have a temporary contract,20% vs. 14%. This differential is not driven by differences in observable characteristics: even when immigrants are compared with natives with similar age-gender-education profiles, they still have a 4.7 percentage points higher probability of having a temporary contract.
THE EFFECT OF THE COVID-19 CRISIS ON IMMIGRANTSBOTTOMLINE: Immigrants have been more affected than natives by the COVID-19 crisis. The probability of remaining employed between the first semester 2019 and the first semester 2020 is higher for natives than for immigrants, and the gap is higher among women. A comparison of the immigrant-native differentials in employment probability before and after the coronavirus confirms that the employment gap has increased. The increase has been stronger for immigrant women, for those with low-education, and for immigrants living in Southern regions. Differences in other labour market outcomes have been only marginally affected.
- Among all workers that had a job in the first half of 2019, 95% of natives were still employedin the first semester 2020, whereas this share decreases to 91% among immigrants.
- The share of Italian men who had a job one year before the crisis and still have one during the first two quarters of 2020 is 96%, but among Italian women this share falls to 94%. For immigrants, the gender gap is even more pronounced: the job retention rate over the same
PART II: IMMIGRATION IN ITALY AND COVID-19PART II: IMMIGRATION IN ITALY AND COVID-19

12 13
period has been slightly more than 93% for men and 88.6% for women.- Workers on a temporary contract during the first semester 2019 have a 21 percentage
point lower probability of being still in employment during the first semester 2020. The effect of working under a temporary contract is the same among immigrants and natives, but immigrants are more likely to have one.
- The employment probability of natives was 66.2% in the first two quarters of 2019, anddid not significantly change in the same period of 2020. However, immigrants’ employment probability over the same period decreased from 64.7% to 62.2% during the first six months of 2020.
- The gap in employment probability of immigrant women relative to Italian women increasedfrom 8.2 percentage points in the first semester 2019 to 11.5 percentage points in the first semester 2020. Conversely, the employment probability gap for men remained stable (4 percentage points).
- The pandemic has also widened the pre-existing differential in occupational quality betweenimmigrant and native women, particularly by increasing the gap in probability of working in an elementary occupation by 2.5 percentage points.
- In the first two quarters 2019, low educated immigrants’ employment probability was12 percentage points higher than the one of natives with the same level of schooling. The differential shrank to 10 percentage points during the first semester 2020. Differential between immigrants and natives with higher levels of education were not affected.
- Immigrants’ employment probability has decreased the most relative to natives (and inabsolute terms) in Southern Italian regions, especially Sardinia, Calabria, Sicily and Campania.
- These regions are also those where immigrants are more likely to perform more elementaryoccupations.
INTRODUCTION
The defining theme of 2020 has certainly been the outbreak of the COVID-19 pandemic. After its first identification in China in December 2019, the SARS-CoV-2 has rapidly spread throughout the world, with Europe being one the continents where the virus circulated earlier. Italy, in particular, has been the first European country where COVID-19 spread, and the first country in Europe to enact severe lockdown measures to contain the transmission of the virus, in March 2020. The presence of the coronavirus has profoundly altered our way of life and changed our habits. It has also substantially impacted economic activity, provoking a world recession: the OECD estimates that the world GDP shrank by 4.2%, and that the Euro area GDP decreased by 7.5% in 2020. 1 The pandemic has also had profound impacts on migration and population movement in general. Not only did many governments impose limits to internal mobility and discouraged – or temporarily banned – non-essential international travels, for instance introducing a quarantine period for people allowed to enter. Many EU countries have also reintroduced temporary border controls at their internal borders, in accordance with Articles 25 and 28 et seq. of the Schengen Borders Code. Additionally, the sudden closure of migration and asylum offices and consular services in many countries has created a backlog in processing of applications and it has led to substantial slowdowns of both resettlement policies for refugees and repatriations. The pandemic has also induced some countries to take extraordinary migration policy measures. For instance, Italy passed a regularisation programme aimed to legalise the status of irregular foreign agricultural and domestic workers, and Portugal granted temporary citizenship rights to all migrants and asylum seekers who had residency applications underway, in order to give everyone access to health care services. One additional change to the migration landscape has been the effect that the coronavirus recession has had on the economic situation of migrant workers in host countries. Like all recessions, also the current one is having heterogeneous effects within countries, with some groups of citizens more affected than others. It is therefore likely that the labour market outcomes of immigrant and native workers have been differentially impacted by the pandemic.
This fifth edition of the Migration Observatory Report has a special emphasis on the effect of the pandemics on immigrants’ labour market integration in Europe. Like previous editions, this report is articulated in two parts. In the first part, we provide an updated overview of the characteristics of the immigrant population in Europe, and of their labour market integration vis-à-vis natives of the host country. The analysis is based on the latest available microdata from the European Labour Force Survey, released in 2020 and which refer to year 2019. The data therefore allow us to provide a picture of the immigrant population in Europe, and of their economic situation, just before the coronavirus outbreak. Although we are not able to assess the effects of the pandemic on immigrants in Europe, information on their characteristics
1 OECD Economic Outlook, December 2020.
INTRODUCTIONPART II: IMMIGRATION IN ITALY AND COVID-19

14 15
and type of jobs and sectors of employment may help assessing the impact they can play in the response to the crisis, as well as their vulnerability to the consequences of the recession.In the second part of the report, we focus instead on Italy, the first European country that had to deal with the coronavirus, and that was also the first to implement drastic lockdown measures which severely affected all of its residents. Our analysis on Italy is based on quarterly microdata from the Italian Labour Force Survey (Rilevazione sulle Forze di Lavoro), updated until the second quarter of 2020. These data therefore allow us to provide a first analysis of the short-run effects of the pandemic on immigrants’ labour market outcomes, which will highlight the stronger toll that the coronavirus shock took on the foreign-born population, and specifically on less educated immigrants and on women.The goal of this report is to provide updated and easily accessible information on the characteristics and the economic integration of immigrants in Europe. For this reason, the main text presents the key results in graphic form whenever possible, and does not report technical details. However, the extensive Table Appendices report full tables of results that underly each graph and figure reported in the text – and more, and the technical Appendices report all details about data and estimation methods. Throughout this report, we define immigrants as foreign born, except for Germany where they are defined as foreign nationals.
PART I: IMMIGRANT INTEGRATION IN 2019 - A EUROPEAN OVERVIEW
IMMIGRANT POPULATION – SIZEIn 2019 there were 55.5 million individuals in Europe living in a country other than their country of birth, which amounts to 11% of the European population, an increase of more than a million with respect to the previous year. Most of them, 50.2 million, live in a EU15 country, where the share of immigrants in the population is around 12.5%.2 There is a considerable degree of heterogeneity in the relative size of immigrant populations across countries, even within the EU15. The immigrant share is extremely low in most Eastern European countries: it is as low as 0.1 or 0.2% in Romania and Bulgaria, 1% in Poland and Slovakia, 2% in Hungary and 4% in the Czech Republic. Among EU15 countries, the share of immigrants in the population ranges instead from 5% in Finland to as high as 22% in Sweden, 31% in Switzerland and even more than 50% in Luxembourg (Figure 1).
Figure 1: Immigrants in the European Union (share of total population)
The foreign-born population in the EU has been slowly but steadily increasing in recent years (by more than 6 million units between 2015 and 2019), a relatively small increase when compared to the overall EU population, which amounted to more than 513 million in 2019. In fact, the data show that most immigrants have been in their current country of residence for
INTRODUCTION
2 EU15 countries: Austria, Belgium, Denmark, Finland, France, Germany, Greece, Ireland, Italy, Luxembourg, Netherlands, Portugal, Spain, Sweden, United Kingdom. Note that we include the UK among the EU15 countries, since it was still part of the EU in 2019.
PART I: IMMIGRANT INTEGRATION IN 2019 - A EUROPEAN OVERVIEW

16 17
quite a long time: on average, only one in five immigrants living in a European country in 2019 has emigrated within the previous five years. The aggregate figure, however, hides significant cross-country differences. Among the countries where immigrants account for at least 1% of their population, Germany stands out with almost one third (30%) of immigrants arrived in the last five years: only Cyprus and Malta have a higher share of recent immigrants (33% and 36% respectively). Ireland, Luxembourg, Sweden and the UK also host a relatively large share of recently arrived immigrants: more than one in four migrants in these countries has been there for at most five years (Figure 2).
Figure 2: Eight out of ten migrants have been in the host country for more than five yearsShare of recent immigrants in foreign population
IMMIGRANT POPULATION – CHARACTERISTICS A long standing, but often under-appreciated, feature of immigration in EU countries, is that the majority of the foreign-born population (53%) originates from another European country. Not only do EU mobile citizens make up 37% of the overall immigrant population in the European Union (including also Norway and Switzerland), but an additional 16% was born in a European country outside of the EU. Among the other areas of origin, Africa and the Middle East account for 19% of all immigrants, while 16.9% come from Asia and 11% from the Americas or Oceania (see Figure 3).
Figure 3: Most immigrants in the EU are from another European countryComposition of immigrants by area of origin
As regards gender, like in previous years women account for 52% of all immigrants. Germany and Slovenia stand out instead for their male-dominated immigrant population: in both countries, at least 53% of immigrants are men.
About one third of both immigrants and natives have received university education, on average, across all countries.3 However, while the share of highly educated immigrants is the same as that of natives, the proportion of immigrants that have at most completed lower secondary education is substantially higher than among natives: one in three immigrants vs. one in five.
PART I: IMMIGRANT INTEGRATION IN 2019 - A EUROPEAN OVERVIEW PART I: IMMIGRANT INTEGRATION IN 2019 - A EUROPEAN OVERVIEW
3 Note that here and below we focus on the age range 25-64, in order to exclude individuals who may have not yet completed their education, and those who are not in working age.

18 19
Figure 4: More educated immigrants live in countries with more educated nativesShares of immigrants and natives with tertiary education, by country
The higher educational polarisation of immigrants relative to natives is a common feature of most European countries, yet countries differ substantially in the educational level of their foreign-born population. For instance, Italy is the country with the least educated immigrants, displaying both the highest share of immigrants with no more than lower secondary education (49%) and the lowest share of immigrants with tertiary education (14%). Conversely, Ireland, the UK and Luxembourg have among the highest shares of tertiary educated immigrants, respectively 55, 52 and 54%. Interestingly, as we highlight every year, these cross-country differences mirror closely the underlying cross-country differences in the education of the native-born: countries with a more educated native population also tend to attract more highly skilled immigrants (Figure 4). Again, Italy provides a perfect example, as it not only has the lowest share of university educated immigrants among all EU countries (14%), but it also has the second lowest share of natives with tertiary education (21%), after Romania.Remarkably, the positive correlation between immigrants’ and natives’ education also holds at the sub-national level (Figure 5): within each country, it is in the regions with the highest share of tertiary educated natives that we also find the highest concentration of tertiary educated immigrants. Indeed, the correlation between the share of tertiary educated immigrants and tertiary educated natives is higher at the regional level (0.26) than at the national level (0.16).
Figure 5: In each country, regions with more educated natives host more educated migrantsShares of immigrants and natives with tertiary education, by region
LABOUR MARKET OUTCOMES - EMPLOYMENTImmigrants have on average worse labour market outcomes than natives. In terms of employment, they are 7.7 percentage points less likely than natives to have a job, the same employment probability gap as in 2018. Since the employment probability of natives is on average 76% both across the whole EU and in the EU15 countries, this means that immigrants are 10% less likely to have a job than natives. Employment gaps are larger in central and northern European countries like Sweden (-17.1 p.p.), the Netherlands (-15.5 p.p.), Germany (-13.6 p.p.) or Denmark (-13.4 p.p.) and smaller in the UK (-1.6 p.p.) and in Italy (-1.3 p.p.). Note however that Italy has one of the lowest native employment rates (66%), therefore immigrants do not have a high probability of employment in absolute terms, but only relative to Italian natives. Ireland and Luxembourg stand out, among the countries with a substantial share of immigrants in their population, for having no statistically significant difference in employment probability between immigrants and natives (see Figure 6).
PART I: IMMIGRANT INTEGRATION IN 2019 - A EUROPEAN OVERVIEW PART I: IMMIGRANT INTEGRATION IN 2019 - A EUROPEAN OVERVIEW

20 21
Figure 6: In most countries immigrants are less likely than natives to have a jobImmigrant-native differences in employment probability
So far, we have focused on differences in labour market outcomes between the average immigrant and the average native, and we have shown that immigrants tend to have a lower employment probability. This gap might originate from immigrant-specific hurdles in labour market integration such as discrimination from employers, difficulties in formal recognition of foreign qualifications, lack of fluency in the host country language. However, the gap may also – at least in principle – stem from differences in characteristics such as age structure, gender mix and educational composition between the two populations. Clearly, the two sources of employment disadvantage would call for different policy measures. Therefore, we have also computed differences in employment probability between immigrants and natives with similar age-gender-education profiles.: this comparison does not significantly affect the average gap, which is still estimated to be 7.9 percentage points on average across Europe. This result indicates that, on average across European countries, immigrants’ mix of labour market characteristics is overall similar to natives’. More importantly, it also indicates that immigrant characteristics alone cannot explain their employment disadvantage, and therefore that other factors need to be addressed in order to close the gap.
Figure 7: Conditional and unconditional differences in employment probability
However, there are also some countries where the raw difference in employment probability between immigrants and natives (unconditional gap) is significantly different from the employment probability gap once differences in gender, age and education are taken into account (conditional gap), as we show in Figure 7.The graph reports, for each country, unconditional gaps on the horizontal axis, and conditional gaps on the vertical axis. Countries below the 45 degrees line are those where the conditional disadvantage (advantage) of immigrants is larger (smaller) than their unconditional one, which indicates that immigrants have a gender-age-education profile that makes them more employable than natives. Conversely, countries above the 45 degrees line are those where immigrants have a less favourable profile than natives; therefore, conditioning out individual characteristics leads to a reduction in the employment probability differences (alternatively, an increase in the employment probability advantage). Italy stands out as the only country where the unconditional negative gap turns into a 1.5% employment advantage when immigrants are compared to natives with similar characteristics.EU immigrants tend to have considerably better employment outcomes than non-EU immigrants, and, in some countries like Hungary, Ireland, Luxembourg, Malta, Portugal, Slovak Republic or the UK, they also outperform natives. Across all European countries, EU immigrants have a probability of employment that is not different from the one of natives, whereas immigrants from outside the EU display a disadvantage of 12 percentage points
PART I: IMMIGRANT INTEGRATION IN 2019 - A EUROPEAN OVERVIEW PART I: IMMIGRANT INTEGRATION IN 2019 - A EUROPEAN OVERVIEW

22 23
(since natives’ employment probability is 75%, this means that non-EU immigrants are 16% less likely to have a job than natives). The better employment performance of EU immigrants relative to their non-EU counterparts is only partly driven by a different composition of the two groups in terms of their age, gender or education. In fact, when EU and non-EU immigrants are compared to natives with the same individual characteristics, the differences in employment probability gaps between the two groups are still substantial. The gap for EU immigrants increases to 1.8 percentage points, whereas the non-EU gap decreases slightly to 11 percentage points. The persistence of large differences in the conditional employment gap between the two groups thus suggests that the better performance of EU immigrants may be due to the more favourable institutional setting they face. For instance, recognition of foreign qualifications and access to licensed occupations is easier for EU than non-EU citizens, which clearly facilitates the labour market integration of the former relative to the latter. Additionally, EU citizens can move freely across countries and they are therefore able not only to settle in countries with higher labour demand, but also to move out of their country of current residence and move back to their country of origin or to another EU country at a lower cost, should labour demand decrease.
As expected, immigrants who have spent more time in the host country tend also to have a higher labour market integration. The average difference in employment probabilities between natives and immigrants who have been in the country for no more than five years (recent immigrants) is 15 percentage points, or 18 percentage points when we compare immigrants to natives with the same age-gender-education profile. For earlier immigrants, who have accumulated more than five years of residence in the host country, the gap instead decreases to just 6 percentage points and it is essentially unchanged even when differences in individual characteristics are taken into account. Even though these figures are based on a single cross-section of data, and therefore do not refer to the same migrants observed at two different points in time, but to different groups of migrants (with potentially distinct characteristics), they still suggest the existence of assimilation of foreign-born citizens in the host country labour market. This process may be due to immigrants acquiring country-specific skills, such as learning the host country’s language, but also to selective outmigration: that consists in less successful immigrants returning home (or migrating to a different country) after a few years spent in the host country. Note that this process is more clearly visible for non-EU immigrants. Their employment disadvantage decreases sizably with time spent in the destination country, from 25 percentage points among the recent ones, to 9 percentage points for those who have been longer in the host country. On the contrary, recent EU migrants display a 1.3 higher employment probability than natives, but this employment advantage is no longer there among earlier EU migrants, who have a slightly lower employment probability than natives. Importantly, however, this apparently counterintuitive pattern is driven by differences in characteristics between earlier and recent EU migrants, with the former group
having characteristics that make them less employable than the latter. In fact, if we compute the employment gap with respect to natives for earlier and recent European migrants with the same age-gender-education profile, the gap displays the usual pattern, decreasing from 2.5 percentage points for the former group to 1.6 for the latter.
OCCUPATIONAL STATUSIt is fairly obvious that employment probability is only a crude measure of labour market integration. Indeed, the type of jobs that employed individuals perform is another crucial dimension to analyse. Jobs differ in terms of earnings potential, occupational hazard, prestige, and social status they confer to workers. We measure occupational status with the Socio-Economic Index of Occupational Status (ISEI), a continuous index which scores occupations in relation to their average education and income levels, thus capturing the attributes of occupations that convert education into income. Higher values of the index correspond to occupations with a higher socio-economic status.4 We have standardised the measure so that it has mean zero and standard deviation one in each country: therefore, values above zero indicate occupations that are more prestigious, and more remunerative, than the national average, and vice versa for values below zero.
Figure 8: Immigrants’ occupational distribution is more polarised than natives’Immigrant-native difference in distribution along the occupational status scale
4 See Ganzeboom, Ganzeboom, Harry B.G.; Treiman, Donald J. (2003). “Three Internationally Standardised Measures for Comparative Rese-arch on Occupational Status.” in Jürgen H.P. Hoffmeyer-Zlotnik & Christof Wolf (Eds.), Advances in Cross-National Comparison. A European Working Book for Demographic and Socio-Economic Variables. New York: Kluwer Academic Press. Pp. 159-193.
PART I: IMMIGRANT INTEGRATION IN 2019 - A EUROPEAN OVERVIEW PART I: IMMIGRANT INTEGRATION IN 2019 - A EUROPEAN OVERVIEW

24 25
The blue line in Figure 8 reports the difference between immigrants and natives in their concentration at each point of the ISEI scale: if immigrants and natives within each country had the same distribution of occupational status, then the graph would show a straight line at 0. Conversely, the line is above 0 in those points of the occupational status scale where immigrants are relatively more concentrated than natives, and below zero where they are relatively less concentrated. The figure shows clearly that, on average across all EU countries, immigrants are considerably more likely than natives to be employed in low-pay and low-status occupations, while on the contrary they are less present than natives in occupations in the middle of the prestige scale. As a consequence of the higher polarisation in occupational distribution, and especially of their higher concentration at the bottom of the scale, immigrants have on average a lower occupational status than natives: across European countries, the mean ISEI score for immigrants is 36% of a standard deviation lower than that of natives. Importantly, there are no Western European countries where immigrants have a higher average occupational status than natives, while the occupational gap is highest in Italy, 76% of a standard deviation. The patterns of occupational status distribution for EU and non-EU migrants are similar, although EU migrants are slightly more similar to natives, with a lower relative concentration in the bottom part of the distribution than non-EU migrants, and a higher concentration in the middle. The mean gap in occupational prestige of EU migrants relative to natives is slightly less than half that of non-EU migrants (28 and 43% of a standard deviation respectively). Immigrants’ age-gender-education profiles can explain only about 10% of the differences in occupational prestige for EU citizens, and a bit more than one quarter of the gap for non-EU migrants.
INCOMEAs the differences in the distribution of occupational status suggest, immigrants tend to be disproportionately more concentrated than natives in the bottom part of the income distribution. Figure 9 shows the percentage of immigrants (blue dashed line) and natives (red solid line) in each decile of the national income distribution, pooling together all European countries.5
Figure 9: Immigrants are more likely to be at the bottom of the income distributionImmigrant and native distribution along national income deciles
The two lines have clearly opposite trends: the native line is upward sloping, indicating their relatively higher concentration toward the top of the income distribution.6 In contrast, the corresponding immigrant line is decidedly downward sloping, indicating a decreasing share of migrants as we move toward the higher income deciles, except for a slightly higher concentration in the top decile relative to the ninth.On average, an immigrant has a 4.5 percentage points higher probability of being in the bottom 10% of a country’s income distribution (50% more likely than natives), and a 3 percentage points lower probability of being in the top 10% than a native (27% less likely). Among the main recipient countries, Greece and Italy stand out as those where immigrants have the highest differential probability of being at the bottom of the income distribution,
5 Income information is not available for Austria, Czech Republic, Finland, Iceland, Norway, Slovenia, Spain and Sweden. 6 Note that the native line is not flat because we are focusing on the 25-64 age range only.
PART I: IMMIGRANT INTEGRATION IN 2019 - A EUROPEAN OVERVIEW PART I: IMMIGRANT INTEGRATION IN 2019 - A EUROPEAN OVERVIEW

26 27
with respectively a 10 and 8.4 percentage points higher probability of being in the bottom decile than natives, and the highest gap in the probability of being in the top decile.
Figure 10: Job characteristics explain more than half of immigrant income disadvantageImmigrant-native difference in probability of being in bottom decile: overall and after accounting for individual characteristics and occupational clustering.
Importantly, differences in individual characteristics between immigrants and natives are unable to explain the income disadvantage of immigrants, and especially their over-representation at the bottom of the income distribution (Figure 10). The portion of the difference in probability of having a wage in the bottom decile explained by age, gender and education profiles amounts to 0.4 percentage points, or 10% of the total difference, whereas differences in occupation account for a much larger share of the difference, namely 72.5%. Different regional locations, as shown by the decomposition of the effect shown in Figure 10, play an opposite role. While immigrants and natives are more similar in terms of probability of having a low income when they are compared within the same age-gender-education group or within the same occupation, their difference increases when they are compared within the same region. This is in line with the findings on the differences on occupational quality presented above and depicts a scenario in which immigrants are more concentrated in regions where natives have better labour market outcomes, namely, in this specific case, lower probability of having a particularly low wage.
The main reason why immigrants are disproportionately concentrated in the bottom part of the income distribution is instead the type of jobs they do: if we compare immigrants and natives that have not only the same age-gender-education profiles, but perform the same type of jobs and have similar job characteristics (full/part time employment), the difference in probability of being in the bottom decile shrinks to 0.9 percentage points, and to 0.7 for the probability of being at the top of the distribution. Thus, it is the clustering of immigrants in low-paid occupations, not the differences in the level of education, that explains more than half of the immigrant-native difference in both the probability of being in the bottom and in the top income decile. The concentration of immigrants at the bottom of the income distribution is largely a consequence of immigrants’ education not being rewarded as much as natives’. This is often the result of the misallocation of immigrant skills between occupations, with formally highly educated immigrants taking up unskilled jobs, like for instance foreign graduates working as deliverymen or as cleaners or caretakers.In countries where immigrants have lower income gaps, they also tend to perform better in terms of employment probability. This is shown in Figure 11 where we display in the top graph the (negative) correlation between the differentials in the probability of being at the bottom of the income distribution and the gap in employment probability. Coherently, the bottom graph shows that a higher differential in the probability of being in the top income decile is associated with a larger employment probability gap. These graphs therefore indicate that in general earnings and employment assimilation are associated, and not alternative.
Figure 11: Income and employment gaps are correlatedImmigrant-native differences in employment and in concentration in bottom income decile
PART I: IMMIGRANT INTEGRATION IN 2019 - A EUROPEAN OVERVIEW PART I: IMMIGRANT INTEGRATION IN 2019 - A EUROPEAN OVERVIEW

28 29
Immigrant-native differences in employment and in concentration in top income decile
IMMIGRANTS IN THE EU LABOUR MARKET IN THE ERA OF COVID-19We have seen before that immigrants and natives tend to be employed in extremely different jobs. In particular, that immigrants are more likely to be employed in low-skilled and low-paid occupations, compared to natives. Such differences imply also that the COVID-19 shock will have affected differently migrants and natives, and that the two groups may play different roles in the economic response to the pandemic.
MIGRANTS’ OCCUPATIONS: ESSENTIALITYThe European Commission has identified a number of critical occupations that are essential for the European response to the pandemic, such as health professionals and care workers, but also IT professionals, technicians, and transport workers. For immigrant workers in these occupations, the Commission has urged Member States to establish specific burden-free and fast procedures for border crossings also during these months of travel restrictions. This is indeed a well taken recommendation: in fact, while across Europe about 33% of natives are employed in an occupation that is deemed “essential” for the response to the pandemic, this share is 5 percentage points higher among migrants, as we show in Figure 12. The concentration of foreign-born workers in key occupations is even higher in countries like Italy and Sweden (+11 p.p.) and the UK (+8 p.p.). More broadly, although with a few exceptions, Western European countries seem to have a disproportionate concentration of immigrant workers in essential jobs. Importantly, such a higher concentration is not explained by differences in individual characteristics such as education, age,
and gender: migrants are more likely to work in essential occupations even relative to natives with a similar profile. While all migrants are more likely than natives to work in an essential occupation, this difference is higher among non-EU migrants than among EU mobile citizens (6 and 4 percentage points, respectively). For both groups, recent immigrants – who have been in the host country for no more than five years – are more likely to be essential workers relative to their fellow migrants who have migrated earlier. In sum, this evidence shows that some of the groups of workers who typically face more difficulties in the labour markets, such as non-EU recent migrants – are being called to play a key role in the fight against the COVID-19 pandemic.
Figure 12: Migrants are employed in key occupationsImmigrant-native differences in probability of being employed in an essential occupation
PART I: IMMIGRANT INTEGRATION IN 2019 - A EUROPEAN OVERVIEW PART I: IMMIGRANT INTEGRATION IN 2019 - A EUROPEAN OVERVIEW

30 31
MIGRANTS’ OCCUPATIONS: TELEWORKABILITYWorking during a pandemic may be risky, as certain occupation can increase the risk of contagion, due to the interaction with co-workers and clients, and because of the proximity to a high number of strangers on the daily commute to and from work. Indeed, over the last months, teleworking has dramatically increased, and many countries have mandated remote working whenever possible. However, while working from home is a safe and relatively easy solution to implement for some occupations, it is not feasible for many jobs. Workers employed in occupations that can be more easily performed from home, like many office jobs, will therefore face a lower risk of contagion relative to workers whose physical presence is necessary for their job, such as most workers in manufacturing and care.We can measure the “relative ease of teleworkability” for each occupation with an index that takes higher values the more teleworkable an occupation is. We have standardised the index such that, in each country, it has value of 0 for occupations with a mean value of the teleworkability index.In almost all EU countries, immigrants are employed in occupations that are significantly less teleworkable than those of natives (Figure 13).
Figure 13: Immigrants’ jobs are less teleworkable than those of nativesImmigrant-native differences in teleworkability of occupation (standardised values)
Italy is the country with the highest immigrant-native gap in teleworkability. Also Greece, Germany and Spain are characterised by immigrants’ jobs that are considerably harder to be carried out from home relative to those of natives: in fact, the size of their gap is above the EU average. Differences in age, gender and education between immigrants and natives can explain only about one fifth of this gap.The jobs of EU immigrants are on average slightly more similar to natives with regard to the ease of working from home, relative to their non-EU counterparts. Interestingly, the immigrant native gap in teleworkability is more than 70% higher among earlier than among recent immigrants. This imbalance between different immigrant cohorts is present both among EU and non-EU immigrants, and is especially pronounced among the latter.The very nature of immigrant jobs makes it therefore more difficult for them to work from home, even abstracting from issues like the availability of a home office, that may not be equally frequent among natives and immigrants. Thus, this causes the immigrant population to be more vulnerable to the virus, as they have to leave their homes more frequently than natives to work. At the same time, immigrants’ jobs play a key role in the response to the pandemic, which makes the vulnerability of the foreign population problematic not only for their own safety, but also for the resiliency of the host country economy and society.
PART I: IMMIGRANT INTEGRATION IN 2019 - A EUROPEAN OVERVIEW PART I: IMMIGRANT INTEGRATION IN 2019 - A EUROPEAN OVERVIEW

32 33
PART II: IMMIGRATION IN ITALY AND COVID-19
The first part of this report has offered an overview of the labour market integration of immigrants across Europe, which has highlighted both the common traits of immigration across EU countries and their differences. We have also shown that the characteristics of the jobs where immigrants are typically employed make them both crucial for the European response to the coronavirus pandemic, but also potentially more exposed to its consequences. However, the harmonised cross-country data we use in the first part (which are the most recently available as we write) refer to the year 2019, therefore they allow us to take a snapshot of the labour market situation of immigrants before the coronavirus outbreak, but not (yet) of the consequences the pandemic has had, and is still having, for immigrants.
In this second part, we focus on Italy. There are three reasons to narrow down the geographic area of our analysis. First, Italy is one of the countries that were most exposed to the recent waves of refugee and irregular migration, and one where immigration has played in the last years a central role in the policy discourse. Second, Italy has been the first European country to experience the COVID-19 epidemic, the first country to impose a total lockdown in Europe, and one of the countries where the lockdown measures have been most stringent. Third, we are able to base our analysis for Italy on microdata from the Italian Labour Force Survey that span the period until June 2020, which makes it possible to draw a first balance of the effect of the crisis on immigrants’ labour market outcomes. The critical role that immigrants play for the vitality of some sectors of the Italian economy has been explicitly – although somehow only temporarily – acknowledged during the past year in the Italian political discourse. In fact, the Italian government has approved last May a regularization programme targeted to irregular immigrant workers in agriculture and in the domestic care sector. Both sectors are heavily reliant on immigrant labour, and this fact has been made all more evident by the pandemic. Yet, the Italian regularization bill has failed to acknowledge that the contribution of immigrant workers to the Italian economy extends beyond these sectors. The severe economic slowdown induced by the pandemic has hit all sectors of the economy, but may have imposed a higher toll on migrant workers, who have, on average, a less stable employment relationship. Moreover, even though job loss is a traumatic event for all workers, immigrant workers’ residence permits are generally tied to their job. Therefore, for immigrants, unemployment can mean not only a temporary income loss, but also the loss of legal status; this may lead to profound and long-lasting consequences for their life in the host country.
IMMIGRATION IN ITALY – SIZE AND CHARACTERISTICSThe immigrant population in Italy has slowly, but quite steadily, increased over the last decade. In 2010, immigrants accounted for less than 8% of the total population, and this share has then increased until 10% in 2019 (Figure 14). Since then, however, the growth has halted, and the first two quarters of 2020 seem to indicate a slight decline in the overall immigrant stock, which could be driven by the pandemic-induced recession.
Figure 14: Immigrant population in Italy is stable, or slightly decreasingShare of immigrants in total population, Q1 2010 - Q2 2020
EU mobile citizens represent about 30% of the foreign-born population, and their proportion has remained relatively stable over time. Yet, Europeans (from inside and outside the European Union) jointly account for 55% of all immigrants, a figure that is very close to the EU average discussed in Figure 3 in Part I. Of the remaining, 18% are from Africa, 16% from Asia and 11% from the Americas and Oceania (Figure 15).
PART II: IMMIGRATION IN ITALY AND COVID-19 PART II: IMMIGRATION IN ITALY AND COVID-19

34 35
Figure 15: Most immigrants in Italy are European (within or outside the EU)Composition of immigrants living in Italy by area of origin
Immigrants are not evenly distributed across Italian regions. On the contrary, their geographic pattern clearly indicates that they tend to settle in the most economically active areas of the country, where labour demand is higher. In fact, more than 12% of residents of Emilia Romagna, Lombardy and Friuli Venezia Giulia are foreign born, and the share is above 10% (i.e. above the Italian average) for all Northern and Central regions (with the exception only of Val d’Aosta), and as low as 4% in Sardinia, or 5% in Apulia. Lombardy is also the only region where less than half of the foreign-born residents are European.The geographic differences in immigrant concentration are particularly telling because Northern regions, Lombardy and Emilia Romagna in particular, have been the most affected by the first wave of COVID-19 pandemic in March. From a purely geographic perspective therefore, immigrants have had a higher likelihood than natives to be exposed to the risk of contagion.
Figure 16: Immigrant presence is higher in Northern and Central ItalyShare of immigrants in total population by region, Q1-Q2 2020
As already noted in PART I (Figure 4), immigrants in Italy are characterised by levels of education that are not only lower than those of immigrants in other EU countries, but also lower than those of Italian natives (Figure 17).7 About one in five Italians in the age group 25-64 have a high level of education (defined as having completed tertiary education). Yet, the share of highly educated immigrants in Italy is almost half of that: only 13% of foreigners have a tertiary education degree. Likewise, while slightly more than one in three Italians has a low level of education (defined as having completed no more than lower secondary education), this is the case for one in two immigrants.
PART II: IMMIGRATION IN ITALY AND COVID-19 PART II: IMMIGRATION IN ITALY AND COVID-19
7 In order to exclude potential students from the analysis, these figures as well as all labour market figures refer to the population age 25-64. The three educational categories are de fined as follows: Low – at most lower secondary education; Intermediate – at most upper secondary education; High – tertiary education.

36 37
Figure 17: Immigrants are on average less educated than nativesDistribution of immigrants and natives by level of education, Q1-Q2 2020
In terms of gender differences, women tend to have higher levels of education than men (Figure 18). This is true both for natives and for Italians. The share of tertiary educated Italian women is 24%, whereas among men this share decreases to 18%. Likewise, while 16% of immigrant women have tertiary education, only 9% of all immigrant men are tertiary educated. At the bottom of the educational distribution, instead, we find 33% of native women and 37% of native men with no more than lower secondary education, but 45% of immigrant women and 55% of immigrant men belong in this category. Overall, the educational distribution of immigrant and natives is more similar for women than for men.
Figure 18: Immigrant and Italian women are more educated than menDistribution of immigrants and natives by sex and education, Q1-Q2 2020
PART II: IMMIGRATION IN ITALY AND COVID-19 PART II: IMMIGRATION IN ITALY AND COVID-19
WOMEN MEN

38 39
PART II: IMMIGRATION IN ITALY AND COVID-19 PART II: IMMIGRATION IN ITALY AND COVID-19
IMMIGRANTS IN THE ITALIAN LABOUR MARKET BEFORE THE PANDEMICIn 2019, the year before the coronavirus crisis, immigrants’ employment probability was 1.3 percentage points lower than natives’ (65.2% vs 66.5%)Additionally, reflecting also the underlying differences in education and age structure between the two populations, immigrants and natives were employed in different sectors, as we show in Figure 19.
Figure 19: Immigrants are highly concentrated in the service sector…Sectoral Distribution of Immigrant and Native Workers, 2019
While manufacturing accounts for about 20% of both immigrants and natives’ employment, the former are almost twice more likely than the latter to work in the hospitality sector (which includes hotels and restaurants, about 9% vs 5%) and construction (9% vs 5%). Moreover, they are twice as likely as natives to work in agriculture (6% vs 3%), and more than four times as likely as natives to be employed in “other services”, such as personal care services and domestic work (22% vs 5%). Conversely, natives are relatively more concentrated in the trade sector, in social and health care services, and in the public administration. The over-representation of natives in the latter two is due also to considerable barriers in accessing
public sector jobs for non-Italian citizens.There are important gender differences in immigrant distribution across sectors, that go over and beyond the gender differences among Italians (Figure 20).
Figure 20: …and the concentration in services is way higher among immigrant womenSectoral Distribution of Immigrant and Native Workers by gender, 2019
Immigrant women are disproportionately concentrated in the services sector: about 40% of immigrant women are employed there, which contrasts not only with 7% among immigrant men, but also with about 7% among Italian women. On the contrary, the distribution of immigrant men across sectors is more similar to Italians, although immigrant men are also over-represented in agriculture, construction, and services, compared to native men.
The differences in the type of occupations performed by migrants and natives are even more striking (Figure 21). Immigrants are way more likely than natives to be employed in relatively unskilled jobs. For instance, 30% of immigrants are employed in elementary occupations, which compares to less than 8% among natives. Conversely, 20% of natives are employed as technicians and 18% work as professionals, but the corresponding shares are only 7% and 5% among immigrants.

40 41
PART II: IMMIGRATION IN ITALY AND COVID-19 PART II: IMMIGRATION IN ITALY AND COVID-19
Figure 21: Immigrants are disproportionately more likely to be employed in low-skill jobs - Occupational Distribution of Immigrant and Native Workers, 2019
There are important gender differences in immigrant occupational distribution too. Immigrant women are more likely to be employed in an elementary occupation than immigrant men (33% vs 27%), and their concentration is especially high among service workers. About 37% of immigrant women are service workers, which compares with about 21% among Italian women, and about 12% among men of all origins.
Figure 22: Immigrant women are more concentrated in elementary and services occupations - Occupational Distribution of Immigrant and Native Workers by gender, 2019
Given the striking differences in the occupational distribution of immigrants and natives, it is not surprising that they may be differently affected by the coronavirus shock. One crucial dimension that differentiates workers during the pandemic is the extent to which their jobs can be performed remotely, or whether it requires physical presence in their workplace. We can measure the extent to which occupations are more or less easily “teleworkable” through an index that takes higher values the more teleworkable a job is, and which we have normalised so that it has mean 0.In Figure 23 we report the distribution of immigrants (red dashed line) and natives (blue solid line) along the standardised teleworkability index. Immigrants are more likely than natives to be employed in an occupation that cannot be easily performed remotely (the red dashed line is above the blue solid line for values of the index up to about five, and below for values above that threshold). The lower teleworkability of immigrants’ jobs implies that either immigrants keep their jobs and are therefore more exposed to the risk of contagion, or that their jobs disappear, when the activities cannot be performed during a pandemic.
WOMEN MEN

42 43
PART II: IMMIGRATION IN ITALY AND COVID-19 PART II: IMMIGRATION IN ITALY AND COVID-19
Figure 23: Migrants’ jobs are less teleworkable than natives’Distribution of Immigrant and Native workers by teleworkability
Gender differences in teleworkability are remarkable, and especially so among Italians. The distribution of Italian women along the teleworkability index is quite uniform (flat line), whereas the men’s distribution is more bell-shaped. Therefore, while the likelihood of having a highly teleworkable job at the right end of the teleworkability distribution is similar for both native men and women, Italian men are more likely than Italian women to be in the middle of the distribution, and less likely to be at the bottom. Among immigrants, instead, women are less likely than men to be able to work remotely: they are disproportionately concentrated in the middle part of the teleworkability distribution, and more likely than natives to fall at the very bottom. Overall, the differences in teleworkability are more pronounced between native and immigrant women than among native and immigrant men.
Figure 24: Immigrant-native differences in teleworkability are larger among womenTeleworkability distribution of immigrant and native workers by gender, 2019
In the first part of this report, we have noted how – at the EU level – immigrants are more likely than natives to be employed in an occupation that is deemed “essential” for the fight against the pandemics by the European Commission. Italy is one of the EU countries where the differential between immigrants and natives in the probability of working in an essential occupation is higher (Figure 12). In fact, 42% of immigrants are employed in an essential occupation, against only 31% of natives (Figure 25).Given the essential role that immigrants could potentially play in the efforts to contrast the pandemics, it is somehow surprising that immigrants were less likely than natives to work in one of the sectors that the Italian government identified as “essential” and that therefore were allowed to continue operating during the lockdown, which was deliberated last March, and that lasted until the 18th of May 2020: the two rightmost bars show that while 58% of Italian natives were employed in such sectors, the corresponding share was 50% among immigrants. These data therefore indicate that immigrants may have been more affected by the strict lockdown than natives.
WOMEN MEN

44 45
PART II: IMMIGRATION IN ITALY AND COVID-19 PART II: IMMIGRATION IN ITALY AND COVID-19
Figure 25: Immigrants’ jobs are key in fighting the pandemics, but more likely to be affected by the lockdownShare of Essential Workers among immigrants and natives, and share of immigrants and natives employed in sectors not affected by the 2020 lockdown.
Additionally, immigrants are significantly more likely than natives to have a temporary contract: while 14% of natives in 2019 had a temporary contract, the same share was 20% among immigrants, a 6 p.p. difference which amounts to a 54% higher probability. Such a differential is not driven by specific characteristics of the foreign-born population: the probability of having a temporary job is 4.7 percentage points higher among immigrants even when they are compared with natives that have the same age-gender and education profile.
THE EFFECT OF THE COVID-19 CRISIS ON IMMIGRANTSThe data in the previous section suggest that immigrants may have been more exposed than natives to the coronavirus-induced crisis that has unfolded during 2020. In fact, the data indicate that, among all workers that had a job in the first half of 2019, 95% of natives were still in employment one year later, whereas this share decreases to 91% among immigrants. EU migrants do worse than those from the rest of the world, as they are less likely than those from outside the EU (90.5% vs 91.5%) to be still employed. Women are more likely than men to have fallen out of employment between the first half of 2019 and the same period in 2020: among natives, the share of men who had a job one year before the crisis, and still have one during the first two quarters of 2020 is 96%, but among women this share falls to 94%. For immigrants, the gender gap is even more pronounced: slightly more than 93% of foreign-born men and 88.6% of foreign-born women who had a job in the first semester of 2019 still have one in the first semester of 2020. As expected, one key factor affecting the probability job retemtion between January and June 2020, for those who had one the previous year, is the type of contract. The employment probability in the midst of the coronavirus crisis is a striking 21 percentage points lower for workers who had a temporary contract one year earlier, relative to those who had a permanent position. Interestingly, the effect of temporary contracts is the same for both natives and immigrants – although the latter are significantly more likely than natives to have a short-term job. Likewise, workers that in 2019 were employed in sectors not directly affected by the lockdown of Spring 2020 have a 2.4 percentage points higher probability of being in employment one year later: the effect is the same for both immigrants and natives; however, natives are more likely to be employed in one such sector.Obviously, these data provide only a partial picture of the heterogeneous consequences of the COVID-19 shock on the labour market outcomes for immigrants and natives. The picture is partial for at least two reasons. First, the employment probability of a population at any given point in time depends not only on how many workers manage to keep the job they already have, but also on how many unemployed workers find a new job – and the data presented above omit this second channel which may be relevant. Additionally, it could be the case that the share of immigrants that manage to retain their job over a period of one year is in general lower than among natives, and that the differential we observe between immigrants and natives in the probability of being still in employment between the first half of 2019 and the same period of 2020 has nothing to do with the COVID-19 shock, but is instead driven by other factors that appear every year.To address both type of concerns, we compare the immigrant-native differential in employment probability in the first two quarters of 2019 with the differential in the same two quarters of 2020, in what is called a “difference-in differences” setting.
46 47
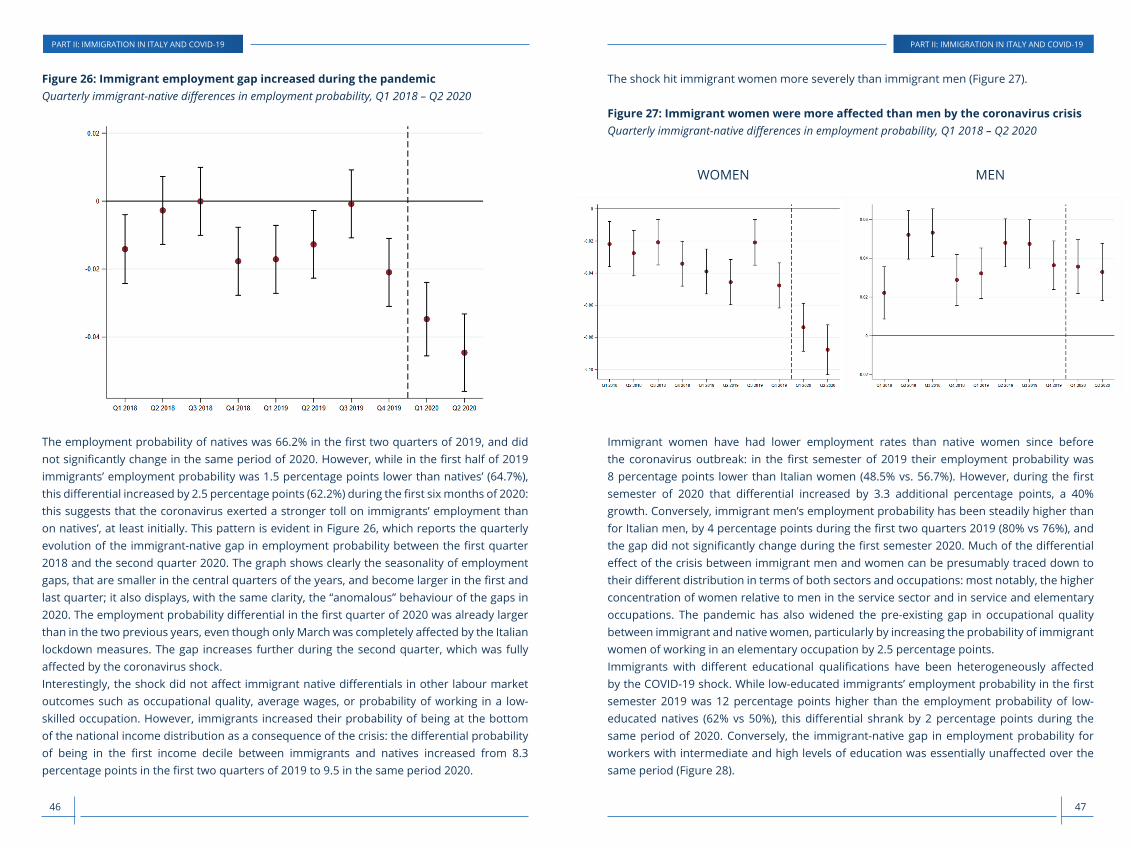
Figure 26: Immigrant employment gap increased during the pandemicQuarterly immigrant-native differences in employment probability, Q1 2018 – Q2 2020
The employment probability of natives was 66.2% in the first two quarters of 2019, and did not significantly change in the same period of 2020. However, while in the first half of 2019 immigrants’ employment probability was 1.5 percentage points lower than natives’ (64.7%), this differential increased by 2.5 percentage points (62.2%) during the first six months of 2020: this suggests that the coronavirus exerted a stronger toll on immigrants’ employment than on natives’, at least initially. This pattern is evident in Figure 26, which reports the quarterly evolution of the immigrant-native gap in employment probability between the first quarter 2018 and the second quarter 2020. The graph shows clearly the seasonality of employment gaps, that are smaller in the central quarters of the years, and become larger in the first and last quarter; it also displays, with the same clarity, the “anomalous” behaviour of the gaps in 2020. The employment probability differential in the first quarter of 2020 was already larger than in the two previous years, even though only March was completely affected by the Italian lockdown measures. The gap increases further during the second quarter, which was fully affected by the coronavirus shock.Interestingly, the shock did not affect immigrant native differentials in other labour market outcomes such as occupational quality, average wages, or probability of working in a low-skilled occupation. However, immigrants increased their probability of being at the bottom of the national income distribution as a consequence of the crisis: the differential probability of being in the first income decile between immigrants and natives increased from 8.3 percentage points in the first two quarters of 2019 to 9.5 in the same period 2020.
The shock hit immigrant women more severely than immigrant men (Figure 27).
Figure 27: Immigrant women were more affected than men by the coronavirus crisisQuarterly immigrant-native differences in employment probability, Q1 2018 – Q2 2020
Immigrant women have had lower employment rates than native women since before the coronavirus outbreak: in the first semester of 2019 their employment probability was 8 percentage points lower than Italian women (48.5% vs. 56.7%). However, during the first semester of 2020 that differential increased by 3.3 additional percentage points, a 40% growth. Conversely, immigrant men’s employment probability has been steadily higher than for Italian men, by 4 percentage points during the first two quarters 2019 (80% vs 76%), and the gap did not significantly change during the first semester 2020. Much of the differential effect of the crisis between immigrant men and women can be presumably traced down to their different distribution in terms of both sectors and occupations: most notably, the higher concentration of women relative to men in the service sector and in service and elementary occupations. The pandemic has also widened the pre-existing gap in occupational quality between immigrant and native women, particularly by increasing the probability of immigrant women of working in an elementary occupation by 2.5 percentage points.Immigrants with different educational qualifications have been heterogeneously affected by the COVID-19 shock. While low-educated immigrants’ employment probability in the first semester 2019 was 12 percentage points higher than the employment probability of low-educated natives (62% vs 50%), this differential shrank by 2 percentage points during the same period of 2020. Conversely, the immigrant-native gap in employment probability for workers with intermediate and high levels of education was essentially unaffected over the same period (Figure 28).
PART II: IMMIGRATION IN ITALY AND COVID-19 PART II: IMMIGRATION IN ITALY AND COVID-19
WOMEN MEN

48 49
Figure 28: Low-educated immigrants have been more affected by the crisisQuarterly immigrant-native differences in employment probability by education, Q12018 – Q22020
REGIONAL HETEROGENEITY OF COVID-19 EFFECTSThe geographic distribution of immigrants is different from natives, as immigrants are especially concentrated in Northern regions, which have been more severely affected by the first wave of COVID-19. Therefore, it may be interesting to explore whether the effects of the coronavirus shock have been heterogeneous across regions, and how. This analysis is necessarily tentative, since the sample size at the regional level is quite small, and estimates tend to be imprecise; hence, all results have to be interpreted with some caution.The effect of the pandemic on the regional differential in employment is indeed different across regions (Figure 29).
Figure 29: Immigrants’ employment was most affected in Southern regionsPandemic-Induced Differential in Employment Probability by region, Q1& Q2 2019 –2020
However, the regions where immigrants’ employment probability has decreased the most relative to natives (and in absolute terms) are those in the South, especially Sardinia, Calabria, Sicily and Campania. This is slightly surprising: in fact, these regions only host a relatively small number of immigrants, and they also were only marginally affected by the first coronavirus wave. Lombardy is the Northern region where immigrants’ employment probability suffered the most because of the virus, although Trentino and Friuli were very close. Surprisingly, immigrants in Emilia Romagna, the region with the second highest share of foreign-born residents after Friuli, and one of the most affected by COVID-19, have not been affected by the crisis significantly more than natives.
PART II: IMMIGRATION IN ITALY AND COVID-19 PART II: IMMIGRATION IN ITALY AND COVID-19

50 51
Figure 30: Immigrants’ employment loss is larger in regions where they perform more elementary occupationsPandemic-induced differential in employment probability vs, share of immigrants employed in elementary occupations by region, Q1 and Q2 2019 – Q1 and Q2 2020
What are the factors behind such regional heterogeneity? Figure 30, which plots the pandemic-induced change differential in employment probability between immigrants and natives and the share of immigrant workers employed in unskilled and low pay occupation in 2019, suggests a possible explanation. In fact, the figure shows the existence of a clear negative correlation between the immigrant employment loss due to the pandemic and the proportion of immigrant employed in elementary occupation. Therefore, it looks like immigrants have suffered the most in regions where they were in the weakest segments of the labour market, whereas their employment rate has not worsened much, at least relative to that of natives, in regions where they were predominantly performing more high-skilled occupations.
CONCLUSIONSThe sudden and unexpected outbreak of COVID-19 has caused a severe economic recession, and has exposed the many vulnerabilities of our societies. It has also revealed how fragile many workers’ situation was. For instance, workers in the restaurant industry have found themselves, almost overnight, without a job. The same has happened to workers in the live entertainment industry, as well as in many other services. At the same time, we have discovered the key role of some occupations for the fight against the coronavirus: health workers, but also cleaners, transport workers, and IT technicians have become essential to cope with the consequences of the spread of the epidemic.Immigrants in particular have found themselves in an uncomfortable position. For a start, the shutdown of many public offices and consular services has severely delayed processing of visa applications and asylum claims, and effectively stopped resettlement programs. Additionally, travel restrictions have made international movements incredibly more complicated than a few months ago. Migrants who were already in their host countries at the outbreak of the coronavirus have, on the one hand, very often found out that they were badly needed for a proper response to the health and economic crisis – as we have shown in this report. On the other hand, we have also highlighted that, throughout Europe, immigrants were particularly exposed to the pandemic due to their jobs characteristics, their sectors of employment, and the type of employment contracts they hold. All these factors, which to different extents are common to most European countries, imply that the pandemic may have had harsher consequences on migrants’ economic prospects than on natives’. Indeed, our analysis on Italy has demonstrated that, at least in the short run, immigrants have paid a higher price than natives in terms of employment loss as a consequence of COVID-19. Over the time horizon we consider (until June 2020, i.e. four months into the pandemic), there do not seem to have been significant differential effects on other labour market outcomes such as earnings, or job quality. The crisis has hit harder especially the most vulnerable segments of the foreign-born population: women, those with low levels of education, and those who were employed in elementary, unskilled occupations. In other words, the pandemic has worsened the labour market status especially of those immigrants who were already more likely to be struggling to keep their job, or to have one.Obviously, our results provide a picture only of the short run consequences of COVID-19. Future data will allow a fuller assessment of the effects of this large and unexpected shock on ethnic inequalities and on immigrants’ living conditions. It is possible that, in the medium run, other labour market dimensions such as earnings or occupational prestige will be affected. At the same time, it is possible, even likely, that while the crisis has hit women and low-skilled workers first, immigrant men and higher skilled workers will also be affected as the recession continues. Furthermore, while initially the differentials with respect to natives have widened, they could also decrease in the future, if after hitting immigrants first, the crisis will also display all its consequences on natives. What is certain, however, is that migrants’ vulnerability is, in general, higher than natives’: hence, the consequences of employment loss for migrants will likely be more dramatic than
PART II: IMMIGRATION IN ITALY AND COVID-19 PART II: IMMIGRATION IN ITALY AND COVID-19

52 53
Tables Appendix – EuropeTable A1: Stock of immigrants in the European Union, overall and recent arrivals.
The table reports, for each country, the size of the immigrant population, expressed in thousands as well as a share of the total population. It also reports the size of the population of recent immigrants, defined as immigrants who have been in the country for at most five years. The two bottom rows report the mean values for the EU15 countries as well as for all countries. Immigrants are defined as foreign-born, except for Germany where they are defined as foreign nationals. Source: our elaboration on EU LFS data 2019.
AustriaBelgiumBulgariaCroatiaCyprusCzech RepublicDenmarkEstoniaFinlandFranceGermanyGreeceHungaryIcelandIrelandItalyLatviaLithuaniaLuxembourgMaltaNetherlandsNorwayPolandPortugalRomaniaSlovak RepublicSloveniaSpainSwedenSwitzerlandUnited Kingdom
1,6331,920
17395178374545169266
7,69810,127
655218
25926
5,979214152260
451,873
779289799
2553
1956,2611,6612,2279,575
Thousand
18.817.0
0.29.7
20.93.59.4
12.84.8
11.712.4
6.22.39.8
18.910.011.3
5.552.010.111.116.8
0.87.80.11.09.4
13.422.231.014.5
% of population
StockCountry
Recent Immigrants
358366
76
5860
1321029
9553,016
5048
4262524
8147516
25448
275179
101131
939455458
2,391
Thousand
21.919.143.8
1.632.716.024.2
5.710.912.429.8
7.722.014.628.3
8.83.99.0
28.835.713.5
6.295.022.438.920.415.915.027.420.625.0
% of immigrants
EU15All
50,17755,532
1211
9,98511,049
2020
for natives. Not only they do typically have a limited network of support they can rely on in the host country, but, in many cases, their visa is tightly linked to employment: therefore, a job loss may result also in the loss of legal status, and lead to further marginalisation. Preventing such marginalisation for a significant and ever more important fraction of the population in Europe will be one of the important policy challenges for the times we have ahead.
PART II: IMMIGRATION IN ITALY AND COVID-19

54 55
Table A2: Distribution of immigrants by area of origin.
The table reports, for each country, the share of immigrants from each area of origin out of the total immigrant population. The two bottom rows report the mean values for the EU15 countries as well as for all countries. Immigrants are defined as foreign-born, except for Germany where they are defined as foreign nationals. Source: our elaboration on EU LFS data 2019.
EU15All
3637
1416
2019
1211
1817
AustriaBelgiumBulgariaCroatiaCyprusCzech RepublicDenmarkEstoniaFinlandFranceGermanyGreeceHungaryIcelandIrelandItalyLatviaLithuaniaLuxembourgMaltaNetherlandsNorwayPolandPortugalRomaniaSlovak RepublicSloveniaSpainSwedenSwitzerlandUnited Kingdom
47462613505937
93526441766666634131680
1002643312450722429286239
% of EU
351274871330148626
8276023
54
218076
50
138
696
262076
41516
4
% of Europe non-EU
Country% of Africa
and the Middle East
327
003170
1853
53137
180060
1713
039
510
1839
616
% of Americas and
Oceania
2500215135332
109
121140
2170
30340
4158
10
Asia
1310
00
311036
517
92117
8161415
6850
2329
02
16308
138
31
The table reports, for each country, the share women among immigrants, the share of immigrants aged 25 to 64 with at most lower secondary education (ISCED 0-2), the share of immigrants aged 25 to 64 with tertiary education (ISCED 5-8) and, by comparison, the corresponding shares among the native population. The two bottom rows report the mean values for EU15 countries as well as for all countries. Immigrants are defined as foreign-born, except for Germany where they are defined as foreign nationals. Source: our elaboration on EU LFS data 2019.
AustriaBelgiumBulgariaCroatiaCyprusCzech RepublicDenmarkEstoniaFinlandFranceGermanyGreeceHungaryIcelandIrelandItalyLatviaLithuaniaLuxembourgMaltaNetherlandsNorwayPolandPortugalRomaniaSlovak RepublicSloveniaSpainSwedenSwitzerlandUnited Kingdom
52515553555252615051475553525155645849495249525538514754505152
2536
521191025
5213637391421
949
55
23282723
330
77
2638292217
11%19%17%14%16%
6%18%11%
9%18%
9%25%15%22%19%37%10%
5%22%50%19%16%
8%52%22%
8%10%39%
9%5%
24%
33%40%29%26%45%23%39%41%46%38%30%33%25%44%44%20%35%42%33%22%41%45%31%24%18%25%34%40%43%44%39%
EU15All
5252
3332
2220
3533
Table A3: Gender composition of immigrants and education rates of natives and immigrants.
% Women
Immigrants Natives
% Lower secondary education
Country
33335619423442483432251636475514283754453937533456351528434452
3333
% Tertiary education
% Lower secondary education
% Tertiary education
Tables Appendix - EuropeTables Appendix - Europe

56 57
The table reports, for each country, the percentage point difference between immigrants and natives aged 25-64 in the probability of employment overall (column I), when differences in age, gender and education characteristics are also taken into account (column II), or alternatively within the same regions (column III) and when both differences are taken into account (column IV). The differences are computed as coefficients on an immigrant dummy in a linear probability model. See Technical Appendix for details. *, **, *** indicate that the difference is statistically significant at the 10, 5 and 1 percent significance level, respectively. The two bottom rows report the mean values for EU15 countries as well as for all countries. Immigrants are defined as foreign-born, except for Germany where they are defined as foreign nationals. Source: our elaboration on EU LFS data 2019.
EU15All
-0.078-0.077
-0.091-0.088
******
******
-0.079-0.078
-0.088-0.085
******
******
AustriaBelgiumBulgariaCroatiaCyprusCzech RepublicDenmarkEstoniaFinlandFranceGermanyGreeceHungaryIcelandIrelandItalyLatviaLithuaniaLuxembourgMaltaNetherlandsNorwayPolandPortugalRomaniaSlovak RepublicSloveniaSpainSwedenSwitzerlandUnited Kingdom
-0.077-0.1470.019
-0.081-0.029-0.019-0.134-0.063-0.101-0.141-0.136-0.0950.048
-0.0240.000
-0.013-0.106-0.0730.0180.097
-0.155-0.0990.0510.0170.0230.055
-0.084-0.035-0.171-0.073-0.016
-0.074-0.135-0.005-0.082-0.029-0.029-0.140-0.063-0.115-0.162-0.139-0.1000.034
-0.024-0.003-0.053-0.106-0.0880.0180.097
-0.155-0.1060.0290.010
-0.0060.034
-0.091-0.050-0.175-0.068-0.020
-0.088-0.127-0.033-0.024-0.044-0.028-0.135-0.046-0.094-0.110-0.107-0.0800.030
-0.031-0.0480.015
-0.045-0.014-0.0410.029
-0.147-0.097-0.045-0.032-0.1180.036
-0.024-0.050-0.146-0.075-0.052
-0.084-0.109-0.043-0.025-0.044-0.033-0.137-0.046-0.102-0.121-0.110-0.0790.030
-0.031-0.050-0.026-0.045-0.023-0.0410.029
-0.147-0.100-0.055-0.035-0.1220.025
-0.028-0.063-0.148-0.068-0.048
******
******
**********************
*************************
******************
******
*****************************
*******************
*
****************
******
***********************************
***
*****************************
******
************************************
*****
**************
***************
Unconditional Conditional(region)
Conditional(individual
characteristics)
Conditional(region and
individual characteristics)
Country
Table A4: Employment gap between immigrants and natives, overall.
The table reports, for each country and separately for EU and non-EU immigrants, the percentage point difference between immigrants and natives aged 25-64, in the probability of employment, overall (row I), within the same regions (row II) and when differences in age, gender and education characteristics are taken into account (row III). The differences are computed as coefficients on an immigrant dummy in a linear probability model. See Technical Appendix for details. *, **, *** indicate that the difference is statistically significant at the 10, 5 and 1 percent significance level, respectively. The two bottom rows report the mean values for EU15 countries as well as for all countries. Immigrants are defined as foreign-born, except for Germany where they are defined as foreign nationals. Source: our elaboration on EU LFS data 2019.
Table A5: Employment gap between immigrants and natives and by origin.
EU15All
AustriaBelgiumBulgariaCroatiaCyprusCzech RepublicDenmarkEstoniaFinlandFranceGermanyGreeceHungaryIcelandIrelandItalyLatviaLithuaniaLuxembourgMaltaNetherlandsNorwayPolandPortugalRomaniaSlovak RepublicSloveniaSpainSwedenSwitzerlandUnited Kingdom
-0.002-0.002
-0.010-0.009
-0.017-0.018
-0.119-0.118
-0.134-0.132
-0.113-0.112
******
******
******
******
******
-0.010-0.049-0.0530.018
-0.017-0.029-0.012-0.059-0.002-0.051-0.021-0.1020.0530.0040.025
-0.011-0.107-0.0530.0470.097
-0.0370.0140.0070.048
-0.1310.058
-0.0770.006
-0.059-0.0120.062
-0.009-0.040-0.0830.016
-0.017-0.035-0.018-0.059-0.014-0.069-0.024-0.1070.0390.0040.024
-0.033-0.107-0.0570.0470.097
-0.0370.008
-0.0150.044
-0.1600.042
-0.076-0.005-0.062-0.0040.058
-0.053-0.045-0.093-0.056-0.034-0.020-0.043-0.069-0.007-0.002-0.007-0.0960.047
-0.011-0.012-0.007-0.045-0.020-0.0070.029
-0.051-0.011-0.126-0.042-0.2470.051
-0.044-0.026-0.057-0.0170.016
-0.130-0.2160.041
-0.095-0.040-0.006-0.195-0.063-0.159-0.167-0.232-0.0940.040
-0.074-0.048-0.014-0.106-0.075-0.0870.000
-0.194-0.1900.0630.0070.0700.050
-0.085-0.052-0.212-0.159-0.064
-0.127-0.2000.021
-0.096-0.040-0.021-0.201-0.063-0.174-0.189-0.233-0.0980.027
-0.074-0.053-0.064-0.106-0.091-0.0870.000
-0.194-0.1960.041
-0.0020.0410.018
-0.095-0.069-0.216-0.153-0.069
-0.120-0.187-0.014-0.020-0.049-0.037-0.182-0.043-0.145-0.139-0.190-0.077-0.001-0.066-0.1210.027
-0.045-0.013-0.1670.000
-0.180-0.167-0.022-0.031-0.0780.007
-0.018-0.059-0.181-0.151-0.096
****
*
************
*****
********
***
*****
********
***
****
************
******
********
***
****
***
***
******
*****
****
********
***
***
**********************
******
******
**************************************************
***************
******
******
******************
*****************************
***************
******
***
******************
*********
************
***
**************
(I) (II) (III) (I) (II) (III)Country
EU Non - EU
Tables Appendix - EuropeTables Appendix - Europe

58 59
The table reports, for each country and separately for immigrants who have been in the country for at most five years (recent) and for immigrants who have spent six or more years in the country (earlier), the percentage point difference between immigrants and natives aged 25-64, in the probability of employment overall (row I), within the same regions (row II) and when differences in age, gender and education characteristics are taken into account (row III). The differences are computed as coefficients on an immigrant dummy in a linear probability model. See Technical Appendix for details. *, **, *** indicate that the difference is statistically significant at the 10, 5 and 1 percent significance level, respectively. The two bottom rows report the mean values for EU15 countries as well as for all countries. Immigrants are defined as foreign-born, except for Germany where they are defined as foreign nationals. Source: our elaboration on EU LFS data 2019.
Table A6: Employment gap between immigrants and natives, by years of residence.
EU15All
AustriaBelgiumBulgariaCroatiaCyprusCzech RepublicDenmarkEstoniaFinlandFranceGermanyGreeceHungaryIcelandIrelandItalyLatviaLithuaniaLuxembourgMaltaNetherlandsNorwayPolandPortugalRomaniaSlovak RepublicSloveniaSpainSwedenSwitzerlandUnited Kingdom
-0.165-0.152
-0.172-0.159
-0.186-0.180
-0.060-0.060
-0.073-0.072
-0.057-0.057
******
******
******
******
******
******
-0.130-0.1250.008
-0.049-0.053-0.007-0.181-0.064-0.302-0.265-0.227-0.2270.009
-0.0250.000
-0.187-0.164-0.0220.0270.132
-0.277-0.2320.066
-0.071-0.3370.071
-0.073-0.122-0.312-0.061-0.054
-0.128-0.118-0.052-0.048-0.053-0.016-0.186-0.064-0.324-0.280-0.229-0.236-0.004-0.025-0.005-0.218-0.164-0.0530.0270.132
-0.277-0.2410.045
-0.080-0.3460.047
-0.078-0.136-0.314-0.055-0.058
-0.191-0.171-0.108-0.139-0.075-0.012-0.165-0.124-0.296-0.293-0.213-0.214-0.014-0.043-0.085-0.101-0.197-0.095-0.1200.006
-0.303-0.221-0.027-0.160-0.4760.018
-0.107-0.165-0.285-0.097-0.114
-0.065-0.1530.023
-0.082-0.019-0.021-0.120-0.063-0.076-0.126-0.102-0.0870.058
-0.0230.000
-0.001-0.104-0.0760.0150.080
-0.140-0.093-0.2340.0350.1440.051
-0.086-0.023-0.120-0.077-0.006
-0.062-0.1370.017
-0.082-0.019-0.032-0.126-0.063-0.088-0.148-0.104-0.0910.044
-0.023-0.002-0.042-0.104-0.0900.0150.080
-0.140-0.099-0.2580.0280.1080.031
-0.094-0.038-0.123-0.071-0.009
-0.066-0.1180.001
-0.022-0.027-0.031-0.126-0.038-0.069-0.088-0.066-0.0710.041
-0.028-0.0370.023
-0.039-0.008-0.0160.040
-0.129-0.091-0.363-0.0070.0030.041
-0.010-0.033-0.100-0.067-0.037
******
***
***
************
***
******************
***************
******
***
***
************
***
******************
***************
******
***
******************
******
*****
******
******
***************
******
*****
**********************
******
*******************************
******
****************************
*********
*****************
************
******
**********************************
**********
*
************
(I) (II) (III) (I) (II) (III)Country
RECENT EARLIER
The table reports, for each country and separately for EU immigrants who have been in the country for at most five years (recent) and for EU immigrants who have spent six or more years in the country (earlier), the percentage point difference between immigrants and natives aged 25-64, in the probability of employment, overall (row I), within the same regions (row II) and when differences in age, gender and education characteristics are also taken into account (row III). The differences are computed as coefficients on an immigrant dummy in a linear probability model. See Technical Appendix for details. *, **, *** indicate that the difference is statistically significant at the 10, 5 and 1 percent significance level, respectively. The two bottom rows report the mean values for EU15 countries as well as for all countries. Immigrants are defined as foreign-born, except for Germany where they are defined as foreign nationals. Source: our elaboration on EU LFS data 2019.
Table A7: Employment gaps between EU immigrants and natives, by years of residence.
EU15All
AustriaBelgiumBulgariaCroatiaCyprusCzech RepublicDenmarkEstoniaFinlandFranceGermanyGreeceHungaryIcelandIrelandItalyLatviaLithuaniaLuxembourgMaltaNetherlandsNorwayPolandPortugalRomaniaSlovak RepublicSloveniaSpainSwedenSwitzerlandUnited Kingdom
0.0120.013
0.0090.010
-0.019-0.025
-0.005-0.005
-0.013-0.012
-0.016-0.016
*
****
******
*
******
******
-0.020-0.0060.2310.0510.0210.063
-0.0530.010
-0.1000.047
-0.025-0.101-0.0280.0110.0660.010
-0.4870.0160.0740.132
-0.030-0.0560.0390.021
-0.350-0.0430.1420.048
-0.0590.0190.057
-0.0180.0020.1640.0440.0210.056
-0.0600.010
-0.1220.035
-0.029-0.114-0.0400.0110.063
-0.005-0.487-0.0200.0740.132
-0.030-0.0630.0180.012
-0.372-0.0480.1490.049
-0.0640.0250.053
-0.090-0.058-0.003-0.148-0.0250.083
-0.074-0.025-0.119-0.016-0.017-0.022-0.042-0.013-0.0060.015
-0.420-0.029-0.0670.006
-0.092-0.085-0.088-0.089-0.538-0.1460.020
-0.037-0.076-0.0240.004
-0.007-0.062-0.1350.015
-0.026-0.0430.001
-0.0800.002
-0.060-0.019-0.1020.0670.0030.015
-0.012-0.081-0.0600.0370.080
-0.0370.017
-0.3860.0500.0380.076
-0.0920.002
-0.059-0.0220.063
-0.006-0.049-0.1550.014
-0.026-0.049-0.005-0.080-0.009-0.078-0.023-0.1070.0530.0030.015
-0.034-0.081-0.0600.0370.080
-0.0370.011
-0.4190.0460.0040.058
-0.091-0.010-0.061-0.0130.060
-0.043-0.041-0.119-0.049-0.035-0.036-0.033-0.082-0.001-0.001-0.002-0.1010.063
-0.010-0.013-0.007-0.019-0.0190.0080.040
-0.047-0.007-0.596-0.039-0.0240.084
-0.048-0.024-0.052-0.0150.019
*
***
**
***
***
*
******
*
***
*******
***
***
****
***
*
******
**
***
********
*****
*****
**
***
**
********
*****
***
***
*
************
*****
********
*****
******
*********
***
****
*
************
******
********
*****
*****
********
******
**********
******
***
***
******
***************
(I) (II) (III) (I) (II) (III)Country
EU-RECENT EU-EARLIER
Tables Appendix - EuropeTables Appendix - Europe

60 61
The table reports, for each country and separately for non-EU immigrants who have been in the country for at most five years (recent) and for non-EU immigrants who have spent six or more years in the country (earlier), the percentage point difference between immigrants and natives aged 25-64, in the probability of employment, overall (row I), within the same regions (row II) and when differences in age, gender and education characteristics are taken into account (row III). The differences are computed as coefficients on an immigrant dummy in a linear probability model. See Technical Appendix for details. *, **, *** indicate that the difference is statistically significant at the 10, 5 and 1 percent significance level, respectively. The two bottom rows report the mean values for EU15 countries as well as for all countries. Immigrants are defined as foreign-born, except for Germany where they are defined as foreign nationals. Source: our elaboration on EU LFS data 2019.
Table A8: Employment gaps between non-EU immigrants and natives, by years of residence.
EU15All
AustriaBelgiumBulgariaCroatiaCyprusCzech RepublicDenmarkEstoniaFinlandFranceGermanyGreeceHungaryIcelandIrelandItalyLatviaLithuaniaLuxembourgMaltaNetherlandsNorwayPolandPortugalRomaniaSlovak RepublicSloveniaSpainSwedenSwitzerlandUnited Kingdom
-0.262-0.249
-0.270-0.256
-0.278-0.270
-0.089-0.091
-0.105-0.106
-0.079-0.080
******
******
******
******
******
******
-0.252-0.241-0.039-0.153-0.087-0.077-0.252-0.091-0.337-0.324-0.374-0.2480.043
-0.078-0.058-0.239-0.077-0.029-0.0830.000
-0.348-0.3910.074
-0.078-0.3270.163
-0.094-0.171-0.376-0.207-0.142
-0.250-0.232-0.097-0.143-0.087-0.089-0.256-0.091-0.360-0.340-0.374-0.2570.030
-0.078-0.063-0.274-0.077-0.059-0.0830.000
-0.348-0.4020.052
-0.088-0.3290.124
-0.101-0.190-0.376-0.199-0.146
-0.303-0.281-0.130-0.128-0.098-0.107-0.215-0.160-0.327-0.345-0.354-0.2470.012
-0.087-0.152-0.132-0.137-0.106-0.2360.000
-0.364-0.343-0.011-0.166-0.4340.151
-0.120-0.203-0.340-0.229-0.207
-0.107-0.2110.083
-0.095-0.0100.007
-0.180-0.061-0.127-0.146-0.174-0.0840.039
-0.073-0.0410.005
-0.107-0.078-0.0890.000
-0.176-0.180-0.1610.0300.167
-0.014-0.084-0.033-0.145-0.147-0.045
-0.104-0.1950.081
-0.095-0.010-0.008-0.185-0.061-0.141-0.168-0.175-0.0880.025
-0.073-0.045-0.047-0.107-0.093-0.0890.000
-0.176-0.186-0.1810.0200.131
-0.041-0.094-0.050-0.148-0.142-0.050
-0.085-0.1680.046
-0.019-0.016-0.024-0.172-0.034-0.113-0.112-0.121-0.065-0.007-0.061-0.1010.041
-0.041-0.007-0.1250.000
-0.158-0.158-0.2520.0030.009
-0.0740.001
-0.036-0.121-0.127-0.071
******
***
****************
******
*************************************
******
***
****************
******
************************************
******
**********************
******
**************
************************
******
***
*************************
******************
******
***************
******
***
******************
***************************
******
***************
******
******************
********
**************
************
(I) (II) (III) (I) (II) (III)Country
Non EU-RECENT Non EU-EARLIER
The table reports, for each country, the difference in occupational status, measured by the ISEI index, between immigrants and natives aged 25-64, overall (row I), when differences in age, gender and education characteristics are also taken into account (row II), or alternatively within the same regions (row III) and when both differences are taken into account (row IV). Each cell measures the difference expressed as a fraction of the within-country standard deviation. The differences are computed as coefficients on an immigrant dummy in a linear regression model. See Technical Appendix for details. *, **, *** indicate that the difference is statistically significant at the 10, 5 and 1 percent significance level, respectively. The two bottom rows report the mean values for EU15 countries as well as for all countries. Immigrants are defined as foreign-born, except for Germany where they are defined as foreign nationals. Source: our elaboration on EU LFS data 2019.
EU15All
-0.389-0.360
-0.457-0.437
******
******
-0.301-0.302
-0.339-0.319
******
******
Table A9: Differences in occupational status between immigrants and natives.
AustriaBelgiumBulgariaCroatiaCyprusCzech RepublicDenmarkEstoniaFinlandFranceGermanyGreeceHungaryIcelandIrelandItalyLatviaLithuaniaLuxembourgNetherlandsNorwayPolandPortugalRomaniaSlovak RepublicSloveniaSpainSwedenSwitzerlandUnited Kingdom
-0.386-0.3450.597
-0.160-0.486-0.074-0.325-0.242-0.318-0.278-0.511-0.6540.137
-0.367-0.105-0.761-0.202-0.1060.061
-0.283-0.4000.034
-0.0091.0700.107
-0.519-0.558-0.354-0.179-0.091
-0.414-0.4450.486
-0.158-0.486-0.209-0.393-0.242-0.416-0.422-0.549-0.705-0.064-0.367-0.130-0.785-0.203-0.1840.061
-0.283-0.458-0.099-0.0840.740
-0.043-0.560-0.595-0.409-0.206-0.190
-0.305-0.2310.032
-0.058-0.351-0.199-0.313-0.235-0.157-0.164-0.344-0.2370.006
-0.381-0.179-0.505-0.070-0.003-0.172-0.242-0.312-0.183-0.1590.2600.026
-0.162-0.349-0.318-0.073-0.198
-0.323-0.2770.004
-0.058-0.351-0.258-0.345-0.235-0.225-0.245-0.366-0.274-0.055-0.382-0.194-0.519-0.070-0.046-0.172-0.242-0.349-0.249-0.1880.196
-0.050-0.184-0.376-0.352-0.090-0.249
***************
*******************************************
*******************
************************************
*****************************
***************
******
**************************
*********
****************
***************
******
*************************************
****************
***************
Unconditional Conditional(region)
Conditional(individual
characteristics)
Conditional(region and
individual characteristics)
Country
Tables Appendix - EuropeTables Appendix - Europe

62 63
The table reports, for each country, and separately for EU and non-EU immigrants, the difference in occupational status, measured by the ISEI index, between immigrants and natives aged 25-64, overall (row I), within the same regions (row II) and when differences in age, gender and education characteristics are taken into account (row III). Each cell measures the difference expressed as a fraction of the within-country standard deviation. The differences are computed as coefficients on an immigrant dummy in a linear regression model. See Technical Appendix for details. *, **, *** indicate that the difference is statistically significant at the 10, 5 and 1 percent significance level, respectively. The two bottom rows report the mean values for EU15 countries as well as for all countries. Immigrants are defined as foreign-born, except for Germany where they are defined as foreign nationals. Source: our elaboration on EU LFS data 2019.
Table A10: Differencesin occupational status between immigrants and natives, by origin.
EU15All
AustriaBelgiumBulgariaCroatiaCyprusCzech RepublicDenmarkEstoniaFinlandFranceGermanyGreeceHungaryIcelandIrelandItalyLatviaLithuaniaLuxembourgNetherlandsNorwayPolandPortugalRomaniaSlovak RepublicSloveniaSpainSwedenSwitzerlandUnited Kingdom
-0.314-0.281
-0.366-0.332
-0.264-0.237
-0.432-0.426
-0.514-0.506
-0.323-0.312
******
******
******
******
******
******
-0.130-0.1090.9260.297
-0.2610.051
-0.0220.237
-0.224-0.118-0.479-0.2820.143
-0.315-0.195-0.607-0.1570.1330.103
-0.057-0.2470.5740.1470.9760.102
-0.036-0.3910.052
-0.016-0.231
-0.151-0.2130.7360.302
-0.261-0.060-0.0930.238
-0.305-0.239-0.518-0.288-0.048-0.316-0.208-0.619-0.1570.1000.103
-0.057-0.2990.4460.1520.646
-0.010-0.025-0.410-0.004-0.037-0.321
-0.198-0.082-0.0230.112
-0.176-0.052-0.1590.015
-0.072-0.038-0.335-0.1880.056
-0.338-0.213-0.4340.0170.194
-0.132-0.129-0.2060.044
-0.0650.3990.075
-0.017-0.283-0.0680.021
-0.280
-0.625-0.5570.505
-0.239-0.703-0.222-0.525-0.290-0.384-0.332-0.547-0.7270.126
-0.4700.084
-0.844-0.210-0.132-0.124-0.376-0.560-0.114-0.0611.0920.118
-0.634-0.632-0.536-0.4470.009
-0.663-0.6480.415
-0.237-0.703-0.395-0.591-0.290-0.500-0.494-0.585-0.787-0.095-0.4700.036
-0.874-0.210-0.214-0.124-0.376-0.628-0.248-0.1670.762
-0.111-0.689-0.677-0.590-0.475-0.107
-0.412-0.3650.047
-0.087-0.523-0.369-0.417-0.263-0.220-0.209-0.345-0.246-0.083-0.467-0.114-0.536-0.086-0.025-0.312-0.291-0.422-0.245-0.1930.227
-0.070-0.199-0.377-0.439-0.250-0.139
***************
**************************
***
************
*****
***
***************
*****************
*********
***
***********
***
*****
******
***
***
****************
**********
******
******
***
*******************************************************************
************
***********************************
*****************************
***************
******
*************************************
***************
***************
Country
EU Non EU
(I) (II) (II)(III) (I) (III)
The table reports, for each country, and separately for recent (in the country for at most five years) and earlier (in the country for six or more years) immigrants, the difference in occupational status, measured by the ISEI index, between immigrants and natives aged 25-64, overall (row I), within the same regions (row II) and when differences in age, gender and education characteristics are taken into account (row III). Each cell measures the difference expressed as a fraction of the within-country standard deviation. The differences are computed as coefficients on an immigrant dummy in a linear regression model. See Technical Appendix for details. *, **, *** indicate that the difference is statistically significant at the 10, 5 and 1 percent significance level, respectively. The two bottom rows report the mean values for EU15 countries as well as for all countries. Immigrants are defined as foreign-born, except for Germany where they are defined as foreign nationals. Source: our elaboration on EU LFS data 2019.
Table A11: Differences in occupational status between immigrants and natives, by years of residence.
EU15All
AustriaBelgiumBulgariaCroatiaCyprusCzech RepublicDenmarkEstoniaFinlandFranceGermanyGreeceHungaryIcelandIrelandItalyLatviaLithuaniaLuxembourgNetherlandsNorwayPolandPortugalRomaniaSlovak RepublicSloveniaSpainSwedenSwitzerlandUnited Kingdom
-0.291-0.251
-0.364-0.324
-0.325-0.303
-0.472-0.390
--0.295-0.456
-0.334-0.277
******
******
******
******
******
******
-0.311-0.1881.012
-0.084-0.667-0.036-0.5330.4150.006
-0.130-0.468-0.5190.044
-0.5270.063
-0.8330.1880.5160.430
-0.158-0.4540.036
-0.1431.447
-0.286-0.466-0.279-0.4280.170
-0.135
-0.333-0.3080.730
-0.082-0.667-0.182-0.6040.416
-0.167-0.264-0.505-0.631-0.168-0.5280.012
-0.8470.1880.3530.431
-0.158-0.526-0.097-0.2940.969
-0.416-0.489-0.319-0.4720.134
-0.256
-0.376-0.1780.457
-0.243-0.475-0.293-0.528-0.1030.072
-0.220-0.425-0.1500.016
-0.541-0.128-0.5080.2490.285
-0.004-0.209-0.129-0.182-0.456-0.017-0.252-0.159-0.247-0.4310.013
-0.267
-0.403-0.3830.413
-0.161-0.414-0.081-0.272-0.298-0.346-0.293-0.525-0.6600.159
-0.338-0.165-0.758-0.216-0.149-0.109-0.294-0.399-0.0400.0151.0120.221
-0.528-0.593-0.334-0.282-0.079
-0.433-0.4730.377
-0.160-0.414-0.217-0.339-0.298-0.440-0.439-0.563-0.708-0.040-0.338-0.180-0.782-0.216-0.221-0.109-0.294-0.457-0.147-0.0530.7050.063
-0.573-0.628-0.392-0.305-0.180
-0.288-0.242-0.158-0.054-0.296-0.182-0.257-0.248-0.178-0.159-0.314-0.2390.004
-0.351-0.199-0.502-0.082-0.023-0.226-0.245-0.319-0.221-0.1080.3020.107
-0.161-0.362-0.290-0.100-0.180
********
***
******
******
******
************
*****
**************
*********
***
******
****************
***********
***
**************
*********
*******
********************
************
***********
***
*************************************************************************************
***********************************
***************************
**
***************
******
**************************
*********
***************
***************
(I) (II) (III) (I) (II) (III)Country
RECENT EARLIER
Tables Appendix - EuropeTables Appendix - Europe

64 65
The table reports, for each country, and separately for recent (in the country for at most five years) and earlier (in the country for six or more years) EU immigrants, the difference in occupational status, measured by the ISEI index, between EU immigrants and natives aged 25-64, overall (row I), within the same regions (row II) and when differences in age, gender and education characteristics are taken into account (row III). Each cell measures the difference expressed as a fraction of the within-country standard deviation. The differences are computed as coefficients on an immigrant dummy in a linear regression model. See Technical Appendix for details. *, **, *** indicate that the difference is statistically significant at the 10, 5 and 1 percent significance level, respectively. The two bottom rows report the mean values for EU15 countries as well as for all countries. Immigrants are defined as foreign-born, except for Germany where they are defined as foreign nationals. Source: our elaboration on EU LFS data 2019.
Table A12: Gap in occupational status between EU immigrants and natives, by years of residence.
EU15All
AustriaBelgiumBulgariaCroatiaCyprusCzech RepublicDenmarkEstoniaFinlandFranceGermanyGreeceHungaryIcelandIrelandItalyLatviaLithuaniaLuxembourgNetherlandsNorwayPolandPortugalRomaniaSlovak RepublicSloveniaSpainSwedenSwitzerlandUnited Kingdom
-0.314-0.236
-0.382-0.302
-0.330-0.283
-0.311-0.287
-0.360-0.336
-0.249-0.225
******
******
******
******
******
******
-0.175-0.0911.6290.289
-0.142-0.060-0.2290.9510.6320.221
-0.577-0.2240.317
-0.480-0.090-0.543-1.0420.9160.4780.277
-0.3510.5620.6401.866
-0.2200.2200.0420.2720.303
-0.363
-0.195-0.2151.3500.304
-0.142-0.193-0.3130.9510.5300.095
-0.618-0.2630.109
-0.481-0.136-0.547-1.0440.7040.4800.277
-0.3710.4340.4961.253
-0.2720.2580.0270.1980.265
-0.477
-0.277-0.1280.550
-0.214-0.209-0.128-0.3670.4770.4410.063
-0.483-0.0790.166
-0.448-0.210-0.494-0.5731.0070.0600.075
-0.1200.0460.0600.380
-0.1740.076
-0.0880.0360.106
-0.404
-0.117-0.1140.6130.298
-0.2920.0700.038
-0.001-0.260-0.150-0.446-0.2850.116
-0.288-0.221-0.610-0.1300.061
-0.049-0.090-0.2430.8950.1200.6400.150
-0.059-0.441-0.004-0.128-0.188
-0.139-0.2050.4630.302
-0.292-0.038-0.029-0.001-0.341-0.271-0.484-0.289-0.072-0.289-0.226-0.622-0.1300.045
-0.049-0.090-0.2970.7610.1340.4160.029
-0.051-0.460-0.056-0.143-0.273
-0.176-0.068-0.2790.138
-0.166-0.038-0.100-0.141-0.094-0.048-0.282-0.1940.039
-0.319-0.217-0.4310.0350.118
-0.189-0.149-0.2110.008
-0.0720.4060.112
-0.026-0.306-0.095-0.011-0.241
***
***
**
*******
***
*******************
**********
*********
*********
**
******
***
*****************
**********
*********
*********
***
******
***
**************
***
******
*************
***********************
************
***
******
******
******
************
*********
*********
***********
*****
*****
***
*
******
*********
*********
******
******
***
Country
EU - RECENT EU - EARLIER
(I) (II) (II)(III) (I) (III)
The table reports, for each country, and separately for recent (in the country for at most five years) and earlier (in the country for six or more years) non-EU immigrants, the difference in occupational status, measured by the ISEI index, between non-EU immigrants and natives aged 25-64, overall (row I), within the same regions (row II) and when differences in age, gender and education characteristics are also taken into account (row III). Each cell measures the difference expressed as a fraction of the within-country standard deviation. The differences are computed as coefficients on an immigrant dummy in a linear regression model. See Technical Appendix for details. *, **, *** indicate that the difference is statistically significant at the 10, 5 and 1 percent significance level, respectively. The two bottom rows report the mean values for EU15 countries as well as for all countries. Immigrants are defined as foreign-born, except for Germany where they are defined as foreign nationals. Source: our elaboration on EU LFS data 2019.
Table A13: Gap in occupational status between non-EU immigrants and natives, by residence.
EU15All
AustriaBelgiumBulgariaCroatiaCyprusCzech RepublicDenmarkEstoniaFinlandFranceGermanyGreeceHungaryIcelandIrelandItalyLatviaLithuaniaLuxembourgNetherlandsNorwayPolandPortugalRomaniaSlovak RepublicSloveniaSpainSwedenSwitzerlandUnited Kingdom
-0.268-0.261
-0.346-0.340
-0.317-0.317
-0.458-0.453
-0.541-0.533
-0.322-0.310
******
******
******
******
******
******
-0.525-0.3230.838
-0.616-0.950-0.009-0.7620.198
-0.159-0.245-0.329-0.586-0.186-0.6000.219
-0.9540.3330.4570.291
-0.358-0.611-0.107-0.2141.181
-0.328-0.557-0.409-0.716-0.1540.097
-0.552-0.4310.556
-0.630-0.950-0.171-0.8230.198
-0.352-0.381-0.361-0.715-0.402-0.6000.163
-0.9730.3330.3020.291
-0.358-0.760-0.242-0.3670.789
-0.508-0.588-0.459-0.748-0.179-0.036
-0.533-0.2460.431
-0.285-0.630-0.486-0.653-0.339-0.026-0.311-0.343-0.166-0.110-0.685-0.041-0.5140.3460.179
-0.138-0.340-0.143-0.243-0.503-0.268-0.301-0.190-0.311-0.630-0.213-0.125
-0.640-0.5990.356
-0.235-0.561-0.259-0.468-0.322-0.412-0.341-0.610-0.7330.254
-0.441-0.007-0.838-0.229-0.171-0.438-0.378-0.558-0.333-0.0271.0820.426
-0.648-0.660-0.485-0.509-0.009
-0.680-0.6880.352
-0.234-0.562-0.436-0.536-0.322-0.519-0.507-0.650-0.7910.028
-0.441-0.052-0.869-0.229-0.249-0.439-0.378-0.623-0.432-0.1290.7590.162
-0.709-0.704-0.545-0.536-0.130
-0.388-0.386-0.124-0.085-0.452-0.349-0.358-0.258-0.244-0.198-0.343-0.247-0.072-0.419-0.157-0.533-0.103-0.039-0.427-0.286-0.431-0.292-0.1240.2830.090
-0.198-0.385-0.384-0.256-0.141
*************
***
*******************
*********************************
******
*****
***
*********************
**********************************
******
**********
********
***
***
*****
******
**************
****************************************
******************
******************
******
***************************
******************************
***************
******
***************************
*********
*********
***
***************
Country
NON - EU- RECENT NON - EU - EARLIER
(I) (II) (III) (I) (II) (III)
Tables Appendix - EuropeTables Appendix - Europe

66 67
The table reports, for each country, the percentage points difference in the probability of being in the bottom decile of the national income distribution between immigrants and natives aged 25-64, overall (row I), when differences in age, gender and education characteristics are also taken into account (row II), when individuals are compared within the same region (column III) when the two dimensions -regional location and characteristics- are considered at the same time (row IV), and when differences in occupations and full/part time employment are taken into account together with individual characteristics (V). The differences are computed as coefficients on an immigrant dummy in a linear regression model. See Technical Appendix for details. *, **, *** indicate that the difference is statistically significant at the 10, 5 and 1 percent significance level, respectively. The two bottom rows report the mean values for EU15 countries as well as for all countries. Immigrants are defined as foreign-born, except for Germany where they are defined as foreign nationals. Source: our elaboration on EU LFS data 2019.
Table A14: Immigrant-native differences in probability of being in bottom income decile.
EU15All
BelgiumBulgariaCroatiaCyprusDenmarkEstoniaFinlandFranceGermanyGreeceHungaryIrelandItalyLatviaLithuaniaLuxembourgMaltaNetherlandsPolandPortugalRomaniaSlovak RepublicSwitzerlandUnited Kingdom
0.0480.045
******
0.058-0.0680.0350.1710.0140.0480.0710.0630.0570.099
-0.0050.0110.0840.0280.0060.037
-0.0180.031
-0.0650.008
-0.088-0.0070.000
-0.003
************************
*****
***
*******
0.0400.036
******
0.051-0.0250.0230.1460.0090.0380.0620.0460.0410.072
-0.0050.0210.061
-0.0160.0080.051
-0.0100.030
-0.0380.021
-0.059-0.010-0.0070.009
***
*******************
******
***
**********
***
0.0530.050
******
0.063-0.0550.0350.1710.0160.0480.0770.0760.0560.1030.0270.0130.0920.0280.0070.037
-0.0180.031
-0.0510.012
-0.0890.0000.0030.004
************************************
***
**********
0.0450.040
******
0.052-0.0190.0220.1460.0100.0380.0660.0550.0410.0750.0130.0230.069
-0.0160.0090.051
-0.0100.030
-0.0280.022
-0.065-0.006-0.0040.012
***
*******************
******
***
***
******
**
0.0110.009
******
0.021-0.0220.0110.060
-0.0100.0200.0420.0190.0060.032
-0.0140.0050.001
-0.0300.0010.028
-0.0080.024
-0.043-0.013-0.061-0.003-0.011-0.003
***
*******
*********
***
***********
***
Country (I) (II) (III) (I) (III)
The table reports, for each country, the percentage points difference in the probability of being in the top decile of the national income distribution between immigrants and natives aged 25-64, overall (row I), when differences in age, gender and education characteristics are also taken into account (row II), when individuals are compared within the same region (column III) when the two dimensions -regional location and characteristics- are considered at the same time (row IV), and when differences in occupations and full/part time employment are taken into account together with individual characteristics (V). The differences are computed as coefficients on an immigrant dummy in a linear regression model. See Technical Appendix for details. *, **, *** indicate that the difference is statistically significant at the 10, 5 and 1 percent significance level, respectively. The two bottom rows report the mean values for EU15 countries as well as for all countries. Immigrants are defined as foreign-born, except for Germany where they are defined as foreign nationals. Source: our elaboration on EU LFS data 2019.
Table A15: Immigrant-native differences in probability of being in top income decile.
EU15All
BelgiumBulgariaCroatiaCyprusDenmarkEstoniaFinlandFranceGermanyGreeceHungaryIrelandItalyLatviaLithuaniaLuxembourgMaltaNetherlandsPolandPortugalRomaniaSlovak RepublicSwitzerlandUnited Kingdom
-0.034-0.030
******
0.0270.124
-0.007-0.037-0.034-0.036-0.004-0.028-0.052-0.0900.043
-0.015-0.084-0.044-0.0340.0240.091
-0.0360.0100.0180.0160.0490.0120.012
***
*********
******************************
***
******
-0.019-0.018
******
0.0450.0620.0050.009
-0.022-0.0210.020
-0.018-0.033-0.0180.025
-0.019-0.0410.0010.009
-0.0100.048
-0.031-0.0110.002
-0.0180.0350.019
-0.003
***
******
*****************
****
***
-0.056-0.051
******
0.0060.084
-0.008-0.037-0.045-0.036-0.028-0.071-0.064-0.0920.007
-0.022-0.092-0.044-0.0630.0240.091
-0.036-0.025-0.0020.0240.0060.007
-0.023
*********
*********
*******************
***
-0.037-0.035
******
0.0280.0330.0030.009
-0.032-0.021-0.002-0.053-0.041-0.0240.005
-0.024-0.0480.001
-0.016-0.0100.048
-0.031-0.041-0.010-0.0040.0020.015
-0.033
***
******
*********
******
****
*
******
-0.006-0.007
******
0.0420.0240.0140.017
-0.010-0.0160.023
-0.009-0.0120.0020.010
-0.011-0.006-0.0040.013
-0.0170.048
-0.025-0.0340.007
-0.0070.0360.0080.004
***
*****
***
*****
******
***
Country (I) (II) (III) (IV) (V)
Tables Appendix - EuropeTables Appendix - Europe

68 69
The table reports, for each country, the percentage points difference in the probability of being in the bottom decile of the national income distribution between immigrants who have been in the country for at most five years and natives aged 25-64, overall (row I), when differences in age, gender and education characteristics are also taken into account (row II), when individuals are compared within the same region (column III), when the two dimensions -regional location and characteristics- are considered at the same time (row IV), and when differences in occupations and full/part time employment are taken into account together with individual characteristics (V). The differences are computed as coefficients on an immigrant dummy in a linear regression model. See Technical Appendix for details. *, **, *** indicate that the difference is statistically significant at the 10, 5 and 1 percent significance level, respectively. The two bottom rows report the mean values for EU15 countries as well as for all countries. Immigrants are defined as foreign-born, except for Germany where they are defined as foreign nationals. Source: our elaboration on EU LFS data 2019.
Table A16: Differences in probability of being in bottom decile btw recent immigrants and natives.
BelgiumBulgariaCroatiaCyprusDenmarkEstoniaFinlandFranceGermanyGreeceHungaryIrelandItalyLatviaLithuaniaLuxembourgMaltaNetherlandsPolandPortugalRomaniaSlovak RepublicSwitzerlandUnited Kingdom
0.039-0.0890.1880.3560.034
-0.0280.1090.0290.0620.0750.014
-0.0040.113
-0.0690.0000.017
-0.0230.079
-0.0830.044
-0.1030.035
-0.010-0.016
*****
******
*****
******
***********
**
0.0500.0400.1980.3230.0130.0040.0770.0370.0570.025
-0.0010.0150.075
-0.0290.0110.057
-0.0060.078
-0.0540.066
-0.0400.042
-0.0020.001
**********
****
******
***
************
0.044-0.0460.1900.3560.035
-0.0280.1180.0390.0620.0850.048
-0.0010.116
-0.0690.0020.017
-0.0230.079
-0.0690.053
-0.1060.043
-0.006-0.007
******
******
*******
******
************
0.0500.0610.2000.3230.0150.0040.0830.0430.0570.0350.0160.0170.079
-0.0290.0120.057
-0.0060.078
-0.0440.069
-0.0480.0500.0010.006
**********
*****
******
***
***********
EU15All
0.0360.033
******
0.0390.037
******
0.0410.038
******
0.0420.040
******
0.0100.015
******
0.0110.0370.1700.187
-0.031-0.0260.081
-0.0070.0130.018
-0.0170.0010.000
-0.0400.0080.040
-0.0100.070
-0.060-0.010-0.0410.077
-0.009-0.006
*********
***
***
******
****
Country (I) (II) (III) (VI) (V)
The table reports, for each country, the percentage points difference in the probability of being in the top decile of the national income distribution between immigrants who have been in the country for at most five years and natives aged 25-64 overall (row I), when differences in age, gender and education characteristics are also taken into account (row II), when individuals are compared within the same region (column III), when the two dimensions -regional location and characteristics- are considered at the same time (row IV), and when differences in occupations and full/part time employment are taken into account together with individual characteristics (V). The differences are computed as coefficients on an immigrant dummy in a linear regression model. See Technical Appendix for details. *, **, *** indicate that the difference is statistically significant at the 10, 5 and 1 percent significance level, respectively. The two bottom rows report the mean values for EU15 countries as well as for all countries. Immigrants are defined as foreign-born, except for Germany where they are defined as foreign nationals. Source: our elaboration on EU LFS data 2019.
Table A17: Differences in probability of being in top decile between recent immigrants and natives.
EU15All
BelgiumBulgariaCroatiaCyprusDenmarkEstoniaFinlandFranceGermanyGreeceHungaryIrelandItalyLatviaLithuaniaLuxembourgMaltaNetherlandsPolandPortugalRomaniaSlovak RepublicSwitzerlandUnited Kingdom
-0.022-0.014
******
0.0620.5940.343
-0.023-0.0540.099
-0.092-0.024-0.056-0.0210.0280.014
-0.0830.0030.0820.0110.156
-0.0700.0170.003
-0.051-0.0360.0450.025
****************
***
***
******
***
-0.005-0.005
0.0940.4210.3560.077
-0.0190.019
-0.023-0.011-0.0380.0720.0080.013
-0.002-0.020-0.029-0.0120.096
-0.039-0.0060.008
-0.125-0.0270.0440.018
***********
*****
**
***
***
-0.045-0.036
******
0.0410.4890.347
-0.023-0.0680.099
-0.129-0.063-0.066-0.022-0.0130.000
-0.0870.0030.0290.0110.156
-0.070-0.020-0.036-0.038-0.0650.038
-0.016
*********************
***
******
**
*****
-0.022-0.021
******
0.0780.3460.3600.077
-0.0290.019
-0.058-0.039-0.0430.066
-0.0150.002
-0.006-0.020-0.059-0.0120.096
-0.039-0.037-0.015-0.106-0.0540.039
-0.014
***
*********
******
**
*******
0.0050.000
0.0790.2930.3870.084
-0.003-0.020-0.026-0.006-0.0130.0620.017
-0.0030.021
-0.037-0.042-0.0070.111
-0.031-0.0320.028
-0.1360.0000.0150.019
***
******
******
***
**
*****
Country (I) (II) (III) (IV) (V)
Tables Appendix - EuropeTables Appendix - Europe

70 71
The table reports, for each country, the percentage points difference in the probability of being in the bottom decile of the national income distribution between immigrants who have been in the country for six or more years and natives aged 25-64 overall (row I), when differences in age, gender and education characteristics are also taken into account (row II), when individuals are compared within the same region (column III) when the two dimensions -regional location and characteristics- are considered at the same time (row IV), and when differences in occupations and full/part time employment are taken into account together with individual characteristics (V). The differences are computed as coefficients on an immigrant dummy in a linear regression model. See Technical Appendix for details. *, **, *** indicate that the difference is statistically significant at the 10, 5 and 1 percent significance level, respectively. The two bottom rows report the mean values for EU15 countries as well as for all countries. Immigrants are defined as foreign-born, except for Germany where they are defined as foreign nationals. Source: our elaboration on EU LFS data 2019.
Table A18: Differences in probability of being in bottom decile between earlier immigrants and natives.
BelgiumBulgariaCroatiaCyprusDenmarkEstoniaFinlandFranceGermanyGreeceHungaryIrelandItalyLatviaLithuaniaLuxembourgMaltaNetherlandsPolandPortugalRomaniaSlovak RepublicSwitzerlandUnited Kingdom
0.063-0.0600.0340.0940.0090.0550.0680.0670.0550.100
-0.0100.0160.0820.0320.0070.046
-0.0160.0270.2530.002
-0.085-0.0180.0030.001
*************************
******
***
***
****
0.051-0.0480.0200.0830.0070.0410.0610.0460.0340.074
-0.0060.0220.060
-0.0150.0080.045
-0.0110.0270.2360.013
-0.062-0.024-0.0090.011
***
***
*************
******
***
***
************
Country (I) (II)
0.067-0.0590.0330.0940.0100.0550.0740.0800.0540.1040.0220.0170.0900.0320.0080.046
-0.0160.0270.2550.006
-0.087-0.0110.0060.007
********************************
***
***
***
*
0.052-0.0480.0200.0830.0080.0410.0650.0560.0330.0770.0120.0230.069
-0.0150.0090.045
-0.0110.0270.2420.014
-0.067-0.021-0.0070.014
***
*****************
******
***
***
***********
EU15All
0.0500.046
******
0.0400.035
******
0.0550.052
******
0.0440.039
******
0.0100.008
******
0.022-0.0430.0090.040
-0.0060.0250.0410.0220.0020.033
-0.0130.0040.000
-0.0300.0000.020
-0.0080.0200.261
-0.014-0.065-0.025-0.014-0.004
***
***
***
***
***
**
**************
(III) (VI) (V)
The table reports, for each country, the percentage points difference in the probability of being in the top decile of the national income distribution between immigrants who have been in the country for six or more years and natives aged 25-64 overall (row I), when differences in age, gender and education characteristics are also taken into account (row II), when individuals are compared within the same region (column III), when the two dimensions -regional location and characteristics- are considered at the same time (row IV), and when differences in occupations and full/part time employment are taken into account together with individual characteristics (V). The differences are computed as coefficients on an immigrant dummy in a linear regression model. See Technical Appendix for details. *, **, *** indicate that the difference is statistically significant at the 10, 5 and 1 percent significance level, respectively. The two bottom rows report the mean values for EU15 countries as well as for all countries. Immigrants are defined as foreign-born, except for Germany where they are defined as foreign nationals. Source: our elaboration on EU LFS data 2019.
EU15All
BelgiumBulgariaCroatiaCyprusDenmarkEstoniaFinlandFranceGermanyGreeceHungaryIrelandItalyLatviaLithuaniaLuxembourgMaltaNetherlandsPolandPortugalRomaniaSlovak RepublicSwitzerlandUnited Kingdom
-0.036-0.033
******
0.018-0.044-0.011-0.042-0.028-0.0490.002
-0.028-0.051-0.0940.047
-0.026-0.084-0.046-0.0410.0300.058
-0.034-0.1100.0210.0260.0710.0010.009
**
*********
************************************
**
-0.021-0.020
******
0.032-0.0670.000
-0.012-0.023-0.0260.023
-0.018-0.030-0.0220.030
-0.029-0.0420.0020.011
-0.0040.021
-0.030-0.1000.001
-0.0010.0510.012
-0.008
***
********
*****************
*****
****
-0.057-0.053
******
0.002-0.062-0.012-0.042-0.039-0.049-0.022-0.073-0.064-0.0950.012
-0.030-0.092-0.046-0.0680.0300.058
-0.034-0.1100.0030.0330.024
-0.003-0.025
*********
*********
*********************
***
-0.039-0.037
******
******
0.019-0.079-0.001-0.012-0.032-0.0260.001
-0.055-0.039-0.0270.010
-0.033-0.0500.002
-0.014-0.0040.021
-0.030-0.105-0.0100.0110.0170.009
-0.037
**
********
*********
******
*******
*****
-0.008-0.008
0.031-0.0720.009
-0.003-0.012-0.0150.025
-0.009-0.011-0.0010.008
-0.014-0.007-0.0030.017
-0.0120.013
-0.024-0.0680.0030.0130.0460.007
-0.001
***
***
***
******
*****
***
Country (I) (II) (III) (IV) (V)
Table A19: Differences in probability of being in top decile between earlier immigrants and natives.
Tables Appendix - EuropeTables Appendix - Europe

72 73
Table A20: Distribution of immigrants across occupation (percentage by row)immigrants and natives.
The table reports, for each country, the percent distribution of immigrant workers aged 25-64 across one-digit ISCO occupations. Each column reports the share of immigrants employed in the corresponding one-digit occupation among all immigrants in that country. Occupations are: (I) Managers, (II) Professionals, (III) Technicians and Associate Professionals, (IV) Clerical Support Workers, (V) Service and Sales Workers, (VI) Skilled Agricultural, Forestry and Fishery Workers, (VII) Craft and Related Tradeworkers, (VIII) Plant and Machine Workers, (IX) Elementary Workers. Immigrants are defined as foreign-born, except for Germany where they are defined as foreign nationals. Source: our elaboration on EU LFS data 2019.
EU15All
AustriaBelgiumBulgariaSwitzerlandCyprusCzech RepublicGermanyDenmarkEstoniaSpainFinlandFranceGreeceCroatiaHungaryIrelandIcelandItalyLituaniaLuxembourgLatviaMaltaNetherlandsNorwayPolandPortugalRomaniaSwedenSloveniaSlovak RepublicUnited Kingdom
55
2017
1110
66
2020
11
1112
89
1819
48
1584542
10216175762
104
1019
55579458
10
171826261317132517
82216
515242421
522471521242323194925
91528
10102114
814121212
61314
311131212
78
115
1714101110
812
81410
77788585665568482444499659056
107
20132215191817211330251724191919262413101616182616221325131517
1001111102213321221110113141020
1412
812131215
514121013191312
9141813
616101011171112
92715
6
910
054
1610
716
7899
1012
789
144
12458
11607
1717
9
2020
11030112121122715173012
8131029141220
515
98
146
1114
412
Country (I) (II) (III) (IV) (V) (VI) (VII) (VIII) (IX)
The table reports, for each country, the difference between immigrants and natives aged 25-64 in the probability of being an essential worker, according to the guidelines provided by the European Commission 28/03/2020, overall (unconditional) and when differences in age, gender and education characteristics are taken into account (conditional). The differences are computed as coefficients on an immigrant dummy in a linear regression model. See Technical Appendix for details. *, **, *** indicate that the difference is statistically significant at the 10, 5 and 1 percent significance level, respectively. The two bottom rows report the mean values for EU15 countries as well as for all countries. Immigrants are defined as foreign-born, except for Germany where they are defined as foreign nationals. Source: our elaboration on EU LFS data 2019.
Table A21: Differences in probability of being an essential worker between immigrants and natives.
AustriaBelgiumCroatiaCyprusCzech RepublicDenmarkEstoniaFinlandFranceGermanyGreeceHungaryIcelandIrelandItalyLatviaLithuaniaLuxembourgNetherlandsNorwayPortugalRomaniaSlovak RepublicSpainSwedenSwitzerlandUnited Kingdom
0.0230.026
-0.0310.036
-0.0010.0510.0510.0010.0270.058
-0.041-0.0510.0570.0390.1070.0380.063
-0.0530.0050.070
-0.006-0.003-0.0050.0120.1110.0120.084
-0.0190.028
-0.0370.035
-0.0200.0560.0180.0140.0140.051
-0.052-0.0690.0520.0450.127
-0.0400.018
-0.0670.0060.080
-0.003-0.008-0.0260.0330.1070.0120.078
*********
******
*********************
******
***
*******
***********
***
******************
***
***
**********
Unconditional ConditionalCountry
EU15All
0.0530.050
******
0.0570.053
******
Tables Appendix - EuropeTables Appendix - Europe

74 75
0.013-0.006-0.086-0.0570.0350.030
-0.020-0.0360.0210.050
-0.036-0.0380.0610.0000.1180.0230.055
-0.072-0.0070.019
-0.038-0.0500.0260.0070.0720.0170.056
*
*****
**
**********
***
***
***
********
0.007-0.008-0.085-0.0460.0190.018
-0.046-0.0240.0040.047
-0.027-0.0570.0640.0100.135
-0.0190.031
-0.089-0.0100.032
-0.031-0.0430.0100.0280.0520.0150.056
*
*****
**
**********
***
***
***
********
Unconditional Conditional
0.0330.054
-0.0220.124
-0.0450.0640.0580.0290.0290.066
-0.042-0.0770.0480.1220.1010.0400.0640.0280.0100.1230.0050.007
-0.0670.0140.1280.0030.104
******
***
******
***********
******
***
***
*
***
***
0.0320.062
-0.0300.117
-0.0670.0810.0230.0420.0180.055
-0.058-0.0920.0290.1190.124
-0.0430.016
-0.0020.0140.1320.0060.000
-0.0980.0360.1330.0060.093
***************
*********
******
***
********
***
Unconditional Conditional
The table reports, for each country, and separately for EU and non-EU immigrants, the difference in probability of being an essential worker, according to the guidelines provided by the European Commission 28/03/2020, between immigrants and natives aged 25-64, unconditional (column I and III) and conditional (column II and IV), when differences in age, gender and education characteristics are also taken into account. The differences are computed as coefficients on an immigrant dummy in a linear regression model. See Technical Appendix for details. *, **, *** indicate that the difference is statistically significant at the 10, 5 and 1 percent significance level, respectively. The two bottom rows report the mean values for EU15 countries as well as for all countries. Immigrants are defined as foreign-born, except for Germany where they are defined as foreign nationals. Source: our elaboration on EU LFS data 2019.
0.0430.039
******
0.0460.042
******
0.0610.057
******
0.0640.060
******
EU15All
AustriaBelgiumCroatiaCyprusCzech RepublicDenmarkEstoniaFinlandFranceGermanyGreeceHungaryIcelandIrelandItalyLatviaLithuaniaLuxembourgNetherlandsNorwayPortugalRomaniaSlovak RepublicSpainSwedenSwitzerlandUnited Kingdom
Country
EU NON - EU
Table A22: Differences in probability of being an essential worker between immigrants and natives, by origin.
0.0740.068
******
0.0220.029
-0.0910.1350.0180.0150.073
-0.0930.0380.114
-0.078-0.089-0.0020.0650.115
-0.2020.033
-0.074-0.1170.046
-0.106-0.070-0.1230.0180.0990.0470.104
*
***
********
********
******
***
***
*********
0.0760.071
******
0.0210.033
-0.0900.134
-0.0060.0260.064
-0.0710.0450.099
-0.086-0.095-0.0080.0650.144
-0.1360.072
-0.123-0.1160.093
-0.089-0.077-0.0990.0350.0990.0350.096
*
***
********
*******
******
***
**
********
Unconditional Conditional
0.0500.046
******
0.0230.025
-0.030-0.004-0.0050.0600.0490.0100.0250.040
-0.039-0.0430.0670.0300.1060.0460.065
-0.0440.0160.0700.0120.0070.0280.0110.1140.0010.079
******
******
********************
******
***
***
***
0.0530.049
******
0.0180.026
-0.0360.000
-0.0220.0640.0130.0220.0110.035
-0.051-0.0630.0640.0370.126
-0.0360.014
-0.0630.0170.0790.0120.002
-0.0050.0320.1100.0040.073
*******
***
******************
***
***
******
***
Unconditional Conditional
The table reports, for each country, and separately for recent and earlier immigrants, the difference in probability of being an essential worker, according to the guidelines provided by the European Commission 28/03/2020, between immigrants and natives aged 25-64, unconditional (column I and III) and conditional (column II and IV), when differences in age, gender and education characteristics are also taken into account. The differences are computed as coefficients on an immigrant dummy in a linear regression model. See Technical Appendix for details. *, **, *** indicate that the difference is statistically significant at the 10, 5 and 1 percent significance level, respectively. The two bottom rows report the mean values for EU15 countries as well as for all countries. Immigrants are defined as foreign-born, except for Germany where they are defined as foreign nationals. Source: our elaboration on EU LFS data 2019.
EU15All
AustriaBelgiumCroatiaCyprusCzech RepublicDenmarkEstoniaFinlandFranceGermanyGreeceHungaryIcelandIrelandItalyLatviaLithuaniaLuxembourgNetherlandsNorwayPortugalRomaniaSlovak RepublicSpainSwedenSwitzerlandUnited Kingdom
Country
RECENT EARLIER
Table A23: Differences in probability of being an essential worker between immigrants and natives, by years of residence.
Tables Appendix - EuropeTables Appendix - Europe

76 77
0.0670.061
******
0.0220.0290.0470.1350.0180.1140.0150.0730.018
-0.0930.038
-0.078-0.091-0.0890.065
-0.0020.1150.033
-0.074-0.202-0.1170.046
-0.106-0.0700.099
-0.1230.104
*
******
***
**
******
***
********
***
*********
0.0700.064
******
0.0210.0330.0350.134
-0.0060.0990.0260.0640.035
-0.0710.045
-0.086-0.090-0.0950.065
-0.0080.1440.072
-0.123-0.136-0.1160.093
-0.089-0.0770.099
-0.0990.096
*
*****
***
**
******
***
*******
***
********
Unconditional Conditional
0.0370.033
******
0.0230.0250.001
-0.004-0.0050.0400.0600.0490.0110.0100.025
-0.039-0.030-0.0430.0300.0670.1060.065
-0.0440.0460.0160.0700.0120.0070.1140.0280.079
*****
*********
************************
***
***
***
0.0400.036
******
0.0180.0260.0040.000
-0.0220.0350.0640.0130.0320.0220.011
-0.051-0.036-0.0630.0370.0640.1260.014
-0.063-0.0360.0170.0790.0120.0020.110
-0.0050.073
*****
******
***
*****************
***
***
***
***
Unconditional Conditional
The table reports, for each country, and separately for recent and earlier EU immigrants, the difference in probability of being an essential worker, according to the guidelines provided by the European Commission 28/03/2020, between immigrants and natives aged 25-64, unconditional (column I and III) and conditional (column II and IV), when differences in age, gender and education characteristics are also taken into account. The differences are computed as coefficients on an immigrant dummy in a linear regression model. See Technical Appendix for details. *, **, *** indicate that the difference is statistically significant at the 10, 5 and 1 percent significance level, respectively. The two bottom rows report the mean values for EU15 countries as well as for all countries. Immigrants are defined as foreign-born, except for Germany where they are defined as foreign nationals. Source: our elaboration on EU LFS data 2019.
EU15All
AustriaBelgiumCroatiaCyprusCzech RepublicDenmarkEstoniaFinlandFranceGermanyGreeceHungaryIcelandIrelandItalyLatviaLithuaniaLuxembourgNetherlandsNorwayPortugalRomaniaSlovak RepublicSpainSwedenSwitzerlandUnited Kingdom
Country
EU - RECENT EU - EARLIER
Table A24: Differences in probability of being an essential worker between EU immigrants and natives, by years of residence.
Table A25: Differences in probability of being an essential worker between immigrants and natives, by years of residence.
The table reports, for each country, and separately for recent and earlier Non-EU immigrants, the difference in probability of being an essential worker, according to the guidelines provided by the European Commission 28/03/2020, between immigrants and natives aged 25-64, unconditional (column I and III) and conditional (column II and IV), when differences in age, gender and education characteristics are also taken into account. The differences are computed as coefficients on an immigrant dummy in a linear regression model. See Technical Appendix for details. *, **, *** indicate that the difference is statistically significant at the 10, 5 and 1 percent significance level, respectively. The two bottom rows report the mean values for EU15 countries as well as for all countries. Immigrants are defined as foreign-born, except for Germany where they are defined as foreign nationals. Source: our elaboration on EU LFS data 2019.
0.0800.074
******
0.0160.0680.2450.2590.0410.0120.093
-0.1080.0640.117
-0.103-0.1740.0480.1150.086
-0.1930.0540.074
-0.123-0.064-0.099-0.331-0.2030.0340.0900.0530.128
*****
*********
********
****
*********
*******
0.0810.076
******
0.0150.0790.2730.2600.0020.0340.087
-0.0780.0710.093
-0.114-0.1740.0170.1070.124
-0.1310.0920.006
-0.124-0.015-0.080-0.337-0.2040.0510.1000.0450.112
******
**********
******
***
*********
***
***
Unconditional Conditional
0.0580.055
******
0.0350.052
-0.0240.047
-0.0600.0770.0560.0450.0250.052
-0.039-0.0370.0470.1270.1020.0480.065
-0.0070.0210.1290.0290.0440.0260.0120.139
-0.0080.099
******
**********
********
******
***
******
***
***
0.0610.057
******
0.0340.058
-0.0320.044
-0.0790.0920.0180.0560.0130.043
-0.056-0.0590.0320.1260.123
-0.0400.011
-0.0200.0260.1370.0260.036
-0.0260.0340.142
-0.0020.089
***************
*
********
******
*******
******
***
Unconditional Conditional
EU15All
AustriaBelgiumCroatiaCyprusCzech RepublicDenmarkEstoniaFinlandFranceGermanyGreeceHungaryIcelandIrelandItalyLatviaLithuaniaLuxembourgNetherlandsNorwayPortugalRomaniaSlovak RepublicSpainSwedenSwitzerlandUnited Kingdom
Country
NON - EU – RECENT NON - EU – EARLIER
Tables Appendix - EuropeTables Appendix - Europe

78 79
Table A26: Differences in probability of being employed in a teleworkable occupation between immigrants and natives.
The table reports, for each country, the difference in probability of being employed in a teleworkable occupation, according to an indicator based on the INAPP survey “Indagine Campionaria sulle professioni” (see Technical Appendix for details), between immigrants and natives aged 25-64, unconditional (column I) and conditional (column II), when differences in age, gender and education characteristics are also taken into account. We use a standardised version of our teleworkability index as our dependent variable. The differences are computed as coefficients on an immigrant dummy in a linear regression model. See Technical Appendix for details. *, **, *** indicate that the difference is statistically significant at the 10, 5 and 1 percent significance level, respectively. The two bottom rows report the mean values for EU15 countries as well as for all countries. Immigrants are defined as foreign-born, except for Germany where they are defined as foreign nationals. Source: our elaboration on EU LFS data 2019.
EU15All
AustriaBelgiumCroatiaCyprusCzech RepublicDenmarkEstoniaFinlandFranceGermanyGreeceHungaryIcelandIrelandItalyLatviaLithuaniaLuxembourgNetherlandsNorwayPortugalRomaniaSlovak RepublicSpainSwedenSwitzerlandUnited Kingdom
Country
-0.246-0.236
******
-0.185-0.179
******
-0.247-0.150-0.092-0.223-0.047-0.152-0.104-0.172-0.142-0.353-0.371-0.010-0.185-0.113-0.466-0.160-0.0400.148
-0.097-0.207-0.0130.7250.055
-0.345-0.227-0.172-0.099
--0.211-0.074-0.053-0.157-0.116-0.129-0.101-0.057-0.080-0.259-0.115-0.099-0.189-0.137-0.296-0.0470.0340.026
-0.075-0.150-0.1190.1130.005
-0.203-0.198-0.107-0.150
***********
******************
**********
*********
***
************
******
***********
*********************
*********
************
Unconditional Conditional
The table reports, for each country, and separately for EU and non-EU immigrants, the difference in probability of being employed in a teleworkable occupation, according to our indicator based on the survey by INAPP “Indagine Campionaria sulle professioni” (2011), between immigrants and natives aged 25-64, unconditional (column I and III) and conditional (column II and IV), when differences in age, gender and education characteristics are also taken into account. We use a standardised version of our teleworkability index as our dependent variable. The differences are computed as coefficients on an immigrant dummy in a linear regression model. See Technical Appendix for details. *, **, *** indicate that the difference is statistically significant at the 10, 5 and 1 percent significance level, respectively. The two bottom rows report the mean values for EU15 countries as well as for all countries. Immigrants are defined as foreign-born, except for Germany where they are defined as foreign nationals. Source: our elaboration on EU LFS data 2019.
Table A27: Differences in probability of being employed in a teleworkable occupation between immigrants and natives, by origin.
-0.201-0.185
******
-0.114-0.0460.158
-0.2370.1080.0470.169
-0.183-0.080-0.332-0.1240.099
-0.166-0.101-0.4040.2220.0620.1700.038
-0.1350.0800.6590.150
-0.196-0.023-0.097-0.150
***
*****
**********************
***
************
******
-0.165-0.155
******
-0.155-0.0180.056
-0.1930.056
-0.0010.028
-0.076-0.052-0.249-0.0790.029
-0.172-0.102-0.3230.3680.1110.051
-0.003-0.109-0.0530.2760.131
-0.125-0.076-0.064-0.166
***
*****
**********************
***
************
******
Unconditional Conditional
-0.273-0.270
******
-0.371-0.246-0.134-0.210-0.230-0.282-0.131-0.165-0.164-0.377-0.419-0.213-0.223-0.138-0.499-0.211-0.0510.058
-0.153-0.282-0.0440.740
-0.134-0.410-0.319-0.296-0.062
***********************************************
***********
************
-0.196-0.195
******
-0.262-0.127-0.071-0.122-0.318-0.213-0.117-0.045-0.093-0.263-0.121-0.334-0.221-0.216-0.271-0.1050.0250.006
-0.105-0.189-0.1430.076
-0.245-0.238-0.254-0.186-0.135
*******************
*********************
*********
***************
Unconditional Conditional
EU15All
AustriaBelgiumCroatiaCyprusCzech RepublicDenmarkEstoniaFinlandFranceGermanyGreeceHungaryIcelandIrelandItalyLatviaLithuaniaLuxembourgNetherlandsNorwayPortugalRomaniaSlovak RepublicSpainSwedenSwitzerlandUnited Kingdom
Country
EU NON - EU
Tables Appendix - EuropeTables Appendix - Europe

80 81
The table reports, for each country, and separately for recent and earlier immigrants, the difference in probability of being employed in a teleworkable occupation, according to our indicator based on the survey by INAPP “Indagine Campionaria sulle professioni” (2011), between immigrants and natives aged 25-64, unconditional (column I and III) and conditional (column II and IV), when differences in age, gender and education characteristics are also taken into account. We use a standardised version of our teleworkability index as our dependent variable. The differences are computed as coefficients on an immigrant dummy in a linear regression model. See Technical Appendix for details. *, **, *** indicate that the difference is statistically significant at the 10, 5 and 1 percent significance level, respectively. The two bottom rows report the mean values for EU15 countries as well as for all countries. Immigrants are defined as foreign-born, except for Germany where they are defined as foreign nationals. Source: our elaboration on EU LFS data 2019.
Table A28: Differences in probability of being employed in a teleworkable occupation between immigrants and natives, by years of residence.
-0.160-0.142
******
-0.184-0.073-0.272-0.1730.145
-0.1930.6620.065
-0.004-0.310-0.142-0.133-0.450-0.012-0.481-0.3260.4290.413
-0.034-0.261-0.0640.994
-0.292-0.074-0.2340.057
-0.075
***
***
******
*****
***
***
******
**
*****
******
-0.144-0.142
******
--0.206-0.021-0.351-0.0470.012
-0.1410.3460.132
-0.026-0.2750.124
-0.163-0.441-0.052-0.205-0.2580.2760.268
-0.031-0.047-0.247-0.125-0.258-0.032-0.203-0.003-0.123
***
*****
***************
*****
***
***
***
***
Unconditional Conditional
-0.260-0.252
******
-0.261-0.169-0.089-0.243-0.081-0.141-0.168-0.193-0.156-0.367-0.3820.018
-0.135-0.146-0.465-0.154-0.0730.027
-0.103-0.205-0.0040.6850.154
-0.378-0.226-0.240-0.105
***********
******************
************
******
*****************
--0.191-0.185
******
-0.210-0.088-0.047-0.191-0.138-0.124-0.142-0.074-0.086-0.250-0.125-0.084-0.140-0.164-0.298-0.0390.016
-0.039-0.079-0.154-0.0970.1480.080
-0.225-0.196-0.142-0.154
******
*********************************
*********
************
Unconditional Conditional
EU15All
AustriaBelgiumCroatiaCyprusCzech RepublicDenmarkEstoniaFinlandFranceGermanyGreeceHungaryIcelandIrelandItalyLatviaLithuaniaLuxembourgNetherlandsNorwayPortugalRomaniaSlovak RepublicSpainSwedenSwitzerlandUnited Kingdom
Country
RECENT EARLIER
-0.176-0.142
******
-0.129-0.072-0.530-0.1670.1910.0060.9620.4820.229
-0.3470.2740.174
-0.473-0.034-0.3010.1960.7070.4060.145
-0.1320.5130.977
-0.0720.1970.0430.109
-0.225
***
***
***
*****
***
************
******
******
-0.154-0.140
******
-0.173-0.045-0.800-0.1820.156
-0.0160.6620.3700.146
-0.2840.3700.053
-0.428-0.042-0.2410.4940.7090.2810.0540.0270.250
-0.1390.0110.135
-0.0490.028
-0.227
***
***
***
******
***
***********
**
***
Unconditional Conditional
-0.205-0.193
******
-0.109-0.0370.212
-0.2550.0930.059
-0.100-0.211-0.110-0.326-0.1460.088
-0.114-0.117-0.4080.222
-0.0110.0740.027
-0.1350.0560.5390.184
-0.242-0.039-0.170-0.125
***
****
**
************
********
**
****
************
-0.167-0.157
******
-0.150-0.0100.123
-0.1940.0390.005
-0.187-0.095-0.072-0.234-0.1030.025
-0.127-0.117-0.3260.3640.0440.000
-0.009-0.116-0.0690.4330.149
-0.157-0.083-0.100-0.147
***
***
*
********
**********
*****
*************
Unconditional Conditional
The table reports, for each country, and separately for recent and earlier EU immigrants, the difference in probability of being employed in a teleworkable occupation, according to our indicator based on the survey by INAPP “Indagine Campionaria sulle professioni” (2011), between immigrants and natives aged 25-64 unconditional (column I and III) and conditional (column II and IV), when differences in age, gender and education characteristics are also taken into account. We use a standardised version of our teleworkability index as our dependent variable. The differences are computed as coefficients on an immigrant dummy in a linear regression model. See Technical Appendix for details. *, **, *** indicate that the difference is statistically significant at the 10, 5 and 1 percent significance level, respectively. The two bottom rows report the mean values for EU15 countries as well as for all countries. Immigrants are defined as foreign-born, except for Germany where they are defined as foreign nationals. Source: our elaboration on EU LFS data 2019.
EU15All
AustriaBelgiumCroatiaCyprusCzech RepublicDenmarkEstoniaFinlandFranceGermanyGreeceHungaryIcelandIrelandItalyLatviaLithuaniaLuxembourgNetherlandsNorwayPortugalRomaniaSlovak RepublicSpainSwedenSwitzerlandUnited Kingdom
Country
EU – RECENT EU – EARLIER
Table A29: Differences in probability of being employed in a teleworkable occupation between EU immigrants and natives, by years of residence.
Tables Appendix - EuropeTables Appendix - Europe

82 83
The table reports, for each country, and separately for recent and earlier Non-EU immigrants, the difference in probability of being employed in a teleworkable occupation, according to our indicator based on the survey by INAPP “Indagine Campionaria sulle professioni” (2011), between immigrants and natives aged 25-64, unconditional (column I and III) and conditional (column II and IV), when differences in age, gender and education characteristics are also taken into account. We use a standardised version of our teleworkability index as our dependent variable. The differences are computed as coefficients on an immigrant dummy in a linear regression model. See Technical Appendix for details. *, **, *** indicate that the difference is statistically significant at the 10, 5 and 1 percent significance level, respectively. The two bottom rows report the mean values for EU15 countries as well as for all countries. Immigrants are defined as foreign-born, except for Germany where they are defined as foreign nationals. Source: our elaboration on EU LFS data 2019.
Table A30: Differences in probability of being employed in a teleworkable occupation between Non-EU immigrants and natives, by years of residence.
-0.144-0.140
******
-0.270-0.0750.095
-0.1770.089
-0.3460.535
-0.045-0.085-0.264-0.237-0.394-0.4120.011
-0.557-0.3880.3790.435
-0.118-0.457-0.1181.004
-0.433-0.185-0.347-0.0690.080
***
***
******
************
***
*****
*****
********
*
-0.133-0.141
******
-0.2580.0130.2870.023
-0.161-0.2370.2120.069
-0.086-0.2590.068
-0.346-0.459-0.059-0.189-0.3470.1980.347
-0.070-0.158-0.293-0.116-0.432-0.099-0.266-0.073-0.014
***
***
***
**********
***
***
***
***
Unconditional Conditional
-0.293-0.290
******
-0.387-0.277-0.136-0.229-0.285-0.267-0.173-0.179-0.172-0.410-0.427-0.139-0.181-0.231-0.496-0.205-0.079-0.231-0.157-0.276-0.0270.7110.069
-0.439-0.311-0.346-0.091
********************************************************
***
************
-0.206-0.203
******
-0.262-0.153-0.074-0.187-0.345-0.206-0.140-0.059-0.095-0.262-0.128-0.328-0.168-0.307-0.273-0.0960.013
-0.218-0.108-0.190-0.1100.096
-0.119-0.254-0.249-0.213-0.158
********************
*********************
************
************
Unconditional Conditional
EU15All
AustriaBelgiumCroatiaCyprusCzech RepublicDenmarkEstoniaFinlandFranceGermanyGreeceHungaryIcelandIrelandItalyLatviaLithuaniaLuxembourgNetherlandsNorwayPortugalRomaniaSlovak RepublicSpainSwedenSwitzerlandUnited Kingdom
Country
NON - EU – RECENT NON - EU – EARLIER
Table B1: Stock of immigrants in Italy by region: overall and, recent immigrants.
Tables Appendix – The Pandemic in Italy
The table reports, for each region, the size of the immigrant population as well as a share of the total population. It also reports the size of the population of recent immigrants, defined as immigrants who have been in the country for at most five years. The bottom row reports the mean values for Italy. Immigrants are defined as foreign-born. Source: our elaboration on IT LFS data 2020, first and second quarter.
5,859,330 9.8
124,69030,106
136,482329,546586,049162,345692,895160,581
1,219,502166,716
20,370440,908202,107
70,941280,241438,429122,384101,193
11,591562,213
9.65.47.15.7
13.213.511.910.512.211.0
6.810.3
5.14.45.7
11.811.511.6
9.311.6
Amount % of population
7,0743,664
10,53332,69257,88811,74052,53712,357
102,94117,944
2,13939,93920,538
7,07723,68537,52212,431
7,2241,007
45,716
612
81010
7888
1111
91010
89
10798
Amount % of immigrants
506,644 9Italy
AbruzzoBasilicataCalabriaCampaniaEmilia RomagnaFriuli Venezia GiuliaLazioLiguriaLombardiaMarcheMolisePiemontePugliaSardegnaSiciliaToscanaTrentino alto AdigeUmbriaValle d’AostaVeneto
Region
STOCK RECENT IMMIGRANTS
Tables Appendix – The Pandemic in ItalyTables Appendix - Europe

84 85
The table reports, for each region, the percentage of immigrants from each area of origin out of the total immigrant population. The bottom row reports the mean values for Italy. Immigrants are defined as foreign-born. Source: our elaboration on IT LFS data 2020, first and second quarter.
Table B2: Area of origin composition of immigrants, by region.
30 25 18
3649472724324023192937373744422932353825
3217133231361525233121242612132936312431
10212515251212
9201217221715201213172120
877
13121122142218
588
21171811
66
16
1568
1289
1029161020
911
79
128
1210
7
% EU% Europe
non-EU% Africa and
the Middle East% Americasand Oceania
% Asia
12 16Italy
AbruzzoBasilicataCalabriaCampaniaEmilia RomagnaFriuli Venezia GiuliaLazioLiguriaLombardiaMarcheMolisePiemontePugliaSardegnaSiciliaToscanaTrentino alto AdigeUmbriaValle d’AostaVeneto
Region
The table reports, for each region, the percentage of immigrants that are female, the percentage of immigrants aged 25 to 64 with at most lower secondary education (ISCED 0-2), the percentage of immigrants aged 25 to 64 with tertiary education (ISCED 5-8) and, by comparison, the corresponding percentages among the native population. The bottom row reports the mean values for Italy. Immigrants are defined as foreign-born. Source: our elaboration on IT LFS data 2020, first and second quarter.
55 49 13
5661535655565458535761555553565755585854
4054645945364254535353506154574942404643
12779
1718161313121412
817
91415111412
3135444528262627313134344744473326263932
2218161625232923232420201618152222261922
% Females% Lower
Secondary Education
% Tertiary Education
% Lower Secondary Education
% Tertiary Education
35 21Italy
AbruzzoBasilicataCalabriaCampaniaEmilia RomagnaFriuli Venezia GiuliaLazioLiguriaLombardiaMarcheMolisePiemontePugliaSardegnaSiciliaToscanaTrentino alto AdigeUmbriaValle d’AostaVeneto
Region
Table B3: Gender composition of immigrants and education rates of natives and immigrants.
IMMIGRANTS NATIVES
Tables Appendix - The Pandemic in Italy Tables Appendix - The Pandemic in Italy

86 87
Table B4: Education composition of immigrant and native populations, by gender.
The table reports, for each region, the percentage of males and females with at most lower secondary education (ISCED 0-2), as well as the percentage of males and females with tertiary education (ISCED 5-8). We find these percentages for both immigrants and natives, aged 25 to 64. The bottom row reports the mean values for Italy. Immigrants are defined as foreign-born. Source: our elaboration on IT LFS data 2020, first and second quarter.
30 25 18 18 18 18 12 16Italy
3745353033272932362934283336454737424849
3232272331252523292327253031444734464540
5252564748366152564562504551687460726662
4943503838364940443646363654515050575147
1815201818202022192119261916141416141415
2224262526252729253228322524191921191722
1099
118
14101310
79
118
15745769
14171618162115201713142016131111
98
1223
% Lower Secondary Education
% Lower Secondary Education
% Lower Secondary Education
% Lower Secondary Education
% TertiaryEducation
% TertiaryEducation
% TertiaryEducation
% TertiaryEducation
Piemonte
Valle d’Aosta
Lombardia
Trentino alto Adige
Veneto
Friuli Venezia Giulia
Liguria
Emilia Romagna
Toscana
Umbria
Marche
Lazio
Abruzzo
Molise
Campania
Puglia
Basilicata
Calabria
Sicilia
Sardegna
Region
NATIVES
MALES FEMALES MALES FEMALES
IMMIGRANTS
420
514
5533
126
175
426
914
4743
11784
213
114
6323
145
297
% Overall % Males % Females
620
910
9510918
22
8281512
88107137
310
18
11201
101
1341
% Overall % Males % Females
AgricultureManufacturingConstructionTradeHospitalityTransportation and StorageICTFinance and insuranceProfessional SupportPublic AdministrationSocial and Health CareOther Services
Sector
Table B5: Stock and percentage of immigrants and natives by sector of employment in 2019.
NATIVES IMMIGRANTS
418201315
212
78
51422
812
31910
8
223182021
1338
% Overall % Males % Females
2574
232
199
30
3463
123
291427
2676
37144
33
% Overall % Males % Females
ManagersProfessionalsTechniciansClerical SupportService WorkersSkilled AgriculturistsCraft WorkersPlant OperatorsElementary Occupations
Occupation
Table B6: Stock and percentage of immigrants and natives by occupation in 2019.
NATIVES IMMIGRANTS
The table reports the amount and percentage distribution of immigrant and native workers aged 25-64 across occupations (at the one-digit ISCO08 classification level), overall and by gender. Source: our elaboration on IT LFS data 2019, all quarters.
The table reports the amount and percentage distribution of immigrant and native workers aged 25-64 across ATECO sectors (at 12 categories), overall and by gender. Source: our elaboration on IT LFS data 2019, all quarters.
Tables Appendix - The Pandemic in Italy Tables Appendix - The Pandemic in Italy

88 89
Table B7: Education composition of immigrant and native populations, by gender.
The table reports, for each region, the percentage of immigrants and natives working in a “sector that was not affected by the lockdown” (as of DPCM 10/04/2020) and the percentage of immigrant and natives that worked in an essential occupation according to the criterion established by the European Commission. The bottom row reports the mean values for Italy. Immigrants are defined as foreign-born. Source: our elaboration on IT LFS data 2019, all quarters.
42 31 58 50Italy
3030344246374737433539443238474241434040
3136303330303231282936333439343036303032
% Overall % Males
4159664555435957474044496048694849515239
5861686156556662545461546066645662616154
% Overall % Males
AbruzzoBasilicataCalabriaCampaniaEmilia RomagnaFriuli Venezia GiuliaLazioLiguriaLombardiaMarcheMolisePiemontePugliaSardegnaSiciliaToscanaTrentino alto AdigeUmbriaValle d’AostaVeneto
Region
ESSENTIAL WORKERS NOT AFFECTED BY THE LOCKDOWN
Table B8: Gap in employment probability, occupational status and being employed in an elementary occupation between immigrants and natives, for different subgroups.
The table reports, for Italy, the percentage point difference between immigrants and natives aged 25-64 in the probability of employment (columns I and II), the difference in occupational status, as measured by the ISEI index (columns III and IV) and in the probability of working in an elementary occupation (columns V and VI). The “unconditional” specification accounts for the trimester of the observation, while the “conditional” specification adds controls for differences in age, gender, region and education characteristics. The differences are computed as coefficients on an immigrant dummy in a linear probability model. See Technical Appendix for details. *, **, *** indicate that the difference is statistically significant at the 10, 5 and 1 percent significance level, respectively. Each row examines the differential for a different subgroup: all immigrants (row I), immigrants that were born in an EU country (EU28 and Norway, Switzerland and United Kingdom) and those that were not (rows II and III); immigrants with no more than (recent) or more than (earlier) five years of residence in Italy (rows IV and V); combinations of area of origin and years of residence (rows VI, VII, VIII and IX), men and women (rows X and XI) and those that have at most lower secondary education (ISCED 0-2), at most higher secondary education (ISCED 3-4) or at least tertiary education (ISCED 5-8) (rows XII, XIII and XIV). Source: our elaboration on IT LFS data 2019, all quarters.
Unconditional Conditional Unconditional Conditional Unconditional Conditional
Employment Differential ISEI Differential Elementary Occupation
All
EU
Non - EU
Recent
Earlier
EU - Recent
EU - Earlier
Non-EU - Recent
Non-EU - Earlier
Male
Female
Low Edu
Intermediate Edu
High Edu
-0.013
0.045-0.024
-0.1820.000
-0.2000.081
-0.175-0.014
0.041-0.038
0.119-0.050-0.125
-0.773
-0.951-0.737
-0.870-0.768
-0.970-0.949
-0.833-0.732
-0.668-0.907
-0.322-0.666-0.920
0.217
0.3140.197
0.3110.212
0.4000.306
0.2790.193
0.1910.250
0.1870.2060.127
-0.028
0.041-0.040
-0.133-0.020
-0.1120.063
-0.140-0.033
0.015-0.067
0.034-0.078-0.156
-0.525
-0.563-0.508
-0.517-0.523
-0.454-0.571
-0.539-0.504
-0.438-0.636
-0.320-0.651-0.909
0.190
0.2650.174
0.2720.185
0.3360.258
0.2480.170
0.1700.210
0.2020.2080.127
***
******
***
******
******
******
*********
***
******
******
******
******
******
*********
***
******
******
******
******
******
*********
***
******
******
******
******
******
*********
***
******
******
******
******
******
*********
***
******
******
******
******
******
*********
Subgroup
Tables Appendix - The Pandemic in Italy Tables Appendix - The Pandemic in Italy

90 91
Table B9: Difference in monthly income (percentage) and in probability of being in the top income decile, bottom income decile between immigrants and natives, by different subgroups.
The table reports, for Italy, the percentage points difference between immigrants and natives aged 25-64 in monthly income (columns I and II), probability of having an income in the top decile of the distribution (columns III and IV), and in the bottom decile of the income distribution (columns V and VI). The “unconditional” specification accounts for the trimester of the observation, while the “conditional” specification adds controls for differences in age, gender, region and education characteristics. The differences are computed as coefficients on an immigrant dummy in a linear probability model. See Technical Appendix for details. *, **, *** indicate that the difference is statistically significant at the 10, 5 and 1 percent significance level, respectively. Each row examines the differential for a different subgroup: all the immigrants (row I), immigrants that were born in an EU country (EU28 and Norway, Switzerland and United Kingdom) and those that were not (rows II and III); immigrants with more or less (earlier or recent) than five years of residence in Italy (rows IV and V); combinations of area of origin and years of residence of a migrant (rows VI, VII, VIII and IX), sex differences (rows X and XI) and for those that have at most lower secondary education (ISCED 0-2), at most higher secondary education (ISCED 3-4) or at least tertiary education (ISCED 5-8) (rows XII, XIII and XIV). Source: our elaboration on IT LFS data 2019, all quarters.
Unconditional Conditional Unconditional Conditional Unconditional ConditionalSubgroup
Income Differential Top Decile Differential Bot Decile Differential
All
EU
Non - EU
Recent
Earlier
EU - Recent
EU - Earlier
Non-EU - Re-cent
Non-EU - Earli-er
Male
Female
Low Edu
Intermediate Edu
High Edu
-0.242
-0.318-0.227
-0.375-0.234
-0.448-0.306
-0.350-0.221
-0.188-0.301
-0.148-0.223-0.258
-0.084
-0.105-0.08
-0.091-0.084
-0.119-0.104
-0.081-0.08
-0.115-0.047
-0.028-0.066-0.129
0.084
0.1020.08
0.1190.082
0.1460.098
0.1090.079
0.0330.141
0.0570.08
0.077
-0.182
-0.238-0.168
-0.227-0.178
-0.267-0.235
-0.213-0.165
-0.144-0.223
-0.142-0.218-0.271
-0.048
-0.057-0.045
-0.006-0.05
-0.016-0.06
-0.003-0.046
-0.067-0.027
-0.027-0.062-0.138
0.069
0.0840.066
0.0810.068
0.0990.082
0.0740.065
0.0310.111
0.0590.0810.083
***
******
***
******
******
******
*********
***
******
******
******
******
******
*********
***
******
******
******
******
******
*********
***
******
******
******
******
******
*********
***
******
******
******
******
******
*********
***
******
******
******
******
******
*********
Table B10: Difference in probability of having a teleworkable occupation, having a temporary contract and being a worker not affected by the lockdown between immigrants and natives in 2019, by different subgroups.
The table reports, for Italy, the percentage points difference between immigrants and natives aged 25-64 in the probability of having a teleworkable occupation (columns I and II), a temporary employment contract (columns III and IV) and being employed in a sector that was not affected by the lockdown (columns V and VI). We use the standardised version of our teleworkability index. The “unconditional” specification accounts for the trimester of the observation, while the “conditional” specification adds controls for differences in age, gender, region and education characteristics. The differences are computed as coefficients on an immigrant dummy in a linear probability model. See Technical Appendix for details. *, **, *** indicate that the difference is statistically significant at the 10, 5 and 1 percent significance level, respectively. Each row examines the differential for a different subgroup: all the immigrants (row I), immigrants that were born in an EU country (EU28 and Norway, Switzerland and United Kingdom) and those that were not (rows II and III); immigrants with more or less (earlier or recent) than five years of residence in Italy (rows IV and V); combinations of area of origin and years of residence of a migrant (rows VI, VII, VIII and IX), sex differences (rows X and XI) and for those that have at most lower secondary education (ISCED 0-2), at most higher secondary education (ISCED 3-4) or at least tertiary education (ISCED 5-8) (rows XII, XIII and XIV). Source: our elaboration on IT LFS data 2019, all quarters.
Unconditional Conditional Unconditional Conditional Unconditional Conditional
Teleworkability Temporary Contract Unaffected by the Lockdown
All
EU
Non - EU
Recent
Earlier
EU - Recent
EU - Earlier
Non-EU - Recent
Non-EU - Earlier
Male
Female
Low Edu
Intermediate Edu
High Edu
-0.466
-0.536-0.452
-0.509-0.464
-0.572-0.533
-0.486-0.450
-0.492-0.441
-0.074-0.505-0.511
0.061
0.0430.065
0.2250.052
0.2090.027
0.2310.057
0.0900.028
0.0510.0670.040
-0.079
-0.148-0.065
-0.067-0.080
-0.121-0.150
-0.047-0.066
-0.128-0.025
0.019-0.042-0.139
-0.320
-0.251-0.326
-0.214-0.323
-0.141-0.260
-0.240-0.329
-0.322-0.326
-0.063-0.521-0.511
0.047
0.0070.054
0.1250.043
0.097-0.001
0.1350.050
0.0750.018
0.0400.0690.052
-0.006
-0.0280.000
0.050-0.009
0.037-0.033
0.055-0.002
-0.0520.046
0.055-0.027-0.134
***
******
******
******
******
******
*********
***
******
******
******
******
******
*********
***
******
******
******
*****
******
*********
***
******
******
******
******
******
*********
***
***
******
***
******
******
*********
***
*****
***
***
******
*********
Subgroup
Tables Appendix - The Pandemic in Italy Tables Appendix - The Pandemic in Italy

92 93
Table B11: Gap in employment probability between immigrants and natives, for workers that were employed one year before the survey.
The table reports, for Italy, the percentage points difference between immigrants and natives aged 25-64 in the probability of being employed, unconditional (column I) and controlling for differences in age, gender, region and education characteristics (column II). The sample includes only observations for individuals that were employed one year before the survey. The differences are computed as coefficients on an immigrant dummy in a linear probability model. See Technical Appendix for details. *, **, *** indicate that the difference is statistically significant at the 10, 5 and 1 percent significance level, respectively. Source: our elaboration on IT LFS data 2020, first and second quarter.
Unconditional ConditionalVariables
Employment Probability
Immigrant
Second Trimester
Constant
ObservationsR-squared
-0.0375(0.00360)
-0.0160(0.00203)
0.950(0.00137)
85,0100.004
-0.0325(0.00365)
-0.0157(0.00201)
0.885(0.00438)
85,0100.022
***
***
***
***
***
***
Table B12: Gap in employment probability between immigrants and natives, for workers that were employed one year before the survey, by sex.
Unconditional ConditionalVariables
Employment Probability
Immigrant
Second Trimester
Women
Immigrant*Women
Constant
ObservationsR-squared
-0.0231(0.00449)
-0.0160(0.00203)
-0.0150(0.00214)
-0.0327(0.00738)
0.957(0.00160)
85,0100.006
-0.0189(0.00454)
-0.0157(0.00201)
-0.0238(0.00216)
-0.0311(0.00737)
0.883(0.00438)
85,0100.022
***
***
***
***
***
***
***
***
***
***
The table reports, for Italy, the percentage points difference between immigrants and natives aged 25-64 in the probability of being employed, interacted with a dummy variable taking value 0 for males and 1 for females, “unconditional” (column I) and controlling for differences in age, gender, region and education characteristics (column II). The sample includes only observations for individuals that were employed one year before the survey. The differences are computed as coefficients on an immigrant dummy in a linear probability model. See Technical Appendix for details. *, **, *** indicate that the difference is statistically significant at the 10, 5 and 1 percent significance level, respectively. Source: our elaboration on IT LFS data 2020, first and second quarter.
Tables Appendix - The Pandemic in Italy
Unconditional ConditionalVariables
Employment Probability
Immigrant
Second Trimester
Intermediate Education
High Education
Immigrant*Intermediate Education
Immigrant*High Education
Constant
ObservationsR-squared
-0.0154(0.00568)
-0.0157(0.00203)
0.0269(0.00279)
0.0489(0.00288)
-0.0259(0.00806)
-0.0277(0.0101)
0.925(0.00253)
85,0100.009
-0.0159(0.00568)
-0.0157(0.00201)
0.0312(0.00280)
0.0570(0.00294)
-0.0288(0.00803)
-0.0309(0.0101)
0.881(0.00446)
85,0100.022
***
***
***
***
***
***
***
***
***
***
***
***
***
***
Table B13: Gap in employment probability between immigrants and natives, for workers that were employed one year before the survey, by education.
The table reports, for Italy, the percentage points difference between immigrants and natives aged 25-64 in the probability of being employed, interacted with a categorical variable taking value 0 for individuals with at most lower secondary education (ISCED 0-2), 1 for individuals with an intermediate education (ISCED 3-4) and 2 for individuals with tertiary education (ISCED 5-8). We run an “unconditional” specification (column I) and one controlling for differences in age, gender, region and education characteristics (column II). The sample includes only observations for individuals that were employed one year before the survey. The differences are computed as coefficients on an immigrant dummy in a linear probability model. See Technical Appendix for details. *, **, *** indicate that the difference is statistically significant at the 10, 5 and 1 percent significance level, respectively. Source: our elaboration on IT LFS data 2020, first and second quarter.
Tables Appendix - The Pandemic in Italy

94 95
Table B14: Gap in employment probability between immigrants and natives, for workers that were employed one year before the survey, by area of origin.
Unconditional ConditionalVariables
Employment Probability
EU Immigrant
Non-European Immigrant
Second Trimester
Constant
ObservationsR-squared
-0.0450(0.00642)
-0.0342(0.00424)
-0.0160(0.00203)
0.950(0.00137)
85,0100.004
-0.0413(0.00638)
-0.0286(0.00431)
-0.0157(0.00201)
0.885(0.00439)
85,0100.022
***
***
***
***
***
***
***
***
The table reports, for Italy, the percentage points difference between immigrants and natives aged 25-64 in the probability of being employed, separating the effect for European and Non-European Immigrants. We run an “unconditional” specification (column I) and one controlling for differences in age, gender, region and education characteristics (column II). The sample includes only observations for individuals that were employed one year before the survey. The differences are computed as coefficients on an immigrant dummy in a linear probability model. See Technical Appendix for details. *, **, *** indicate that the difference is statistically significant at the 10, 5 and 1 percent significance level, respectively. Source: our elaboration on IT LFS data 2020, first and second quarter.
Tables Appendix - The Pandemic in Italy
Unconditional ConditionalVariables
Employment Probability
Immigrant
Second Trimester
Temporary Contract at T0
Immigrant*temporaryT0
Constant
ObservationsR-squared
-0.0273(0.00365)
-0.0156(0.00231)
-0.211(0.00689)
0.0175(0.0157)
0.967(0.00154)
65,9470.073
-0.0237(0.00370)
-0.0152(0.00229)
-0.208(0.00693)
0.0158(0.0157)
0.933(0.00498)
65,9470.087
***
***
***
***
***
***
***
***
***
***
Table B15: Gap in employment probability between immigrants and natives, for workers that were employed one year before the survey, by type of contract one year earlier.
The table reports, for Italy, the percentage points difference between immigrants and natives aged 25-64 in the probability of being employed, interacted with a dummy variable taking value 0 for individuals work under an open-ended contract, and 1 for those that work under a temporary contract. We estimate an “unconditional” specification (column I) and one controlling for differences in age, gender, region and education characteristics (column II). The sample includes only observations for individuals that were employed one year before the survey. The differences are computed as coefficients on an immigrant dummy in a linear probability model. See Technical Appendix for details. *, **, *** indicate that the difference is statistically significant at the 10, 5 and 1 percent significance level, respectively. Source: our elaboration on IT LFS data 2020, first and second quarter.
Tables Appendix - The Pandemic in Italy

96 97
Table B16: Gap in employment probability between immigrants and natives, for workers that were employed one year before the survey, by “not affected by the lockdown”-status one year before the survey.
Unconditional ConditionalVariables
Employment Probability
Immigrant
Second Trimester
Not Affected by the Lockdown at T0
Immigrant*notaffectedT0
Constant
ObservationsR-squared
-0.0317(0.00538)
-0.0159(0.00203)
0.0237(0.00217)-0.00764
(0.00722)0.937
(0.00194)
85,0100.006
-0.0317(0.00540)
-0.0156(0.00201)
0.0199(0.00229)-0.00146
(0.00719)0.878
(0.00449)
85,0100.023
***
***
***
***
***
***
***
***
***
***
The table reports, for Italy, the percentage points difference between immigrants and natives aged 25-64 in the probability of being employed, interacted with a dummy variable taking value 1 for individuals working in a sector that was not affected by the lockdown (using the essential definition provided by the DPCM 10/04/2020), and 0 otherwise. We estimate an “unconditional” specification (column I) and one controlling for differences in age, gender, region and education characteristics (column II). The sample includes only observations for individuals that were employed one year before the survey. The differences are computed as coefficients on an immigrant dummy in a linear probability model. See Technical Appendix for details. *, **, *** indicate that the difference is statistically significant at the 10, 5 and 1 percent significance level, respectively. Source: our elaboration on IT LFS data 2020, first and second quarter.
Tables Appendix - The Pandemic in Italy
Unconditional Unconditional UnconditionalConditional Conditional ConditionalVariables
Employment Probability ISEI Index: Elementary Occupation:
Immigrant
Second Trimester
Year 2020
Immigrant*year2020
Constant
Observations
R-squared
-0.0149
-0.00429
0.00235
-0.00217
-0.00323
-0.00233
-0.0247
-0.00642
0.662
-0.00192
274,328
0.001
-0.777
-0.00964
-0.000969
-0.00557
0.00844
-0.00613
0.00171
-0.0144
0.145
-0.00502
176,301
0.074
0.221
-0.00498
-0.00106
-0.00174
9.80E-05
-0.00164
-0.00719
-0.00746
0.0774
-0.00142
177,826
0.06
-0.0185
-0.00412
0.00251
-0.00197
-0.00485
-0.00209
-0.0195
-0.00606
0.437
-0.00367
274,328
0.18
-0.530
-0.00889
0.00196
-0.00441
-0.00790
-0.00474
0.0289
-0.0129
-0.671
-0.00777
176,301
0.427
0.194
-0.00487
-0.00194
-0.00169
0.00169
-0.00158
-0.00955
-0.00728
0.205
-0.00354
177,826
0.12
***
***
***
***
***
***
***
***
***
**
***
***
***
*
**
***
***
***
Table B17: Difference in differences estimation: effect of the pandemic on employment probability, occupational status (ISEI) and on the probability of being employed in an elementary occupation.
The table reports, for Italy, the percentage points difference between immigrants and natives aged 25-64 in the probability of being employed, in the standardised index of occupational status and in the probability of working in an elementary occupation, interacted with two dummy variables: the first takes value 0 when the year of the observation is 2019 and 1 when it is 2020, the second takes value 0 for males, and 1 for females. For each dependent variable we run an “unconditional” specification (column I, III and V) and one controlling for differences in age, gender, region and education characteristics (column II, IV and VI). The differences are computed as coefficients on an immigrant dummy in a linear probability model. See Technical Appendix for details. *, **, *** indicate that the difference is statistically significant at the 10, 5 and 1 percent significance level, respectively. Source: our elaboration on IT LFS data 2019 and 2020, first and second quarter.
Tables Appendix - The Pandemic in Italy

98 99
Table B18: Difference in differences estimation: effect of the Coronavirus pandemic on monthly income, and probability of being in the top or bottom decile.
The table reports, for Italy, the percentage points difference between immigrants and natives aged 25-64 in the logarithmic transformation of monthly income, as well as in the probability of being in the top or bottom decile of the income distribution, interacted with a dummy variable taking value 0 when the year of the observation is 2019, and 1 when it is 2020. For each dependent variable we run an “unconditional” specification (column I, III and V) and one controlling for differences in age, gender, region and education characteristics (column II, IV and VI). The differences are computed as coefficients on an immigrant dummy in a linear probability model. See Technical Appendix for details. *, **, *** indicate that the difference is statistically significant at the 10, 5 and 1 percent significance level, respectively. Source: our elaboration on IT LFS data 2019 and 2020, first and second quarter.
Unconditional Unconditional UnconditionalConditional Conditional ConditionalVariables
Monthly Income: Top Decile: Bottom Decile:
Immigrant
Second Trimester
Year 2020
Immigrant*year2020
Constant
Observations
R-squared
-0.242
-0.0055
-0.0142
-0.00284
-0.00643
-0.00304
-0.00191
-0.00843
7.187
-0.00248
137,374
0.04
-0.0826
-0.00263
-0.00133
-0.00204
0.00421
-0.00235
-0.00185
-0.00397
0.119
-0.00188
137,374
0.01
0.0832
-0.00426
-0.00256
-0.00186
0.00813
-0.00187
0.0117
-0.00661
0.0729
-0.00155
137,374
0.013
-0.181
-0.00506
-0.0129
-0.00249
-0.0130
-0.00263
0.000159
-0.00771
6.872
-0.0048
137,374
0.27
-0.0465
-0.00269
-0.000813
-0.00192
0.000567
-0.00218
0.000155
-0.00399
-0.0566
-0.00286
137,374
0.131
0.0683
-0.00417
-0.00313
-0.0018
0.0101
-0.00181
0.0116
-0.0064
0.164
-0.00381
137,374
0.077
***
***
**
***
***
*
***
***
***
*
***
***
***
***
***
***
***
***
*
***
*
***
Tables Appendix - The Pandemic in Italy
Unconditional Unconditional UnconditionalConditional Conditional ConditionalVariables
Employment Probability: ISEI Index: Elementary Occupation:
Immigrant
Second Trimester
Year 2020
Immigrant*year2020
Female
Immigrant*Female
Year2020*Female
Immigrant*Female*year2020
Constant
Observations
R-squared
0.0402
-0.00547
0.00234
-0.00212
-0.00365
-0.003
-0.00585
-0.00824
-0.189
-0.0031
-0.0825
-0.00814
0.000661
-0.00457
-0.0326-0.0121
0.756
-0.00229
274,328
0.048
-0.682
-0.0122
-0.00117
-0.00557
0.00367
-0.00794
0.0243
-0.0184
0.0587
-0.00845
-0.215
-0.0196
0.0112
-0.0125
-0.0573-0.0293
0.120
-0.00605
176,301
0.076
0.200
-0.00666
-0.00101
-0.00174
0.00196
-0.00218
-0.0173
-0.0099
0.00362
-0.00225
0.0478
-0.01
-0.00437
-0.00331
0.0251-0.015
0.0758
-0.00169
177,826
0.061
0.0365
-0.00556
0.0025
-0.00197
-0.00427
-0.00283
-0.00757
-0.00828
-0.199
-0.00285
-0.101
-0.00804
-0.00118
-0.00418
-0.0209-0.012
0.427
-0.00378
274,328
0.182
-0.426
-0.0111
0.00171
-0.0044
-0.0102
-0.00617
0.0385
-0.0164
-0.154
-0.00656
-0.232
-0.0176
0.00527
-0.00961
-0.0284-0.0262
-0.688
-0.00799
176,301
0.429
0.171
-0.00651
-0.00189
-0.00169
0.00312
-0.00213
-0.0177
-0.00967
0.0304-
0.00219
0.0500
-0.00974
-0.00335
-0.00317
0.0203-0.0147
0.208
-0.00357
177,826
0.121
***
***
***
***
***
***
***
***
*
***
***
*
***
***
*
***
***
***
***
*
***
***
*
**
***
***
***
***
*
***
***
***
Table B19: Difference in differences estimation: effect of the pandemic on employment probability, occupational status (ISEI) and on the probability of being employed in an elementary occupation, sex heterogeneous effects.
The table reports, for Italy, the percentage points difference between immigrants and natives aged 25-64 in the probability of being employed, in the standardised index of occupational status and in the probability of working in an elementary occupation, interacted with two dummy variables: the first takes value 0 when the year of the observation is 2019 and 1 when it is 2020, the second takes value 0 for males, and 1 for females. For each dependent variable we run an “unconditional” specification (column I, III and V) and one controlling for differences in age, gender, region and education characteristics (column II, IV and VI). The differences are computed as coefficients on an immigrant dummy in a linear probability model. See Technical Appendix for details. *, **, *** indicate that the difference is statistically significant at the 10, 5 and 1 percent significance level, respectively. Source: our elaboration on IT LFS data 2019 and 2020, first and second quarter.
Tables Appendix - The Pandemic in Italy

100 101
Table B20: Difference in differences estimation: effect of the Coronavirus pandemic on monthly income, and probability of being in the top or bottom decile, sex heterogeneous effects.
Unconditional Unconditional UnconditionalConditional Conditional ConditionalVariables
Employment Probability: ISEI Index: Elementary Occupation:
Immigrant
Second Trimester
Year 2020
Immigrant*year2020
Female
Immigrant*Female
Year2020*Female
Immigrant*Female*year2020
Constant
Observations
R-squared
-0.197
-0.0064
-0.0146
-0.00273
-0.0126
-0.0036
-0.00698
-0.0099
-0.234
-0.00399
-0.0985
-0.0105
0.0124
-0.00598
0.00229-0.0163
7.295
-0.00273
137,374
0.116
-0.114
-0.00425
-0.00131
-0.00202
0.00271
-0.00367
-0.00219
-0.00628
-0.104
-0.00302
0.0685
-0.00502
0.00283
-0.0045
0.000234-0.00761
0.167
-0.00268
137,374
0.033
0.0413
-0.00438
-0.00234
-0.00183
0.00918
-0.00186
0.0104
-0.00709
0.0840
-0.00256
0.0922
-0.00863
-0.0019
-0.00385
0.00814-0.0134
0.0343
-0.00148
137,374
0.046
-0.131
-0.00616
-0.0131
-0.00248
-0.0176
-0.00322
-0.00686
-0.00948
-0.298
-0.00363
-0.108
-0.0101
0.0101
-0.00536
0.013-0.0157
6.866
-0.00486
137,374
0.272
-0.0758
-0.00421
-0.000713
-0.00191
-0.000184
-0.00341
-0.00164
-0.00613
-0.139
-0.00293
0.0636
-0.0051
0.00161
-0.00425
0.00583-0.00768
-0.0508
-0.00318
137,374
0.133
0.0249
-0.00441
-0.00299
-0.00179
0.0106
-0.00187
0.0106
-0.00703
0.103
-0.00258
0.0941
-0.00854
-0.00117
-0.00376
0.00485-0.0133
0.172
-0.00375
137,374
0.081
***
***
***
***
***
**
***
***
***
***
***
***
***
***
***
***
***
***
***
***
***
*
***
***
***
***
***
***
*
***
***
***
***
The table reports, for Italy, the percentage points difference between immigrants and natives aged 25-64 in the logarithmic transformation of monthly income, as well as in the probability of being in the top or bottom decile of the income distribution, interacted with two dummy variables: the first takes value 0 when the year of the observation is 2019 and 1 when it is 2020, the second takes value 0 for males, and 1 for females. For each dependent variable we run an “unconditional” specification (column I, III and V) and one controlling for differences in age, gender, region and education characteristics (column II, IV and VI). The differences are computed as coefficients on an immigrant dummy in a linear probability model. See Technical Appendix for details. *, **, *** indicate that the difference is statistically significant at the 10, 5 and 1 percent significance level, respectively. Source: our elaboration on IT LFS data 2019 and 2020, first and second quarter.
Tables Appendix - The Pandemic in Italy
Unconditional Unconditional UnconditionalConditional Conditional ConditionalVariables
Employment Probability: ISEI Index: Elementary Occupation:
Immigrant
Second Trimester
Year 2020
Immigrant*year2020
Intermediate Education
Higher Education
Immigrant*interEdu
Immigrant*highEdu
Year2020*interEdu
Year2020*highEdu
Immigrant*year2020*interEdu
Immigrant*year2020*highEdu
Constant
Observations
R-squared
0.119
-0.00645
0.00229
-0.00211
-0.00589
-0.00412
-0.0198
-0.00966
0.217
-0.00359
0.331
-0.00397
-0.171
-0.00935
-0.253
-0.0125
-0.000411
-0.00532
0.00134
-0.00585
-0.00106-0.014
-0.01-0.0189
0.500
-0.00295
274,328
0.064
-0.333
-0.0102
0.00255
-0.00446
0.00128
-0.00738
0.0179
-0.0154
0.580
-0.00673
1.652
-0.00936
-0.324
-0.0164
-0.611
-0.0346
-0.00902
-0.01
-0.0109
-0.0137
-0.0243-0.0245
0.110-0.0522
-0.555
-0.00544
176,301
0.415
0.198
-0.00819
-0.00171
-0.00169
-0.00415
-0.00461
-0.0118
-0.0123
-0.134
-0.00339
-0.182
-0.00317
0.00881
-0.0112
-0.0746
-0.0122
0.00910
-0.00505
0.00544
-0.0047
0.00469-0.0167
0.00247-0.0184
0.188
-0.00323
177,826
0.113
0.0690
-0.00609
0.00246
-0.00196
-0.00518
-0.00371
-0.0188
-0.00899
0.194
-0.00335
0.318
-0.00384
-0.140
-0.00881
-0.218
-0.0122
-0.000343
-0.00488
0.000866
-0.00552
-0.00207-0.0131
-0.0084-0.0181
0.415
-0.00398
274,328
0.184
-0.272
-0.0102
0.00188
-0.00438
-0.00495
-0.00728
0.0214
-0.0153
0.635
-0.00668
1.749
-0.00923
-0.361
-0.0163
-0.670
-0.0345
-0.00519
-0.00987
-0.00543
-0.0134
-0.0315-0.0243
0.103-0.052
-0.741
-0.00816
176,301
0.434
0.202
-0.00814
-0.00188
-0.00169
-0.0042
-0.00456
-0.0108
-0.0122
-0.135
-0.00339
-0.188
-0.00324
0.00851
-0.0111
-0.0753
-0.0121
0.00921
-0.00501
0.00567
-0.00467
0.00462-0.0166
0.00195-0.0183
0.205
-0.00409
177,826
0.121
***
**
***
***
***
***
***
***
***
***
***
***
**
**
***
***
***
***
*
***
***
**
***
***
***
***
***
***
***
***
***
**
***
***
***
***
***
*
***
Table B21: Difference in differences estimation: effect of the pandemic on employment probability, occupational status (ISEI) and on the probability of being employed in an elementary occupation, sex heterogeneous effects.
The table reports, for Italy, the percentage points difference between immigrants and natives aged 25-64 in the probability of being employed, in the standardised index of occupational status and in the probability of working in an elementary occupation, interacted with two variables: the first is a dummy that takes value 0 when the year of the observation is 2019 and 1 when it is 2020, the second is a categorical variable taking value 0 for individuals with at most lower secondary education (ISCED 0-2), 1 for individuals with an intermediate education (ISCED 3-4) and 2 for individuals with tertiary education (ISCED 5-8). For each dependent variable we run an “unconditional” specification (column I, III and V) and one controlling for differences in age, gender, region and education characteristics (column II, IV and VI). The differences are computed as coefficients on an immigrant dummy in a linear probability model. See Technical Appendix for details. *, **, *** indicate that the difference is statistically significant at the 10, 5 and 1 percent significance level, respectively. Source: our elaboration on IT LFS data 2019 and 2020, first and second quarter.
Tables Appendix - The Pandemic in Italy

102 103
Table B22: Difference in differences estimation: effect of the Coronavirus pandemic on monthly income, and probability of being in the top or bottom decile, education heterogeneous effects.
The table reports, for Italy, the percentage points difference between immigrants and natives aged 25-64 in the logarithmic transformation of monthly income, as well as in the probability of being in the top or bottom decile of the income distribution, interacted with two variables: the first is a dummy that takes value 0 when the year of the observation is 2019 and 1 when it is 2020, the second is a categorical variable taking value 0 for individuals with at most lower secondary education (ISCED 0-2), 1 for individuals with an intermediate education (ISCED 3-4) and 2 for individuals with tertiary education (ISCED 5-8). For each dependent variable we run an “unconditional” specification (column I, III and V) and one controlling for differences in age, gender, region and education characteristics (column II, IV and VI). The differences are computed as coefficients on an immigrant dummy in a linear probability model. See Technical Appendix for details. *, **, *** indicate that the difference is statistically significant at the 10, 5 and 1 percent significance level, respectively. Source: our elaboration on IT LFS data 2019 and 2020, first and second quarter.
Unconditional Unconditional UnconditionalConditional Conditional ConditionalVariables
Monthly Income: Top Decile: Bottom Decile:
Immigrant
Second Trimester
Year 2020
Immigrant*year2020
Intermediate Education
Higher Education
Immigrant*interEdu
Immigrant*highEdu
Year2020*interEdu
Year2020*highEdu
Immigrant*year2020*interEdu
Immigrant*year2020*highEdu
Constant
Observations
R-squared
-0.144
-0.00829
-0.0136
-0.00275
-0.0142
-0.00621
0.00301
-0.0127
0.135
-0.00494
0.316
-0.00558
-0.0770
-0.0119
-0.132
-0.017
-7.72E-05
-0.00745
0.0175
-0.00832
-0.00262-0.0183
0.0241-0.0263
7.041
-0.00433
137,374
0.103
-0.0280
-0.00281
-0.00101
-0.00199
-0.000399
-0.00288
0.000221
-0.00415
0.0543
-0.00283
0.197
-0.0046
-0.0306
-0.00485
-0.108
-0.0106
0.00214
-0.0042
0.00616
-0.00676
-0.000272-0.00736
0.0136-0.0164
0.0433
-0.0022
137,374
0.061
0.0525
-0.0069
-0.00281
-0.00185
0.0107
-0.00454
0.00793
-0.0107
-0.0535
-0.00344
-0.0867
-0.00345
0.0304
-0.00957
0.0286
-0.0118
0.000275
-0.00524
-0.00704
-0.00523
0.0055-0.0148
-0.00506-0.0185
0.121
-0.0031
137,374
0.025
-0.112
-0.00751
-0.0130
-0.00248
-0.0200
-0.00554
0.00439
-0.0116
0.191
-0.00441
0.424
-0.00503
-0.105
-0.0108
-0.174
-0.016
0.00268
-0.00666
0.0208
-0.00743
-0.0103-0.0167
0.0134-0.025
6.854
-0.00531
137,374
0.273
-0.00649
-0.00312
-0.0008
-0.00191
-0.00359
-0.00292
0.00115
-0.00451
0.0830
-0.00288
0.249
-0.00451
-0.0483
-0.0051
-0.133
-0.0103
0.00372
-0.00414
0.00835
-0.00642
-0.00369-0.00765
0.0083-0.016
-0.0666
-0.00309
137,374
0.134
0.0477
-0.00667
-0.00311
-0.0018
0.0123
-0.00435
0.0079
-0.0103
-0.0696
-0.00333
-0.120
-0.00346
0.0364
-0.00925
0.0376
-0.0116
-0.000354
-0.00505
-0.0075
-0.00509
0.00802-0.0143
-0.00191-0.0181
0.170
-0.00419
137,374
0.078
***
***
**
***
***
***
***
**
***
***
***
***
***
***
***
***
**
***
***
***
**
***
***
***
***
**
***
***
***
***
***
**
***
***
***
***
***
***
*
***
***
***
***
***
***
Tables Appendix - The Pandemic in Italy
Table B23: Difference in differences estimation: effect of the pandemic on employment probability, occupational status (ISEI) and on the probability of being employed in an elementary occcupation, European origin heterogeneous effects.
The table reports, for Italy, the percentage points difference between immigrants and natives aged 25-64 in the probability of being employed, in the standardised index of occupational status and in the probability of working in an elementary occupation, interacted with two dummy variables: the first takes value 0 when the year of the observation is 2019, and 1 when it is 2020; the second takes value 0 if the observation refers to a native, and 1 if it represents an immigrant that was born in a country of the EU (we add to the 28 countries of the European Union also Norway, Switzerland and the United Kingdom). For each dependent variable we run an “unconditional” specification (column I, III and V) and one controlling for differences in age, gender, region and education characteristics (column II, IV and VI). The differences are computed as coefficients on an immigrant dummy in a linear probability model. See Technical Appendix for details. *, **, *** indicate that the difference is statistically significant at the 10, 5 and 1 percent significance level, respectively. Source: our elaboration on IT LFS data 2019 and 2020, first and second quarter.
Unconditional Unconditional UnconditionalConditional Conditional ConditionalVariables
Employment Probability: ISEI Index: Elementary Occupation:
EU Immigrant
Second Trimester
Year 2020
EU Immigrant*year2020
Constant
Observations
R-squared
-0.0190
(0.00740)
0.00312
(0.00228)
-0.00323
(0.00233)
-0.0276
(0.0110)
0.662
(0.00195)
247,492
0.000
-0.669
(0.0158)
-0.00440
(0.00594)
0.00842
(0.00613)
0.000106
(0.0239)
0.147
(0.00512)
159,771
0.021
0.156
(0.00819)
0.000558
(0.00167)
0.000108
(0.00164)
-0.00235
(0.0123)
0.0765
(0.00140)
161,216
0.014
-0.0245
(0.00713)
0.00325
(0.00205)
-0.00498
(0.00209)
-0.0215
(0.0105)
0.411
(0.00384)
247,492
0.192
-0.481
(0.0140)
-5.11e-06
(0.00461)
-0.00881
(0.00473)
0.0156
(0.0214)
-0.759
(0.00810)
159,771
0.416
0.144
(0.00798)
-0.000377
(0.00161)
0.00165
(0.00158)
-0.00502
(0.0120)
0.208
(0.00350)
161,216
0.084
**
**
***
***
***
***
***
***
**
**
***
***
*
***
***
***
Tables Appendix - The Pandemic in Italy

104 105
Table B24: Difference in differences estimation: effect of the Coronavirus pandemic on monthly income, and probability of being in the top or bottom decile, European origin heterogeneous effects.
The table reports, for Italy, the percentage points difference between immigrants and natives aged 25-64 in the logarithmic transformation of monthly income, as well as in the probability of being in the top or bottom decile of the income distribution, interacted with two dummy variables: the first takes value 0 when the year of the observation is 2019, and 1 when it is 2020; the second takes value 0 if the observation refers to a native, and 1 if it represents an immigrant that was born in a country of the EU (we add to the 28 countries of the European Union also Norway, Switzerland and the United Kingdom). For each dependent variable we run an “unconditional” specification (column I, III and V) and one controlling for differences in age, gender, region and education characteristics (column II, IV and VI). The differences are computed as coefficients on an immigrant dummy in a linear probability model. See Technical Appendix for details. *, **, *** indicate that the difference is statistically significant at the 10, 5 and 1 percent significance level, respectively. Source: our elaboration on IT LFS data 2019 and 2020, first and second quarter.
Unconditional Unconditional UnconditionalConditional Conditional ConditionalVariables
Monthly Income: Top Decile: Bottom Decile:
EU Immigrant
Second Trimester
Year 2020
EU Immigrant*year2020
Constant
Observations
R-squared
-0.201
(0.00931)
-0.0157
(0.00298)
-0.00644
(0.00304)
-0.00186
(0.0145)
7.188
(0.00252)
123,290
0.011
-0.0694
(0.00461)
-0.00180
(0.00225)
0.00421
(0.00235)
0.00196
(0.00708)
0.120
(0.00194)
123,290
0.002
0.0585
(0.00679)
-0.000780
(0.00186)
0.00815
(0.00187)
0.0254
(0.0110)
0.0720
(0.00155)
123,290
0.004
-0.130
(0.00828)
-0.0139
(0.00258)
-0.0134
(0.00263)
-0.00606
(0.0131)
6.836
(0.00501)
123,290
0.264
-0.0270
(0.00460)
-0.000935
(0.00209)
0.000269
(0.00218)
-0.000463
(0.00702)
-0.0761
(0.00314)
123,290
0.135
0.0400
(0.00661)
-0.00151
(0.00180)
0.0101
(0.00181)
0.0266
(0.0106)
0.175
(0.00388)
123,290
0.070
***
***
**
***
***
*
***
***
***
**
***
***
***
**
***
***
***
Tables Appendix - The Pandemic in Italy
Table B25: Difference in differences estimation: effect of the pandemic on employment probability, occupational status (ISEI) and on the probability of being employed in an elementary occupation, Non-European origin heterogeneous effects.
The table reports, for Italy, the percentage points difference between immigrants and natives aged 25-64 in the probability of being employed, in the standardised index of occupational status and in the probability of working in an elementary occupation, interacted with two dummy variables: the first takes value 0 when the year of the observation is 2019, and 1 when it is 2020; the second takes value 0 if the observation refers to a native, and 1 if it represents an immigrant that was born outside of the EU (we add to the 28 countries of the European Union also Norway, Switzerland and the United Kingdom). For each dependent variable we run an “unconditional” specification (column I, III and V) and one controlling for differences in age, gender, region and education characteristics (column II, IV and VI). The differences are computed as coefficients on an immigrant dummy in a linear probability model. See Technical Appendix for details. *, **, *** indicate that the difference is statistically significant at the 10, 5 and 1 percent significance level, respectively. Source: our elaboration on IT LFS data 2019 and 2020, first and second quarter.
Unconditional Unconditional UnconditionalConditional Conditional ConditionalVariables
Employment Probability: ISEI Index: Elementary Occupation:
Non-EU Immigrant
Second Trimester
Year 2020
Non-EU Immigrant*year2020
Constant
Observations
R-squared
-0.0131
(0.00503)
0.00195
(0.00222)
-0.00323
(0.00233)
-0.0235(0.00756)
0.663
(0.00193)
262,676
0.000
-0.824
(0.0113)
-0.00116
(0.00573)
0.00844
(0.00613)
0.00283(0.0169)
0.145
(0.00506)
169,047
0.063
0.249
(0.00607)
-0.00137
(0.00174)
9.60e-05
(0.00164)
-0.00953(0.00909)
0.0775
(0.00142)
170,539
0.060
-0.0155
(0.00485)
0.00202
(0.00200)
-0.00487
(0.00209)
-0.0183(0.00717)
0.430
(0.00374)
262,676
0.184
-0.544
(0.0108)
0.00115
(0.00451)
-0.00807
(0.00473)
0.0355(0.0156)
-0.694
(0.00798)
169,047
0.424
0.216
(0.00597)
-0.00219
(0.00168)
0.00162
(0.00158)
-0.0116(0.00890)
0.203
(0.00355)
170,539
0.121
***
***
***
***
***
***
***
***
**
**
***
***
*
**
***
***
***
Tables Appendix - The Pandemic in Italy

106
Table B26: Difference in differences estimation: effect of the Coronavirus pandemic on monthly income, and probability of being in the top or bottom decile, Non-European origin heterogeneous.
The table reports, for Italy, the percentage points difference between immigrants and natives aged 25-64 in the logarithmic transformation of monthly income, as well as in the probability of being in the top or bottom decile of the income distribution, interacted with two dummy variables: the first takes value 0 when the year of the observation is 2019, and 1 when it is 2020; the second takes value 0 if the observation refers to a native, and 1 if it represents an immigrant that was born outside of the EU (we add to the 28 countries of the European Union also Norway, Switzerland and the United Kingdom). For each dependent variable we run an “unconditional” specification (column I, III and V) and one controlling for differences in age, gender, region and education characteristics (column II, IV and VI). The differences are computed as coefficients on an immigrant dummy in a linear probability model. See Technical Appendix for details. *, **, *** indicate that the difference is statistically significant at the 10, 5 and 1 percent significance level, respectively. Source: our elaboration on IT LFS data 2019 and 2020, first and second quarter.
Unconditional Unconditional UnconditionalConditional Conditional ConditionalVariables
Monthly Income: Top Decile: Bottom Decile:
Non-EU Immigrant
Second Trimester
Year 2020
Non-EU Immigrant*year2020
Constant
Observations
R-squared
-0.260
(0.00648)
-0.0138
(0.00290)
-0.00643
(0.00304)
-0.00158(0.00989)
7.187
(0.00250)
131,049
0.035
-0.0885
(0.00282)
-0.00116
(0.00212)
0.00421
(0.00235)
-0.00341(0.00426)
0.119
(0.00190)
131,049
0.008
0.0944
(0.00523)
-0.00225
(0.00187)
0.00814
(0.00187)
0.00542(0.00801)
0.0728
(0.00155)
131,049
0.012
-0.201
(0.00607)
-0.0124
(0.00253)
-0.0131
(0.00263)
0.00343(0.00919)
6.864
(0.00490)
131,049
0.268
-0.0533
(0.00300)
-0.000605
(0.00198)
0.000506
(0.00218)
0.000515(0.00442)
-0.0614
(0.00296)
131,049
0.132
0.0808
(0.00513)
-0.00288
(0.00181)
0.0101
(0.00181)
0.00467(0.00776)
0.166
(0.00386)
131,049
0.076
***
***
**
***
***
*
***
***
***
***
***
***
***
***
***
***
***
***
***
Tables Appendix - The Pandemic in Italy

108 109
Technical Appendix 1 – Europe
DATASETOur analysis is based on the 2019 yearly wave of the European Labour Force Survey (EU LFS). The EU LFS is conducted in the 28 Member States of the European Union (including the UK), 2 candidate countries and 3 countries of the European Free Trade Association (EFTA). At the moment, the LFS microdata for scientific purposes contain data for all Member States plus Iceland, Norway and Switzerland. These are the countries we use in our analysis. The EU LFS is a large quarterly household survey of people aged 15 and over as well as of persons outside the labour force. The National Statistical Institutes of each member country are responsible for selecting the sample, preparing the questionnaires, conducting the direct interviews among households, and forwarding the results to Eurostat in accordance with the common coding scheme.
SAMPLEWe include in our sample all individuals for which either nationality or country of birth is known (see below). In the analysis of education levels and labour market outcomes we include only individuals in the 25-64 age range. In our analysis of the COVID-19 indicators (i.e., “Essentiality” and “Teleworkability”, see below) we do not include Bulgaria, Malta, Poland and Slovenia, as they do not provide Eurostat with the extension of the variables that we require for our analysis.
VARIABLESWe use the following variables, derived from the EU LFS, in our analysis.
Immigrant: A dummy variable equal to one if individuals are born outside of their country of residence and zero otherwise, based on the original EU LFS variable countryb which records individuals’ country of birth. The variable countryb is equal to one when the individual is born in the residence country (immigrant equals 0 in this case) and takes values higher than one when the individual is born abroad (immigrant equals 1 in these cases): the different codes identify the region of birth and vary across different years and countries. This definition is used in all countries with the exception of Germany, where there is no information on country of birth. In the German case, therefore, we define immigrant status based on nationality, and immigrant takes value one when the EU LFS variable national (which is coded similarly to the variable countryb described above) takes values different from one, and zero when national is equal to one.
Recent immigrant: We define as recent immigrants those with no more than five years of residence in the country, as reported by the variable yearesid.
Education levels: We use the three education groups defined by the variable hatlev1d in the EU
Technical Appendix 1 - Europe
LFS. Low education includes less than primary, primary and lower secondary education (ISCED levels 0-2). Intermediate education corresponds to upper secondary and post-secondary non-tertiary education (ISCED levels 3 and 4). High educated individuals have short-cycle tertiary, bachelor or equivalent or doctoral or equivalent degrees (ISCED levels 5 and higher).Employed: A binary variable which recodes the original EU LFS variable ilostat to one if the individual is employed or self-employed (ilostat equal to one), and zero otherwise (ilostat equal to 2 or 3). We exclude individuals in compulsory military service (ilostat equal to 4) in our analysis of labour market outcomes.
Part time employment: We create a dummy variable, pt, for part time employment using the variable ftpt, provided in EU LFS. It records whether the individual is employed full time (ftpt equal to one), or part time (ftpt equal to 2).
ISEI: The Socio-Economic Index of Occupational Status, a continuous index which scores occupations in relation to their average education and income levels, thus capturing the attributes of occupation that convert education into income. It is assigned to each employed individual by matching three-digit ISCO codes for occupation (isco3d) with their corresponding value of the ISEI index. We then normalize the index by subtracting the sample mean and dividing by the sample standard deviation. The normalization is performed at country level unless differently specified.
Income deciles: The dummy bottom decile is equal to one for individuals whose monthly take home pay from the main job is in the bottom decile of the national distribution, and zero otherwise. Symmetrically, the binary variable top decile takes value one for individuals whose monthly take home pay from the main job is in the top decile of the national income distribution, and zero otherwise. The dummies are based on the EU LFS variable incdecil, which is only recorded for employees.
Essentiality: The dummy essential is equal to one for individuals that were employed in an occupation that the European Commission identified as critical “to protect health and ensure availability of goods and essential services” in its Communication published on 20/03/2020 8, and it is equal to zero for all other occupations. It is assigned to each employed individual by matching their own three-digit ISCO codes for occupation (isco3d).
Teleworkability: In order to measure the chance an individual has to work remotely, we build a teleworkability index. We exploit the Indagine Campionaria sulle professioni (ICP) 9, the Italian equivalent of the Occupational Information Network (O*NetT) 10 in the United States, which provides the characteristics of all the existing professions in the Italian labour market,
8 European Commission, 2020. “Communication from the Commission Guidelines concerning the exercise of the free movement of workers during COVID-19 outbreak”, OJ C 102I , 30.3.2020, p. 12–149 Jointly produced by Inapp and Istat between 2011 and 2012, on all the professions defined by the Istat - CP 2011 classification10 https://www.onetonline.org/

110 111
following, to create a single telework variable. In particular, for each three-digit ISCO occupation, we use seven variables that measure, on a scale from 1 to 100, the frequency with which certain actions need to be taken to carry out the work; we consider the following: a) moving the whole-body; b) directly driving mechanical devices; c) face-to-face interaction with colleagues; d) face-to-face interaction with costumers or the general public; e) physical proximity to other people; f) standing; g) using a computer. We recode all variable so that a higher value indicates a higher feasibility of remote work. We then create the variable telework by taking the average over all the seven variables. Telework therefore is larger, the more an occupation is teleworkable.
WEIGHTSWe use the sampling weights provided in the EU LFS (variable coeff) throughout the analysis. REGRESSION ANALYSISTo obtain employment, essentiality and teleworkability differentials we estimate regressions of the type:
Depvaric= β0+β1 immic+β2 maleic+β3 ageic+β4 age2ic+β5 Deduic +β6 DC+β7 Dr +β8 Dq+ εic (A1)
where Depvar is either the employed dummy the essential dummy or the telework variable. imm stands for the immigrant indicator, male is a dummy for male, age is the age in years and age2 is its square, Dedu are the three education dummies defined above, DC is a set of country dummies, Dr is a set of regional dummies (which we do not include in the specifications where essential and telework are our dependent variable) and Dq are quarter dummies that capture potential seasonality. In some specifications we substitute the imm dummy with a set of dummies for recent and non-recent immigrants, or for EU and non-EU immigrants, as well as with their pairwise combinations. Each of the figures reported in the tables corresponds to the coefficient β1 resulting in each case. We estimate equation (A1) first separately for each country and then for all the EU15 countries pooled, and for the whole sample of countries.
We provide unconditional employment gap estimating equation (A1) including only the variables imm, DC, and Dq; we also estimate the employment gap within a country controlling for region, including Dr, or, alternatively, the gap conditioning on individual characteristics including male, age and Dedu. Finally, we estimate the complete model for conditional gaps (including regional dummies Dr as well as individual characteristics). In addition, we estimate unconditional essentiality and teleworkability gap with equation (A1) including only the variables imm, DC, and Dq, as well as the gap conditioning also on individual characteristics including male, age and Dedu.The sample includes natives and immigrants in working age and who are likely to have finished their full-time education (25-64 years old).
Technical Appendix 1 - Europe
We obtain estimates of differences in occupational status and of the probability of being in the bottom or top income decile by running the same regressions described above, where the
dependent variable is replaced, respectively, with:
- ISEI, the standardized index of occupational status.- Dummy for being in the bottom decile of the national income distribution.- Dummy for being in the top decile of the national income distribution.
In the analysis on position in income distribution, besides estimating unconditional, regional unconditional and regional conditional gaps as described above, we estimate an extra equation by augmenting (A1) with a set of dummies for three-digits ISCO occupations and a dummy for part time employment. The resulting equation is as follows:
Peric= β0+β1 immic+β2 maleic+β3 ageic+β4 age2ic+β5 Deduic +β6 DC+β7 Dr +β8 Dq+ β9 Doccic+β10 ptic+ εic (A1.1)
Where Per is the binary indicator for the corresponding percentile (bottom decile or top decile), Docc represents the vector of occupation dummies and pt is the dummy for part time employment. To assess the impact of individual characteristics, occupation and regional location on the difference in the probability of having a wage in the lowest decile we perform a Gelbach 11 decomposition of the coefficient on immic (Figure 10).
11 Jonah B. Gelbach, 2016. “When Do Covariates Matter? And Which Ones, and How Much?,” Journal of Labor Economics, University of Chicago Press, vol. 34(2), pages 509-543.
Technical Appendix 1 - Europe

112 113
DATASETOur analysis is based on the cross-sectional data of the Italian Labour Force Survey (IT LFS), and includes all quarters from Q1 2010 to Q2 2020.
SAMPLEWe include in our sample all individuals for which either nationality or country of birth is known (see below). In our analysis of education levels and labour market outcomes, we include only individuals aged between 25 and 64 years old.
VARIABLES
We use the following variables, derived from the IT LFS, for our analysis.
Immigrant: A dummy variable equal to one if individuals are born outside of their country of residence and zero otherwise, based on the original IT LFS variable sg13 which records individuals’ country of birth. The variable sg13 is equal to one when the individual is born in Italy (immigrant equals 0 in this case) and takes value two when the individual is born abroad (immigrant equals 1 in these cases).
Recent immigrant: We define as recent immigrants those with five or less years of residence in the country, as reported by the variable sg18b, which records the year in which an individual moved to Italy for the first time.
Education levels: We use the three education groups defined by the variable hatlev in the IT LFS. Low education includes less than primary, primary and lower secondary education (ISCED levels 0-2). Intermediate education corresponds to upper secondary and post-secondary non-tertiary education (ISCED levels 3-4). High educated individuals have short-cycle tertiary, bachelor or equivalent or doctoral or equivalent degrees (ISCED levels 5-8).
Employed: A binary variable which recodes the original IT LFS variable cond3 to one if the individual is employed or self-employed (cond3 equal to one), and zero otherwise (cond3 equal to two or three).
Temporary contract: We create a dummy variable, temporary contract, taking value one for individuals that are employed under a fixed-term contract and zero for those with an open-ended contract. To do so, we exploit the variable c20, that is provided in IT LFS. The variable records whether the individual is hired with an open-ended contract (c20 equal to one), or with a fixed-term contract (c20 equal to two).
Technical Appendix 2 – ItalyISEI: The Socio-Economic Index of Occupational Status, a continuous index which scores occupations in relation to their average education and income levels, thus capturing the attributes of occupation that convert education into income. It is assigned to each employed individual by matching three-digit ISCO codes for occupation (isco3d) with their corresponding value of the ISEI index. We then normalize the index by subtracting the sample mean and dividing by the sample standard deviation.
Monthly wage: this variable is reported in the IT LFS as retric, and takes the value of the individuals’ take home pay the month before the survey. In our regressions, we use its logarithmic transformation.
Income deciles: The dummy bottom decile is equal to one for individuals whose monthly take home pay from the main job is in the bottom decile of the national distribution, and zero otherwise. Symmetrically, the binary variable top decile takes value one for individuals whose monthly take home pay from the main job is in the top decile of the national income distribution, and zero otherwise. The dummies are based on the IT LFS variable incdecil, which is only recorded for employees.
Essentiality: We define a dummy variable essential, which is equal to one for individuals employed in an occupation that the European Commission deemed critical “to protect health and ensure availability of goods and essential services” 12 in its Communication published on 20/03/2020, and it is equal to zero for all individuals employed in other occupations. It is assigned to each employed individual by matching their own three-digit ISCO codes for occupation (isco3d).
Not affected by the lockdown: We define a dummy “not affected by the lockdown”, which takes value one for individuals employed in a four-digit ATECO sector whose activity was not suspended by the DPCM 10/04/2020 of the Italian Government, and zero otherwise 13.
Teleworkability: In order to measure the chance an individual has to work remotely, we build a teleworkability index. We exploit the Indagine Campionaria sulle professioni (ICP)14, which provides us with the characteristics of all the existing professions on the Italian labour market, following the Occupational Information Network (O*NetT)15 that is available for the United States, to create a single telework variable. In particular, for each occupation (which we identify through its three-digit ISCO code) we use seven variables that measure, on a scale from 1 to 100, the frequency with which certain actions need to be taken to carry out the
Technical Appendix 2 - Italy
12 European Commission, 2020. “Communication from the Commission Guidelines concerning the exercise of the free movement of wor kers during COVID-19 outbreak”, OJ C 102I, 30.3.2020, p. 12–1413 Presidenza del Consiglio dei Ministri, 2020. “DECRETO DEL PRESIDENTE DEL CONSIGLIO DEI MINISTRI 10 aprile 2020”, Gazzetta Ufficiale Serie Generale n.97 del 11-04-202014 Jointly produced by Inapp and Istat between 2011 and 2012, on all the professions defined by the Istat - CP 2011 classification15 https://www.onetonline.org/

114 115
work; we consider the following: a) moving the whole-body; b) directly driving mechanical devices; c) face-to-face interaction with colleagues; d) face-to-face interaction with costumers or the general public; e) physical proximity to other people; f) standing; g) using a computer. For each occupation we sum the values of these variables, using a negative sign for those that lower the the chance of a job being feasible remotely (hence a, b, c, d, e and f) and a positive sign for the one that improves it (g). We average them and add 100, to create our telework indicator, which will be larger the more an occupation is teleworkable.
Macro region: We use the three regional groups defined by the variable reg in the IT LFS. This categorical variable takes value one for the regions of southern Italy (Abruzzo, Basilicata, Calabria, Campania, Molise and Puglia) and the Islands (Sardegna and Sicilia), two for the regions of central Italy (Lazio, Marche, Umbria e Toscana), three for those of the north-eastern part of Italy (Emilia Romagna, Friuli Venezia Giulia, Trentino alto Adige and Veneto) and four for those of the north-western area (Liguria, Lombardia, Piemonte and Val d’Aosta).
Elementary Occupation: We define an elementary job dummy, which takes value one when an individual is employed in an elementary occupation, and zero otherwise. We define elementary occupations as those with a one-digit ISCO code equal to nine. We derive the one-digit ISCO codes from the isco3d variable in the IT LFS.
Origin Area: We construct two dummy variables. EU identifies immigrants that were born in a EU country (including also Norway, Switzerland and the United Kingdom) and Non-EU identifies immigrants that were born elsewhere. Both variables are constructed using information from the IT LFS variable nasses (which reports respondents’ country of birth).
Characteristics one year before the survey: Thanks to the variables of the IT LFS which report the employment status (i5) contract (i9) and sector of employment (i11_c, described by the four-digit ATECO code) of an individual one year before the survey, we are able to generate employed at t0, temporary contract at t0 and Affected by the lockdown at t0. Employed at t0 takes value one for individuals that had a job one year before the survey, and zero otherwise. Temporary contract at t0 takes value one if the individual that was employed one year before the survey had a temporary contract, and zero if he/she had an open-ended contract. Affected by the lockdown at t0 takes value one if the sector of employment of the individual one year before the survey was one of those that were later recognized as essential by the DPCM 10/04/2020 of the Italian Government, and zero otherwise.
Technical Appendix 2 - Italy
12 European Commission, 2020. “Communication from the Commission Guidelines concerning the exercise of the free movement of wor-kers during COVID-19 outbreak”, OJ C 102I, 30.3.2020, p. 12–1413 Presidenza del Consiglio dei Ministri, 2020. “DECRETO DEL PRESIDENTE DEL CONSIGLIO DEI MINISTRI 10 aprile 2020”, Gazzetta Ufficiale Serie Generale n.97 del 11-04-2020
WEIGHTSWe use the sampling weights provided in the IT LFS (variable coef) throughout the analysis, divided by ten, in order to obtain values that allow to describe the population correctly.
REGRESSION ANALYSISWe estimate the differential between immigrants and natives for the following dependent variables (which are explained in detail in the previous paragraph):
- probability of employment - occupational prestige (ISEI index)- probability of working in an elementary occupation- probability of being in the top decile of the monthly income distribution- probability of being in the bottom decile of the monthly income distribution- monthly earnings, described by the logarithmic transformation of the variable retric, which describes the gross monthly earnings in the IT LFS- teleworkability- probability of being employed under a temporary contract - probability of being an essential worker, described for the not affected by the lockdown and essential variables
For each of these dependent variables, we estimate a regression of the following type:
Depvari= β0+β1 immi+β2 sexi+β3 agei+β4 age2i+β5 Dedui +β6 Dr+β7 Dq + εic (B1)
where Depvar is each of the described dependent variables, imm stands for the immigrant indicator, sex is a dummy for gender, age is the age in years and age2 is its square, Dedu are the three education dummies defined above, Dr is a set of dummies controlling for each region and Dq are quarter dummies that capture potential seasonality. In some specifications we substitute the imm dummy with a set of dummies for recent and non-recent immigrants, or for EU or non-EU immigrants, as well as with their pairwise combinations. Each of the figures reported in the tables corresponds to the coefficient β1 resulting in each case.
We provide unconditional employment gap estimating equation (B1) including only the variables imm and Dq; we then estimate the complete model for conditional gaps (including regional dummies Dr as well as individual characteristics such as sex, age, age2 and Dedu). The sample includes natives and immigrants in working age and who are likely to have finished their full-time education (25-64 years old).
Technical Appendix 2 - Italy
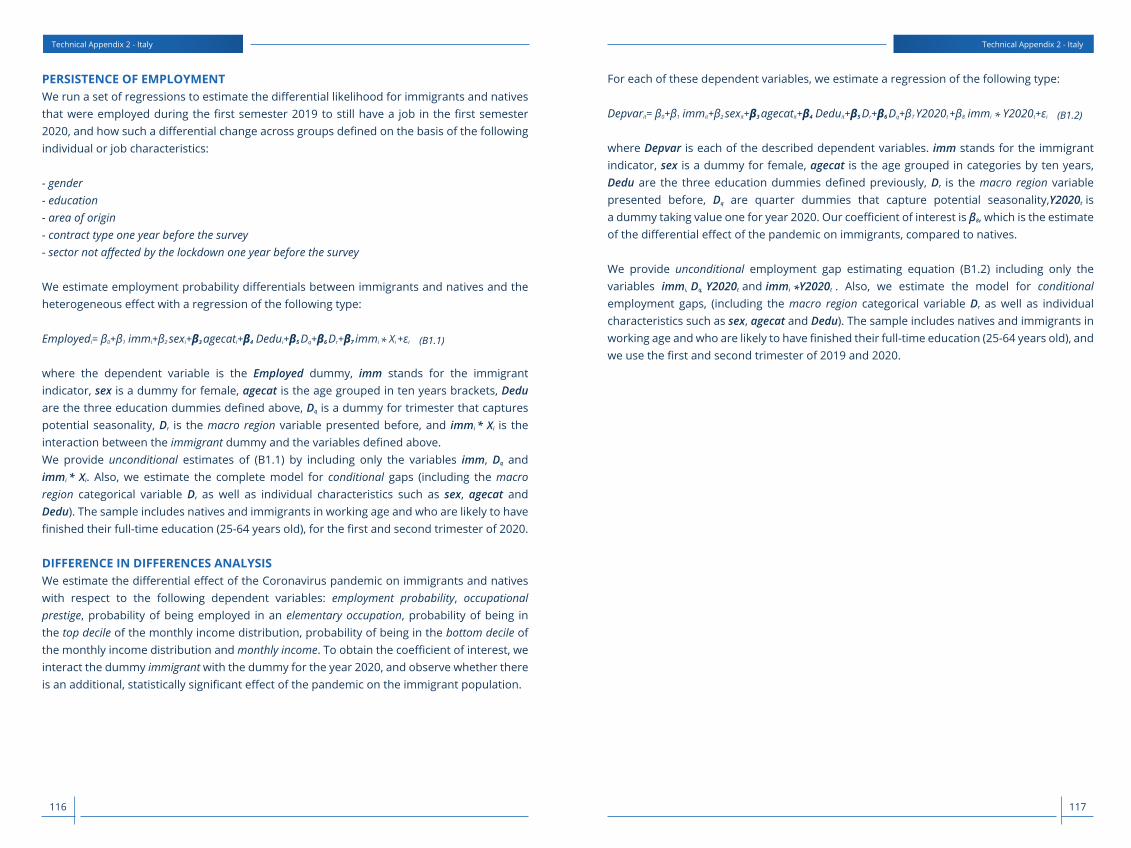
116 117
PERSISTENCE OF EMPLOYMENTWe run a set of regressions to estimate the differential likelihood for immigrants and natives that were employed during the first semester 2019 to still have a job in the first semester 2020, and how such a differential change across groups defined on the basis of the following individual or job characteristics:
- gender- education- area of origin- contract type one year before the survey- sector not affected by the lockdown one year before the survey
We estimate employment probability differentials between immigrants and natives and the heterogeneous effect with a regression of the following type:
Employedi= β0+β1 immi+β2 sexi+β3 agecati+β4 Dedui+β5 Dq+β6 Dr+β7 immi * Xi +εi (B1.1)
where the dependent variable is the Employed dummy, imm stands for the immigrant indicator, sex is a dummy for female, agecat is the age grouped in ten years brackets, Dedu are the three education dummies defined above, Dq is a dummy for trimester that captures potential seasonality, Dr is the macro region variable presented before, and immi * Xi is the interaction between the immigrant dummy and the variables defined above. We provide unconditional estimates of (B1.1) by including only the variables imm, Dq and immi * Xi. Also, we estimate the complete model for conditional gaps (including the macro region categorical variable Dr as well as individual characteristics such as sex, agecat and Dedu). The sample includes natives and immigrants in working age and who are likely to have finished their full-time education (25-64 years old), for the first and second trimester of 2020. DIFFERENCE IN DIFFERENCES ANALYSISWe estimate the differential effect of the Coronavirus pandemic on immigrants and natives with respect to the following dependent variables: employment probability, occupational prestige, probability of being employed in an elementary occupation, probability of being in the top decile of the monthly income distribution, probability of being in the bottom decile of the monthly income distribution and monthly income. To obtain the coefficient of interest, we interact the dummy immigrant with the dummy for the year 2020, and observe whether there is an additional, statistically significant effect of the pandemic on the immigrant population.
Technical Appendix 2 - Italy
For each of these dependent variables, we estimate a regression of the following type:
Depvarit= β0+β1 immit+β2 sexit+β3 agecatit+β4 Deduit+β5 Dr+β6 Dq+β7 Y2020t +β8 immi * Y2020t+εi (B1.2)
where Depvar is each of the described dependent variables. imm stands for the immigrant indicator, sex is a dummy for female, agecat is the age grouped in categories by ten years, Dedu are the three education dummies defined previously, Dr is the macro region variable presented before, Dq are quarter dummies that capture potential seasonality,Y2020t is a dummy taking value one for year 2020. Our coefficient of interest is β8, which is the estimate of the differential effect of the pandemic on immigrants, compared to natives.
We provide unconditional employment gap estimating equation (B1.2) including only the variables immi, Dq, Y2020t and immi *Y2020t . Also, we estimate the model for conditional employment gaps, (including the macro region categorical variable Dr as well as individual characteristics such as sex, agecat and Dedu). The sample includes natives and immigrants in working age and who are likely to have finished their full-time education (25-64 years old), and we use the first and second trimester of 2019 and 2020.
Technical Appendix 2 - Italy

119
Migration Observatory
The Migration Observatory is a Centro Studi Luca d’Agliano - Collegio Carlo Alberto joint research initiative funded by the Compagnia di San Paolo.The main objective is to study analytically topical issues on migration, such as the economic and social impact of immigration on receiving and sending countries or the implications of different migration policies, from an international and cross-disciplinary perspective. Also, it aims to construct a critical mass of academic knowledge in order to increase the visibility of Collegio Carlo Alberto and Centro Studi Luca d’Agliano in the policy debate.
Centro Studi Luca d’Agliano
The Centro Studi Luca d’Agliano was founded in Turin in 1986 by the family of Luca d’Agliano, his friends, and some of his teachers. It is a non-profit research institution contributing original research in the field of international and development economics. Particular emphasis is placed on the training of young scholars and in giving them the opportunity of acquiring a truly international perspective. The activities of the Centro Studi mainly focus on academic research, but it also greatly contributes to the policy debate.
Collegio Carlo Alberto
The Collegio Carlo Alberto is a foundation created in 2004 at the joint initiative of the Compagnia di San Paolo and the University of Torino. Its mission is to foster research and education in the social sciences, in accordance with the values and practices of the international academic community. The Collegio undertakes both with a distinctly outward perspective, adhering to the international academic standards.
@ 2021 LdA. All rights reserved.ISBN 978-88-946015-0-3
Graphic design by: Marco Franchini - [email protected]
