5th grade math - prince william county public schools
TRANSCRIPT
Grade 5
Curriculum Guide
SY 2011-12 through SY 2017-18
Mathematics

Mathematics Grade 5 Curriculum Guide Introduction Prince William County Schools
The Mathematics Curriculum Guide serves as a guide for teachers when planning instruction and assessment. It defines the content
knowledge, skills, and understandings that are measured by the Standards of Learning assessment. It provides additional guidance to
teachers as they develop an instructional program appropriate for their students. It also assists teachers in their lesson planning by
identifying essential understandings, defining essential content knowledge, and describing the intellectual skills students need to use.
This Guide delineates in greater specificity the content that all teachers should teach and all students should learn.
The format of the Curriculum Guide facilitates teacher planning by identifying the key concepts, knowledge, and skills that should be
the focus of instruction for each objective. The Curriculum Guide is divided into sections: Curriculum Information, Essential
Knowledge and Skills, Key Vocabulary, Essential Questions and Understandings, and Teacher Notes and Elaborations. Resources and
Sample Instructional Strategies and Activities are included in the Unit Guides. The purpose of each section is explained below.
Curriculum Information:
This section includes the objective, the curriculum strand and the SOL reporting category.
Essential Knowledge and Skills:
Each objective is expanded in this section. What each student should know and be able to do in each objective is outlined. This is not
meant to be either an exhaustive list or a list that limits what is taught in the classroom. This section is helpful to teachers when
planning classroom assessments as it is a guide to the knowledge and skills that define the objective.
Key Vocabulary:
This section includes vocabulary that is key to the objective and many times the first introduction for the student to new concepts
and skills.
Essential Questions and Understandings:
This section delineates the key concepts, ideas and mathematical relationships that all students should grasp to demonstrate an
understanding of the objectives.
Teacher Notes and Elaborations:
This section includes background information for the teacher. It contains content that is necessary for teaching this objective and may
extend the teachers’ knowledge of the objective beyond the current grade level. It may also contain definitions of key vocabu lary to
help facilitate student learning.

FOCUS 4–5 STRAND: NUMBER AND NUMBER SENSE GRADE LEVEL 5
Mathematics instruction in grades 4 and 5 should continue to foster the development of number sense, especially with decimals and
fractions. Students with good number sense understand the meaning of numbers, develop multiple relationships and representations
among numbers, and recognize the relative magnitude of numbers. They should learn the relative effect of operating on whole
numbers, fractions, and decimals and learn how to use mathematical symbols and language to represent problem situations. Number
and operation sense continues to be the cornerstone of the curriculum.
The focus of instruction at grades 4 and 5 allows students to investigate and develop an understanding of number sense by modeling
numbers, using different representations (e.g., physical materials, diagrams, mathematical symbols, and word names). Students should
develop strategies for reading, writing, and judging the size of whole numbers, fractions, and decimals by comparing them, using a
variety of models and benchmarks as referents (e.g., 2
1 or 0.5). Students should apply their knowledge of number and number sense to
investigate and solve problems.

GRADE 5 CURRICULUM GUIDE PRINCE WILLIAM COUNTY SCHOOLS
Curriculum Information
Essential Knowledge and Skills
Key Vocabulary
Essential Questions and Understandings
Teacher Notes and Elaborations
Strand
Number and Number Sense
SOL Reporting Category Number and Number Sense
Virginia SOL 5.1
The student, given a decimal through
thousandths, will round to the nearest
whole number, tenth, or hundredth.
Foundational Objective
4.1
The student will
a. identify orally and in writing the
place value for each digit in a whole
number expressed through millions;
b. compare two whole numbers
expressed through millions, using
symbols (>, <, or = ); and
c. round whole numbers expressed
through millions to the nearest
thousand, ten thousand, and
hundred thousand.
The student will use problem solving,
mathematical communication,
mathematical reasoning, connections
and representations to
Round decimal numbers to the nearest whole number, tenth or hundredth.
Key Vocabulary
decimal number
hundredth
round
tenth
thousandth
whole number
Essential Questions
How do you read, write, and identify decimal numbers through thousandths?
How is rounding numbers with decimal places similar to/different from rounding whole
numbers?
When is it useful to round decimal numbers?
How do you determine the place to round a number?
How is comparing whole numbers similar to/different from comparing decimal
numbers?
Essential Understandings
All students should
Understand that decimals are rounded in a way that is similar to the way whole numbers
are rounded.
Understand that decimal numbers can be rounded to estimate when exact numbers are
not needed for the situation at hand.
Teacher Notes and Elaborations
The structure of the Base-10 number system is based upon a simple pattern of tens in which
each place is ten times the value of the place to its right. This is known as a ten-to-one place
value relationship.
A decimal point separates the whole number places from the places less than one. Place
values extend infinitely in two directions from a decimal point. A number containing a
decimal point is called a decimal number or simply a decimal.
To read decimals,
– read the whole number to the left of the decimal point, if there is one; – read the decimal point as ―and‖;
– read the digits to the right of the decimal point just as you would read a whole
number; and
– say the name of the place value of the digit in the smallest place.
Decimals may be written in a variety of forms:
– Standard: 23.456
– Written: Twenty-three and four hundred fifty-six thousandths
– Expanded: (2 × 10) + (3 × 1) + (4 × 0.1) + (5 × 0.01) + (6 × 0.001)

GRADE 5 CURRICULUM GUIDE PRINCE WILLIAM COUNTY SCHOOLS
Curriculum Information
Essential Questions and Understandings
Teacher Notes and Elaborations
Strand
Number and Number Sense
SOL Reporting Category Number and Number Sense
Virginia SOL 5.1
The student, given a decimal through
thousandths, will round to the nearest
whole number, tenth, or hundredth.
Foundational Objective
4.1
The student will
d. identify orally and in writing the
place value for each digit in a whole
number expressed through millions;
e. compare two whole numbers
expressed through millions, using
symbols (>, <, or = ); and
f. round whole numbers expressed
through millions to the nearest
thousand, ten thousand, and
hundred thousand.
Teacher Notes and Elaborations (continued)
To help students identify the ten-to-one place value relationship for decimals through thousandths, use Base-10 manipulatives, such as
place value mats/charts, decimal squares, Base-10 blocks, and money.
Decimals can be rounded to the nearest whole number, tenth or hundredth in situations when exact numbers are not needed. To round a
number means to substitute a ―friendly‖ number (e.g., 0.23 can be thought of as 0.2 or 0.25 depending on the situation) that is close to the
actual number so that computation or comparison may be more easily done. Emphasis should be on understanding the rounding concept,
not on memorization of a procedure. Students should develop their own procedures for rounding instead of memorizing a given procedure
without understanding. For example, students who have learned rote procedures for rounding whole numbers will have difficulty
understanding why 14.638 rounded to the nearest tenth is 14.6 rather than 14.600. Students should pair models with symbolic notation
when exploring strategies for rounding. Emphasis should be on understanding the rounding concept as practical real-life application.
A strategy for rounding decimal numbers to the nearest whole number, tenth and hundredth is:
Create a number line that shows the decimal that is to be rounded. On either side of the number, place the two numbers between
which it lies (to the place you want to round).
The position of the decimal will help children conceptualize the number’s placement relative for rounding. An example is to
round 5.747 to the nearest hundredth:
5.747 would lie between 5.74 and 5.75. By looking at a number line, students should be able to determine which of the two numbers
is closer.
5.74 5.747 5.75

GRADE 5 CURRICULUM GUIDE PRINCE WILLIAM COUNTY SCHOOLS
Curriculum Information
Essential Knowledge and Skills
Key Vocabulary
Essential Questions and Understandings
Teacher Notes and Elaborations
Strand
Number and Number Sense
SOL Reporting Category Number and Number Sense
Virginia SOL 5.2
The student will
a. recognize and name fractions in
their equivalent decimal form and
vice versa; and
b. compare and order fractions and
decimals in a given set from least to
greatest and greatest to least.
Foundational Objectives
4.2
The student will
a. compare and order fractions and
mixed numbers;
b. represent equivalent fractions; and
c. identify the division statement that
represents a fraction.
4.3
The student will
a) read, write, represent, and identify
decimals expressed through
thousandths;
b) round decimals to the nearest whole
number, tenth, and hundredth;
c) compare and order decimals; and
d) given a model, write the decimal and
fraction equivalents.
The student will use problem solving,
mathematical communication,
mathematical reasoning, connections
and representations to
Represent fractions (halves, fourths, fifths, eighths, tenths, and twelfths) in
their equivalent decimal form and vice
versa.
Recognize and name equivalent
relationships between decimals and
fractions with denominators up to 12.
Compare and order from least to
greatest and greatest to least a given set
of no more than five numbers written as
decimals, fractions, and mixed numbers
with denominators of 12 or less.
Key Vocabulary
denominator
equivalent
mixed number
numerator
percent
repeating decimal
terminating decimal
Essential Questions
When is it appropriate to use fractions? …decimals?
How can a fraction represent division?
What models and relationships help us name commonly-used fractions and mixed numbers in their equivalent decimal forms and vice versa?
How can we use landmarks (benchmarks), known fraction-decimal equivalents, and the
number line to help us order a set of fractions and decimals?
Essential Understandings
All students should
Understand the relationship between fractions and their decimal form and vice versa.
Understand that fractions and decimals can be compared and ordered from least to
greatest and greatest to least.
Teacher Notes and Elaborations
Students should recognize, name, and focus on finding equivalent decimals of familiar fractions such as halves, fourths, fifths, eighths, and tenths.
Students should be able to determine equivalent relationships between decimals and
fractions with denominators up to 12.
Students should have experience with fractions such as 81 , whose decimal representation is
a terminating decimal (e. g., 81 = 0.125) and with fractions such as
92 , whose decimal
representation does not end but continues to repeat (e. g.,92 = 0.222…). The repeating
decimal can be written with ellipses (three dots) as in 0.222… or denoted with a bar above
the digits that repeat as in 0.2 .
To help students compare the value of two decimals through thousandths, use
manipulatives, such as place value mats/charts, 10-by-10 grids, decimal squares, Base-10
blocks, meter sticks, number lines, and money.
Decimals and fractions represent the same relationships; however, they are presented in two
different formats. Decimal numbers are another way of writing fractions. Base-10 models
(e.g., 10-by-10 grids, meter sticks, number lines, decimal squares, money) concretely relate
fractions to decimals and vice versa.
(continued)

GRADE 5 CURRICULUM GUIDE PRINCE WILLIAM COUNTY SCHOOLS
Curriculum Information
Essential Questions and Understandings
Teacher Notes and Elaborations
Strand
Number and Number Sense
SOL Reporting Category Number and Number Sense
Virginia SOL 5.2
The student will
a. recognize and name fractions in
their equivalent decimal form and
vice versa; and
b. compare and order fractions and
decimals in a given set from least to
greatest and greatest to least.
Foundational Objectives
4.2
The student will
d. compare and order fractions and
mixed numbers;
e. represent equivalent fractions; and
f. identify the division statement that
represents a fraction.
4.3
The student will
e) read, write, represent, and identify
decimals expressed through
thousandths;
f) round decimals to the nearest whole
number, tenth, and hundredth;
g) compare and order decimals; and
h) given a model, write the decimal and
fraction equivalents.
Teacher Notes and Elaborations (continued)
A procedure for comparing two decimals by examination may include the following:
Line up the decimal numbers at their decimal points.
Beginning at the left, find the first place where the digits are different.
Compare the digits in this place value to determine which number is greater (or which is less).
Use the appropriate symbol > or < or the words ―is greater than‖ or ―is less than‖ to compare the numbers in the order in which they
are presented.
If both numbers are the same, use the symbol = or words ―is equal to‖.
The number line representation is a particularly critical one, because it helps students see fractions and decimals as numbers that are part of
the number system. This is an important concept because, 21 in a context may be one of two equal parts of a region or group of things, and
21 of a pizza represents a larger visual area than ½ of a typical cookie; however,
21 as a number always has the same relationship to the
other numbers in our number system. 21 of 12 is always 6, no matter what the 12 represents. The number line helps students visualize
fractions and decimals as relationships.
By studying multiple representations for fractions and decimals, students develop mental images of landmark (benchmark) fractions and
decimals and enhance their understanding of the complex meanings of rational numbers.
Students should relate fractions and decimals to percents when comparing and ordering rational numbers.
Students will develop number sense for the relative magnitude of rational numbers by using reasoning to order given sets of numbers written as fractions, mixed numbers, and decimals on a classroom number line marked with decimal/fraction equivalents of
landmark/benchmark numbers. Students with strong number sense for rational numbers (fractions, decimals, and percents) – conceptual
thought patterns for comparing fractions – and place value understanding for decimals will find it unnecessary to change all the numbers to
one form (fractions) or another (decimals) to order a given set of numbers written as fractions, mixed numbers, and decimals.
Conceptual Thought Patterns for Comparison of Fractions:
Different number of the same-sized parts
53 <
54
Same number of parts of different sizes
53 >
83
More or less than one-half or one whole
74 >
52
Distance from one-half or one whole
109 >
43
109
is101
away from one whole.
43
is41
away from one whole.
Visualize
74
is a little more than21
52
is a little less than 21
Visualize

GRADE 5 CURRICULUM GUIDE PRINCE WILLIAM COUNTY SCHOOLS
Curriculum Information
Essential Knowledge and Skills
Key Vocabulary
Essential Questions and Understandings
Teacher Notes and Elaborations
Strand
Number and Number Sense
SOL Reporting Category Number and Number Sense
Virginia SOL 5.3
The student will
a. identify and describe the
characteristics of prime and
composite numbers; and
b. identify and describe the
characteristics of even and odd
numbers.
Foundational Objectives
4.5A
The student will determine common
multiples and factors, including least
common multiple and greatest common
factor.
2.4C The students will recognize even and odd numbers.
The student will use problem solving,
mathematical communication,
mathematical reasoning, connections
and representations to
Identify prime numbers less than or equal to 100.
Identify composite numbers less than or
equal to 100.
Explain orally and in writing why a
number is prime or composite.
Identify which numbers are even or
odd.
Explain and demonstrate with
manipulatives, pictorial representations,
oral language, or written language why
a number is even or odd.
Key Vocabulary composite number even number factor odd number prime number
Essential Questions
How can we use arrays to demonstrate the difference between prime and composite
numbers?
How can we demonstrate that all positive whole numbers can be represented as a product of prime numbers?
How can we use manipulatives to demonstrate the difference between even and odd
numbers?
How can knowing whether a number is prime or composite and whether it is even or
odd be useful in mathematics?
Essential Understandings
All students should
Understand and use the unique characteristics of certain sets of numbers, including
prime, composite, even, and odd numbers.
Teacher Notes and Elaborations
A prime number is a natural number that has exactly two different factors, one and the
number itself. A composite number is a natural number that has more than two different factors. The number 1 is neither prime nor composite because it has only one factor, itself.
The prime factorization of a number is a representation of the number as the product of
its prime factors. For example, the prime factorization of 18 is 2 × 3 × 3. Prime
factorization concepts can be developed by using factor trees. Divisibility rules are
useful tools in identifying prime and composite numbers.
Prime or composite numbers can be represented by rectangular models or rectangular
arrays on grid paper. A prime number can be represented by only one rectangular array
(e.g., 7 can be only represented by a 7 ×1 array which is the same as a 1 × 7). A
composite number can always be represented by two or more rectangular arrays (e.g., 9 can be represented by a 9 × 1 or a 3 × 3 array – two distinctly different arrays).
Students should use manipulatives (e.g., Base-10 blocks, cubes, tiles, hundreds board,
etc.) to explore and categorize numbers into groups of odd or even.
Students’ success with this objective may increase with a strong recall of math facts.
Students who struggle with math facts may initially need other math tools (e.g..
multiplication charts, manipulatives, Base-10 blocks, cubes, tiles, hundreds board, etc.).
(continued)

GRADE 5 CURRICULUM GUIDE PRINCE WILLIAM COUNTY SCHOOLS
Curriculum Information
Essential Questions and Understandings
Teacher Notes and Elaborations
Strand
Number and Number Sense
SOL Reporting Category Number and Number Sense
Virginia SOL 5.3
The student will
a. identify and describe the
characteristics of prime and
composite numbers; and
b. identify and describe the
characteristics of even and odd
numbers.
Foundational Objectives
4.5A
The student will determine common
multiples and factors, including least
common multiple and greatest common
factor.
2.4C The students will recognize even and odd numbers.
Teacher Notes and Elaborations (continued)
Students should determine rules to categorize numbers into groups of odd or even, such as:
o An odd number does not have 2 as a factor or is not divisible by 2.
o An even number has 2 as a factor or is divisible by 2. o The sum of two even numbers is even.
o The sum of two odd numbers is even.
o The sum of an even number and an odd number is odd.
o Even numbers have an even number or zero in the ones place.
o Odd numbers have an odd number in the ones place.

FOCUS 4–5 STRAND: COMPUTATION AND ESTIMATION GRADE LEVEL 5
Computation and estimation in grades 4 and 5 should focus on developing fluency in multiplication and division with whole numbers
and should begin to extend students’ understanding of these operations to work with decimals. Instruction should focus on
computation activities that enable students to model, explain, and develop proficiency with basic facts and algorithms. These
proficiencies are often developed as a result of investigations and opportunities to develop algorithms. Additionally, opportunities to
develop and use visual models, benchmarks, and equivalents, to add and subtract with common fractions, and to develop
computational procedures for the addition and subtraction of decimals are a priority for instruction in these grades.
Students should develop an understanding of how whole numbers, fractions, and decimals are written and modeled; an understanding
of the meaning of multiplication and division, including multiple representations (e.g., multiplication as repeated addition or as an
array); an ability not only to identify but to use relationships between operations to solve problems (e.g., multiplication as the inverse
of division); and the ability to use (not identify) properties of operations to solve problems [e.g., 7 28 is equivalent to
(7 20) + (7 8)].
Students should develop computational estimation strategies based on an understanding of number concepts, properties, and
relationships. Practice should include estimation of sums and differences of common fractions and decimals, using benchmarks (e.g.,
5
2 + 3
1 must be less than 1 because both fractions are less than 2
1 ). Using estimation, students should develop strategies to recognize
the reasonableness of their computations. Additionally, students should enhance their ability to select an appropriate problem solving
method from among estimation, mental mathematics, paper-and-pencil algorithms, and the use of calculators and computers. With
activities that challenge students to use this knowledge and these skills to solve single-step and multistep problems in many contexts,
including practical mathematical situations, students develop the foundation to ensure success and achievement in higher mathematics.

GRADE 5 CURRICULUM GUIDE PRINCE WILLIAM COUNTY SCHOOLS
Curriculum Information
Essential Knowledge and Skills
Key Vocabulary
Essential Questions and Understandings
Teacher Notes and Elaborations
Strand
Computation and Estimation
SOL Reporting Category Computation and Estimation
Virginia SOL 5.4
The student will create and solve
single-step and multistep practical
problems involving addition,
subtraction, multiplication, and division
with and without remainders of whole
numbers.
Foundational Objective
4.4
The student will
a) estimate sums, differences,
products, and quotients of whole
numbers;
b) add, subtract, and multiply whole
numbers;
c) divide whole numbers, finding
quotients with and without remainders; and
d) solve single-step and multistep
addition, subtraction, and
multiplication problems with whole
numbers.
The student will use problem solving,
mathematical communication,
mathematical reasoning, connections
and representations to
Select appropriate methods and tools from among paper and pencil,
estimation, mental computation, and
calculators according to the context and
nature of the computation in order to
compute with whole numbers.
Create single-step and multistep
problems involving the operations of
addition, subtraction, multiplication,
and/or division with and without
remainders of whole numbers, using
practical situations.
Estimate the sum, difference, product,
and quotient of whole number
computations.
Solve single-step and multistep
problems involving addition,
subtraction, multiplication, and division
with and without remainders of whole
numbers, using paper and pencil,
mental computation, and calculators in
which
– sums, differences, and products will not exceed five digits;
– multipliers will not exceed two
digits;
– divisors will not exceed two digits;
and
– dividends will not exceed four
digits.
Use two or more operational steps to
solve a multistep problem. Operations
can be the same or different.
Essential Questions
How are the four basic operations related to one another?
What situations call for the computation of sums? ... differences? …products?
…quotients? ...or a combination of operations? How does the problem situation determine how to represent a remainder in division?
How do we determine whether it is more appropriate to estimate the solutions to
problems than to compute them? What determines a reasonable estimation for a given
situation? How is estimation used to check the reasonableness of the computation
involved in solving a problem?
What are efficient methods for finding sums, differences, products, and quotients?
How are the different methods related? When is it advantageous to use an alternative
computation strategy? …a traditional computational algorithm?
Essential Understandings
All students should
Understand the meaning of mathematical operations and how these operations relate to one another when creating and solving single-step and multistep word problems
Teacher Notes and Elaborations
An example of an approach to solving problems is Polya’s four-step plan:
– Understand: Retell the problem; read it twice; take notes; study the charts or
diagrams; look up words and symbols that are new.
– Plan: Decide what operation(s) and strategies to use and what sequence of steps to
use to solve the problem. Strategies may include working backwards, drawing
pictures, making a table, etc.).
– Solve: Follow the plan and work accurately. If the first attempt doesn’t work, try
another plan. – Look back: Does the answer make sense?
Estimation gives a rough idea of an amount. Strategies such as using compatible numbers,
front-end, rounding, and mental computation may be used to estimate addition, subtraction,
multiplication, and division of whole numbers. Examples of practical problems to be solved
by using estimation strategies are encountered in shopping for groceries, buying school
supplies, budgeting allowance, and sharing the cost of a pizza or the prize money from a
contest.
An estimate produces answers that are ―close enough‖ for the purpose. The situation
determines what we need to know and, thus, the strategy we use for estimation. Consider the sum: $349.29 + $85. 99 + $175.25. For the three prices, the question, ―About how
much?‖ is very different from, ―Is it more than $600?‖ Students should consider the context
when deciding what estimation strategy to use. They should be able to explain and justify
their strategy and describe the closeness of their estimate.
(continued)

GRADE 5 CURRICULUM GUIDE PRINCE WILLIAM COUNTY SCHOOLS
Curriculum Information
Essential Knowledge and Skills
Key Vocabulary
Essential Questions and Understandings
Teacher Notes and Elaborations
Strand
Computation and Estimation
SOL Reporting Category
Computation and Estimation
Virginia SOL 5.4
The student will create and solve
single-step and multistep practical
problems involving addition,
subtraction, multiplication, and division
with and without remainders of whole numbers.
Foundational Objective
4.4
The student will
e) estimate sums, differences,
products, and quotients of whole
numbers;
f) add, subtract, and multiply whole numbers;
g) divide whole numbers, finding
quotients with and without
remainders; and
h) solve single-step and multistep
addition, subtraction, and
multiplication problems with whole
numbers.
Key Vocabulary addend
difference
dividend
divisor
factor
multistep problem
operation
product
quotient
remainder
single-step problem
sum
Teacher Notes and Elaborations (continued)
Estimation can be used to check the reasonableness of the results, using the following types
of strategies:
Compatible numbers are numbers that are easy to work with mentally. For
example, 52 + 74 can be estimated using 50 + 75. The product 291 x 27 is close to
300 x 25. The quotient 4929 ÷ 26 is close to 4800 ÷ 24 or 5000 ÷ 25.
Front-end or leading digit estimation is useful when totaling many large numbers,
e.g. the number of people who attended football games in a season. Front-end
estimation of sums always gives a sum less than the actual sum; however, the
estimate can be adjusted or refined so it is closer to the actual sum. For example,
9,162 + 5, 643 + 6,636 could be estimated using 9,000 + 5,000 + 6,000. (To refine
the estimate, one might glance down the hundreds in each number and see that the estimate could be increased by 1,000.)
Compensation is a strategy shoppers may use when mentally estimating a total
purchase amount. For example, $2.38 + $5.22 + $0.39 may be estimated as $2 + $5
+ $1 (where the $1 represents an approximation of the accumulated cent amounts:
$ .38 + $ .22 + $ .39)
Rounding the numbers to be added, subtracted, multiplied, or divided, to a given
place is another method of estimation.
3,654 ≈ 4,000 5,421 ≈ 5,000 + 2,793 ≈ + 3,000
12,000

GRADE 5 CURRICULUM GUIDE PRINCE WILLIAM COUNTY SCHOOLS
Curriculum Information
Essential Knowledge and Skills
Key Vocabulary
Essential Questions and Understandings
Teacher Notes and Elaborations
Strand
Computation and Estimation
SOL Reporting Category Computation and Estimation
Virginia SOL 5.5
The student will
a. find the sum, difference, product,
and quotient of two numbers
expressed as decimals through
thousandths (divisors with only one
non-zero digit), and
b. create and solve single-step and multistep practical problems
involving decimals.
Foundational Objective
4.5
The student will
a. determine common multiples and
factors, including least common
multiple and greatest common
factor; b. add and subtract fractions having
like and unlike denominators that
are limited to 2, 3, 4, 5, 6, 8, 10, and
12, and simplify the resulting
fractions, using common multiples
and factors;
c. add and subtract with decimals; and
d. solve single-step and multistep
practical problems involving
addition and subtraction with
fractions and with decimals.
The student will use problem solving,
mathematical communication,
mathematical reasoning, connections
and representations to
Determine an appropriate method of calculation to find the sum, difference,
product, and quotient of two numbers
expressed as decimals through
thousandths, selecting from among
paper and pencil, estimation, mental
computation, and calculators.
Estimate to find the number that is
closest to the sum, difference, and
product of two numbers expressed as
decimals through thousandths.
Find the sum, difference, and product of two numbers expressed as decimals
through thousandths, using paper and
pencil, estimation, mental computation,
and calculators.
Determine the quotient, given a
dividend expressed as a decimal
through thousandths and a single-digit
whole number divisor. For example, 5.4
divided by 2 and 2.465 divided by 5.
Use estimation to check the
reasonableness of a sum, difference, product, and quotient.
Create and solve single-step and
multistep problems. A multistep
problem needs to incorporate two or
more operational steps (operations can
be the same or different).
Essential Questions
What situations require computation with decimal numbers?
How are operations with decimals similar to or different from those used with whole
numbers?
What are the effects of multiplying or dividing a given number (whole number and or
decimal number) by a multiple of ten?
How can we use models and pictures to demonstrate why multiplication of two
numbers does not always result in a larger product?
What strategies can be developed to estimate and compute sums, differences, products,
and quotients of numbers expressed as decimals?
How can estimation skills and computational strategies/algorithms reinforce one
another?
Essential Understandings
All students should
Use similar procedures as those developed for whole number computation and apply them to decimal place values, giving careful attention to the placement of the decimal
point in the solution.
Select appropriate methods and tools from among paper and pencil, estimation, mental
computation, and calculators according to the context and nature of the computation in
order to compute with decimal numbers.
Understand the various meanings of division and its effect on whole numbers.
Understand various representations of division, i.e.,
dividend ÷ divisor = quotient
quotient
divisor dividend
dividend
quotientdivisor
Teacher Notes and Elaborations
Addition and subtraction of decimals may be investigated using a variety of models (e.g.,
10 by 10 grids, number lines, money, Base-10 manipulatives).
Decimal computation uses similar procedures as those developed for whole number
computation. The traditional algorithm for multiplication of decimals follows the same
procedure as multiplication of whole numbers. The only difference is that a decimal point
must be correctly placed in the product giving careful attention to the placement of the
decimal point in the solution. Often this can be easily done by estimation.
GRADE 5 CURRICULUM GUIDE PRINCE WILLIAM COUNTY SCHOOLS
Curriculum Information
Essential Knowledge and Skills
Key Vocabulary
Essential Questions and Understandings
Teacher Notes and Elaborations
Strand
Computation and Estimation
SOL Reporting Category Computation and Estimation
Virginia SOL 5.5
The student will
a. find the sum, difference, and
product of two numbers expressed
as decimals through
thousandths, and find the quotient,
given a dividend expressed as a
decimal through thousandths and a single-digit whole number divisor;
and
b. create and solve single-step and
multistep practical problems
involving decimals.
Foundational Objective
4.5
The student will
a. determine common multiples and factors, including least
common multiple and greatest
common factor;
b. add and subtract fractions having
like and unlike denominators that
are limited to 2, 3, 4, 5, 6, 8, 10, and
12, and simplify the resulting
fractions, using common multiples
and factors;
c. add and subtract with decimals; and
d. solve single-step and multistep practical problems involving
addition and subtraction with
fractions and with decimals.
Key Vocabulary
addend
difference
dividend
divisor factor
hundredths
multistep problem
operation
product
quotient
single-step problem
sum
tenths
thousandths
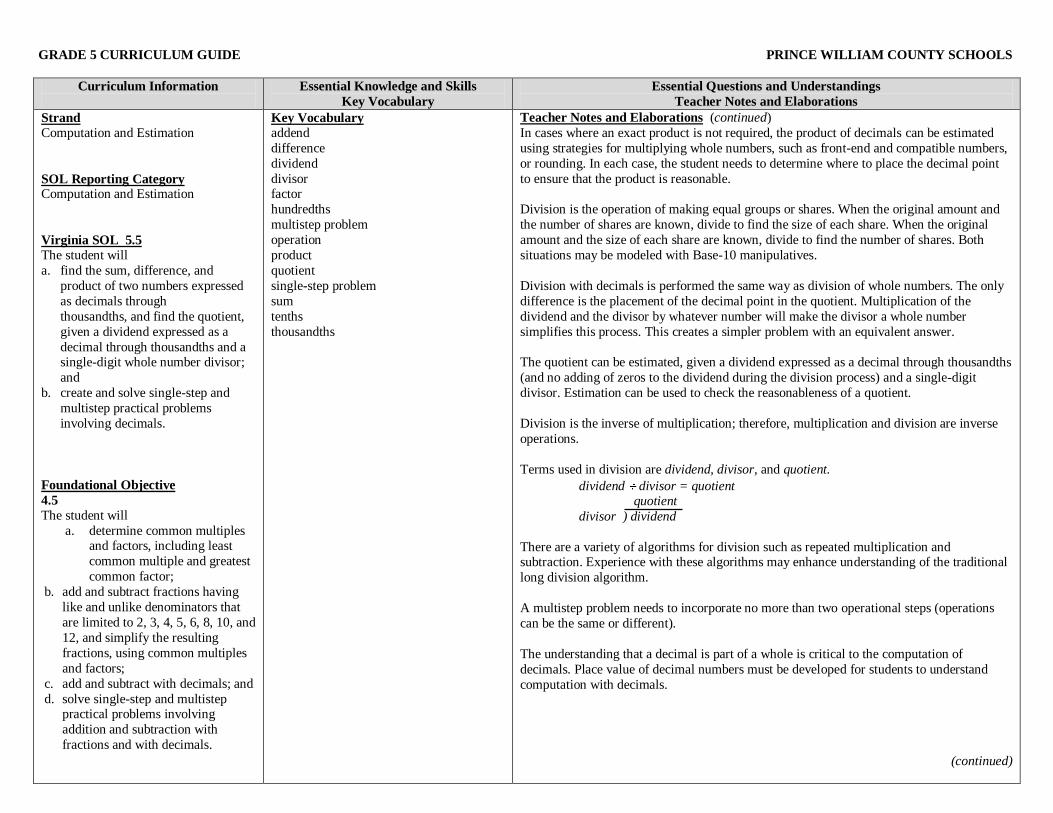
Teacher Notes and Elaborations (continued)
In cases where an exact product is not required, the product of decimals can be estimated
using strategies for multiplying whole numbers, such as front-end and compatible numbers,
or rounding. In each case, the student needs to determine where to place the decimal point
to ensure that the product is reasonable.
Division is the operation of making equal groups or shares. When the original amount and
the number of shares are known, divide to find the size of each share. When the original
amount and the size of each share are known, divide to find the number of shares. Both
situations may be modeled with Base-10 manipulatives.
Division with decimals is performed the same way as division of whole numbers. The only
difference is the placement of the decimal point in the quotient. Multiplication of the
dividend and the divisor by whatever number will make the divisor a whole number
simplifies this process. This creates a simpler problem with an equivalent answer.
The quotient can be estimated, given a dividend expressed as a decimal through thousandths
(and no adding of zeros to the dividend during the division process) and a single-digit
divisor. Estimation can be used to check the reasonableness of a quotient.
Division is the inverse of multiplication; therefore, multiplication and division are inverse
operations.
Terms used in division are dividend, divisor, and quotient.
dividend divisor = quotient quotient
divisor ) dividend
There are a variety of algorithms for division such as repeated multiplication and subtraction. Experience with these algorithms may enhance understanding of the traditional
long division algorithm.
A multistep problem needs to incorporate no more than two operational steps (operations
can be the same or different).
The understanding that a decimal is part of a whole is critical to the computation of
decimals. Place value of decimal numbers must be developed for students to understand
computation with decimals.
(continued)

GRADE 5 CURRICULUM GUIDE PRINCE WILLIAM COUNTY SCHOOLS
Curriculum Information
Essential Questions and Understandings
Teacher Notes and Elaborations
Strand
Computation and Estimation
SOL Reporting Category
Computation and Estimation
Virginia SOL 5.5
The student will
a. find the sum, difference, and
product of two numbers expressed
as decimals through
thousandths, and find the quotient,
given a dividend expressed as a
decimal through thousandths and a
single-digit whole number divisor;
and
b. create and solve single-step and multistep practical problems
involving decimals.
Foundational Objective
4.5
The student will
e. determine common multiples and
factors, including least common
multiple and greatest common factor;
f. add and subtract fractions having
like and unlike denominators that
are limited to 2, 3, 4, 5, 6, 8, 10, and
12, and simplify the resulting
fractions, using common multiples
and factors;
g. add and subtract with decimals; and
h. solve single-step and multistep
practical problems involving
addition and subtraction with fractions and with decimals.
Teacher Notes and Elaborations (continued)
Decimal computation, particularly multiplication and division by decimal numbers, requires that students understand decimal quantities
and the conceptual meaning of each operation. (For example, students cannot rely on the naive conceptions that multiplication makes
larger and division makes smaller.) Estimation and models play critical roles in developing understanding for decimal computation.
Decimal sums and differences may be estimated using rounding and approximate fractional equivalents; for example, 3.712 + 1.4 is close
to 4 + 1, or 5; more precisely, 3.712 + 1.4 is close to 3 ¾ + 1 ½ , or 5 ¼. The context of the problem should guide the selection of method and the precision needed.
Area models can be used to demonstrate that the product of decimals is dependent upon the two factors being multiplied.
Factors Product
tenths x tenths = hundredths
tenths x hundredths = thousandths
hundredths x hundredths = ten-thousandths
tenths x thousandths = ten-thousandths
Models demonstrate visually why the product of two numbers may be smaller than the factors. For example, 0.5 x 0.4 may be thought of
as 1/2 of 4/10 or 4/10 of 1/2. 0.5 x 0.4 = 0.2 can be modeled by shading 0.5 horizontally on a 10 x 10 grid, and shading 0.4 vertically. The overlap represents the
product 0.20 or 0.2.
Similar models can be drawn on grid paper to represent the multiplication of mixed decimals (e.g., 1.3 x 2.7).

GRADE 5 CURRICULUM GUIDE PRINCE WILLIAM COUNTY SCHOOLS
Curriculum Information
Essential Knowledge and Skills
Key Vocabulary
Essential Questions and Understandings
Teacher Notes and Elaborations
Strand
Computation and Estimation
SOL Reporting Category
Computation and Estimation
Virginia SOL 5.6
The student will solve single-step and
multi-step practical problems involving
addition and subtraction with fractions
and mixed numbers and express
answers in simplest form.
Foundational Objective
4.5
The student will
a. determine common multiples and
factors, including least common
multiple and greatest common
factor;
b. add and subtract fractions having
like and unlike denominators that
are limited to 2, 3, 4, 5, 6, 8, 10, and
12, and simplify the resulting
fractions, using common multiples and factors;
c. add and subtract with decimals; and
d. solve single-step and multistep
practical problems involving
addition and subtraction with
fractions and with decimals.
The student will use problem solving,
mathematical communication,
mathematical reasoning, connections
and representations to
Solve single-step and multistep
practical problems involving addition and subtraction with fractions having
like and unlike denominators.
Denominators in the problems should
be limited to 12 or less (e.g.,41
51 ) and
answers should be expressed in
simplest form.
Solve single-step and multistep
practical problems involving addition
and subtraction with mixed numbers
having like and unlike denominators,
with and without regrouping.
Denominators in the problems should be limited to 12 or less, and answers
should be expressed in simplest form.
Use estimation to check the
reasonableness of a sum or difference.
Key Vocabulary
greatest common factor (GCF)
improper fraction
least common denominator (LCD)
least common multiple (LCM)
mixed number
proper fraction simplest form
simplify
Essential Questions
What does it mean to ―simplify‖ a fraction, and why is it important?
How can we use models to devise strategies for renaming improper fractions as mixed
numbers and vice versa?
How is the understanding of multiples and factors useful in renaming/simplifying fractions and mixed numbers?
How can we use mental models, benchmarks, and approximate decimal equivalents to
estimate sums and differences of fractions?
What strategies can be developed to compute sums and differences with fractions and
mixed numbers?
Why is it necessary to rename fractions to have common denominators when using the
traditional algorithm for adding and subtracting fractions?
Essential Understandings
All students should
Develop and use strategies to estimate and compute addition and subtraction of fractions.
Understand the concept of least common multiple and least common denominator as
they are important when adding and subtracting fractions.
Understand that a fraction is in simplest form when its numerator and denominator have
no common factors other than 1. The numerator can be greater than the denominator.
Teacher Notes and Elaborations
A fraction can be expressed in simplest form (simplest equivalent fraction) by dividing the
numerator and denominator by their greatest common factor. When the numerator and
denominator have no common factors other than 1, then the fraction is in simplest form.
―Fractions having like denominators‖ means the same as fractions having common denominators.
Equivalent fractions name the same amount. To find equivalent fractions, multiply or divide
the numerator and denominator by the same nonzero number.
Addition and subtraction with fractions and mixed numbers can be modeled using a variety
of concrete materials and pictorial representations as well as paper and pencil.
To add, subtract, and compare fractions and mixed numbers, it often helps to find the least
common denominator. The least common denominator (LCD) of two or more fractions is
the least common multiple (LCM) of the denominators.
GRADE 5 CURRICULUM GUIDE PRINCE WILLIAM COUNTY SCHOOLS
Curriculum Information
Essential Questions and Understandings
Teacher Notes and Elaborations
Strand
Computation and Estimation
SOL Reporting Category Computation and Estimation
Virginia SOL 5.6
The student will solve single-step and
multi-step practical problems involving
addition and subtraction with fractions
and mixed numbers and express
answers in simplest form.
Foundational Objective
4.5
The student will
a. determine common multiples
and factors, including least
common multiple and greatest
common factor;
b. add and subtract fractions having
like and unlike denominators that
are limited to 2, 3, 4, 5, 6, 8, 10, and
12, and simplify the resulting fractions, using common multiples
and factors;
c. add and subtract with decimals; and
d. solve single-step and multistep
practical problems involving
addition and subtraction with
fractions and with decimals.
Teacher Notes and Elaborations (continued)
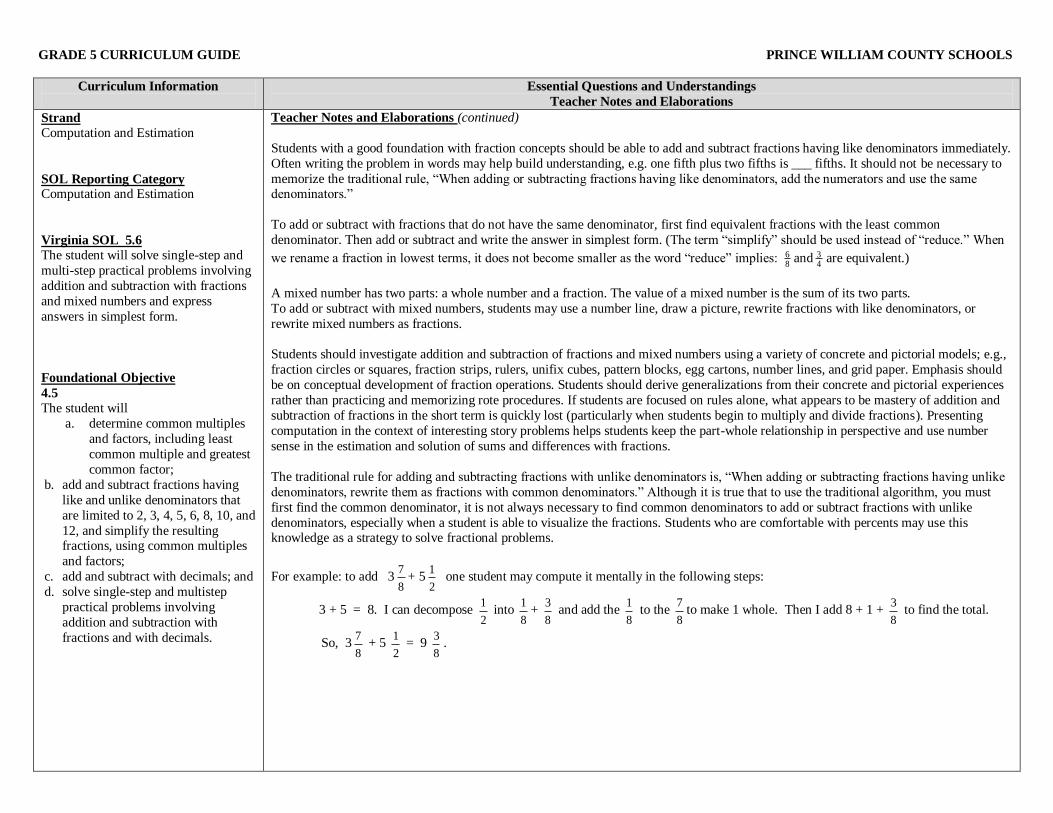
Students with a good foundation with fraction concepts should be able to add and subtract fractions having like denominators immediately.
Often writing the problem in words may help build understanding, e.g. one fifth plus two fifths is ___ fifths. It should not be necessary to
memorize the traditional rule, ―When adding or subtracting fractions having like denominators, add the numerators and use the same denominators.‖
To add or subtract with fractions that do not have the same denominator, first find equivalent fractions with the least common
denominator. Then add or subtract and write the answer in simplest form. (The term ―simplify‖ should be used instead of ―reduce.‖ When
we rename a fraction in lowest terms, it does not become smaller as the word ―reduce‖ implies: 86 and
43 are equivalent.)
A mixed number has two parts: a whole number and a fraction. The value of a mixed number is the sum of its two parts.
To add or subtract with mixed numbers, students may use a number line, draw a picture, rewrite fractions with like denominators, or
rewrite mixed numbers as fractions.
Students should investigate addition and subtraction of fractions and mixed numbers using a variety of concrete and pictorial models; e.g.,
fraction circles or squares, fraction strips, rulers, unifix cubes, pattern blocks, egg cartons, number lines, and grid paper. Emphasis should
be on conceptual development of fraction operations. Students should derive generalizations from their concrete and pictorial experiences
rather than practicing and memorizing rote procedures. If students are focused on rules alone, what appears to be mastery of addition and
subtraction of fractions in the short term is quickly lost (particularly when students begin to multiply and divide fractions). Presenting
computation in the context of interesting story problems helps students keep the part-whole relationship in perspective and use number
sense in the estimation and solution of sums and differences with fractions.
The traditional rule for adding and subtracting fractions with unlike denominators is, ―When adding or subtracting fractions having unlike
denominators, rewrite them as fractions with common denominators.‖ Although it is true that to use the traditional algorithm, you must
first find the common denominator, it is not always necessary to find common denominators to add or subtract fractions with unlike
denominators, especially when a student is able to visualize the fractions. Students who are comfortable with percents may use this knowledge as a strategy to solve fractional problems.
For example: to add 38
7+ 5
2
1 one student may compute it mentally in the following steps:
3 + 5 = 8. I can decompose 2
1 into
8
1+
8
3 and add the
8
1 to the
8
7to make 1 whole. Then I add 8 + 1 +
8
3 to find the total.
So, 38
7 + 5
2
1 = 9
8
3.
GRADE 5 CURRICULUM GUIDE PRINCE WILLIAM COUNTY SCHOOLS
Curriculum Information
Essential Questions and Understandings
Teacher Notes and Elaborations
Strand
Computation and Estimation
SOL Reporting Category Computation and Estimation
Virginia SOL 5.6
The student will solve single-step and
multi-step practical problems involving
addition and subtraction with fractions
and mixed numbers and express
answers in simplest form.
Foundational Objective
4.5
The student will
e. determine common multiples and
factors, including least common
multiple and greatest common
factor;
f. add and subtract fractions having
like and unlike denominators that
are limited to 2, 3, 4, 5, 6, 8, 10, and
12, and simplify the resulting fractions, using common multiples
and factors;
g. add and subtract with decimals; and
h. solve single-step and multistep
practical problems involving
addition and subtraction with
fractions and with decimals.
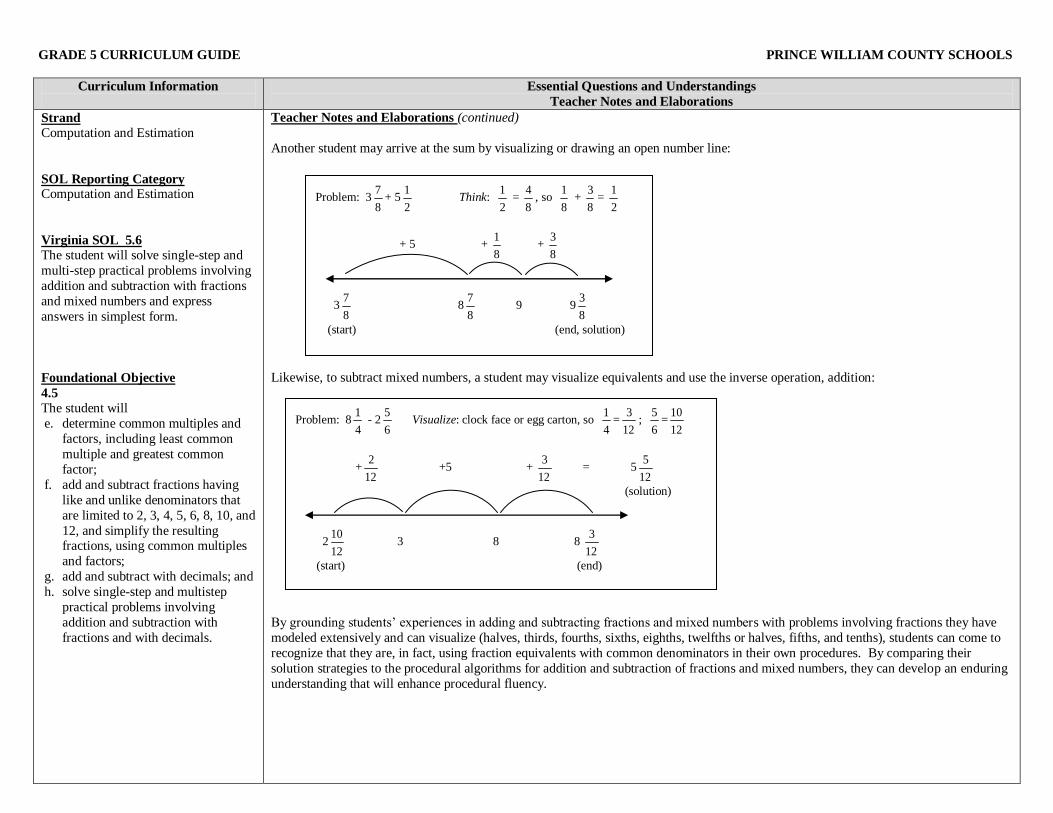
Teacher Notes and Elaborations (continued)
Another student may arrive at the sum by visualizing or drawing an open number line:
Likewise, to subtract mixed numbers, a student may visualize equivalents and use the inverse operation, addition:
By grounding students’ experiences in adding and subtracting fractions and mixed numbers with problems involving fractions they have
modeled extensively and can visualize (halves, thirds, fourths, sixths, eighths, twelfths or halves, fifths, and tenths), students can come to
recognize that they are, in fact, using fraction equivalents with common denominators in their own procedures. By comparing their
solution strategies to the procedural algorithms for addition and subtraction of fractions and mixed numbers, they can develop an enduring
understanding that will enhance procedural fluency.
Problem: 38
7+ 5
2
1 Think:
2
1 =
8
4, so
8
1 +
8
3=
2
1
+ 5 + 8
1 +
8
3
38
7 8
8
7 9 9
8
3
(start) (end, solution)
Problem: 84
1 - 2
6
5 Visualize: clock face or egg carton, so
4
1=
12
3;
6
5=
12
10
+12
2 +5 +
12
3 = 5
12
5
(solution)
212
10 3 8 8
12
3
(start) (end)

GRADE 5 CURRICULUM GUIDE PRINCE WILLIAM COUNTY SCHOOLS
Curriculum Information
Essential Knowledge and Skills
Key Vocabulary
Essential Questions and Understandings
Teacher Notes and Elaborations
Strand
Computation and Estimation
SOL Reporting Category Computation and Estimation
Virginia SOL 5.7
The student will evaluate whole number
numerical expressions, using the order
of operations limited to parentheses,
addition, subtraction, multiplication,
and division.
The student will use problem solving,
mathematical communication,
mathematical reasoning, connections
and representations to
Simplify expressions by using the order of operations in a demonstrated step-
by-step approach.
Find the value of numerical
expressions, using the order of
operations.
Given an expression involving more
than one operation, describe which
operation is completed first, which is
second, etc.
Key Vocabulary
equation
expression
operation
order of operations
simplify
Essential Questions
What is a mathematical expression? …equation?
What is the mathematical order of operations? Why are parentheses used in numeric
expressions?
Why does ―order of operations‖ matter when evaluating (simplifying) expressions
containing more than one operation?
Essential Understandings
All students should
Understand that the order of operations describes the order to use to simplify
expressions containing more than one operation.
Teacher Notes and Elaborations
An expression, like a phrase, has no equal sign.
Expressions are simplified by using the order of operations.
The order of operations defines the computation order to follow in simplifying an
expression.
The order of operations is as follows:
– First, complete all operations within parentheses.
– *Second, evaluate all exponential expressions.
– Third, multiply and/or divide in order from left to right.
– Fourth, add and/or subtract in order from left to right.
* Although exponents are not explicitly taught in 5th grade, students can expect to see this in future grades.

FOCUS 4–5 STRAND: MEASUREMENT GRADE LEVEL 5
Students in grades 4 and 5 should be actively involved in measurement activities that require a dynamic interaction among students
and their environment. Students can see the usefulness of measurement if classroom experiences focus on measuring objects and
estimating measurements. Textbook experiences cannot substitute for activities that utilize measurement to answer questions about
real problems.
The approximate nature of measurement deserves repeated attention at this level. It is important to begin to establish some
benchmarks by which to estimate or judge the size of objects.
Students use standard and nonstandard, age-appropriate tools to measure objects. Students also use age-appropriate language of
mathematics to verbalize the measurements of length, weight/mass, liquid volume, area, temperature, and time.
The focus of instruction should be an active exploration of the real world in order to apply concepts from the two systems of
measurement (metric and U.S. Customary), to measure perimeter, weight/mass, liquid volume/capacity, area, temperature, and time.
Students continue to enhance their understanding of measurement by using appropriate tools such as rulers, balances, clocks, and
thermometers. The process of measuring is identical for any attribute (i.e., length, weight/mass, liquid volume/capacity, area): choose
a unit, compare that unit to the object, and report the number of units.

GRADE 5 CURRICULUM GUIDE PRINCE WILLIAM COUNTY SCHOOLS
Curriculum Information
Essential Knowledge and Skills
Key Vocabulary
Essential Questions and Understandings
Teacher Notes and Elaborations
Strand
Measurement
SOL Reporting Category Measurement and Geometry
Virginia SOL 5.8
The student will
a. find perimeter, area, and volume in
standard units of measure;
b. differentiate among perimeter, area,
and volume and identify whether the
application of the concept of
perimeter, area, or volume is appropriate for a given situation;
c. identify equivalent measurements
within the metric system;
d. estimate and then measure to solve
problems, using U.S. Customary
and metric units; and
e. choose an appropriate unit of
measure for a given situation
involving measurement using U.S.
Customary and metric units.
(continued)
The student will use problem solving,
mathematical communication,
mathematical reasoning, connections
and representations to
Determine the perimeter of a polygon, with or without diagrams, when given
– the lengths of all sides of a polygon
that is not a rectangle or a square;
– the length and width of a rectangle;
or
– the length of a side of a square.
Estimate and determine the perimeter of
a polygon, and area of a square,
rectangle, and right triangle following
the parameters listed above, using only
whole number measurements given in metric or U.S. Customary units, and
record the solution with the appropriate
unit of measure (e.g., 24 square inches).
Estimate and determine the area of a
square, with or without diagrams, when
the length of a side is given.
Estimate and determine the area of a
rectangle with or without diagrams,
when the length and width are given.
Estimate and determine the area of a
right triangle, with or without diagrams, when the base and the height are given.
Differentiate among the concepts of
area, perimeter, and volume.
Develop a procedure for finding
volume using manipulatives (e.g.,
cubes).
Determine volume in standard units.
Describe practical situations where
area, perimeter, and volume are
appropriate measures to use, and justify
their choices orally or in writing.
Identify whether the application of the
concept of perimeter, area, or volume is
appropriate for a given situation.
(continued on next page)
Essential Questions
How are two dimensional and three dimensional figures related? How do these
relationships help us differentiate the ideas of perimeter, area, and volume?
What problem situations require us to find perimeter? …area? …volume?
How can models be used to develop strategies for computing the perimeter, area, or
volume of particular geometric figures.?
How are the areas of rectangles (including squares) and triangles related?
Why are all measurements approximations? How does the selection of an appropriate
unit of measurement and measurement tool affect the precision of the solution to
problems involving measurement?
What tools are used in linear measurement? …measurement of weight/mass?
…measurement of liquid volume? …measurement of temperature? How does one
determine which is appropriate to use?
How do the units within a system relate to each other?
How can we use benchmarks to help us estimate measurements of length, weight/mass, liquid volume, and temperature in U.S. Customary and Metric units?
Essential Understandings
All students should
Understand the concepts of perimeter, area, and volume.
Understand and use appropriate units of measure for perimeter, area, and volume.
Understand the difference between using perimeter, area, and volume in a given
situation.
Understand how to select a measuring device and unit of measure to solve problems
involving measurement.
Teacher Notes and Elaborations
Length is the distance along a straight line or figure from one point to another. The term
length can be used inclusively to represent any linear measure (height, width, thickness,
perimeter, etc.), or it can denote one specific dimension of length (as in length versus
width).
Perimeter is the distance around an object. It is a measure of length. Perimeter of a polygon
is found by adding the lengths of all the sides. It is not necessary to memorize different
formulas to find perimeter.
Area is the number of square units needed to cover a flat surface. Volume is a measure of
capacity and is measured in cubic units.
Students should label the perimeter, area, and volume with the appropriate unit of linear,
square, or cubic measure.
(continued)

GRADE 5 CURRICULUM GUIDE PRINCE WILLIAM COUNTY SCHOOLS
Curriculum Information
Essential Knowledge and Skills
Key Vocabulary
Essential Questions and Understandings
Teacher Notes and Elaborations
Strand
Measurement
SOL Reporting Category
Measurement and Geometry
Virginia SOL 5.8
The student will
a. find perimeter, area, and volume in
standard units of measure;
b. differentiate among perimeter, area,
and volume and identify whether the
application of the concept of
perimeter, area, or volume is
appropriate for a given situation;
c. identify equivalent measurements
within the metric system; d. estimate and then measure to solve
problems, using U.S. Customary
and metric units; and
e. choose an appropriate unit of
measure for a given situation
involving measurement using U.S.
Customary and metric units.
(continued)
The student will use problem solving,
mathematical communication,
mathematical reasoning, connections
and representations to (continued)
Identify equivalent measurements
within the metric system for the
following: a. length: millimeters, centimeters,
meters, and kilometers;
b. mass: grams and kilograms;
c. liquid volume: milliliters and
liters.
Solve problems involving measurement
by selecting an appropriate measuring
devise and a U.S. Customary or metric
unit of measure for the following:
- length: part of an inch (1
2 ,
1
4 ,
1
8 ),
inches, feet, yards, millimeters,
centimeters, meters, and kilometers;
- weight: ounces, pounds, and tons;
- mass: grams and kilograms;
- liquid volume: cups, pints, quarts,
gallons, milliliters, and liters;
- area: square units; and
- temperature: Celsius and
Fahrenheit units.
- Water freezes at 0 C and 32 F.
- Water boils at 100 C and
212 F. - Normal body temperature is
about 37 C and 98.6 F.
(continued on next page)
Teacher Notes and Elaborations (continued)
Students should investigate, using manipulatives, to discover the formulas for the area of a
square, rectangle, and right triangle; and volume of a rectangular solid.
o Area of any rectangle (including squares) = length × width
o Area of a rectangle may also be described as base × height
Since the sides of a square are the same, students may think of the formula for area
of a square as Area of a square = side × side
o Area of a right triangle = 21 base × height
o Volume of a rectangular solid = length x width x height
Volume of a rectangular solid = Area of the base × height
Students should investigate, using manipulatives (e.g., paper folding, graph paper,
geoboards) the physical relationships among rectangles, squares, and right triangles, in
order to develop formulas for their areas. The area of rectangular regions serves as the foundation upon which formulas for areas of other geometric figures are based.
Volume is a measure of capacity. Volume and capacity both refer to measures of three-
dimensional regions but the specific terms are typically used in different contexts and with
different units of measurement. Volume usually refers to the amount of space an object
takes up. Volume is measured in cubic units; e.g., cubic centimeters, cubic inches, cubic
feet, etc. Units of volume are based on linear measures. Capacity usually refers to the
amount that a container will hold. Units of capacity include milliliter, liter, cup, pint, quart,
gallon, etc. In casual use, the terms volume and capacity are often used interchangeably. It
is interesting that, in the metric system, volume and capacity are related by the relationship:
1 milliliter (mL) of a substance occupies the space of 1 cubic centimeter (cc).
It is beneficial for students to associate the area representation of products in multiplication
(rectangular arrays) with the concept of area. They will readily recognize: Area of a
rectangle = length x width OR Area of a rectangle = base x height. Using the formula A =
base x height makes it easier to relate the formula for the area of a rectangle to the formula
for area of a triangle, including those without right angles.
Students need to use manipulatives, such as stacked cubes, to develop the understanding
that the volume of a rectangular solid can be found by multiplying the Area of the base by
the height of the rectangular solid. Since length x width gives the area of the base and it
then multiplied by the height, the formula length x width x height may also be derived.
(continued)

GRADE 5 CURRICULUM GUIDE PRINCE WILLIAM COUNTY SCHOOLS
Curriculum Information
Essential Knowledge and Skills
Key Vocabulary
Essential Questions and Understandings
Teacher Notes and Elaborations
Strand
Measurement
SOL Reporting Category
Measurement and Geometry
Virginia SOL 5.8
The student will
a. find perimeter, area, and volume in
standard units of measure;
b. differentiate among perimeter, area,
and volume and identify whether the
application of the concept of
perimeter, area, or volume is
appropriate for a given situation; c. identify equivalent measurements
within the metric system;
d. estimate and then measure to solve
problems, using U.S. Customary
and metric units; and
e. choose an appropriate unit of
measure for a given situation
involving measurement using U.S.
Customary and metric units.
Foundational Objectives
4.6
The student will
a) estimate and measure weight/mass
and describe the results in U.S.
Customary and metric units as
appropriate; and
b) identify equivalent measurements
between units within the U.S.
Customary system (ounces,
pounds, and tons) and between
units within the metric system (grams and kilograms).
(continued on next page)
Key Vocabulary
area
capacity
Celsius
centimeters cubic unit
cup
Fahrenheit
foot
gallon
grams
inch
kilograms
kilometers
liters
meters mile
milliliters
millimeters
ounce
perimeter
pint
polygon
pound
practical situation
quart
square unit
ton unit of measure
volume
yard
Teacher Notes and Elaborations (continued)
U.S. Customary units for measurement of length include inches, feet, yards, and miles.
Appropriate measuring devices include rulers, yardsticks, and tape measures. When
measuring with U.S. Customary units, students should be able to measure to the nearest part
of an inch81
41
21 ,, , foot, or yard. Metric units for measurement of length include
millimeters, centimeters, meters, and kilometers. Appropriate measuring devices include
centimeter rulers, meter sticks, and tape measures.
Weight and mass are different. Mass is the amount of matter in an object. Weight is
determined by the pull of gravity on the mass of an object. The mass of an object remains
the same regardless of its location. The weight that an object changes is dependent on the
gravitational pull at its location. In everyday life, most people are actually interested in
determining an object’s mass, although they use the term weight (e.g., ―How much does it
weigh?‖ versus ―What is its mass?‖).
Balances are appropriate measuring devices to measure mass in U.S. Customary units (ounces, pounds) and metric units (grams, kilograms).
U.S. Customary units to measure liquid volume (capacity) include cups, pints, quarts, and
gallons. Metric units to measure liquid volume (capacity) include milliliters and liters.
Temperature is measured using a thermometer. The U.S. Customary unit of measure is
degrees Fahrenheit; the metric unit of measure is degrees Celsius.
Practical experience measuring familiar objects helps students establish benchmarks and
facilitates students’ ability to use the units of measure to make estimates.

GRADE 5 CURRICULUM GUIDE PRINCE WILLIAM COUNTY SCHOOLS
Curriculum Information
Essential Knowledge and Skills
Key Vocabulary
Essential Questions and Understandings
Teacher Notes and Elaborations
Functional Objectives
4.7
The student will
a) estimate and measure length, and describe the result in both metric
and U.S. Customary units; and
b) identify equivalent measurements
between units within the U.S.
Customary system (inches and feet;
feet and yards; inches and yards;
yards and miles) and between units
within the metric system
(millimeters and centimeters;
centimeters and meters; and
millimeters and meters).
4.8
The student will
a) estimate and measure liquid volume
and describe the results in U.S.
Customary units; and
b) identify equivalent measurements
between units within the U.S.
Customary system (cups, pints,
quarts, and gallons).
GRADE 5 CURRICULUM GUIDE PRINCE WILLIAM COUNTY SCHOOLS
Curriculum Information
Essential Knowledge and Skills
Key Vocabulary
Essential Questions and Understandings
Teacher Notes and Elaborations
Strand
Measurement
SOL Reporting Category Measurement and Geometry
Virginia SOL 5.9
The student will identify and describe
the diameter, radius, chord, and
circumference of a circle.
The student will use problem solving,
mathematical communication,
mathematical reasoning, connections
and representations to
Identify and describe the diameter, radius, chord, and circumference of a
circle.
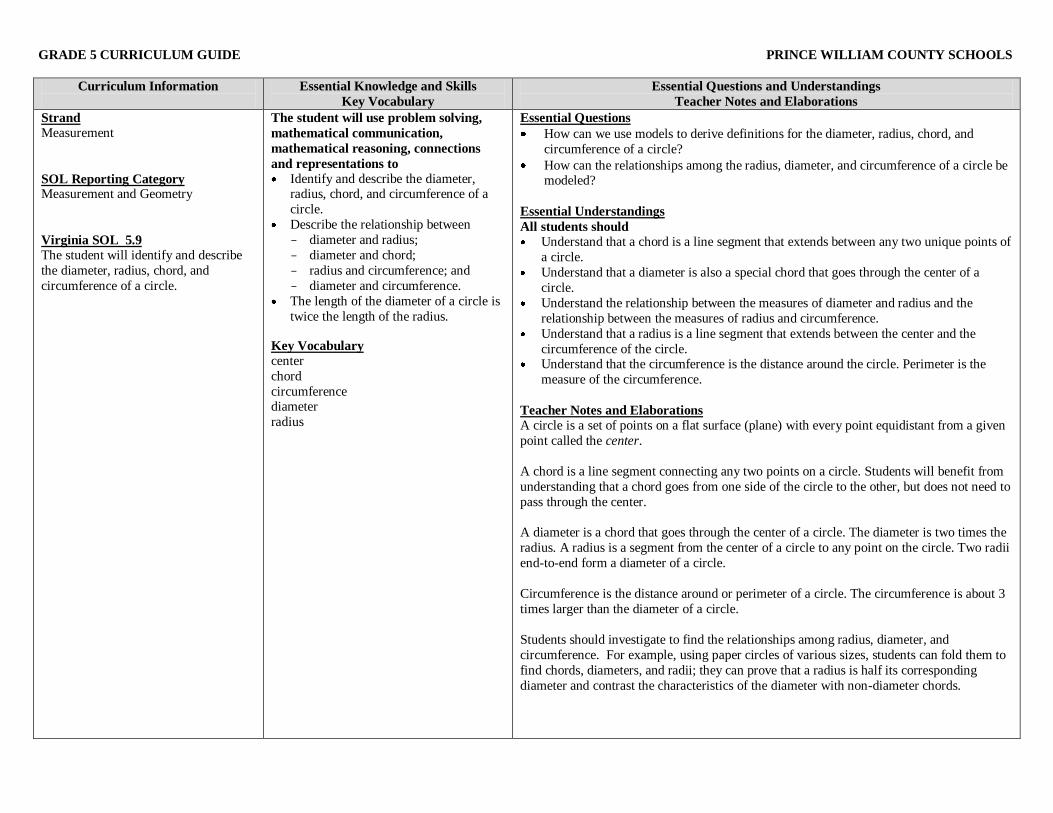
Describe the relationship between
- diameter and radius;
- diameter and chord;
- radius and circumference; and
- diameter and circumference.
The length of the diameter of a circle is
twice the length of the radius.
Key Vocabulary
center
chord
circumference diameter
radius
Essential Questions
How can we use models to derive definitions for the diameter, radius, chord, and
circumference of a circle?
How can the relationships among the radius, diameter, and circumference of a circle be modeled?
Essential Understandings
All students should
Understand that a chord is a line segment that extends between any two unique points of
a circle.
Understand that a diameter is also a special chord that goes through the center of a
circle.
Understand the relationship between the measures of diameter and radius and the
relationship between the measures of radius and circumference.
Understand that a radius is a line segment that extends between the center and the
circumference of the circle. Understand that the circumference is the distance around the circle. Perimeter is the
measure of the circumference.
Teacher Notes and Elaborations
A circle is a set of points on a flat surface (plane) with every point equidistant from a given
point called the center.
A chord is a line segment connecting any two points on a circle. Students will benefit from
understanding that a chord goes from one side of the circle to the other, but does not need to
pass through the center.
A diameter is a chord that goes through the center of a circle. The diameter is two times the
radius. A radius is a segment from the center of a circle to any point on the circle. Two radii
end-to-end form a diameter of a circle.
Circumference is the distance around or perimeter of a circle. The circumference is about 3
times larger than the diameter of a circle.
Students should investigate to find the relationships among radius, diameter, and
circumference. For example, using paper circles of various sizes, students can fold them to
find chords, diameters, and radii; they can prove that a radius is half its corresponding
diameter and contrast the characteristics of the diameter with non-diameter chords.
GRADE 5 CURRICULUM GUIDE PRINCE WILLIAM COUNTY SCHOOLS
Curriculum Information
Essential Questions and Understandings
Teacher Notes and Elaborations
Strand
Measurement
SOL Reporting Category Measurement and Geometry
Virginia SOL 5.9
The student will identify and describe
the diameter, radius, chord, and
circumference of a circle.
Teacher Notes and Elaborations (continued)
By collecting and analyzing measurement data for each circle – radius, diameter, and approximate circumference – they can deduce that a
circle’s circumference is always slightly longer than three times its diameter. This relationship is fundamental to the understanding of the
mathematical constant, pi (π), and the formulas for circumference and area of circles and surface area and volume of spheres and solids with circular bases.

GRADE 5 CURRICULUM GUIDE PRINCE WILLIAM COUNTY SCHOOLS
Curriculum Information
Essential Knowledge and Skills
Key Vocabulary
Essential Questions and Understandings
Teacher Notes and Elaborations
Strand
Measurement
SOL Reporting Category Measurement and Geometry
Virginia SOL 5.10
The student will determine an amount
of elapsed time in hours and minutes
within a 24-hour period.
Foundational Objective
4.9
The student will determine elapsed time
in hours and minutes within a 12-hour
period.
The student will use problem solving,
mathematical communication,
mathematical reasoning, connections
and representations to
Determine elapsed time in hours and minutes within a 24 - hour period.
Key Vocabulary
a.m.
elapsed time
p.m.
Essential Questions
What is meant by elapsed time?
In what everyday situations do we determine elapsed time?
How can elapsed time be determined in hours and minutes within a 24-hour period?
Essential Understandings
All students should
Understand that elapsed time can be found by counting on from the beginning time to
the finishing time.
Teacher Notes and Elaborations
Elapsed time is the amount of time that has passed between two given times.
Elapsed time can be found by counting on from the beginning time to the finishing time.
One way to do this is as follows:
- Count the number of whole hours between the beginning time and the finishing time
- Count the remaining minutes. - Add the hours and minutes. For example, to find the elapsed time between 10:15
a.m. and 1:25 p.m., count on as follows:
- from 10:15 a.m. to 1:15 p.m., count 3 hours;
- from 1:15 p.m. to 1:25 p.m., count 10 minutes; and then
- add 3 hours to 10 minutes to find the total elapsed time of 3 hours and 10
minutes.
Students could also use an open number line to figure out elapsed time. For example:
10:15 a.m 1:15 p.m. 11:00 12:00 1:00
45 min. 1 hour. 1 hour. 15 min.
A student might think:
45 min. + 15 min. = 1 hour
1 hour + 1 hour + 1 hour = 3 hours

GRADE 5 CURRICULUM GUIDE PRINCE WILLIAM COUNTY SCHOOLS
Curriculum Information
Essential Knowledge and Skills
Key Vocabulary
Essential Questions and Understandings
Teacher Notes and Elaborations
Strand
Measurement
SOL Reporting Category
Measurement and Geometry
Virginia SOL 5.11
The student will measure right, acute,
obtuse, and straight angles.
Foundational Objective
4.10A
The student will identify and describe representations of points, lines, line
segments, rays, and angles, including
endpoints and vertices; identify
representations of lines that illustrate
intersection, parallelism, and
perpendicularity.
The student will use problem solving,
mathematical communication,
mathematical reasoning, connections
and representations to
Identify the appropriate tools (e.g.,
protractor and straightedge or angle ruler as well as available software) used to measure
and draw angles.
Measure right, acute, obtuse, and straight angles, using appropriate tools,
and identify their measures in degrees.
Recognize angle measure as additive. When an angle is decomposed into non-
overlapping parts, the angle measure of
the whole is the sum of the angle
measures of the parts.†
Solve addition and subtraction problems to find unknown angle
measures on a diagram in practical and
mathematical problems (e.g., by using
an equation with a symbol for the
unknown angle measure).†
Key Vocabulary
acute angle
degree
obtuse angle
protractor
right angle
straight angle
vertex
Essential Questions
How does angle measurement differ from linear measurement?
How is the size of an angle related to rotation?
How can we use benchmark angle measurements (e.g., 90°, 180°) to determine the
measurement of other angles?
How is a protractor or an angle ruler used to measure and draw angles?
Essential Understandings
All students should
Understand how to measure acute, right, obtuse, and straight angles.
Teacher Notes and Elaborations
Angles are measured in degrees. There are up to 360 degrees in an angle. A degree is 3601 of
a complete rotation of a full circle. There are 360 degrees in a circle.
To measure the number of degrees in an angle, a protractor or an angle ruler may be used.
A right angle measures exactly 90°.
An acute angle measures less than 90°.
An obtuse angle measures greater than 90° but less than 180°. A straight angle measures exactly 180°.
Before measuring an angle, students should first compare it to a right angle to determine
whether the measure of the angle is less than or greater than 90°. Recognizing immediately
whether an angle’s measure is greater or less than 90° is critical to selecting the correct
scale (inner or outer) on the protractor. Students should understand how to work with a
protractor or angle ruler as well as available computer software to measure and draw angles.
Students should be able to estimate an angle’s measure by comparing it to known
landmarks. Knowing that a right angle measures 90 degrees and a straight angle, 180
degrees, students can use these angles as landmarks to find angles of 30, 45, and 60, 120 and 150 degrees and estimate others in between these measures. Using fraction circle
manipulatives or graphics to represent angles of different magnitudes helps students
visualize and internalize the concept of 360 degrees as one full rotation and estimate the
measure of angles. For example, in a circle divided into fourths, each wedge represents an
angle of 90°; in a circle divided into sixths, each wedge represents an angle of 60°; in a
circle divided into twelfths, each wedge represents and angle of 30°. Experience with Turtle
graphics in the Logo computer language (or one of its variants) provides functional practice
with angle measure and enables students to internalize angle benchmarks/landmarks.
FOCUS 4–5 STRAND: GEOMETRY GRADE LEVEL 5
The study of geometry helps students represent and make sense of the world. At the fourth- and fifth-grade levels, reasoning skills
typically grow rapidly, and these skills enable students to investigate geometric problems of increasing complexity and to study how
geometric terms relate to geometric properties. Students develop knowledge about how geometric figures relate to each other and
begin to use mathematical reasoning to analyze and justify properties and relationships among figures.
Students discover these relationships by constructing, drawing, measuring, comparing, and classifying geometric figures.
Investigations should include explorations with everyday objects and other physical materials. Exercises that ask students to visualize,
draw, and compare figures will help them not only to develop an understanding of the relationships, but to develop their spat ial sense
as well. In the process, definitions become meaningful, relationships among figures are understood, and students are prepared to use
these ideas to develop informal arguments.
Students investigate, identify, and draw representations and describe the relationships between and among points, lines, line segments,
rays, and angles. Students apply generalizations about lines, angles, and triangles to develop understanding about congruence, other
lines such as intersecting, parallel, and perpendicular ones, and classifications of triangles.
The van Hiele theory of geometric understanding describes how students learn geometry and provides a framework for structuring
student experiences that should lead to conceptual growth and understanding.
Level 0: Pre-recognition. Geometric figures are not recognized. For example, students cannot differentiate between three-sided
and four-sided polygons.
Level 1: Visualization. Geometric figures are recognized as entities, without any awareness of parts of figures or relationships
between components of a figure. Students should recognize and name figures and distinguish a given figure from others that look
somewhat the same. (This is the expected level of student performance during grades K and 1.)
Level 2: Analysis. Properties are perceived but are isolated and unrelated. Students should recognize and name properties of
geometric figures. (Students are expected to transition to this level during grades 2 and 3.)
Level 3: Abstraction. Definitions are meaningful, with relationships being perceived between properties and between figures.
Logical implications and class inclusions are understood, but the role and significance of deduction is not understood. (Students
should transition to this level during grades 5 and 6 and fully attain it before taking algebra.

GRADE 5 CURRICULUM GUIDE PRINCE WILLIAM COUNTY SCHOOLS
Curriculum Information
Essential Knowledge and Skills
Key Vocabulary
Essential Questions and Understandings
Teacher Notes and Elaborations
Strand
Geometry
SOL Reporting Category Measurement and Geometry
Virginia SOL 5.12
The student will classify
a. angles as right, acute, obtuse, or
straight; and
b. triangles as right, acute, obtuse,
equilateral, scalene, or isosceles.
Foundational Objective
4.10 A
The student will identify and describe
representations of points, lines, line
segments, rays, and angles, including
endpoints and vertices; identify
representations of lines that illustrate
intersection, parallelism, and
perpendicularity.
The student will use problem solving,
mathematical communication,
mathematical reasoning, connections
and representations to
Classify angles as right, acute, straight, or obtuse.
Classify triangles as right, acute, or obtuse.
Classify triangles as equilateral, scalene, or isosceles.
Key Vocabulary equilateral
isosceles
scalene
vertex
Essential Questions
How can visualizing a circle folded into halves and quarters help us classify angles?
How are angle properties used to classify triangles?
How are side lengths used to classify triangles?
Essential Understandings
All students should
Understand that angles can be classified as right, acute, obtuse, or straight according to their measures.
Understand that a triangle can be classified as right, acute, or obtuse according to the measure of its largest angle.
Understand that a triangle can be classified as equilateral, scalene, or isosceles according to the number of sides with equal length.
Teacher Notes and Elaborations
Angles are formed by two rays with a common endpoint, called the vertex. Angles occur
where lines and/or line segments intersect. The symbol is used to indicate an angle.
A right angle measures exactly 90°.
An acute angle measures greater than 0° but less than 90°.
An obtuse angle measures greater than 90° but less than 180°.
A straight angle forms an angle that measures exactly 180°.
A right triangle has one right angle. An obtuse triangle has one obtuse angle.
An acute triangle has three acute angles (or no angle measuring 90° or greater).
An equilateral triangle has three equal sides (all sides congruent).
A scalene triangle has no congruent sides.
An isosceles triangle has two congruent sides.
Students should investigate the relationships between sides and angles in triangles using
geoboards, paper strips, drawings, etc. To facilitate the exploration of relationships, ask
students whether a right triangle can have an obtuse angle. Why or why not? Can an obtuse
triangle have more than one obtuse angle? Why or why not? What type of angles are the two angles other than the right angle in a right triangle? What type of angles are the two
angles other than the obtuse angle in an obtuse triangle?
(continued)
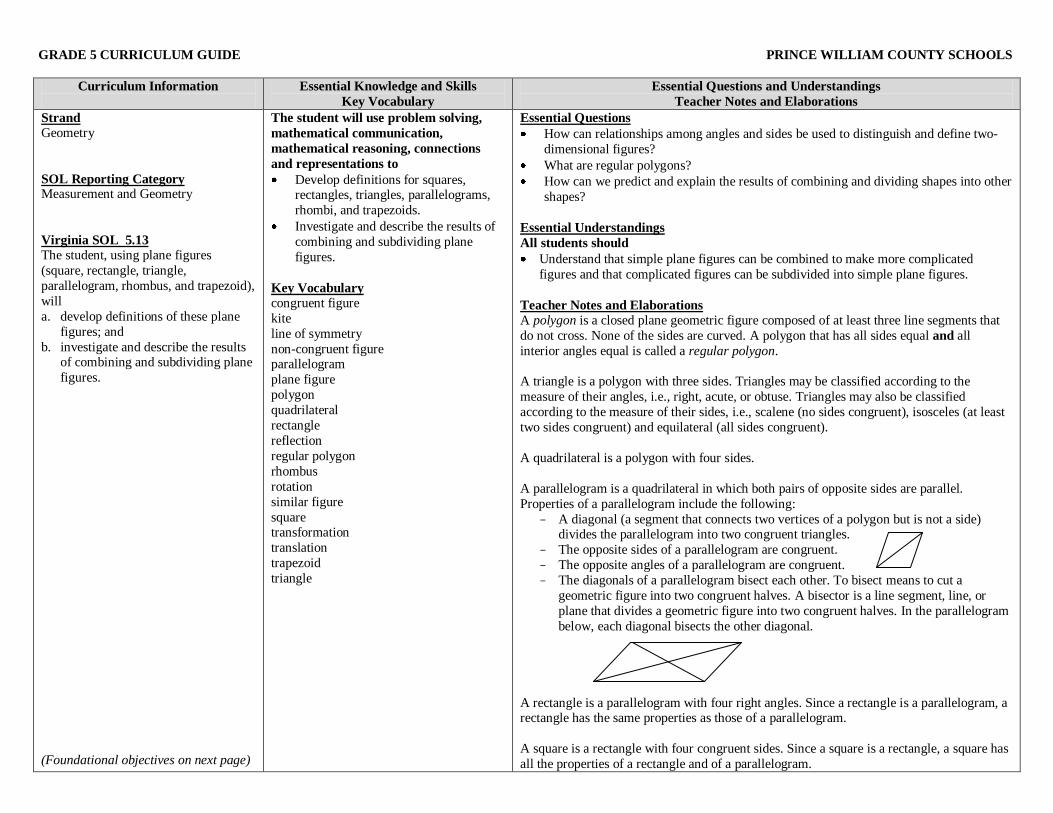
GRADE 5 CURRICULUM GUIDE PRINCE WILLIAM COUNTY SCHOOLS
Curriculum Information
Essential Knowledge and Skills
Key Vocabulary
Essential Questions and Understandings
Teacher Notes and Elaborations
Strand
Geometry
SOL Reporting Category Measurement and Geometry
Virginia SOL 5.13
The student, using plane figures
(square, rectangle, triangle,
parallelogram, rhombus, and trapezoid),
will
a. develop definitions of these plane
figures; and
b. investigate and describe the results of combining and subdividing plane
figures.
(Foundational objectives on next page)
The student will use problem solving,
mathematical communication,
mathematical reasoning, connections
and representations to
Develop definitions for squares, rectangles, triangles, parallelograms,
rhombi, and trapezoids.
Investigate and describe the results of
combining and subdividing plane
figures.
Key Vocabulary
congruent figure
kite
line of symmetry
non-congruent figure parallelogram
plane figure
polygon
quadrilateral
rectangle
reflection
regular polygon
rhombus
rotation
similar figure
square transformation
translation
trapezoid
triangle
Essential Questions
How can relationships among angles and sides be used to distinguish and define two-
dimensional figures?
What are regular polygons?
How can we predict and explain the results of combining and dividing shapes into other
shapes?
Essential Understandings
All students should
Understand that simple plane figures can be combined to make more complicated
figures and that complicated figures can be subdivided into simple plane figures.
Teacher Notes and Elaborations
A polygon is a closed plane geometric figure composed of at least three line segments that
do not cross. None of the sides are curved. A polygon that has all sides equal and all
interior angles equal is called a regular polygon.
A triangle is a polygon with three sides. Triangles may be classified according to the
measure of their angles, i.e., right, acute, or obtuse. Triangles may also be classified
according to the measure of their sides, i.e., scalene (no sides congruent), isosceles (at least
two sides congruent) and equilateral (all sides congruent).
A quadrilateral is a polygon with four sides.
A parallelogram is a quadrilateral in which both pairs of opposite sides are parallel.
Properties of a parallelogram include the following:
- A diagonal (a segment that connects two vertices of a polygon but is not a side) divides the parallelogram into two congruent triangles.
- The opposite sides of a parallelogram are congruent.
- The opposite angles of a parallelogram are congruent.
- The diagonals of a parallelogram bisect each other. To bisect means to cut a
geometric figure into two congruent halves. A bisector is a line segment, line, or
plane that divides a geometric figure into two congruent halves. In the parallelogram
below, each diagonal bisects the other diagonal.
A rectangle is a parallelogram with four right angles. Since a rectangle is a parallelogram, a rectangle has the same properties as those of a parallelogram.
A square is a rectangle with four congruent sides. Since a square is a rectangle, a square has
all the properties of a rectangle and of a parallelogram.
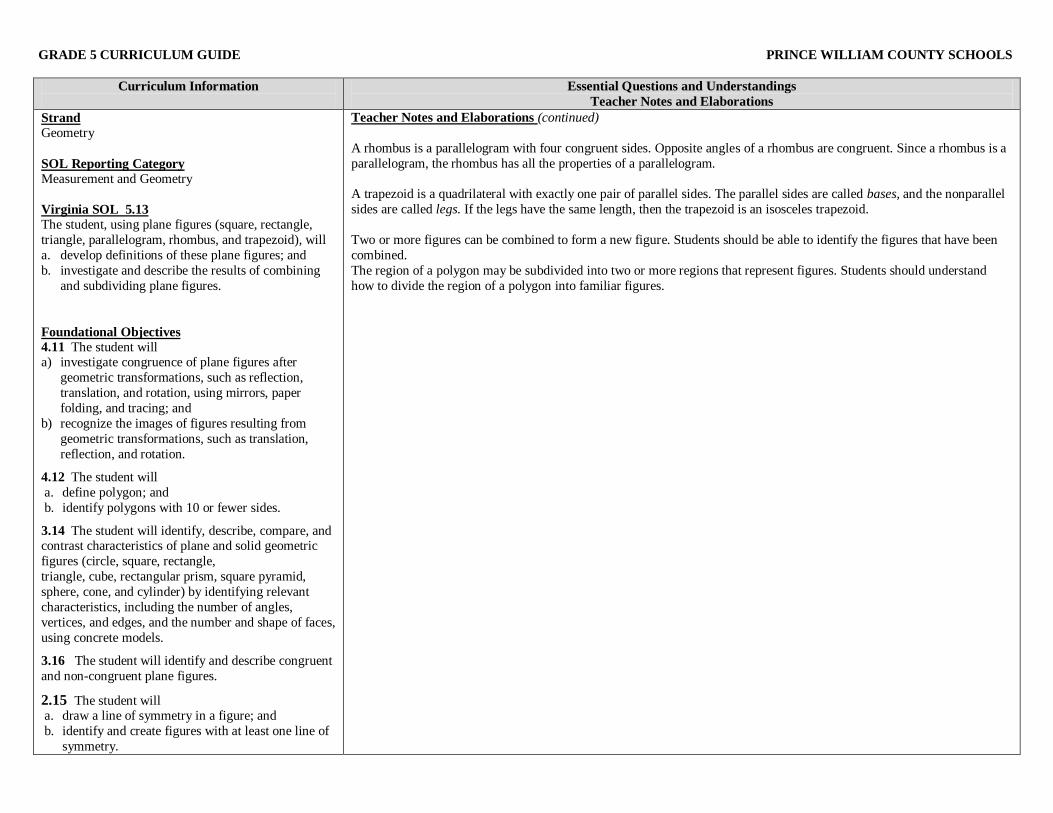
GRADE 5 CURRICULUM GUIDE PRINCE WILLIAM COUNTY SCHOOLS
Curriculum Information
Essential Questions and Understandings
Teacher Notes and Elaborations
Strand
Geometry
SOL Reporting Category
Measurement and Geometry
Virginia SOL 5.13
The student, using plane figures (square, rectangle,
triangle, parallelogram, rhombus, and trapezoid), will
a. develop definitions of these plane figures; and
b. investigate and describe the results of combining
and subdividing plane figures.
Foundational Objectives
4.11 The student will a) investigate congruence of plane figures after
geometric transformations, such as reflection,
translation, and rotation, using mirrors, paper
folding, and tracing; and
b) recognize the images of figures resulting from
geometric transformations, such as translation,
reflection, and rotation.
4.12 The student will
a. define polygon; and
b. identify polygons with 10 or fewer sides.
3.14 The student will identify, describe, compare, and contrast characteristics of plane and solid geometric
figures (circle, square, rectangle,
triangle, cube, rectangular prism, square pyramid,
sphere, cone, and cylinder) by identifying relevant
characteristics, including the number of angles,
vertices, and edges, and the number and shape of faces,
using concrete models.
3.16 The student will identify and describe congruent
and non-congruent plane figures.
2.15 The student will a. draw a line of symmetry in a figure; and
b. identify and create figures with at least one line of
symmetry.
Teacher Notes and Elaborations (continued)
A rhombus is a parallelogram with four congruent sides. Opposite angles of a rhombus are congruent. Since a rhombus is a
parallelogram, the rhombus has all the properties of a parallelogram.
A trapezoid is a quadrilateral with exactly one pair of parallel sides. The parallel sides are called bases, and the nonparallel
sides are called legs. If the legs have the same length, then the trapezoid is an isosceles trapezoid.
Two or more figures can be combined to form a new figure. Students should be able to identify the figures that have been
combined.
The region of a polygon may be subdivided into two or more regions that represent figures. Students should understand
how to divide the region of a polygon into familiar figures.

FOCUS 4–5 STRAND: PROBABILITY AND STATISTICS GRADE LEVEL 5
Students entering grades 4 and 5 have explored the concepts of chance and are able to determine possible outcomes of given events.
Students have utilized a variety of random generator tools, including random number generators (number cubes), spinners, and two-
sided counters. In game situations, students are able to predict whether the game is fair or not fair. Furthermore, students are able to
identify events as likely or unlikely to happen. Thus the focus of instruction at grades 4 and 5 is to deepen their understanding of the
concepts of probability by
offering opportunities to set up models simulating practical events;
engaging students in activities to enhance their understanding of fairness; and
engaging students in activities that instill a spirit of investigation and exploration and providing students with opportunities to
use manipulatives.
The focus of statistics instruction is to assist students with further development and investigation of data collection strategies. Students
should continue to focus on
posing questions;
collecting data and organizing this data into meaningful graphs, charts, and diagrams based on issues relating to practical
experiences;
interpreting the data presented by these graphs;
answering descriptive questions (―How many?‖, ―How much?‖) from the data displays;
identifying and justifying comparisons (―Which is the most? Which is the least?‖ ,―Which is the same? Which is different?‖)
about the information;
comparing their initial predictions to the actual results; and
writing a few sentences to communicate to others their interpretation of the data.
Through a study of probability and statistics, students develop a real appreciation of data analysis methods as powerful means for
decision making.
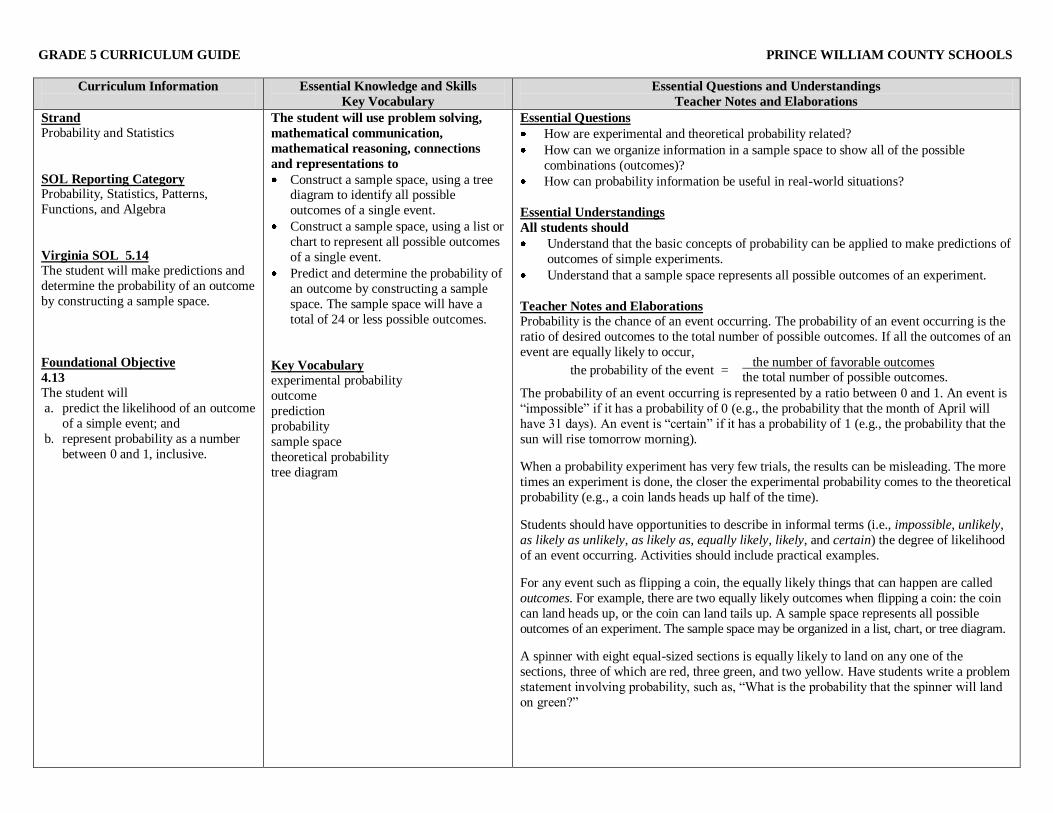
GRADE 5 CURRICULUM GUIDE PRINCE WILLIAM COUNTY SCHOOLS
Curriculum Information
Essential Knowledge and Skills
Key Vocabulary
Essential Questions and Understandings
Teacher Notes and Elaborations
Strand
Probability and Statistics
SOL Reporting Category Probability, Statistics, Patterns,
Functions, and Algebra
Virginia SOL 5.14
The student will make predictions and
determine the probability of an outcome
by constructing a sample space.
Foundational Objective
4.13
The student will
a. predict the likelihood of an outcome
of a simple event; and
b. represent probability as a number
between 0 and 1, inclusive.
The student will use problem solving,
mathematical communication,
mathematical reasoning, connections
and representations to
Construct a sample space, using a tree diagram to identify all possible
outcomes of a single event.
Construct a sample space, using a list or
chart to represent all possible outcomes
of a single event.
Predict and determine the probability of
an outcome by constructing a sample
space. The sample space will have a
total of 24 or less possible outcomes.
Key Vocabulary
experimental probability
outcome
prediction
probability
sample space
theoretical probability
tree diagram
Essential Questions
How are experimental and theoretical probability related?
How can we organize information in a sample space to show all of the possible
combinations (outcomes)?
How can probability information be useful in real-world situations?
Essential Understandings
All students should
Understand that the basic concepts of probability can be applied to make predictions of
outcomes of simple experiments.
Understand that a sample space represents all possible outcomes of an experiment.
Teacher Notes and Elaborations
Probability is the chance of an event occurring. The probability of an event occurring is the
ratio of desired outcomes to the total number of possible outcomes. If all the outcomes of an
event are equally likely to occur,
the probability of the event =
The probability of an event occurring is represented by a ratio between 0 and 1. An event is
―impossible‖ if it has a probability of 0 (e.g., the probability that the month of April will
have 31 days). An event is ―certain‖ if it has a probability of 1 (e.g., the probability that the
sun will rise tomorrow morning).
When a probability experiment has very few trials, the results can be misleading. The more
times an experiment is done, the closer the experimental probability comes to the theoretical
probability (e.g., a coin lands heads up half of the time).
Students should have opportunities to describe in informal terms (i.e., impossible, unlikely,
as likely as unlikely, as likely as, equally likely, likely, and certain) the degree of likelihood
of an event occurring. Activities should include practical examples.
For any event such as flipping a coin, the equally likely things that can happen are called
outcomes. For example, there are two equally likely outcomes when flipping a coin: the coin
can land heads up, or the coin can land tails up. A sample space represents all possible
outcomes of an experiment. The sample space may be organized in a list, chart, or tree diagram.
A spinner with eight equal-sized sections is equally likely to land on any one of the
sections, three of which are red, three green, and two yellow. Have students write a problem
statement involving probability, such as, ―What is the probability that the spinner will land
on green?‖
the number of favorable outcomes the total number of possible outcomes.

GRADE 5 CURRICULUM GUIDE PRINCE WILLIAM COUNTY SCHOOLS
Curriculum Information
Essential Questions and Understandings
Teacher Notes and Elaborations
Strand
Probability and Statistics
SOL Reporting Category Probability, Statistics, Patterns,
Functions, and Algebra
Virginia SOL 5.14
The student will make predictions and
determine the probability of an outcome
by constructing a sample space.
Foundational Objective
4.13
The student will
c. predict the likelihood of an outcome
of a simple event; and
d. represent probability as a number
between 0 and 1, inclusive.
Teacher Notes and Elaborations (continued)
Tree diagrams show all possible (outcomes) in a sample space. The Fundamental Counting Principle describes how to find the number of
outcomes when there are multiple choices. For example, how many different outfit combinations can you make from 2 shirts (red and blue)
and 3 pants (black, white, khaki)? The sample space displayed in a tree diagram would show that there are
2 × 3 = 6 (Fundamental Counting Principle) outfit combinations: red-black; red-white; red-khaki; blue-black; blue-white; blue-khaki.
The tree diagram below shows all combinations for 2 shirts (red and blue) and 3 pants (black, white, and khaki):
Shirts Pants Possible Outcomes
black red shirt with black pants
red white red shirt with white pants
khaki red shirt with khaki pants
black blue shirt with black pants
blue white blue shirt with white pants
khaki blue shirt with khaki pants
Probability expresses the chance that an event will happen over the long term. When a probability experiment has very few trials, the
results can be misleading. The more times an experiment is repeated, the closer the experimental probability comes to the theoretical
probability, e.g., a coin lands heads up 2
1 of the time. It is challenging for students (and some adults) to understand that a mathematical
probability is a prediction of the outcomes over a long period and not the prediction of the outcome for any single instance. Another
common misconception (especially among gamblers) is the belief that chance has ―memory‖, for example, believing that if you haven’t
rolled doubles for a long time, you are likely to roll a double very soon. Students tend to have difficulty with the concept of randomness.
Our English language uses the term ―luck‖ to represent both random good fortune (as in ―the luck of the draw‖) and the non-scientific
predetermination of superstitious luck.

GRADE 5 CURRICULUM GUIDE PRINCE WILLIAM COUNTY SCHOOLS
Curriculum Information
Essential Knowledge and Skills
Key Vocabulary
Essential Questions and Understandings
Teacher Notes and Elaborations
Strand
Probability and Statistics
SOL Reporting Category Probability, Statistics, Patterns,
Functions, and Algebra
Virginia SOL 5.15
The student, given a problem situation,
will collect, organize, and interpret data
in a variety of forms using stem-and-
leaf plots and line graphs.
Foundational Objectives
4.14
The student will collect, organize,
display, and interpret data from a
variety of graphs.
The student will use problem solving,
mathematical communication,
mathematical reasoning, connections
and representations to
Formulate the question that will guide the data collection.
Collect data, using observations (e.g.,
weather), measurement (e.g., shoe
sizes), surveys (e.g., hours watching
television), or experiments (e.g., plant
growth).
Organize the data into charts, tables,
stem-and-leaf plots, and line graphs
(numerical data).
Display data in line graphs, and stem-
and-leaf plots.
Construct line graphs, labeling the
vertical axis with equal whole number,
decimal, or fractional increments and
the horizontal axis with continuous data
commonly related to time (e.g., hours,
days, months, years, and age). Line
graphs will have no more than six
identified points along a continuum for
continuous data (e.g., the decades:
1950s, 1960s, 1970s, 1980s, 1990s, and
2000s).
Construct a stem-and-leaf plot to
organize and display data, where the
stem is listed in ascending order and the
leaves are in ascending order, with or
without commas between leaves.
Title the given graph or identify the
title.
Interpret the data in a variety of forms
(e.g., orally or in written form.)
Essential Questions
How are mathematics and the scientific method related?
How do the selections of the question, sample, method of data collection, and way in
which data are displayed influence conclusions about the data?
How is a stem-and-leaf plot created?
Both the line plot and the stem-and-leaf plot are helpful in determining median, mode,
minimum, maximum, range and outliers. What is the advantage of the stem-and-leaf
plot?
How is a line graph constructed? …interpreted?
How can a line graph aid in the identification of trends?
Essential Understandings
All students should
Understand how to interpret collected and organized data.
Understand that stem-and-leaf plots list data in a meaningful array. It helps in finding median, modes, minimum and maximum values, and ranges.
Understand that line graphs show changes over time.
Teacher Notes and Elaborations
The emphasis in all work with statistics should be on the analysis and the communication of
the analysis, rather than on a single correct answer. Data analysis should include
opportunities to describe the data, recognize patterns or trends, and make predictions.
Statistical investigations should be active, with students formulating questions about
something in their environment and finding quantitative ways to answer the questions.
Investigations can be brief class surveys or more extended projects taking many days.
Through experiences displaying data in a variety of graphical representations, students learn
to select an appropriate representation.
Line graphs are used to show how two continuous variables are related. Line graphs may be
used to show how one variable changes over time. If one variable is not continuous, then a
broken line is used. By looking at a line graph, it can be determined whether the variable is
increasing, decreasing, or staying the same over time.
- The values along the horizontal axis represent continuous data on a given variable,
usually some measure of time (e.g., time in years, months, or days). The data
presented on a line graph is referred to as ―continuous data‖ because it represents
data collected over a continuous period of time.

GRADE 5 CURRICULUM GUIDE PRINCE WILLIAM COUNTY SCHOOLS
Curriculum Information
Essential Knowledge and Skills
Key Vocabulary
Essential Questions and Understandings
Teacher Notes and Elaborations
Strand
Probability and Statistics
SOL Reporting Category Probability, Statistics, Patterns,
Functions, and Algebra
Virginia SOL 5.15
The student, given a problem situation,
will collect, organize, and interpret data
in a variety of forms using stem-and-
leaf plots and line graphs.
Foundational Objectives
4.14
The student will collect, organize,
display, and interpret data from a
variety of graphs.
Key Vocabulary
axis (horizontal (x) and vertical (y))
bar graph
interpret
line graph mean
median
mode
outliers
range
stem-and-leaf plot
trends
Teacher Notes and Elaborations (continued)
- A line graph tells whether something has increased, decreased, or stayed the same
with the passage of time. Statements representing an analysis and interpretation of
the characteristics of the data in the graph should be included (e.g., trends of increase
and/or decrease, and least and greatest). A broken line is used if the data collected is not continuous data (such as test scores); a solid line is used if the data is continuous
(such as height of a plant).
- The values along the vertical axis are the scale and represent the frequency with
which those values occur in the data set. The values should represent equal
increments of multiples of whole numbers, fractions, or decimals depending upon
the data being collected. The scale should extend one increment above the greatest
recorded piece of data.
- Each axis should be labeled and the graph should have a title.
Numerical data are values that are quantities such as counts, measurements and ratings.
They can be discrete or continuous. Discrete data are data for which only certain values are possible. For instance, the number of children in a family or the number of letters in a name
generates discrete data because each data point must be a whole number. Line plots are
useful representations of discrete data. Continuous data occur on a continuous scale. For
any two values, there are always values in between. For instance, the time it takes to walk
to school or the height of basketball players are continuous data. Line graphs are
representations for continuous data. In science, numerical data is referred to as quantitative
data.
Categorical data summarize responses with respect to a given category; categorical data
are often, though not always, words. Questions generating categorical data often start with
―Which‖ or ―What‖: In which months were the greatest number of classmates born? What
are the favorite flavors of ice cream? What kinds of pets do our classmates have? What is your favorite number? The only method for comparing categorical data is to describe the
number of data points in each category. Because frequency counts can be made for the
values of each category, students often confuse numerical and categorical data. Categorical
data can be organized in tallies and tables and are often represented in pictographs, circle
graphs (pie charts), and bar graphs. In science, categorical data is referred to as qualitative
data.
Bar graphs should be used to compare counts of different categories (categorical data).
One bar is used for each category with the length of the bar representing the count for that
category. There is space before, between, and after the bars. The width of the bars should be
approximately equal to the width of the spaces before, between, and after the bars.
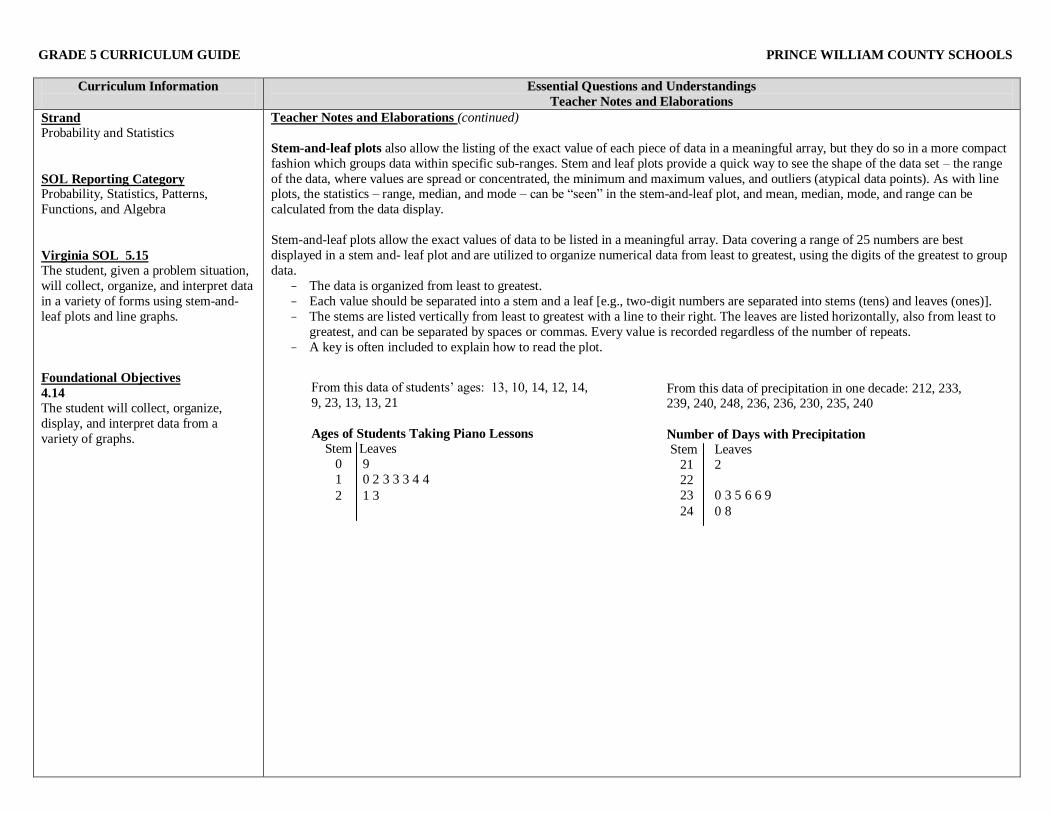
GRADE 5 CURRICULUM GUIDE PRINCE WILLIAM COUNTY SCHOOLS
Curriculum Information
Essential Questions and Understandings
Teacher Notes and Elaborations
Strand
Probability and Statistics
SOL Reporting Category Probability, Statistics, Patterns,
Functions, and Algebra
Virginia SOL 5.15
The student, given a problem situation,
will collect, organize, and interpret data
in a variety of forms using stem-and-
leaf plots and line graphs.
Foundational Objectives
4.14
The student will collect, organize,
display, and interpret data from a
variety of graphs.
Teacher Notes and Elaborations (continued)
Stem-and-leaf plots also allow the listing of the exact value of each piece of data in a meaningful array, but they do so in a more compact
fashion which groups data within specific sub-ranges. Stem and leaf plots provide a quick way to see the shape of the data set – the range
of the data, where values are spread or concentrated, the minimum and maximum values, and outliers (atypical data points). As with line plots, the statistics – range, median, and mode – can be ―seen‖ in the stem-and-leaf plot, and mean, median, mode, and range can be
calculated from the data display.
Stem-and-leaf plots allow the exact values of data to be listed in a meaningful array. Data covering a range of 25 numbers are best
displayed in a stem and- leaf plot and are utilized to organize numerical data from least to greatest, using the digits of the greatest to group
data.
- The data is organized from least to greatest.
- Each value should be separated into a stem and a leaf [e.g., two-digit numbers are separated into stems (tens) and leaves (ones)].
- The stems are listed vertically from least to greatest with a line to their right. The leaves are listed horizontally, also from least to
greatest, and can be separated by spaces or commas. Every value is recorded regardless of the number of repeats.
- A key is often included to explain how to read the plot.
From this data of students’ ages: 13, 10, 14, 12, 14,
9, 23, 13, 13, 21
Ages of Students Taking Piano Lessons Stem Leaves
0 9
1 0 2 3 3 3 4 4
2 1 3
From this data of precipitation in one decade: 212, 233, 239, 240, 248, 236, 236, 230, 235, 240
Number of Days with Precipitation
Stem Leaves
21 2
22
23 0 3 5 6 6 9
24 0 8
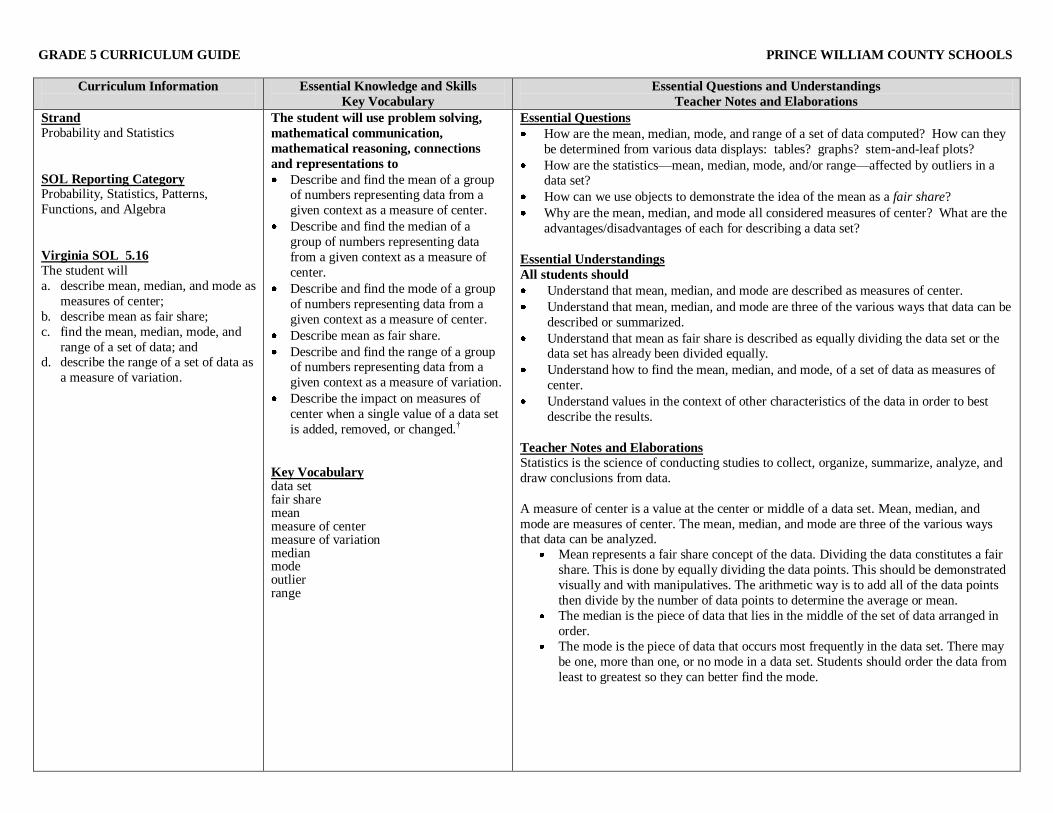
GRADE 5 CURRICULUM GUIDE PRINCE WILLIAM COUNTY SCHOOLS
Curriculum Information
Essential Knowledge and Skills
Key Vocabulary
Essential Questions and Understandings
Teacher Notes and Elaborations
Strand
Probability and Statistics
SOL Reporting Category Probability, Statistics, Patterns,
Functions, and Algebra
Virginia SOL 5.16
The student will
a. describe mean, median, and mode as
measures of center;
b. describe mean as fair share;
c. find the mean, median, mode, and
range of a set of data; and d. describe the range of a set of data as
a measure of variation.
The student will use problem solving,
mathematical communication,
mathematical reasoning, connections
and representations to
Describe and find the mean of a group of numbers representing data from a
given context as a measure of center.
Describe and find the median of a
group of numbers representing data
from a given context as a measure of
center.
Describe and find the mode of a group
of numbers representing data from a
given context as a measure of center.
Describe mean as fair share.
Describe and find the range of a group of numbers representing data from a
given context as a measure of variation.
Describe the impact on measures of
center when a single value of a data set
is added, removed, or changed.†
Key Vocabulary data set fair share mean measure of center measure of variation median mode outlier range
Essential Questions
How are the mean, median, mode, and range of a set of data computed? How can they
be determined from various data displays: tables? graphs? stem-and-leaf plots?
How are the statistics—mean, median, mode, and/or range—affected by outliers in a data set?
How can we use objects to demonstrate the idea of the mean as a fair share?
Why are the mean, median, and mode all considered measures of center? What are the
advantages/disadvantages of each for describing a data set?
Essential Understandings
All students should
Understand that mean, median, and mode are described as measures of center.
Understand that mean, median, and mode are three of the various ways that data can be
described or summarized.
Understand that mean as fair share is described as equally dividing the data set or the data set has already been divided equally.
Understand how to find the mean, median, and mode, of a set of data as measures of
center.
Understand values in the context of other characteristics of the data in order to best
describe the results.
Teacher Notes and Elaborations
Statistics is the science of conducting studies to collect, organize, summarize, analyze, and
draw conclusions from data.
A measure of center is a value at the center or middle of a data set. Mean, median, and
mode are measures of center. The mean, median, and mode are three of the various ways that data can be analyzed.
Mean represents a fair share concept of the data. Dividing the data constitutes a fair
share. This is done by equally dividing the data points. This should be demonstrated
visually and with manipulatives. The arithmetic way is to add all of the data points
then divide by the number of data points to determine the average or mean.
The median is the piece of data that lies in the middle of the set of data arranged in
order.
The mode is the piece of data that occurs most frequently in the data set. There may
be one, more than one, or no mode in a data set. Students should order the data from
least to greatest so they can better find the mode.
GRADE 5 CURRICULUM GUIDE PRINCE WILLIAM COUNTY SCHOOLS
Curriculum Information
Essential Questions and Understandings
Teacher Notes and Elaborations
Strand
Probability and Statistics
SOL Reporting Category Probability, Statistics, Patterns,
Functions, and Algebra
Virginia SOL 5.16
The student will
a. describe mean, median, and mode as
measures of center;
b. describe mean as fair share;
c. find the mean, median, mode, and
range of a set of data; and d. describe the range of a set of data as
a measure of variation.
Teacher Notes and Elaborations (continued)
The range is the spread of a set of data. The range of a set of data is the difference between the greatest and least values in the data set. It is
determined by subtracting the least number in the data set from the greatest number in the data set. An example is ordering test scores from
least to greatest: 73, 77, 84, 87, 89, 91, 94. The greatest score in the data set is 94 and the least score is 73, so the least score is subtracted from the greatest score or 94 - 73 = 21. The range of these test scores is 21. We would say that these scores vary less than a set of scores
with a range of 40 points.
Students need to learn more than how to identify the mean, median, mode, and range of a set of data. They need to build an understanding
of what the number tells them about the data, and they need to see those values in the context of other characteristics of the data in order to
best describe the results.
Measures of central tendency are types of averages for a data set. They represent numbers that best describe a data set.
Mean, median, and mode are the measures of central tendency and are useful for describing the average for different situations.
Mean works well for sets of data with no very high or low numbers.
Median is a good choice when data sets have a couple of values much higher or lower than most of the others. Mode is a good descriptor to use when the set of data has many identical values.

FOCUS 4–5 STRAND: PATTERNS, FUNCTIONS, AND ALGEBRA GRADE LEVEL 5
Students entering grades 4 and 5 have had opportunities to identify patterns within the context of the school curriculum and in their
daily lives, and they can make predictions about them. They have had opportunities to use informal language to describe the changes
within a pattern and to compare two patterns. Students have also begun to work with the concept of a variable by describing
mathematical relationships in open number sentences.
The focus of instruction is to help students develop a solid use of patterning as a problem solving tool. At this level, patterns are
represented and modeled in a variety of ways, including numeric, geometric, and algebraic formats. Students develop strategies for
organizing information more easily to understand various types of patterns and functional relationships. They interpret the structure of
patterns by exploring and describing patterns that involve change, and they begin to generalize these patterns. By interpreting
mathematical situations and models, students begin to represent these, using symbols and variables to write ―rules‖ for patterns, to
describe relationships and algebraic properties, and to represent unknown quantities.

GRADE 5 CURRICULUM GUIDE PRINCE WILLIAM COUNTY SCHOOLS
Curriculum Information
Essential Knowledge and Skills
Key Vocabulary
Essential Questions and Understandings
Teacher Notes and Elaborations
Strand
Patterns, Functions, and Algebra
SOL Reporting Category Probability, Statistics, Patterns,
Functions, and Algebra
Virginia SOL 5.17
The student will describe the
relationship found in a numerical
pattern and express the relationship.
Foundational Objective
4.15
The student will recognize, create, and
extend numerical and geometric
patterns.
The student will use problem solving,
mathematical communication,
mathematical reasoning, connections
and representations to
Describe numerical and geometric patterns formed by using concrete
materials and calculators.
Describe the relationship found in
patterns, using words, tables, and
symbols to express the relationship.
Key Vocabulary
expression
function
growing pattern numerical
pattern
Essential Questions
How can a pattern be identified, described, and represented?
What is the relationship between patterns and functions (―rules‖)?
How are tables, graphs, and mathematical expressions used to represent relationships in patterns?
How can pattern identification be used to solve problems?
Essential Understandings
All students should
Understand that patterns and functions can be represented in many ways and described
using words, tables, and symbols.
Understand the structure of a pattern and how it grows or changes using concrete
materials and calculators.
Understand that mathematical relationships exist in patterns.
Understand that an expression uses symbols to define a relationship and shows how each number in the list, after the first number, is related to the preceding number.
Understand that expressions can be numerical or variable or a combination of numbers
and variables.
Teacher Notes and Elaborations
There are an infinite number of patterns.
The simplest types of patterns are repeating patterns. In such patterns, students need to
identify the basic unit of the pattern and repeat it.
Growing patterns are more difficult for students to understand than repeating patterns
because not only must they determine what comes next, they must also begin the process of
generalization. Students need experiences with growing patterns.
Sample numerical patterns are
6, 9, 12, 15, 18, …;
5, 7, 9, 11, 13, …;
1, 2, 4, 7, 11, 16, …;
2, 4, 8, 16, 32, …;
32, 30, 28, 26, 24…; and
1, 5, 25, 125, 625, ….
A sample geometric pattern is: , , , , , , …

GRADE 5 CURRICULUM GUIDE PRINCE WILLIAM COUNTY SCHOOLS
Curriculum Information
Essential Questions and Understandings
Teacher Notes and Elaborations
Strand
Patterns, Functions, and Algebra
SOL Reporting Category Probability, Statistics, Patterns,
Functions, and Algebra
Virginia SOL 5.17
The student will describe the
relationship found in a numerical
pattern and express the relationship.
Foundational Objective
4.15
The student will recognize, create, and
extend numerical and geometric
patterns.
Teacher Notes and Elaborations (continued)
An expression, like a phrase, has no equal sign.
When the pattern data are graphed in a T-table, an expression can represent that data. An example is:
X Y
6 9
7 10
11 14
15 18
This example defines the relationship as y = x + 3.
A verbal quantitative expression involving one operation can be represented by a variable expression that describes what is going on.
Numbers are used when they are known; variables are used when the numbers are unknown. For example, ―a full box of cookies and four
extra‖ can be represented by 4b ; ―three full boxes of cookies‖ by 3b; ―a full box of cookies shared among four‖ by4
b .
A mathematical expression contains a variable or a combination of variables, numbers, and/or operation symbols and represents a
mathematical relationship. An expression cannot be solved. Expressions are simplified by using the order of operations. The same pattern can be found in many different forms. Reproduction of a given pattern in a different representation, using symbols and
objects, lays the foundation for writing the relationship symbolically or algebraically.
Non-repeating patterns are more difficult for students to understand than repeating patterns as they must not only determine what comes
next, but they must also begin the process of generalization.
Growing patterns are non-repeating patterns that involve a progression from step to step. (These are technically termed sequences, and
the steps are also referred to as terms or stages.) Students may confuse the term ―growing‖ with ―increasing‖. They should also encounter growing patterns that ―diminish‖ such as 220,
200, 180, 160, … The numerical relationships represented in the function table can also be graphed on coordinate graphs (using ordered pairs representing
the step (x) and the number (y), and the pattern or rule can be deduced from the shape of the graph. Tables and graphs are important tools in solving problems and making predictions in situations involving change.
In some growing patterns called arithmetic sequences (or linear sequences), students must determine the difference, called the ―common
difference,‖ between each succeeding number in order to determine what is added to each previous number to obtain the next number.
Sample arithmetic patterns include 6, 9, 12, 15, 18, … ; and 5, 7, 9, 11, 13, ... (The sequence 1, 2, 4, 7, 11, 16, … is a numeric pattern, but
is not an arithmetic sequence because there is no common difference. The difference increases by 1 each time.)

GRADE 5 CURRICULUM GUIDE PRINCE WILLIAM COUNTY SCHOOLS
Curriculum Information
Essential Knowledge and Skills
Key Vocabulary
Essential Questions and Understandings
Teacher Notes and Elaborations
Strand
Patterns, Functions, and Algebra
SOL Reporting Category Probability, Statistics, Patterns,
Functions, and Algebra
Virginia SOL 5.18
The student will
a. investigate and describe the concept
of variable;
b. write an open sentence to represent
a given mathematical relationship,
using a variable; c. model one-step linear equations in
one variable, using addition and
subtraction; and
d. create a problem situation based on
a given open sentence, using a
single variable.
Foundational Objective
4.16 A
The student will recognize and demonstrate the meaning of equality in
an equation.
The student will use problem solving,
mathematical communication,
mathematical reasoning, connections
and representations to
Describe the concept of a variable (presented as boxes, letters, or other
symbols) as a representation of an
unknown quantity.
Write an open sentence with addition,
subtraction, multiplication, or division,
using a variable to represent a missing
number.
Model one-step linear equations using a
variety of concrete materials, such as
colored chips on an equation mat or
weights on a balance scale.
Create and write a word problem to
match a given open sentence with a
single variable and one operation.
Key Vocabulary
equation
open sentence
variable
variable expression
Essential Questions
What is a variable? Why are equations with variables (open sentences) useful?
How is the ―equal sign‖ in an open sentence like the fulcrum of a balance scale?
How can open sentences be modeled?
How can open sentences be used to represent problem situations?
Essential Understandings
All students should
Understand that a variable is a symbol that can stand for an unknown number or object.
Understand that a variable expression is a variable or combination of variables,
numbers, and symbols that represents a mathematical relationship.
Understand that verbal expressions can be translated to variable expressions.
Understand that an open sentence has a variable and an equal sign (=).
Understand that problem situations can be expressed as open sentences.
Teacher Notes and Elaborations
A variable is a symbol that can stand for an unknown number or object. A variable
expression is like a phrase: as a phrase does not have a verb, so an expression does not have
an equals sign (=).
A verbal expression involving one operation can be represented by a variable expression
that describes what is going on. Numbers are used when they are known; variables are used
when the numbers are unknown. For example, ―a full box of cookies and four extra‖ can be
represented by b + 4; ―three full boxes of cookies‖ by 3b; ―a full box of cookies shared
among four‖ by 4
b .
An open sentence contains a variable and an equals sign (=). For example, the sentence, ―A
full box of cookies and four extra equal 24 cookies.‖ can be written as b + 4 = 24, where b
stands for the number of cookies in one full box. ―Three full boxes of cookies equal 60 cookies.‖ can be written as 3b = 60. Another example of an open sentence is. b + 3 = 23 and
represents the answer to the word problem, ―How many cookies are in a box if the box plus
three more equals 23 cookies, where b stands for the number of cookies in the box?
At this level, discuss how the symbol × used to represent multiplication can often be
confused with the variable x. Students can minimize this confusion by using parentheses
[e.g., 4(x) = 20 or 4x = 20] or a small dot raised off the line to represent multiplication [4 • x = 20].

GRADE 5 CURRICULUM GUIDE PRINCE WILLIAM COUNTY SCHOOLS
Curriculum Information
Essential Questions and Understandings
Teacher Notes and Elaborations
Strand
Patterns, Functions, and Algebra
SOL Reporting Category Probability, Statistics, Patterns,
Functions, and Algebra
Virginia SOL 5.18
The student will
a. investigate and describe the concept
of variable;
b. write an open sentence to represent
a given mathematical relationship,
using a variable; c. model one-step linear equations in
one variable, using addition and
subtraction; and
d. create a problem situation based on
a given open sentence, using a
single variable.
Foundational Objective
4.16 A
The student will recognize and demonstrate the meaning of equality in
an equation.
Teacher Notes and Elaborations (continued)
By using story problems and numerical sentences, students begin to explore forming equations and representing quantities using variables.
An open sentence containing a variable is neither true nor false until the variable is replaced with a number.
Algebra is a tool that can make communicating mathematical ideas and solving mathematical problems easier. If mathematics is viewed as
a language, then algebra can be viewed as the shorthand of mathematics.
An equation is a mathematical sentence that describes a relationship between two mathematical expressions or ideas.
The concept of equality is not as straightforward or simple as it might appear. Students often view the equal sign as a signal to carry out
the specified operation(s). They must understand, instead, that the equal sign signifies that the quantity on each side of the equation is the
same. To understand equality in a manner that will support algebraic thinking, students must interpret expressions such as 6 + 2, 42 x 8,
and a + b as single quantities.
GRADE 5 CURRICULUM GUIDE PRINCE WILLIAM COUNTY SCHOOLS
Curriculum Information
Essential Knowledge and Skills
Key Vocabulary
Essential Questions and Understandings
Teacher Notes and Elaborations
Strand
Patterns, Functions, and Algebra
SOL Reporting Category Probability, Statistics, Patterns,
Functions, and Algebra
Virginia SOL 5.19
The student will investigate and
recognize the distributive property of
multiplication over addition.
Foundational Objective
4.16
The student will
a. recognize and demonstrate the
meaning of equality in an equation;
and
b. investigate and describe the
associative property for addition
and multiplication.
The student will use problem solving,
mathematical communication,
mathematical reasoning, connections
and representations to
Investigate and recognize the distributive property of whole numbers,
limited to multiplication over addition
using diagrams and manipulatives.
Investigate and recognize an equation
that represents the distributive property,
when given several whole number
equations, limited to multiplication over
addition
Key Vocabulary
distributive property
Essential Questions
What is the distributive property of multiplication over addition?
How can the distributive property be represented using manipulatives? …diagrams?
…equations?
How can the distributive property be applied to devise efficient strategies for
multiplying two numbers?
Essential Understandings
All students should
Understand that the distributive property states that multiplying a sum by a number
gives the same result as multiplying each addend by the number and then adding the
products.
Understand that using the distributive property with whole numbers helps with
understanding mathematical relationships.
Understand when and why the distributive property is used.
Teacher Notes and Elaborations
The distributive property states that multiplying a sum by a number gives the same
result as multiplying each addend by the number and then adding the products
(e.g., 3(4 + 5) = 3 x 4 + 3 x 5, 5 x (3 + 7) = (5 x 3) + (5 x 7); or
(2 x 3) + (2 x 5) = 2 x (3 + 5).
The distributive property can be used to simplify expressions
(e.g., 9 x 23 = 9 (20 + 3) = 180 + 27 = 207; or 5 x 19 = 5(10 + 9) = 50 + 45 = 95).