document
TRANSCRIPT

insight review articles
NATURE | VOL 405 | 15 JUNE 2000 | www.nature.com 827
Biological and biomedical research is in themidst of a significant transition that is beingdriven by two primary factors: the massiveincrease in the amount of DNA sequenceinformation and the development of
technologies to exploit its use. Consequently, we findourselves at a time when new types of experiments arepossible, and observations, analyses and discoveries arebeing made on an unprecedented scale. Over the past fewyears, more than 30 organisms have had their genomescompletely sequenced, with another 100 or so in progress(see www.tigr.org or [email protected] for a list). At least partial sequence has been obtained for tens of thousands of mouse, rat and human genes, and the sequence of two entire human chromosomes(chromosomes 21 and 22) has been determined1,2. Withinthe year, a large proportion of the human genome will bedeciphered, in both public and private efforts, and thecomplete sequence of the mouse and other animal andplant genomes will undoubtedly follow close behind.Unfortunately, the billions of bases of DNA sequence donot tell us what all the genes do, how cells work, how cellsform organisms, what goes wrong in disease, how we ageor how to develop a drug. This is where functionalgenomics comes into play. The purpose of genomics is tounderstand biology, not simply to identify the componentparts, and the experimental and computational methodstake advantage of as much sequence information aspossible. In this sense, functional genomics is less a specificproject or programme than it is a mindset and generalapproach to problems. The goal is not simply to provide acatalogue of all the genes and information about theirfunctions, but to understand how the components worktogether to comprise functioning cells and organisms.
To take full advantage of the large and rapidly increasingbody of sequence information, new technologies arerequired. Among the most powerful and versatile tools forgenomics are high-density arrays of oligonucleotides or com-plementary DNAs. Nucleic acid arrays work by hybridizationof labelled RNA or DNA in solution to DNA moleculesattached at specific locations on a surface. The hybridizationof a sample to an array is, in effect, a highly parallel search byeach molecule for a matching partner on an ‘affinity matrix’,
with the eventual pairings of molecules on the surface determined by the rules of molecular recognition. Arrays ofnucleic acids have been used for biological experiments formany years3–8. Traditionally, the arrays consisted of fragmentsof DNA, often with unknown sequence, spotted on a porousmembrane (usually nylon). The arrayed DNA fragmentsoften came from cDNA, genomic DNA or plasmid libraries,and the hybridized material was often labelled with a radioac-tive group. Recently, the use of glass as a substrate and fluores-cence for detection, together with the development of newtechnologies for synthesizing or depositing nucleic acids onglass slides at very high densities, have allowed the miniatur-ization of nucleic acid arrays with concomitant increases inexperimental efficiency and information content9–14 (Fig. 1).
While making arrays with more than several hundredelements was until recently a significant technical achievement, arrays with more than 250,000 differentoligonucleotide probes or 10,000 different cDNAs persquare centimetre can now be produced in significant numbers15,16. Although it is possible to synthesize or depositDNA fragments of unknown sequence, the most commonimplementation is to design arrays based on specificsequence information, a process sometimes referred to as‘downloading the genome onto a chip’ (Fig. 1). There areseveral variations on this basic technical theme: thehybridization reaction may be driven (for example, by anelectric field)17,18; other detection methods19 besides fluores-cence can be used; and the surface may be made of materialsother than glass such as plastic, silicon, gold, a gel or membrane, or may even be comprised of beads at the ends offibre-optic bundles20–22. Nonetheless, the key elements ofparallel hybridization to localized, surface-bound nucleicacid probes and subsequent counting of bound moleculesare ubiquitous, and high-density arrays of nucleic acids onglass (often called DNA microarrays, oligonucleotidearrays, GeneChip arrays, or simply ‘chips’) and their biological uses will be the focus of this review.
Global gene expression experimentsOne of the most important applications for arrays so far is themonitoring of gene expression (mRNA abundance). The col-lection of genes that are expressed or transcribed fromgenomic DNA, sometimes referred to as the expression
Genomics, gene expression and DNA arraysDavid J. Lockhart & Elizabeth A. Winzeler
Genomics Institute of the Novartis Research Foundation, 3115 Merryfield Row, San Diego, California 92121, USA
Experimental genomics in combination with the growing body of sequence information promise torevolutionize the way cells and cellular processes are studied. Information on genomic sequence can be usedexperimentally with high-density DNA arrays that allow complex mixtures of RNA and DNA to be interrogatedin a parallel and quantitative fashion. DNA arrays can be used for many different purposes, most prominentlyto measure levels of gene expression (messenger RNA abundance) for tens of thousands of genessimultaneously. Measurements of gene expression and other applications of arrays embody much of what isimplied by the term ‘genomics’; they are broad in scope, large in scale, and take advantage of all availablesequence information for experimental design and data interpretation in pursuit of biological understanding.
© 2000 Macmillan Magazines Ltd

insight review articles
828 NATURE | VOL 405 | 15 JUNE 2000 | www.nature.com
Labelled RNA
Cy3 cDNA Cy5 cDNA
0.2 cm
0.8 cm
Labelled cRNA
Labelled cDNA
a b
c d
Gene 1 Gene 2 Gene 3 Gene 1 Gene 2 Gene 3
Figure 1 Principal types of arrays used in gene expression monitoring. Nucleic acidarrays are generally produced in one of two ways: by robotic deposition of nucleic acids(PCR products, plasmids or oligonucleotides) onto a glass slide25 or in situ synthesis(using photolithography15) of oligonucleotides. Shown are pseudocolour images of a, an oligonucleotide array and b, a cDNA array after hybridization of labelled samplesand fluorescence detection. In both cases the images have been coloured to indicatethe relative number of yeast transcripts present under two different growth conditions(red, high in condition 1, low in condition 2; green, high in condition 2, low in condition1; yellow, high under both conditions; black, low under both conditions). In the case ofphotolithographically synthesized arrays, ~107 copies of each selected oligonucleotide(usually 20 to 25 nucleotides in length) are synthesized base by base in hundreds ofthousands of different 24 mm 2 24 mm areas on a 1.28 cm 2 1.28 cm glasssurface. For robotic deposition, approximately one nanogram of material is depositedat intervals of 100–300 mm. Typically for oligonucleotide arrays, multiple probes pergene are placed on the array (20 pairs in the example shown here), while in the case ofrobotic deposition, a single, longer (up to 1,000 bp) double-stranded DNA probe isused for each gene or EST. In both cases, probes are usually designed from sequencelocated nearer to the 3′ end of the gene (near the poly-A tail in eukaryotic mRNA), anddifferent probes can be used for different exons. After hybridization of labelled samples(typically overnight), the arrays are scanned and the quantitative fluorescence imagealong with the known identity of the probes is used to assess the ‘presence’ or‘absence’ (more precisely, the detectability above thresholds based on background andnoise levels) of a particular molecule (such as a transcript), and its relative abundancein one or more samples. Because the sequence of the oligonucleotide or cDNA at eachphysical location (or address) is generally known or can be determined, and because
the recognition rules that govern hybridization are well understood, the signal intensityat each position gives not only a measure of the number of molecules bound, but alsothe likely identity of the molecules. Although oligonucleotide probes vary systematicallyin their hybridization efficiency, quantitative estimates of the number of transcripts percell can be obtained directly by averaging the signal from multiple probes15,26,30. Fortechnical reasons, the information obtained from spotted cDNA arrays gives the relativeconcentration (ratio) of a given transcript in two different samples (derived fromcompetitive, two-colour hybridizations). Messenger RNAs present at a few copies(relative abundance of ~1:100,000 or less) to thousands of copies per mammalian cellcan be detected25,26,30, and changes as subtle as a factor of 1.3 to 2 can be reliablydetected if replicate experiments are performed. c, Different methods for preparinglabelled material for measurements of gene expression. The RNA can be labelleddirectly, using a psoralen–biotin derivative or by ligation to an RNA molecule carryingbiotin26; labelled nucleotides can be incorporated into cDNA during or after reversetranscription of polyadenylated RNA; or cDNA can be generated that carries a T7promoter at its 5′ end. In the last case, the double-stranded cDNA serves as templatefor a reverse transcription reaction in which labelled nucleotides are incorporated intocRNA. Commonly used labels include the fluorophores fluorescein, Cy3 (or Cy5), ornonfluorescent biotin, which is subsequently labelled by staining with a fluorescentstreptavidin conjugate. d, Two-colour hybridization strategy often used with cDNAmicroarrays. cDNA from two different conditions is labelled with two differentfluorescent dyes (usually Cy3 and Cy5), and the two samples are co-hybridized to anarray. After washing, the array is scanned at two different wavelengths to detect therelative transcript abundance for each condition. cDNA array image courtesy of J.DeRisi and P. O. Brown (http://cmgm.stanford.edu/pbrown/yeastchip.html).
© 2000 Macmillan Magazines Ltd

insight review articles
NATURE | VOL 405 | 15 JUNE 2000 | www.nature.com 829
profile or the ‘transcriptome’, is a major determinant of cellular pheno-type and function. The transcription of genomic DNA to producemRNA is the first step in the process of protein synthesis, and differences in gene expression are responsible for both morphologicaland phenotypic differences as well as indicative of cellular responses toenvironmental stimuli and perturbations. Unlike the genome, thetranscriptome is highly dynamic and changes rapidly and dramaticallyin response to perturbations or even during normal cellular eventssuch as DNA replication and cell division23,24. In terms of understand-ing the function of genes, knowing when, where and to what extent agene is expressed is central to understanding the activity and biologicalroles of its encoded protein. In addition, changes in the multi-gene patterns of expression can provide clues about regulatory mechanismsand broader cellular functions and biochemical pathways. In the context of human health and treatment, the knowledge gained fromthese types of measurements can help determine the causes and conse-quences of disease, how drugs and drug candidates work in cells and organisms, and what gene products might have therapeutic usesthemselves or may be appropriate targets for therapeutic intervention.
Past discussions of arrays have often centred on technical issues andspecific performance characteristics25. Now that nucleic acid arrays havebeen constructed for many different organisms14,26–29 and used success-fully to measure transcript abundance in a host of different experi-ments, the focus of interest has thankfully shifted. Investigators are nowmore concerned with questions concerning experimental design, dataanalysis, the use of small amounts of mRNA from limited sources, thebest ways to extract biological meaning from the results, pathway andcell-circuitry modelling, and medical uses of expression patterns.
Array-based gene expression monitoringOne way to think of measurements with arrays is that they are simplya more powerful substitute for conventional methods of evaluating
mRNA abundance. For some early experiments, only a relativelysmall set of genes, which were thought to be important to a process,were included on the arrays12,30. However, such experiments did notcapitalize on the arrays’ potential: a key advantage of using arrays,especially those that contain probes for tens of thousands of differentgenes, is that it is not necessary to guess what the important genes ormechanisms are in advance. Instead of looking only under theproverbial lamppost, a broader, more complete and less biased viewof the cellular response is obtained (Figs 2, 3).
The breadth of array-based observations almost guarantees thatsurprising findings will be made. A recent study measured the transcriptional changes that occur as cells progress through the normal cell-division cycle in humans for approximately 40,000 genes(R. J. Cho et al., unpublished results). In addition to the induction ofDNA replication genes and genes involved with cell-cycle control andchromosome segregation that would be expected at specific stages inthe cell cycle, a large collection of genes involved with smooth musclefunction, apoptosis and intercellular adhesion and cell motility werefound to be upregulated during a specific phase. The expected resultsact effectively as internal controls that provide a certain amount ofvalidation (and comfort), while new information is obtained by asystematic search of a larger part of ‘gene space’. In addition, becausearrays often contain probes for genes of unknown function (andoften with only partial sequence information), any outcome for thesecould be considered, in some sense, both surprising and novel(although clearly requiring further characterization).
Other gene expression methodsNot surprisingly, there are other ways to measure mRNA abundance,gene expression and changes in gene expression. For measuring geneexpression at the level of mRNA, northern blots, polymerase chainreaction after reverse transcription of RNA (RT-PCR), nuclease
Figure 2 Messenger RNA abundance levels in different cells, tissues and organisms. a, Human HIV-infected Tlymphocytes; b, mouse olfactory epithelium; c, rat brain; d, S. cerevisiae strain RY136 grown at 25 7C in rich medium.Levels of gene expression were measured using Affymetrixoligonucleotide arrays. For human, mouse and rat samples,hybridization intensities were converted to copies per cell (topaxis) based on the signal from multiple control RNAs added tothe samples at known concentrations. For yeast, theconversion was based on the signal from the TATA-bindingprotein (TBP) mRNA, which has been determined to bepresent at ~3.5 copies per cell when yeast cells are grown inrich medium103. Only those genes scored as ‘present’ arerepresented in the histograms. Data from multiple arrayscontaining probes for a different subset of genes and ESTswere combined to generate the plots for human (five arrays),mouse (five arrays) and rat (three arrays). All yeast ORFs wererepresented on a single array. For measurements that coversuch a large number of genes, it is important to maintain highstandards of data quality to keep false-positive results to aminimum. (For example, when monitoring 10,000 genes,even a low false-positive rate of 1% results in 100 false calls.)We find that the source of most false positives (in large partthe result of setting the lowest possible thresholds in theinterest of sensitivity) is random noise, biological variation, orthe occasional array-specific physical defect, so observationsmade consistently in independent replicates yield a false-positive rate close to 0.01%, or only 1 in 10,000. In well controlled experiments involving specific biochemical, chemical and genetic perturbations, typically the number ofexpression differences is modest, with about 0.1–2% of the monitored genes changing by a factor of 1.8 or more, and only a small fraction of these changing by more than four- tofivefold56–58,70–72,95,104. For samples derived, for example, from different adult human or mouse tissues, or from normal versus advanced tumour tissue, the number of differencescan be as large as 10–15% of the monitored genes50–53. The larger number of differences poses only minor difficulties for the technology, but analysis of the more complex resultsand the larger number of genes involved typically requires more sophisticated computational methods.
a Copies per cell
Hybridization intensity
Num
ber
of g
enes
0.1
Human>40K genes + ESTs
1,200
1,000
800
600
400
200
1 10
103 104102101100
100
c Copies per cell
Hybridization intensity
Num
ber
of g
enes
0.1
Rat>25K genes + ESTs
1,000
800
600
400
200
0
1 10
103 104102101100
100d Copies per cell
Hybridization intensity
Num
ber
of g
enes
0.1
Yeast>6,200 ORFs
400
300
200
100
0
1 10
103 104102101100
0.01
b Copies per cell
Hybridization intensity
Num
ber
of g
enes
0.1
Mouse>30K genes + ESTs
1,000
800
600
400
200
00
1 10
103 104102101100
100
© 2000 Macmillan Magazines Ltd

insight review articles
830 NATURE | VOL 405 | 15 JUNE 2000 | www.nature.com
protection, cDNA sequencing, clone hybridization, differential display31, subtractive hybridization, cDNA fragment fingerprinting32–35
and serial analysis of gene expression (SAGE)36 have all been put to gooduse to measure the expression levels of specific genes, characterize global expression profiles or to screen for significant differences inmRNA abundance. But if messenger RNA is only an intermediate onthe way to production of the functional protein products, why measuremRNA at all? One reason is simply that protein-based approaches aregenerally more difficult, less sensitive and have a lower throughput thanRNA-based ones. But more importantly, mRNA levels are immenselyinformative about cell state and the activity of genes, and for mostgenes, changes in mRNA abundance are related to changes in proteinabundance. Because of its importance, however, many methods havebeen developed for monitoring protein levels either directly or indirectly (see review in this issue by Pandey and Mann, pages837–846). These include western blots, two-dimensional gels, methodsbased on protein or peptide chromatographic separation and massspectrometric detection37–40, methods that use specific protein-fusionreporter constructs and colorimetric readouts41–44, and methods basedon characterization of actively translated, polysomal mRNA45–47.
The importance of the protein-based methods is that they measurethe final expression product rather than an intermediate. In addition,some of them enable the detection of post-translational protein modifi-cations (for example, phosphorylation and glycosylation) and proteincomplexes, and in some cases, yield information about protein localiza-tion, none of which are obtained directly by measurements of mRNA.There is no question that protein- and RNA-based measurements arecomplementary, and that protein-based methods are important as theymeasure observables that are not readily detected in other ways.
Human disease, gene expression and discoveryGenomics and gene expression experiments are sometimes deridedas ‘fishing expeditions’. Our view is that there is nothing wrong with a
fishing expedition48 if what you are after is ‘fish’, such as new genesinvolved in a pathway, potential drug targets or expression markersthat can be used in a predictive or diagnostic fashion. Because thearrays can be designed and made on the basis of only partialsequence information, it is possible to include genes in a survey thatare completely uncharacterized. In many ways, the spirit of thisapproach is more akin to that of classical genetics in which muta-tions are made broadly and at random (not only in specific genes),and screens or selections are set up to discover mutants with aninteresting phenotype, which then leads to further characterizationof specific genes.
Such broad discovery experiments are probably better describedas ‘question-driven’ rather than hypothesis-driven in the conven-tional sense. But that is not to diminish their value for understandingbasic biological processes and even for understanding and treatinghuman disease. For example, by analysing multiple samples obtainedfrom individuals with and without acute leukaemia or diffuse largeB-cell lymphoma, gene expression (mRNA) markers were discov-ered that could be used in the classification of these cancers49,50. Theimportance of monitoring a large number of genes was well illustrat-ed in these studies. Golub et al.49 found that reliable predictions couldnot be made based on any single gene, but that predictions based onthe expression levels of 50 genes (selected from the more than 6,000monitored on the arrays) were highly accurate. The results of both ofthese studies indicate that measurements with more individuals andmore genes will be needed to identify robust expression markers thatare predictive of clinical outcome. But even with the limited initialdata it was possible to help clarify an unusual case (classic leukaemiapresentation but atypical morphology) and to use this informationto guide the patient’s clinical care.
It is also possible to take a related approach to help understandwhat goes wrong in cancerous, transformed cells and to identify the genes responsible for disease. Causative effects and potential
Figure 3 Methods for analysing geneexpression data shown for measurements ofexpression in the cell cycle of S. cerevisiae. a, Yeast cells were synchronized and cellswere collected every ten minutes throughouttwo complete synchronous cycles (18 timepoints in total are shown). Expression datawere collected by hybridizing labelled cDNAsamples to high-density oligonucleotidearrays. Transcript levels were determined foralmost every gene in the genome for everytime point24. A sample of 409 genes (from atotal of 6,000) that showed both a significant(more than twofold) fluctuation in transcriptlevels during the time course and cell cycle-dependent periodicity were selected forfurther analysis. b, Dendrogram indicatingsimilarity of expression profiles, calculatedusing the Pearson correlation function in theGeneSpring software package (SiliconGenetics, San Carlos, CA). For displaypurposes, the relative expression levels wereplotted in red (high) and blue (low). c, Thegenes were divided into five different temporalexpression classes (red, early G1; light blue,G1; green, late G1; dark blue, S; orange,G2/M) using K-tuple means clustering (alsousing GeneSpring software) and the clusters were named according to their time of peak expression within the cell cycle. d, Line graphs for all genes in the clusters defined in b. e, Location of cell cycle-regulated genes within the dendrogram in a that have cis-regulatory sequence elements in the 500 bp upstream of their promoter. Column 1, MCB sites(ACGCGT); column 2, ECB sites (TTWCCCNNNNAGGAA); column 3, a new sequence (GTAAACAA or TTGTTTAC) was identified that was statistically associated (p = 1.77 2 10–7
for the forward direction, p = 0.003 for the reverse) with the promoter regions of genes whose expression peaked in G2/M phase.
Time
Pro
gres
sion
thr
ough
the
cel
l cyc
le
ECB site
MCB si
teNov
el sit
e
Early G1
G1
G1
Late G1
S
S
M
G2/M
G2
b c d e
a
© 2000 Macmillan Magazines Ltd

therapeutic targets can be identified by determining which genes areupregulated in different tumour types51–55, and specific candidategenes can be intentionally overexpressed in cell lines or cells treatedwith growth factors in order to identify downstream target genes and to explore signalling pathways56–58. Tumorigenesis is oftenaccompanied by changes in chromosomal DNA, such as geneticrearrangements, amplifications or losses of particular chromosomalloci, and developmental abnormalities, such as Down’s or Turner’ssyndrome, may arise from aberrations in DNA copy number.Because genomic DNA can be interrogated in much the same way asmRNA, comparisons of the copy number of genomic regions or thegenotype of genetic markers can be used to detect chromosomalregions and genes that are amplified or deleted in cancerous or pre-cancerous cells. By using arrays containing probes for a largenumber of genes or polymorphic markers, changes in DNA copynumber have been detected in both breast cancer cell lines and intumours59–61. The identification of when and where changes in copynumber or chromosomal rearrangements have occurred can be usedin both the classification of cancer types and the identification ofregions that may harbour tumour-suppressor genes.
Whole-genome hypothesesThe use of genomics tools such as arrays does not, of course, precludehypothesis-driven research. For fully sequenced organisms, arrayscontaining probes for every annotated gene in the genome have beenproduced14,26. With these one can ask, for example, whether a transcription factor has a global role in transcription (affecting allgenes) or a specific role (affecting only some). Holstege et al.62 usedthis type of application in a genome-wide expression analysis in yeastto functionally dissect the machinery of transcription initiation.Similarly, genes located near the ends of chromosomes in yeast (aswell as genes at the mating-type locus) are known to be transcription-ally ‘silent’. Full genome arrays allow the chromosomal landscape ofsilencing to be mapped, and make it possible to test whether what istrue for a handful of well-studied genes near the telomeres is true forall telomeric genes, and whether any centromere-proximal genes arealso transcriptionally silenced63.
It is important to emphasize that these new, parallel approachesdo not replace conventional methods. Standard methods such asnorthern blots, western blots or RT-PCR are simply used in a moretargeted fashion to complement the broader measurements and tofollow-up on the genes, pathways and mechanisms implicated by thearray results. Because the incidence of false-positive results can bemade sufficiently low (see Fig. 2), it is not necessary to independentlyconfirm every change for the results to be valid and trustworthy, especially if conclusions are based on changes in sets of genes ratherthan individual genes. More detailed follow-up is recommended if agene is being chosen, for example, as a drug target, as a candidate forpopulation genetics studies, or as the target for the construction of aknockout mouse.
Does gene expression indicate function?As additional, uncharacterized open reading frames (ORFs) areidentified in different organisms by the various genome sequencingprojects, researchers have begun to ask whether the expression pat-tern for a gene can be used to predict the functional role of its proteinproduct. An increasingly common approach involves using the geneexpression behaviour observed over multiple experiments to firstcluster genes together into groups (see Fig. 3), either by manualexamination of the data24, or by using statistical methods such as self-organizing maps64, K-tuple means clustering or hierarchical cluster-ing23,65,66. The basic assumption underlying this approach is thatgenes with similar expression behaviour (for example, increasingand decreasing together under similar circumstances) are likely to berelated functionally. In this way, genes without previous functional assignments can be given tentative assignments or assigned a role in abiological process based on the known functions of genes in the same
expression cluster (that is, the concept of ‘guilt-by-association’). Thevalidity of this approach has been demonstrated for many genes inSaccharomyces cerevisiae, a simple organism for which the entiregenomic sequence and the functional roles of approximately 60% ofthe genes are known24,65,67 (Fig. 4). Although not logically rigorous,the utility of the guilt-by-association approach has been demonstrat-ed, as genes already known to be related do, in fact, tend to clustertogether based on their experimentally determined expression pat-terns (Fig. 4). The approach is made more systematic and statisticallysound by calculating the probability that the observed functional distribution of differentially expressed genes could have happened bychance. The application of statistical rigour is essential to avoid overly subjective interpretations of the results based on the predispo-sitions, prior knowledge and interests of the individual researcher.
A tentative functional assignment may not be much more than alow-resolution description or general classification. Descriptions ofthis type are similar to those that come out of more classical geneticscreens and selections, which have provided the vast majority offunctional annotations to date — they indicate that genes areinvolved with a particular cellular phenotype and that they are likely
insight review articles
NATURE | VOL 405 | 15 JUNE 2000 | www.nature.com 831
Figure 4 The ‘guilt-by-association’ method for assigning gene function. Functionaldistribution (using categories from MIPS: http://www.mips.biochem.mpg.de/proj/yeast/catalogues/funcat/index.html) of yeast genes whose periodic expressionpeaked at different times in the yeast cell cycle (outer rings) or was constantthroughout the cell cycle (inner circle)24. A much larger fraction of cell cycle-modulated genes is important in DNA synthesis, cell growth or cell division. Althoughthere is a strong correlation between distinct expression profiles and functionalassignments, specific expression behaviour should not be taken as sufficient evidencefor functional assignment: not all genes involved in DNA replication are expressedperiodically in the cell cycle, and some genes that do not need to be cell cycle-regulated are transcribed in a periodic fashion.
Constant
Signal transductionCellular biognesisIntracellular transportTransport facilitationProtein destinationProtein synthesisTranscriptionCell growth, division, DNA synthesisEnergyMetabolismCellular organization
Early G1
G1
Late G1
S
G2/M
© 2000 Macmillan Magazines Ltd

to be involved with a certain set of other genes and processes. Thisallows researchers to focus attention on a smaller subset of genes,many of which may not have been obvious candidates in the absenceof the global expression observations. This overall approach high-lights the importance of functional annotation and careful curationof existing sequence, function and knowledge databases (see below).Expression results covering thousands or even tens of thousands of genes and expressed sequence tags (ESTs) will be only partly interpretable given the functional and biological information available at the time they are initially generated. Our ability to extractknowledge from measurements of global gene expression tends toincrease with time as additional information becomes available, andresults can be subjected to further interrogation in the light of newinformation, observations, questions and hypotheses.
Gene expression and the regulation of transcriptionWhen information on the complete genome sequence is available, asis the case for increasing numbers of small and even larger genomes,gene expression data can be used to identify new cis-regulatory elements (genomic sequence motifs that are over-represented in thegenomic DNA in the vicinity of similarly behaving genes) and ‘regulons’ (sets of co-regulated genes), the basic units of the underly-ing cellular circuitry (Fig. 3d). In fact, the correlation between thepresence of specific sequence motifs in promoter regions and geneexpression patterns may be stronger than the correlation betweenfunctional categories and gene expression patterns. In yeast studies,more than 50% of the genes that are transcribed in a cell cycle-
specific manner and whose transcript abundance peaks in the G1phase of the cell cycle have an MCB (Mlu cell-cycle box) within 500base pairs (bp) of their translational start site24,68,69. Similar observa-tions have been made for yeast genes whose transcription is inducedduring sporulation67. In addition, new cis-regulatory elements maybe revealed by examining classes of co-regulated genes (Fig. 3d). Withsufficiently large numbers of experimental observations of expres-sion behaviour, the boundaries and all functioning sequence variantsof cis-regulatory elements might be predicted without the need forthe more conventional approach using site-directed mutagenesis(‘promoter bashing’). The expression-based method will be especial-ly valuable in exotic organisms, such as Plasmodium falciparum, thecausative agent for malaria, for which experimental identification orverification of transcription factor binding sites is difficult.
Gene expression profiles as ‘fingerprints’An often overlooked aspect of measurements of global gene expres-sion is that the sequence or even the origin of the arrayed probes doesnot need to be known to make interesting observations — the complex profiles, consisting of thousands of individual observations,can serve as transcriptional ‘fingerprints’. The fingerprints can beused for classification purposes or as tests for relatedness, in a similarmanner to the way in which DNA fingerprints are used in paternitytesting. In one example, transcriptional fingerprints have been usedto determine the target of a drug70. The basic idea is that if a druginteracts with and inactivates a specific cellular protein, the pheno-type of the drug-treated cell should be very similar to the phenotype
insight review articles
832 NATURE | VOL 405 | 15 JUNE 2000 | www.nature.com
Figure 5 Generic oligonucleotide tag arrays for parallel phenotyping of mutant yeast strains. a, Many S. cerevisiae strains, each carrying a specific deletion of one of the more than6,000 ORFs in the yeast genome, have been constructed91 by replacing individual genes with an antibiotic resistance cassette and a unique gene-specific 20-mer ‘barcode’,represented by an X. b, The barcode for each deletion strain corresponds to a specific location on an array that contains oligonucleotide probes that are complementary to thebarcode sequences. c, Pools of different yeast strains can be assembled and grown under different conditions. After competitive growth, PCR is used to amplify the barcodes fromgenomic DNA isolated from the pools; the PCR products are subsequently labelled. d, By comparing the hybridization patterns of two different pools (before and after treatment witha drug, for example), the fitness of the strains can be assessed quantitatively. In this case, yeast genes required for sporulation or germination are represented in red, whereas yeastgenes that are unnecessary for the process are shown in yellow. These same 20-mer sequences and the accompanying arrays are generic in design, and can be used to read theresults of different types of ‘bar-coded’ reactions, such as those used for genotyping of human polymorphic loci105. Images provided by R. M. Williams and R. W. Davis.
UniqueTAG
KanR
Yeast gene
Condition A Condition B
Pools
Genom
ic DN
ALabelled tags
ac
b d
© 2000 Macmillan Magazines Ltd
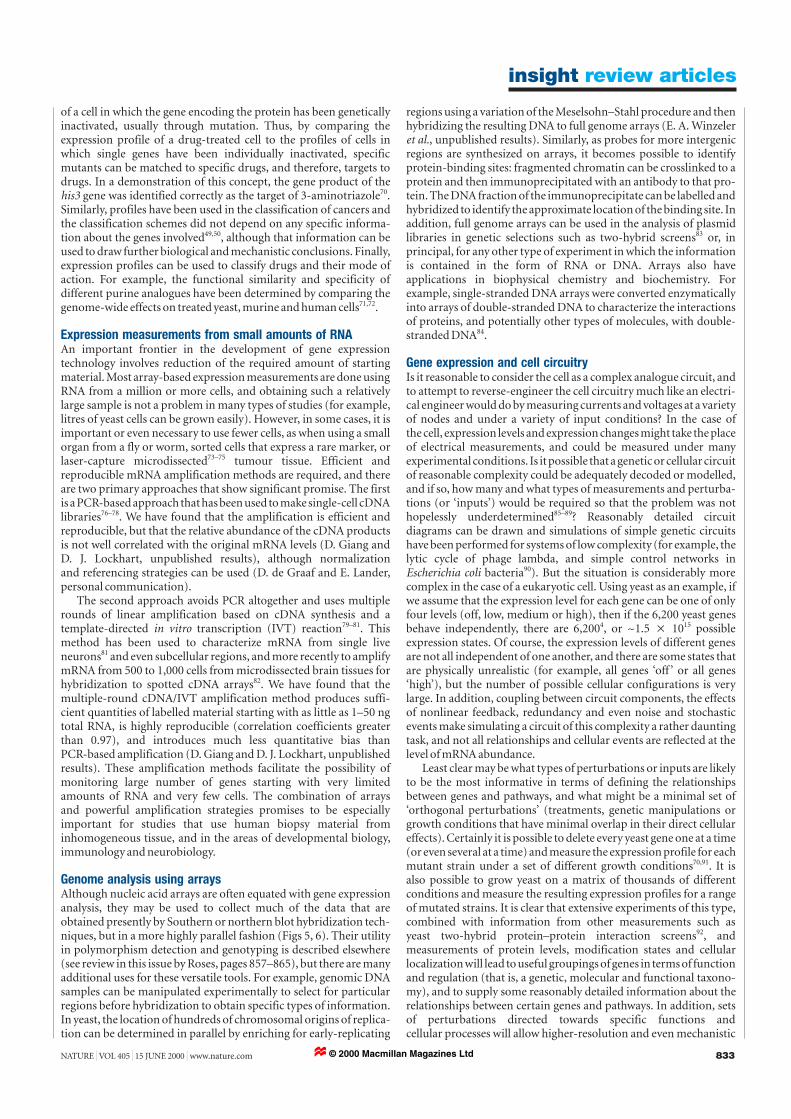
of a cell in which the gene encoding the protein has been geneticallyinactivated, usually through mutation. Thus, by comparing theexpression profile of a drug-treated cell to the profiles of cells inwhich single genes have been individually inactivated, specificmutants can be matched to specific drugs, and therefore, targets todrugs. In a demonstration of this concept, the gene product of thehis3 gene was identified correctly as the target of 3-aminotriazole70.Similarly, profiles have been used in the classification of cancers andthe classification schemes did not depend on any specific informa-tion about the genes involved49,50, although that information can beused to draw further biological and mechanistic conclusions. Finally,expression profiles can be used to classify drugs and their mode ofaction. For example, the functional similarity and specificity of different purine analogues have been determined by comparing thegenome-wide effects on treated yeast, murine and human cells71,72.
Expression measurements from small amounts of RNAAn important frontier in the development of gene expression technology involves reduction of the required amount of startingmaterial. Most array-based expression measurements are done usingRNA from a million or more cells, and obtaining such a relativelylarge sample is not a problem in many types of studies (for example,litres of yeast cells can be grown easily). However, in some cases, it isimportant or even necessary to use fewer cells, as when using a smallorgan from a fly or worm, sorted cells that express a rare marker, orlaser-capture microdissected73–75 tumour tissue. Efficient and reproducible mRNA amplification methods are required, and thereare two primary approaches that show significant promise. The firstis a PCR-based approach that has been used to make single-cell cDNAlibraries76–78. We have found that the amplification is efficient andreproducible, but that the relative abundance of the cDNA productsis not well correlated with the original mRNA levels (D. Giang and D. J. Lockhart, unpublished results), although normalization and referencing strategies can be used (D. de Graaf and E. Lander,personal communication).
The second approach avoids PCR altogether and uses multiplerounds of linear amplification based on cDNA synthesis and a template-directed in vitro transcription (IVT) reaction79–81. Thismethod has been used to characterize mRNA from single live neurons81 and even subcellular regions, and more recently to amplifymRNA from 500 to 1,000 cells from microdissected brain tissues forhybridization to spotted cDNA arrays82. We have found that the multiple-round cDNA/IVT amplification method produces suffi-cient quantities of labelled material starting with as little as 1–50 ngtotal RNA, is highly reproducible (correlation coefficients greaterthan 0.97), and introduces much less quantitative bias than PCR-based amplification (D. Giang and D. J. Lockhart, unpublishedresults). These amplification methods facilitate the possibility ofmonitoring large number of genes starting with very limitedamounts of RNA and very few cells. The combination of arrays and powerful amplification strategies promises to be especiallyimportant for studies that use human biopsy material from inhomogeneous tissue, and in the areas of developmental biology,immunology and neurobiology.
Genome analysis using arraysAlthough nucleic acid arrays are often equated with gene expressionanalysis, they may be used to collect much of the data that areobtained presently by Southern or northern blot hybridization tech-niques, but in a more highly parallel fashion (Figs 5, 6). Their utilityin polymorphism detection and genotyping is described elsewhere(see review in this issue by Roses, pages 857–865), but there are manyadditional uses for these versatile tools. For example, genomic DNAsamples can be manipulated experimentally to select for particularregions before hybridization to obtain specific types of information.In yeast, the location of hundreds of chromosomal origins of replica-tion can be determined in parallel by enriching for early-replicating
regions using a variation of the Meselsohn–Stahl procedure and thenhybridizing the resulting DNA to full genome arrays (E. A. Winzeleret al., unpublished results). Similarly, as probes for more intergenicregions are synthesized on arrays, it becomes possible to identify protein-binding sites: fragmented chromatin can be crosslinked to aprotein and then immunoprecipitated with an antibody to that pro-tein. The DNA fraction of the immunoprecipitate can be labelled andhybridized to identify the approximate location of the binding site. Inaddition, full genome arrays can be used in the analysis of plasmidlibraries in genetic selections such as two-hybrid screens83 or, in principal, for any other type of experiment in which the informationis contained in the form of RNA or DNA. Arrays also have applications in biophysical chemistry and biochemistry. For example, single-stranded DNA arrays were converted enzymaticallyinto arrays of double-stranded DNA to characterize the interactionsof proteins, and potentially other types of molecules, with double-stranded DNA84.
Gene expression and cell circuitryIs it reasonable to consider the cell as a complex analogue circuit, andto attempt to reverse-engineer the cell circuitry much like an electri-cal engineer would do by measuring currents and voltages at a varietyof nodes and under a variety of input conditions? In the case of the cell, expression levels and expression changes might take the placeof electrical measurements, and could be measured under manyexperimental conditions. Is it possible that a genetic or cellular circuitof reasonable complexity could be adequately decoded or modelled,and if so, how many and what types of measurements and perturba-tions (or ‘inputs’) would be required so that the problem was nothopelessly underdetermined85–89? Reasonably detailed circuit diagrams can be drawn and simulations of simple genetic circuitshave been performed for systems of low complexity (for example, thelytic cycle of phage lambda, and simple control networks inEscherichia coli bacteria90). But the situation is considerably morecomplex in the case of a eukaryotic cell. Using yeast as an example, ifwe assume that the expression level for each gene can be one of onlyfour levels (off, low, medium or high), then if the 6,200 yeast genesbehave independently, there are 6,2004, or ~1.5 2 1015 possibleexpression states. Of course, the expression levels of different genesare not all independent of one another, and there are some states thatare physically unrealistic (for example, all genes ‘off ’ or all genes‘high’), but the number of possible cellular configurations is verylarge. In addition, coupling between circuit components, the effectsof nonlinear feedback, redundancy and even noise and stochasticevents make simulating a circuit of this complexity a rather dauntingtask, and not all relationships and cellular events are reflected at thelevel of mRNA abundance.
Least clear may be what types of perturbations or inputs are likelyto be the most informative in terms of defining the relationshipsbetween genes and pathways, and what might be a minimal set of‘orthogonal perturbations’ (treatments, genetic manipulations orgrowth conditions that have minimal overlap in their direct cellulareffects). Certainly it is possible to delete every yeast gene one at a time(or even several at a time) and measure the expression profile for eachmutant strain under a set of different growth conditions70,91. It is also possible to grow yeast on a matrix of thousands of different conditions and measure the resulting expression profiles for a rangeof mutated strains. It is clear that extensive experiments of this type,combined with information from other measurements such as yeast two-hybrid protein–protein interaction screens92, and measurements of protein levels, modification states and cellularlocalization will lead to useful groupings of genes in terms of functionand regulation (that is, a genetic, molecular and functional taxono-my), and to supply some reasonably detailed information about therelationships between certain genes and pathways. In addition, sets of perturbations directed towards specific functions and cellular processes will allow higher-resolution and even mechanistic
insight review articles
NATURE | VOL 405 | 15 JUNE 2000 | www.nature.com 833© 2000 Macmillan Magazines Ltd

information for significant parts of the overall circuitry62,93. However,given the tremendous complexity of the system, it is unlikely that acomplete and detailed cellular circuit diagram will result for even single-celled eukaryotes such as yeast any time in the near future. Butthat is not to say that construction of even first-order global modelsand semi-quantitative circuit diagrams is not extremely useful. Suchmodels serve to organize current information, relationships andhypotheses, and can be tremendously helpful for testing newhypotheses, interpreting new observations, designing new experi-ments and predicting the likely effects of particular chemical, geneticor cellular perturbations. They also serve as a scaffold upon which tobuild higher-resolution, more quantitative and complete models.
Can we have too much data?Contrary to what is sometimes thought, the biggest problem formaking sense of the extensive results from genomics experiments isnot that there is too much data or that there are insufficiently sophis-ticated algorithms and software tools for querying and visualizingdata on this scale. Larger problems of data management and analysishave been solved by airlines, financial institutions, global retailers,high-energy and plasma physicists, the military and global weatherpredictors, among others. It is often beneficial to have a large numberof measurements94 and sometimes more data make it possible toanalyse results that might otherwise have been too ‘messy’, and todetect patterns and relationships that would not have been obviousor have sufficient statistical significance with smaller data sets. Inmany types of studies, it is not possible to control completely all variables, and the individual differences between common sampletypes may be significant because of experimental difficulties (forexample, tissue inhomogeneity or variations in sample procedures)or individual genetic variation (for example, different patients or dif-ferent tumours). But such factors do not preclude the discovery ofsome genes that clearly ‘cluster’ or differentiate between the samplesets. For example, meaningful results can be extracted from theanalysis of human tissue collected at different hospitals, by differentsurgeons and at different times. An essential requirement in these
types of studies is that a sufficient number of experiments be performed across multiple individuals and multiple tissue or tumoursamples to account for individual variation and possible tissue inhomogeneity. Furthermore, confidence in the results is increasedas conclusions are based on sets of genes that show a consistentresponse and that are consistently different between two or more setsof results49,50,52,53,95.
Making sense of genomic resultsAlthough the difficulties of sample collection, data collection andexperimental design should not be underestimated, one of the mostchallenging aspects of gene expression analysis is making sense of thevast quantities of data and extracting conclusions and hypotheses thatare biologically meaningful. From experiments on global gene expres-sion, we may obtain data for thousands of genes, often forcing us toconsider processes, functions and mechanisms about which we knowvery little. Thus, there is a need for more sophisticated systems ofknowledge representation (or ‘knowledge bases’) that organize thedata, facts, observations, relationships and even hypotheses that formthe basis of our current scientific understanding. This informationneeds to be more than just stored; it needs to be available in a way that helps scientists understand and interpret the often complex observations that are becoming increasingly easy to make.Unfortunately, the fact is that the scientific literature has been somewhat haphazardly built, without the benefit of a controlled orrestricted vocabulary and a well defined semantic and grammar. Totake full advantage of the abilities of the new technologies and therapidly increasing amount of sequence information it is absolutelyessential to incorporate the facts, ideas, connections, observations and so forth, which exist in the scientific literature and in the minds of scientists, into a form that is systematic, organized, linked, visualized and searchable. This clearly requires a great deal of dedicated, systematic human effort, but progress has been made. Databases such as the Saccharomyces Genome Database (SGD: genome-www.stanford.edu/Saccharomyces), theMunich Information Center for Protein Sequences (MIPS:
insight review articles
834 NATURE | VOL 405 | 15 JUNE 2000 | www.nature.com
a b
c
d
Figure 6 Comparative genome hybridizationusing arrays26,106,107. a, Two arrays containingprobes to yeast (the complete genomesequence of S. cerevisiae strain S288c andsome S. cerevisiae DNA not present in S288c)were hybridized with fragmented, labelledgenomic DNA from two different yeast strainscommonly used in genetic studies (W303 andSK1). Red indicates the location of probes thathybridize efficiently only to DNA from theW303 strain, green indicates probes thathybridize only to SK1 DNA, and yellowindicates probes that hybridize equally to theDNA from both strains. b, Enlargement of theboxed region in a. c, Region of the arraycontaining probes to relatively unique protein-coding regions of the genome. d, Probes tonon-unique regions of the genome(transposable elements, telomeric sequences,transfer RNAs and ribosomal RNAs). Genomeregions that are present, absent, or found athigher or lower copy numbers in the twostrains are readily detected. The large amountof allelic variation between the strains can beused in mapping studies108. Relatedapproaches can be used in typing microbialisolates29,109 or to identify geneticabnormalities in tumours.
© 2000 Macmillan Magazines Ltd

www.mips.biochem.mpg.de), WormBase (www.wormbase.org), theKyoto Encyclopedia of Genes and Genomes (KEGG:www.genome.ad.jp/kegg), the Encyclopedia of E. coli Genes andMetabolism (EcoCyc: http://ecocyc.panbio.com/ecocyc) and FlyBase(flybase.bio.Indiana.edu/) incorporate sequence, genetics, geneexpression, homology, regulation, function and phenotype informa-tion in an organized and useable form96–102. But a step beyond databasesof this type are ones in which concepts as well as facts are more fullyintegrated and related, allowing connections to be made between initially disparate observations and information, and across organisms. It is conceivable that the next step will evolve to the level of abiological ‘expert system’, not unlike the expert system (‘Big Blue’) thatIBM scientists and engineers built to play chess (successfully) againstthe world’s best chess player. Despite the potential for advancement on this front, it seems unlikely that computational tools will everreplace the trained human brain when it comes to making biologicalsense of new results. However, the appropriate tools are needed to bringinformation and relationships to scientist’s fingertips so that the most insightful questions can be asked and the most meaningful interpretations made.
ConclusionFor these array-based methods to become truly revolutionary, theymust become an integral part of the daily activities of the typical molecular biology laboratory. Despite their impressive and rapidlygrowing résumé, these technologies are still in their infancy, withplenty of room for technical improvements, further development,and more widespread acceptance and accessibility. We expect that thepattern of development and use of arrays and other parallel genomicmethodologies will be similar to that seen for computers and otherhigh-tech electronic devices, which started out as exotic and expen-sive tools in the hands of the few developers and early adopters, andthen moved quickly to become easier to use, more available, lessexpensive and more powerful, both individually and because of theirubiquity. In fact, nucleic acid array-based methods that previouslyseemed exotic, and too expensive, are becoming routine as indicatedby the huge increase in the number of publications that incorporatedata obtained in this way. Despite the relative youth of theseapproaches, the achievement of technical goals that would haveseemed like science fiction only a few years ago is now clearly in view.For example, we expect that measuring the expression level of essen-tially every gene (including variant splice forms) on an array or twostarting with RNA from a small number of cells, or even a single cell,will soon be possible owing to advances in single-cell handling andRNA amplification methods, the output of large-scale sequencingefforts and achievable advances in array technology. In the future,arrays of peptides, proteins, small molecules, mRNAs, clones, tissues,cells and even multicellular organisms such as the nematode wormCaenorhabditis elegans may also become common. The combineduse of all of these highly parallel methods, along with sequence information, computational tools, integrated knowledge databases,and the traditional approaches of biology, biochemistry, chemistry,physics, mathematics and genetics, increases the hopes of understanding the function and regulation of all genes and proteins,deciphering the underlying workings of the cell, determining themechanisms of disease, and discovering ways to intervene with orprevent aberrant cellular processes in order to improve human healthand well-being. ■■
1. Dunham, I. et al. The DNA sequence of human chromosome 22. Nature 402, 489–495 (1999).
2. Hattori, M. et al. The DNA sequence of human chromosome 21. Nature 405, 311–319 (2000).
3. Lennon, G. G. & Lehrach, H. Hybridization analyses of arrayed cDNA libraries. Trends Genet. 7,
314–317 (1991).
4. Kafatos, F. C., Jones, C. W. & Efstratiadis, A. Determination of nucleic acid sequence homologies and
relative concentrations by a dot hybridization procedure. Nucleic Acids Res. 7, 1541–1552 (1979).
5. Gillespie, D. & Spiegelman, S. A quantitative assay for DNA-RNA hybrids with DNA immobilized
on a membrane. J. Mol. Biol. 12, 829–842 (1965).
6. Southern, E. M. et al. Arrays of complementary oligonucleotides for analysing the hybridisation
behaviour of nucleic acids. Nucleic Acids Res. 22, 1368–1373 (1994).
7. Zhao, N., Hashida, H., Takahashi, N., Misumi, Y. & Sakaki, Y. High-density cDNA filter analysis: a
novel approach for large-scale, quantitative analysis of gene expression. Gene 156, 207–213 (1995).
8. Nguyen, C. et al. Differential gene expression in the murine thymus assayed by quantitative
hybridization of arrayed cDNA clones. Genomics 29, 207–216 (1995).
9. Fodor, S. P. A. et al. Light-directed, spatially addressable parallel chemical synthesis. Science 251,
767–773 (1991).
10. Fodor, S. P. et al. Multiplexed biochemical assays with biological chips. Nature 364, 555–556 (1993).
11. Pease, A. C. et al. Light-generated oligonucleotide arrays for rapid DNA sequence analysis. Proc. Natl
Acad. Sci. USA 91, 5022–5026 (1994).
12. Schena, M., Shalon, D., Davis, R. W. & Brown, P. O. Quantitative monitoring of gene expression
patterns with a complementary DNA microarray. Science 270, 467–470 (1995).
13. Shalon, D., Smith, S. J. & Brown, P. O. A DNA microarray system for analyzing complex DNA
samples using two-color fluorescent probe hybridization. Genome Res. 6, 639–645 (1996).
14. DeRisi, J. L., Iyer, V. R. & Brown, P. O. Exploring the metabolic and genetic control of gene
expression on a genomic scale. Science 278, 680–686 (1997).
15. Lipshutz, R. J., Fodor, S. P., Gingeras, T. R. & Lockhart, D. J. High density synthetic oligonucleotide
arrays. Nature Genet. 21, 20–24 (1999).
16. Bowtell, D. D. Options available—from start to finish—for obtaining expression data by
microarray. Nature Genet. 21, 25–32 (1999).
17. Edman, C. F. et al. Electric field directed nucleic acid hybridization on microchips. Nucleic Acids Res.
25, 4907–4914 (1997).
18. Sosnowski, R. G., Tu, E., Butler, W. F., O’Connell, J. P. & Heller, M. J. Rapid determination of single
base mismatch mutations in DNA hybrids by direct electric field control. Proc. Natl Acad. Sci. USA
94, 1119–1123 (1997).
19. Gray, D. E., Case-Green, S. C., Fell, T. S., Dobson, P. J. & Southern, E. M. Ellipsometric and
interferometric characterization of DNA probes immobilised on a combinatorial array. Langmuir
13, 2833–2842 (1997).
20. Walt, D. R. Bead-based fiber-optic arrays. Science 287, 451 (2000).
21. Michael, K. L., Taylor, L. C., Schultz, S. L. & Walt, D. R. Randomly ordered addressable high-density
optical sensor arrays. Anal. Chem. 70, 1242–1248 (1998).
22. Ferguson, J. A., Boles, T. C., Adams, C. P. & Walt, D. R. A fiber-optic DNA biosensor microarray for
the analysis of gene expression. Nature Biotechnol. 14, 1681–1684 (1996).
23. Spellman, P. T. et al. Comprehensive identification of cell cycle-regulated genes of the yeast
Saccharomyces cerevisiae by microarray hybridization. Mol. Biol. Cell 9, 3273–3297 (1998).
24. Cho, R. J. et al. A genome-wide transcriptional analysis of the mitotic cell cycle. Mol. Cell 2,
65–73 (1998).
25. The Chipping forecast. Nature Genet. 21(Suppl.), 1–60 (1999).
26. Wodicka, L., Dong, H., Mittmann, M., Ho, M.-H. & Lockhart, D. J. Genome-wide expression
monitoring in Saccharomyces cerevisiae. Nature Biotechnol. 15, 1359–1367 (1997).
27. White, K. P., Rifkin, S. A., Hurban, P. & Hogness, D. S. Microarray analysis of Drosophila
development during metamorphosis. Science 286, 2179–2184 (1999).
28. Chambers, J. et al. DNA microarrays of the complex human cytomegalovirus genome: profiling
kinetic class with drug sensitivity of viral gene expression. J. Virol. 73, 5757–5766 (1999).
29. Gingeras, T. R. et al. Simultaneous genotyping and species identification using hybridization pattern
recognition analysis of generic mycobacterium DNA arrays. Genome Res. 8, 435–448 (1998).
30. Lockhart, D. J. et al. Expression monitoring by hybridization to high-density oligonucleotide arrays.
Nature Biotechnol. 14, 1675–1680 (1996).
31. Liang, P. & Pardee, A. B. Differential display of eukaryotic messenger RNA by means of the
polymerase chain reaction. Science 257, 967–971 (1992).
32. Shimkets, R. A. et al. Gene expression analysis by transcript profiling coupled to a gene database
query. Nature Biotechnol. 17, 798–803 (1999).
33. Ivanova, N. B. & Belyavsky, A. V. Identification of differentially expressed genes by restriction
endonuclease-based gene expression fingerprinting. Nucleic Acids Res. 23, 2954–2958 (1995).
34. Kato, K. Description of the entire mRNA population by a 3′ end cDNA fragment generated by class
IIS restriction enzymes. Nucleic Acids Res. 23, 3685–3690 (1995).
35. Bachem, C. W. et al. Visualization of differential gene expression using a novel method of RNA
fingerprinting based on AFLP: analysis of gene expression during potato tuber development. Plant J.
9, 745–753 (1996).
36. Velculescu, V. E., Zhang, L., Vogelstein, B. & Kinzler, K. W. Serial analysis of gene expression. Science
270, 484–487 (1995).
37. Boucherie, H. et al. Two-dimensional protein map of Saccharomyces cerevisiae: construction of a
gene-protein index. Yeast 11, 601–613 (1995).
38. Gygi, S. P. et al. Quantitative analysis of complex protein mixtures using isotope-coded affinity tags.
Nature Biotechnol. 17, 994–999 (1999).
39. Mann, M. Quantitative proteomics? Nature Biotechnol. 17, 954–955 (1999).
40. Oda, Y., Huang, K., Cross, F. R., Cowburn, D. & Chait, B. T. Accurate quantitation of protein
expression and site-specific phosphorylation. Proc. Natl Acad. Sci. USA 96, 6591–6596 (1999).
41. Burns, N. et al. Large-scale analysis of gene expression, protein localization, and gene disruption in
Saccharomyces cerevisiae. Genes Dev. 8, 1087–1105 (1994).
42. Ross-Macdonald, P., Sheehan, A., Roeder, G. S. & Snyder, M. A multipurpose transposon system for
analyzing protein production, localization, and function in Saccharomyces cerevisiae. Proc. Natl
Acad. Sci. USA 94, 190–195 (1997).
43. Ross-Macdonald, P. et al. Large-scale analysis of the yeast genome by transposon tagging and gene
disruption. Nature 402, 413–418 (1999).
44. Niedenthal, R. K., Riles, L., Johnston, M. & Hegemann, J. H. Green fluorescent protein as a marker
for gene expression and subcellular localization in budding yeast. Yeast 12, 773–786 (1996).
45. Zong, Q., Schummer, M., Hood, L. & Morris, D. R. Messenger RNA translation state: the second
dimension of high-throughput expression screening. Proc. Natl Acad. Sci. USA 96, 10632–10636 (1999).
46. Johannes, G., Carter, M. S., Eisen, M. B., Brown, P. O. & Sarnow, P. Identification of eukaryotic
mRNAs that are translated at reduced cap binding complex eIF4F concentrations using a cDNA
microarray. Proc. Natl Acad. Sci. USA 96, 13118–13123 (1999).
47. Diehn, M., Eisen, M. B., Botstein, D. & Brown, P. O. Large-scale identification of secreted and
membrane-associated gene products using DNA microarrays. Nature Genet. 25, 58–62 (2000).
48. Weinstein, J. N. Fishing expeditions. Science 282, 628–629 (1998).
49. Golub, T. R. et al. Molecular classification of cancer: class discovery and class prediction by gene
expression monitoring. Science 286, 531–537 (1999).
50. Alizadeh, A. A. et al. Distinct types of diffuse large B-cell lymphoma identified by gene expression
insight review articles
NATURE | VOL 405 | 15 JUNE 2000 | www.nature.com 835© 2000 Macmillan Magazines Ltd

profiling. Nature 403, 503–510 (2000).
51. Mack, D. H. et al. in Deciphering Molecular Circuitry Using High-Density DNA Arrays (eds Hihich, E.
& Croce, E.) 85–108 (Plenum, New York, 1998).
52. Alon, U. et al. Broad patterns of gene expression revealed by clustering analysis of tumor and normal
colon tissues probed by oligonucleotide arrays. Proc. Natl Acad. Sci. USA 96, 6745–6750 (1999).
53. Perou, C. M. et al. Distinctive gene expression patterns in human mammary epithelial cells and
breast cancers. Proc. Natl Acad. Sci. USA 96, 9212–9217 (1999).
54. Ross, D. T. et al. Systematic variation in gene expression patterns in human cancer cell lines. Nature
Genet. 24, 227–235 (2000).
55. Scherf, U. et al. A gene expression database for the molecular pharmacology of cancer. Nature Genet.
24, 236–244 (2000).
56. Fambrough, D., McClure, K., Kazlauskas, A. & Lander, E. S. Diverse signaling pathways activated by
growth factor receptors induce broadly overlapping, rather than independent, sets of genes. Cell 97,
727–741 (1999).
57. Lee, S. B. et al. The Wilms tumor suppressor WT1 encodes a transcriptional activator of
amphiregulin. Cell 98, 663–673 (1999).
58. Harkin, D. P. et al. Induction of GADD45 and JNK/SAPK-dependent apoptosis following inducible
expression of BRCA1. Cell 97, 575–586 (1999).
59. Mei, R. et al. Genome-wide detection of allelic imbalance using human SNPs and high density DNA
arrays. Genome Res. (in the press).
60. Pollack, J. R. et al. Genome-wide analysis of DNA copy-number changes using cDNA microarrays.
Nature Genet. 23, 41–46 (1999).
61. Pinkel, D. et al. High resolution analysis of DNA copy number variation using comparative genomic
hybridization to microarrays. Nature Genet. 20, 207–211 (1998).
62. Holstege, F. C. et al. Dissecting the regulatory circuitry of a eukaryotic genome. Cell 95, 717–728 (1998).
63. Wyrick, J. J. et al. Chromosomal landscape of nucleosome-dependent gene expression and silencing
in yeast. Nature 402, 418–421 (1999).
64. Tamayo, P. et al. Interpreting patterns of gene expression with self-organizing maps: methods and
application to hematopoietic differentiation. Proc. Natl Acad. Sci. USA 96, 2907–2912 (1999).
65. Eisen, M. B., Spellman, P. T., Brown, P. O. & Botstein, D. Cluster analysis and display of genome-
wide expression patterns. Proc. Natl Acad. Sci. USA 95, 14863–14868 (1998).
66. Wen, X. et al. Large-scale temporal gene expression mapping of central nervous system
development. Proc. Natl Acad. Sci. USA 95, 334–339 (1998).
67. Chu, S. et al. The transcriptional program of sporulation in budding yeast. Science 282, 699–705
(1998).
68. Tavazoie, S., Hughes, J. D., Campbell, M. J., Cho, R. J. & Church, G. M. Systematic determination of
genetic network architecture. Nature Genet. 22, 281–285 (1999).
69. Wolfsberg, T. G. et al. Candidate regulatory sequence elements for cell cycle-dependent
transcription in Saccharomyces cerevisiae. Genome Res. 9, 775–792 (1999).
70. Marton, M. J. et al. Drug target validation and identification of secondary drug target effects using
DNA microarrays. Nature Med. 4, 1293–1301 (1998).
71. Gray, N. S. et al. Exploiting chemical libraries, structure, and genomics in the search for kinase
inhibitors. Science 281, 533–538 (1998).
72. Rosania, G. R. et al. Myoseverin: a microtubule binding molecule with novel cellular effects. Nature
Biotechnol. 18, 304–308 (2000).
73. Emmert-Buck, M. R. et al. Laser capture microdissection. Science 274, 998–1001 (1996).
74. Bonner, R. F. et al. Laser capture microdissection: molecular analysis of tissue. Science 278,
1481–1483 (1997).
75. Simone, N. L., Bonner, R. F., Gillespie, J. W., Emmert-Buck, M. R. & Liotta, L. A. Laser-capture
microdissection: opening the microscopic frontier to molecular analysis. Trends Genet. 14,
272–276 (1998).
76. Wang, A. M., Doyle, M. V. & Mark, D. F. Quantitation of mRNA by the polymerase chain reaction.
Proc. Natl Acad. Sci. USA 86, 9717–9721 (1989).
77. Dulac, C. Cloning of genes from single neurons. Curr. Top. Dev. Biol. 36, 245–258 (1998).
78. Jena, P. K., Liu, A. H., Smith, D. S. & Wysocki, L. J. Amplification of genes, single transcripts and
cDNA libraries from one cell and direct sequence analysis of amplified products derived from one
molecule. J. Immunol. Methods 190, 199–213 (1996).
79. Kwoh, D. Y. et al. Transcription-based amplification system and detection of amplified human
immunodeficiency virus type 1 with a bead-based sandwich hybridization format. Proc. Natl Acad.
Sci. USA 86, 1173–1177 (1989).
80. Guatelli, J. C. et al. Isothermal, in vitro amplification of nucleic acids by a multienzyme reaction
modeled after retroviral replication. Proc. Natl Acad. Sci. USA 87, 7797 (1990).
81. Eberwine, J. et al. Analysis of gene expression in single live neurons. Proc. Natl Acad. Sci. USA 89,
3010–3014 (1992).
82. Luo, L. et al. Gene expression profiles of laser-captured adjacent neuronal subtypes. Nature Med. 5,
117–122 (1999).
83. Cho, R. J. et al. Parallel analysis of genetic selections using whole genome oligonucleotide arrays.
Proc. Natl Acad. Sci. USA 95, 3752–3757 (1998).
84. Bulyk, M. L., Gentalen, E., Lockhart, D. J. & Church, G. M. Quantifying DNA-protein interactions
by double-stranded DNA arrays. Nature Biotechnol. 17, 573–577 (1999).
85. Brent, R. Genomic biology. Cell 100, 169–183 (2000).
86. McAdams, H. H. & Shapiro, L. Circuit simulation of genetic networks. Science 269, 650–656 (1995).
87. McAdams, H. H. & Arkin, A. It’s a noisy business! Genetic regulation at the nanomolar scale. Trends
Genet. 15, 65–69 (1999).
88. Bhalla, U. S. & Iyengar, R. Emergent properties of networks of biological signaling pathways. Science
283, 381–387 (1999).
89. Weng, G., Bhalla, U. S. & Iyengar, R. Complexity in biological signaling systems. Science 284,
92–96 (1999).
90. Arkin, A., Ross, J. & McAdams, H. H. Stochastic kinetic analysis of developmental pathway
bifurcation in phage lambda-infected Escherichia coli cells. Genetics 149, 1633–1648 (1998).
91. Winzeler, E. et al. Functional characterization of the Saccharomyces cerevisiae genome by precise
deletion and parallel analysis. Science 285, 901–906 (1999).
92. Fields, S. & Song, O. A novel genetic system to detect protein–protein interactions. Nature 340,
245–246 (1989).
93. Roberts, C. J. et al. Signaling and circuitry of multiple MAPK pathways revealed by a matrix of
global gene expression profiles. Science 287, 873–880 (2000).
94. Brown, P. O. & Botstein, D. Exploring the new world of the genome with DNA microarrays. Nature
Genet. 21, 33–37 (1999).
95. Ly, D., Lockhart, D. J., Lerner, R. & Schultz, P. G. Mitotic misregulation and human aging. Science
287, 2486–22492 (2000).
96. Cherry, J. M. et al. Genetic and physical maps of Saccharomyces cerevisiae. Nature 387, 67–73 (1997).
97. Ball, C. A. et al. Integrating functional genomic information into the Saccharomyces Genome
Database. Nucleic Acids Res. 28, 77–80 (2000).
98. Mewes, H. W. et al. MIPS: a database for genomes and protein sequences. Nucleic Acids Res. 28,
37–40 (2000).
99. Walsh, S., Anderson, M. & Cartinhour, S. W. ACEDB: a database for genome information. Methods
Biochem. Anal. 39, 299–318 (1998).
100. Kanehisa, M. & Goto, S. KEGG: Kyoto Encyclopedia of Genes and Genomes. Nucleic Acids Res. 28,
27–30 (2000).
101. The FlyBase Consortium. The FlyBase Database of the Drosophila Genome Projects and
community literature. Nucleic Acids Res. 27, 85–88 (1999).
102. Karp, P. D., Riley, M., Paley, S. M., Pellegrini-Toole, A. & Krummenacker, M. EcoCyc: encyclopedia
of Escherichia coli genes and metabolism. Nucleic Acids Res. 27, 50–53 (1999).
103. Iyer, V. & Struhl, K. Absolute mRNA levels and transcriptional initiation rates in Saccharomyces
cerevisiae. Proc. Natl Acad. Sci. USA 93, 5208–5212 (1996).
104. Lee, C. K., Klopp, R. G., Weindruch, R. & Prolla, T. A. Gene expression profile of aging and its
retardation by caloric restriction. Science 285, 1390–1393 (1999).
105. Fan, J.-B. et al. Parallel genotyping of human SNPs using generic oligonucleotide tag arrays. Genome
Res. (in the press).
106. Lashkari, D. A. et al. Yeast microarrays for genome wide parallel genetic and gene expression
analysis. Proc. Natl Acad. Sci. USA 94, 13057–13062 (1997).
107. Winzeler, E., Lee, B., McCusker, J. & Davis, R. Whole genome genetic typing using high-density
oligonucleotide arrays. Parasitology 118, S73–S80 (1999).
108. Winzeler, E. A. et al. Direct allelic variation scanning of the yeast genome. Science 281, 1194–1197 (1998).
109. Troesch, A. et al. Mycobacterium species identification and rifampin resistance testing with high-
density DNA probe arrays. J. Clin. Microbiol. 37, 49–55 (1999).
AcknowledgementsWe thank S. Fodor, M. Chee, R. Davis, L. Stryer, E. Lander, H. Dong, L. Wodicka, R. Cho,D. Giang, P. Zarrinkar, C. Barlow, J. Gentry, P. Schultz and R. Abagyan for their on-goinghelp and patience, and B. Geierstanger, G. Hampton and S. Kay for helpful comments anda critical reading of the manuscript.
insight review articles
836 NATURE | VOL 405 | 15 JUNE 2000 | www.nature.com© 2000 Macmillan Magazines Ltd