document
TRANSCRIPT

Nature © Macmillan Publishers Ltd 1998
8
letters to nature
158 NATURE | VOL 393 | 14 MAY 1998
earthquakes 30 km deep (Fig. 1), and from the presence of incre-mentally raised shorelines (Table 1). Both the earthquakes andstranded shorelines occur near the former edges of the ice sheet.
Although only minor raised shorelines have been reported inHudson Bay24, Baffin Island seems to have eight on its western coastand nine on its eastern coast18 (Table 1). On both coasts the strandedshorelines can be correlated over distances of 70 km, have verticalseparations of ,13 m, and were created between 2,000 and 9,000years ago. Uplifted shorelines are also found in southern New-foundland, where as many as five strands separated by an average of12 m can be found at one location19. In this case, the strands can becorrelated over tens of kilometres, but they have not been accuratelydated. The erosion surfaces behind all these shorelines are notgrossly tilted (a maximum of 1 m km−1), suggesting that they wereraised in a block-like fashion by elastic rebound instead of on adoming isostatic adjustment.
The raised shorelines lie along the edges of eastern Canada’s mostseismically active zone, a mostly offshore belt running from the GreatLakes to Newfoundland and Baffin Island. This belt includes the 1929Grandbanks M ¼ 7:2 earthquake on the seaward-sloping continentalshelf off Newfoundland, an event that produced a tsunami that killed27 people and cut the first transatlantic telephone cable. As Fig. 1shows, the belt includes zones where there is roughly a 1% chance perdecade of horizontal accelerations exceeding 0.3 g (ref. 15). As in 1929,such rapid movements are enough to level unreinforced buildings.
Both the raised shorelines and seismicity are consistent with ourice-loading strain model. First, the loading and unloading of thecrust seems to produce roughly the same number of events: sixHeinrich events and seven or eight shoreline uplifts. Second, thestrain rates and recurrence intervals scale with each other: the crustwas unloaded one-and-a-half orders of magnitude faster than it wasloaded. The resulting earthquake recurrence times would also bemuch shorter, on the order of 102–103 yr. Further, the intervalsbetween the shoreline events increases with time (Table 1).
Studies of ice dynamics have led to the suggestion that the largevolume of sediments associated with Heinrich events can beaccounted for by a ‘binge–purge’ cycle in the ice cap12. This cyclebegins with ice-sheet thickening, with consequent sub-ice meltingand higher seaward flow rates, which in turn produces ice-sheetthinning, slowing down and attachment of saturated subglacialregolith by freezing. The binge is estimated to take ,8 kyr and thepurge ,750 yr. This mechanism has been shown to be compatiblewith the Heinrich event sediment volumes, but it predicts that theevent intervals would be uniform and sedimentation rates slowenough to include foraminifera. Our model can account for therapid purge by nearly instantaneous shaking and failure of the edgeof the ice load—in effect, the earthquakes removed the resisting toesof the glacial ice slides. The inherent spatial variability of earthquakeepicentres is also consistent with the differences in the Heinrichlayer sediments and ice sources.
In addition to searching for and dating the faults implied by ourmodel for the Heinrich events, it can also be tested by studies ofsedimentary structures, relations and ages near their origins. If, forexample, undisturbed Heinrich layers immediately overlie slumpedor otherwise seismic disturbed sediments, our case would bestronger. Such features might be recognized and mapped withreflection profiling. The model could also be strengthened byfurther dating and palaeoseismic studies of the raised shorelines,as well as a complete three-dimensional numerical simulation of thecoupled ice dynamics and ice-load-induced failures.
We conclude by suggesting that if it is true that the Heinrichevents were driven primarily by crustal, as opposed to orbital,mechanics, then so were their associated climate variations. Itmay be found that some ice-age climatic variations were feedbackeffects produced by earthquake-related unloading of the ice sheet.Such a finding would lead to a much simplified interpretation of thetimescales of ice-age climate changes. M
Received 8 May 1997; accepted 16 March 1998.
1. Heinrich, H. Origin and consequences of cyclic ice rafting in the Northeast Atlantic Ocean during thepast 130,000 years. Quat. Res. 29, 142–152 (1988).
2. Andrews, J. T. & Tedesco, K. Detrital carbonate-rich sediments, northwestern Labrador Sea;implications for ice-sheet dynamics and iceberg rafting (Heinrich) events in the North Atlantic,Geology 20, 1087–1090 (1994).
3. Bond, G. et al. Evidence for massive discharges of icebergs into the north Atlantic ocean during the lastglacial period. Nature 360, 245–249 (1992).
4. Grimm, E. C., Jacobson, G. L. Jr., Watts, W. A., Hansen, B. C. S. & Maasch, K. A. A 50,000 year recordof climate oscillations from Florida and its temporal correlation with the Heinrich events. Science 261,198–200 (1993).
5. Lowell, T. V. et al. Interhemispheric correlation of late Pleistocene glacial events. Science 269, 1541–1549 (1995).
6. Broecker, W. S. Massive iceberg discharges as triggers for global climate change. Nature 372, 431–424(1994).
7. Bond, G. et al. Correlations between climate records from North Atlantic sediments and Greenlandice. Nature 365, 143–147 (1993).
8. Baltuck, M., Dickey, J., Dixon, T. & Harrison, C. G. A. New approaches raise questions about future sealevel changes. Eos 77, 385–388 (1996).
9. Shackleton, N. J., Imbrie, J. & Hall, M. A. Oxygen and carbon isotope record of East Pacific Core V19–30; implications for the formation of deep water in the late Pleistocene North Atlantic. Earth Planet.Sci. Lett. 65, 233–244 (1983).
10. Bond, G. & Lotti, R. Climate forcing of millennial-scale ice rafting cycles in the North Atlantic. Eos 75,332 (1994).
11. Hays, J. D., Imbrie, J. & Shackleton, N. J. Variations in the earth’s orbit: pacemaker of the ice ages.Science 194, 11221–1132 (1976).
12. Alley, R. B. & MacAyeal, D. R. Ice-rafted debris associated with binge–purge oscillations of theLaurentide ice sheet. Paleoceanography 9, 503–511 (1994).
13. Gupta, H. K. & Chandha, R. K. (eds) Induced Seismicity (Pure Appl. Geophys. Vol. 145, 1995).14. Hasegawa, H. S. & Basham, P. W. in Earthquakes at North-Atlantic Passive Margins: Neotectonics and
Postglacial Rebound (ed. Gregersen, S. and Basham, P. W.) 483–500 (NATO Advanced Study InstitutesSeries C, Vol. 266, 1989).
15. Geological Survey Canada, http://www.seismo.nrcan.gc.ca/sheishaz4gen123.html16. Arvidsson, R. Fennoscandian earthquakes: whole crustal rupturing related to postglacial rebound.
Science 274, 744–745 (1996).17. Johnston, A. C. A wave in the earth. Science 274, 735 (1996).18. Andrews, J. T. A Geomorphological Study of Post-Glacial Uplift with Particular Reference to Arctic
Canada (London Institute of British Geographers, London, 1970).19. Tucker, C. M., Leckie, D. A. & McCann, S. B. Raised shoreline phenomena and postglacial emergence
in south-central Newfoundland. Geomorph. Phys. Quat. 36, 165–174 (1982).20. Lay, T. & Wallace, T. C. Modern Global Seismology (Academic, New York, 1995).21. Broecker, W. The Glacial World According to Wally (Lamont-Doherty Earth Observatory, Palisades,
1995).22. Cathles, L. M. III The Viscosity of the Earth’s Mantle (Princeton Univ. Press, 1975).23. Sieh, K. E. in Earthquake Prediction (ed. Simpson, D. W. and Richards, P. G.) 181–207 (American
Geophysical Union, Washington, 1981).24. Bird, J. B. The Physiography of Arctic Canada (Johns Hopkins Univ. Press, 1967).
Acknowledgements. We thank G. Bond and J. Park for insightful and considered reviews, and ourcolleagues for their patient help in understanding Heinrich events.
Correspondence and requests for materials should be addressed to P.E.M. (e-mail: [email protected]).
Sphenoidshorteningandtheevolutionofmodernhumancranial shapeDaniel E. Lieberman
Department of Anthropology, Rutgers University, New Brunswick,New Jersey 08903-0270, USA. . . . . . . . . . . . . . . . . . . . . . . . . . . . . . . . . . . . . . . . . . . . . . . . . . . . . . . . . . . . . . . . . . . . . . . . . . . . . . . . . . . . . . . . . . . . . . . . . . . . . . . . . . . . . . . . . . . . . . . . .
Crania of ‘anatomically modern’ Homo sapiens from the Holoceneand Upper Pleistocene epochs differ from those of other Homotaxa, including Neanderthals, by only a few features. Theseinclude a globular braincase, a vertical forehead, a dimunitivebrowridge, a canine fossa and a pronounced chin1–4. Humans arealso unique among mammals in lacking facial projection: the faceof the adult H. sapiens lies almost entirely beneath the anteriorcranial fossa, whereas the face in all other adult mammals,including Neanderthals, projects to some extent in front of thebraincase. Here I use radiographs and computed tomography toshow that many of these unique human features stem partly froma single, ontogenetically early reduction in the length of thesphenoid, the central bone of the cranial base from which theface grows forward. Sphenoid reduction, through its effects onfacial projection and cranial shape, may account for the appar-
Nature © Macmillan Publishers Ltd 1998
8
letters to nature
NATURE | VOL 393 | 14 MAY 1998 159
ently rapid evolution of modern human cranial form, and sug-gests that Neanderthals and other archaic Homo should beexcluded from H. sapiens.
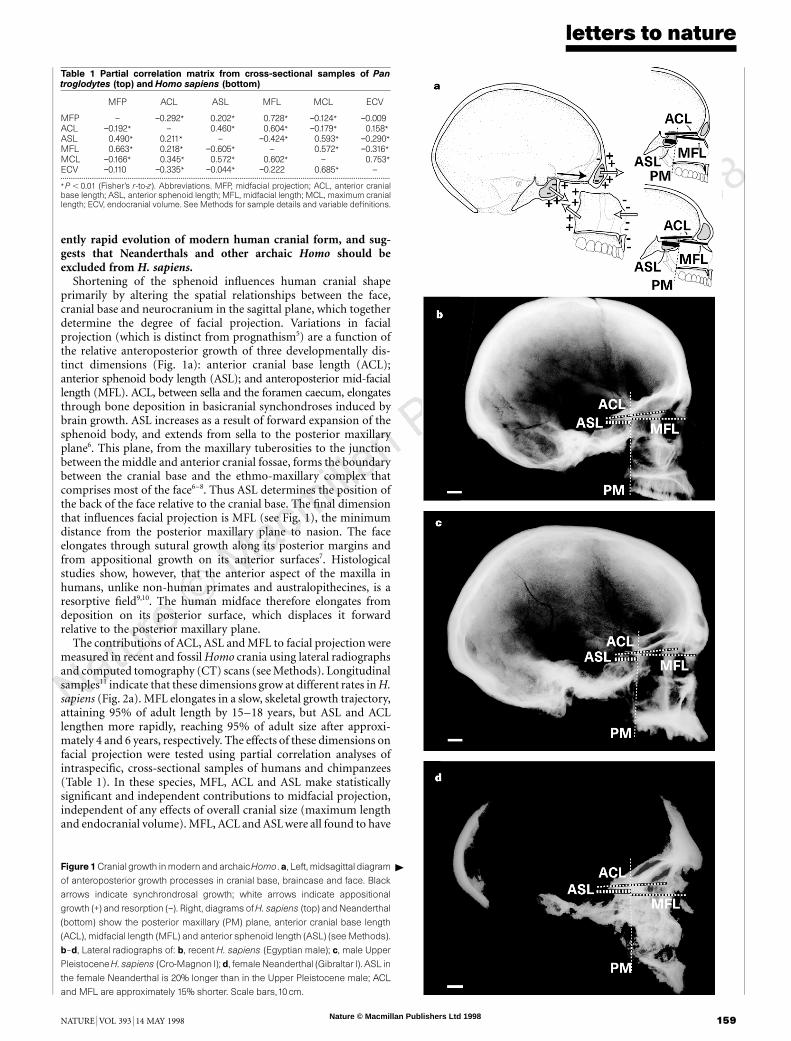
Shortening of the sphenoid influences human cranial shapeprimarily by altering the spatial relationships between the face,cranial base and neurocranium in the sagittal plane, which togetherdetermine the degree of facial projection. Variations in facialprojection (which is distinct from prognathism5) are a function ofthe relative anteroposterior growth of three developmentally dis-tinct dimensions (Fig. 1a): anterior cranial base length (ACL);anterior sphenoid body length (ASL); and anteroposterior mid-faciallength (MFL). ACL, between sella and the foramen caecum, elongatesthrough bone deposition in basicranial synchondroses induced bybrain growth. ASL increases as a result of forward expansion of thesphenoid body, and extends from sella to the posterior maxillaryplane6. This plane, from the maxillary tuberosities to the junctionbetween the middle and anterior cranial fossae, forms the boundarybetween the cranial base and the ethmo-maxillary complex thatcomprises most of the face6–8. Thus ASL determines the position ofthe back of the face relative to the cranial base. The final dimensionthat influences facial projection is MFL (see Fig. 1), the minimumdistance from the posterior maxillary plane to nasion. The faceelongates through sutural growth along its posterior margins andfrom appositional growth on its anterior surfaces7. Histologicalstudies show, however, that the anterior aspect of the maxilla inhumans, unlike non-human primates and australopithecines, is aresorptive field9,10. The human midface therefore elongates fromdeposition on its posterior surface, which displaces it forwardrelative to the posterior maxillary plane.
The contributions of ACL, ASL and MFL to facial projection weremeasured in recent and fossil Homo crania using lateral radiographsand computed tomography (CT) scans (see Methods). Longitudinalsamples11 indicate that these dimensions grow at different rates in H.sapiens (Fig. 2a). MFL elongates in a slow, skeletal growth trajectory,attaining 95% of adult length by 15–18 years, but ASL and ACLlengthen more rapidly, reaching 95% of adult size after approxi-mately 4 and 6 years, respectively. The effects of these dimensions onfacial projection were tested using partial correlation analyses ofintraspecific, cross-sectional samples of humans and chimpanzees(Table 1). In these species, MFL, ACL and ASL make statisticallysignificant and independent contributions to midfacial projection,independent of any effects of overall cranial size (maximum lengthand endocranial volume). MFL, ACL and ASL were all found to have
Table 1 Partial correlation matrix from cross-sectional samples of Pantroglodytes (top) and Homo sapiens (bottom)
MFP ACL ASL MFL MCL ECV
MFP — −0.292* 0.202* 0.728* −0.124* −0.009ACL −0.192* — 0.460* 0.604* −0.179* 0.158*ASL 0.490* 0.211* — −0.424* 0.593* −0.290*MFL 0.663* 0.218* −0.605* — 0.572* −0.316*MCL −0.166* 0.345* 0.572* 0.602* — 0.753*ECV −0.110 −0.335* −0.044* −0.222 0.685* —.............................................................................................................................................................................* P , 0:01 (Fisher’s r-to-z). Abbreviations. MFP, midfacial projection; ACL, anterior cranialbase length; ASL, anterior sphenoid length; MFL, midfacial length; MCL, maximum craniallength; ECV, endocranial volume. See Methods for sample details and variable definitions.
Figure 1 Cranial growth in modern andarchaicHomo.a, Left, midsagittal diagram
of anteroposterior growth processes in cranial base, braincase and face. Black
arrows indicate synchrondrosal growth; white arrows indicate appositional
growth (+) and resorption (−). Right, diagrams of H. sapiens (top) and Neanderthal
(bottom) show the posterior maxillary (PM) plane, anterior cranial base length
(ACL), midfacial length (MFL) and anterior sphenoid length (ASL) (see Methods).
b–d, Lateral radiographs of: b, recent H. sapiens (Egyptian male); c, male Upper
Pleistocene H. sapiens (Cro-Magnon I); d, female Neanderthal (Gibraltar I). ASL in
the female Neanderthal is 20% longer than in the Upper Pleistocene male; ACL
and MFL are approximately 15% shorter. Scale bars,10 cm.
Q

Nature © Macmillan Publishers Ltd 1998
8
letters to nature
160 NATURE | VOL 393 | 14 MAY 1998
*
*
*
10
20
30
40
50
60Length
(m
m)
0.0
8
0.2
5
0.7
5
1.75
2.7
5
3.7
5
4.7
5
5.7
5
6.7
5
7.75
8.7
5
9.7
5
11.7
5
13.7
5
15.7
5
17.7
5
ACL
MFL
ASL
Postnatal years
a
b
c
d
ln Anterior sphenoid length (mm)
ln M
idfa
cia
l pro
jection (m
m)
y =1.58x-1.99Panr = 0 .62
y =1.60x-2.37Homo
r = 0 .731.0
1.5
2.0
2.5
3.0
3.5
2.2 2.4 2.6 2.8 3.0 3.2 3.4
ln Midfacial length (mm)
ln M
idfa
cia
l pro
jection (m
m)
y =1.89x-4.09Pan
r=0.93
y =1.88x-4.26Homo
r=0.791.0
1.5
2.0
2.5
3.0
3.5
3.0 3.2 3.4 3.6 3.8 4.0
ln Anterior cranial base length (mm)
ln M
idfa
cia
l pro
jection (m
m)
y =2.94x-8.20Pan
r=0.77
y =2.18x-5.87Homo
r=0.631.0
1.5
2.0
2.5
3.0
3.5
3.1 3.3 3.5 3.7 3.9 4.1
Figure 2 Ontogeny of facial projection in Homo sapiens and Pan troglodytes. a,
Growth rates in longitudinal sample of H. sapiens16 of anterior cranial base length
(ACL), midfacial length (MFL) and anterior sphenoid length (ASL). Bars represent
1 standard deviation; asterisks indicate 95% of mean adult size. b–d, Log-
transformed least-squares regression of these dimensions with midfacial projec-
tion in cross-sectional samples of H. sapiens (filled circles) and P. troglodytes
(open circles). See Methods for measurement and sample details.
3.1
3.2
3.3
14
16
18
a
2.5
2.6
2.7
2.8
2.9
3.0
ln M
idfa
cia
l pro
jection (m
m)
2.9 3.0 3.1 3.2 3.3 3.4
ln Anterior sphenoid length(mm)
1
2
3
45
6
7
13
15 17
8
10
12
9
11
H. sapiens (Holocene)
H. sapiens (Pleistocene)
H. neanderthalensis
H. heidelbergensis
H. erectus
H. sapiens (Holocene)
H. sapiens (Pleistocene)
H. neanderthalensis
H. heidelbergensis
H. erectus
H. sapiens (Holocene)
H. sapiens (Pleistocene)
H. neanderthalensis
H. heidelbergensis
H. erectus
H. sapiens (Holocene)
H. sapiens (Pleistocene)
H. neanderthalensis
H. heidelbergensis
H. erectus
b
c
d
y=0.93x-0.07
r =0.752
0.22
0.20
0.24
0.26
0.28
0.30
0.32
0.34
0.36
0.38
ln N
euro
cra
nia
l glo
bula
rity
(m
m)
2.5 2.6 2.7 2.8 2.9 3 3.1 3.2 3.3
1
23
4
5 67
13
15
17
14
16
8
1012
911
18
y=-0.22x+0.96
r =0.772
2.0
2.2
2.4
2.6
2.8
3.2
3.0
3.4
3.6
ln B
row
ridge length
(m
m)
2.5 2.6 2.7 2.8 2.9 3 3.1 3.2 3.3
1 2
3
45
6
7
13
15
17
14
16
8 10
12
9
11
18
y=2.32x-3.77
r =0.852
3.7
3.8
3.9
4.1
4.0
4.2
4.3
4.4
4.5
ln F
ronta
l angle
(deg)
2.5 2.6 2.7 2.8 2.9 3 3.1 3.2 3.3
ln Midfacial projection(mm)
ln Midfacial projection(mm)
ln Midfacial projection(mm)
12
34
56
7
13 15
17 14
16
8 10
12
9
11
18
y=-1.00x-7.06
r =0.842
Figure 3 Effects of anterior sphenoid length (ASL) on facial projection (MFP) and
other aspects of cranial shape in Homo. a, Log-transformed least-squares
regression of ASL with MFP (including H. heidelbergensis, y ¼ 1:01x 2 0:30;
r2 ¼ 0:620). b–d, Log-transformed least-squares regressions between MFP and
supraorbital length, frontal angle and midsagittal cranial curvature (see Methods).
Samples include: 1, female Australians; 2, male Australians; 3, female Chinese; 4,
male Chinese; 5, female Italians; 6, male Italians; 7, female Egyptians; 8, male
Egyptians; 9, female Ashanti; 10, male Ashanti; 11, female Pleistocene H. sapiens;
13, female Neanderthal; 14, male Neanderthals; 15, female H. heidelbergensis; 16,
male H. heidelbergensis; 17, female H. erectus; and 18, male H. erectus.

Nature © Macmillan Publishers Ltd 1998
8
letters to nature
NATURE | VOL 393 | 14 MAY 1998 161
strong, positive allometric effects on facial projection (Fig. 2b–d).Variations in facial projection in chimpanzees, humans and pre-sumably fossil hominids derive, therefore, from differences in MFL,ACL and ASL, all of which influence the position of the front of theface relative to the cranial base and neurocranium.
Although facial, cranial base and sphenoid length each affectfacial projection in modern humans and other primates, compar-isons between taxa show that variations in ASL provide the mainstructural basis for the differences in facial projection betweenPleistocene ‘anatomically modern’ H. sapiens and archaic Homo.Midfacial length, lower facial length, anterior cranial base lengthand endocranial volume do not differ significantly between adultPleistocene modern H. sapiens, Neanderthals and H. heidelbergensis(Table 2). In contrast, ASL is roughly 30% shorter (P , 0:001) inHolocene and Pleistocene modern H. sapiens than in Neanderthalsand other archaic Homo taxa (Fig. 1b–d). Anterior sphenoidshortening reduces facial projection in crania of Pleistocene andHolocene H. sapiens compared with crania of archaic Homo bypositioning the posterior maxillary plane, and hence the posteriormargin of the face, closer to the middle cranial fossa. ASL accountsfor approximately 75% of the variation in facial projection amongPleistocene fossil and Holocene taxa of the genus Homo (Fig. 3a;excluding H. heidelbergensis males, in which a significantly longerMFL than other archaic Homo taxa (P , 0:05) contributes to anextreme degree of facial projection).
Reduced facial projection in modern humans, which resultsprimarily from sphenoid shortening, results in other phylogeneti-cally and functionally significant differences in craniofacial shape.Facial projection is the main influence on browridge size and frontalangulation in non-human primates12–14, and contributes to roughly85% of the variation in these features in Homo (Fig. 3b, c). Reducedfacial projection also increases overall cranial globularity in modernhumans by decreasing cranial length relative to endocranial volume(Fig. 3d). Finally, decreased facial projection positions the maxillacloser to the foramen magnum and the temporo-mandibular jointin H. sapiens than in archaic Homo, reducing the length of theoropharynx and the load arm of the chewing muscles15,16. Butsphenoid shortening is not the only source of variation in facialprojection and its consequent effects in Homo. Within Homo, r2 is0.74 between ASL and browridge length, 0.65 between ASL andfrontal angle, and 0.47 between ASL and cranial globularity. WithinH. sapiens, for example, variations in facial projection result mostlyfrom differences in MFL, which is approximately 12% shorter inHolocene than Pleistocene populations (P , 0:01), and from asimilar decrease in overall cranial size (Table 2). These factorsaccount for the considerable morphological variability in browridgesize and other features in Pleistocene H. sapiens crania, such as thatevident in the Skhul and Qafzeh hominids17.
Given the close phylogenetic relationship between H. sapiens,Neanderthals and other Pleistocene hominid taxa, it should perhaps
not be surprising that many unique features of the modern humancranium apparently result from a single, ontogenetically early, shiftin cranial base growth. The discrete, derived developmental basis ofsphenoid shortening in H. sapiens, together with its effects oncraniofacial shape, may explain how modern humans might haveevolved rapidly from more archaic forms, possibly as a distinctclade, and arguably as a distinct phylogenetic species18–20. Otheraspects of cranial shape that distinguish recent and Pleistocenemodern H. sapiens populations4,21 probably result from decreases infacial length, brain size and overall skeletal robusticity4,22,23. Thecomplex, integrated nature of craniofacial growth and functionmake it unlikely, however, that any single selective advantage canaccount for the evolution of sphenoid shortening and the uniquecraniofacial configuration of H. sapiens. One possibility is that ashorter sphenoid, by decreasing the oropharynx length, is anadaptation for speech. If the hyoid and larynx had the same lowposition relative to the mandible and cranial base in archaic Homothat they do in H. sapiens24, a shorter sphenoid would contribute tothe unique proportions of the human vocal tract, in which thehorizontal component is roughly equal in length to its verticalcomponent, rather than markedly longer as in other primates25.This configuration improves the ability to produce acousticallydistinct speech sounds25–27, and so may have provided some advan-tage for sphenoid reduction and its consequent effects on facialprojection in H. sapiens. M. . . . . . . . . . . . . . . . . . . . . . . . . . . . . . . . . . . . . . . . . . . . . . . . . . . . . . . . . . . . . . . . . . . . . . . . . . . . . . . . . . . . . . . . . . . . . . . . . . . . . . . . . . . . . . . . . . . . . . . . .
Methods
Samples used. Lateral radiographs were taken of 20 adult (10 males and 10females) recent H. sapiens crania from Australia, south China, Europe (Italy),north Africa (Egypt), and sub-Saharan Africa (Ashanti) from the AmericanMuseum of Natural History (AMNH); a pooled-sex cross-sectional sample(n ¼ 30) of modern human crania from the Cleveland Museum of NaturalHistory (CMNH); and a longitudinal sample of 16 males and 16 females fromthe Denver Growth Study radiographed from 1 month to 18 years after birth11.A cross-sectional, pooled-sex sample (n ¼ 69) of Pan troglodytes (chimpanzee)was radiographed from collections at the AMNH, the CMNH and the Museumof Comparative Zoology (Harvard). The cross-sectional human and chimpan-zee samples include equal numbers of individuals from four dental stages(before eruption of the first upper molar (M1); after M1 eruption before M2
eruption; after M2 eruption but before M3 eruption; and after M3 eruption).The fossil sample includes crania for which radiographs and/or CTscans are
available and which are sufficiently complete to reconstruct the posteriormaxillary plane and other aspects of facial position relative to the basicraniumand neurocranium. The posterior maxillary plane maintains an angle of 908with the neutral horizontal axis of the orbit throughout postnatal developmentin H. sapiens (angle x ¼ 89:98, s:d: ¼ 1:7, n ¼ 353) as it does in all mammals,including P. troglodytes6,8. This constant angle allows accurate reconstruction ofthe posterior maxillary plane in fossils well-preserved maxillary tuberositiesand orbits. Fossils used were split by sex into the following groups: male earlymodern H. sapiens (Cro Magnon I, Obercassel I, Skhul IV and V); female early
Table 2 Intertaxon analysis of variance of facial, basicranial and neurocranial dimensions and spatial relationships in Homo.
Taxon N (m/f) ASL (mm) ACL (mm) MFL (mm) LFL (mm) MFP (mm) FRA (mm) SOL (mm) GLO (mm) MCL (mm) ECV (cm3)...................................................................................................................................................................................................................................................................................................................................................................
H. sapiens 100 (50/50) 19.9 47.8 40.6 45.0 14.6 81.4 11.1 1.41 177.7 1,368.4(Holocene) (2.0) (2.9) (3.6) (3.8) (2.4) (6.4) (2.7) (0.1) (8.2) (149.4)
H. sapiens 6 (4/2) 20.0 49.6 45.4* 50.8* 16.1 77.5 17.0* 1.43 193.0* 1,478.8(Pleistocene) (1.8) (3.7) (2.3) (6.5) (2.1) (5.4) (3.0) (0.1) (10.0) (114.8)H. neanderthalensis 5 (3/2) 25.9*† 52.6* 46.9* 52.6* 21.4*† 59.0*† 24.8*† 1.33† 198.3* 1,447.5
(2.9) (7.1) (4.9) (7.5) (4.8) (6.0) (2.8) (0.1) (11.3) (201.1)
H. heidelbergensis 3 (2/1) 24.8*† 48.8 45.3* 53.0* 24.6*† 49.0*† 31.5*† 1.32† 200.3* 1,201.7*(5.1) (9.1) (8.5) (9.5) (10.1) (10.8) (6.0) (0.0) (13.5) (93.9)
H. erectus 2 (1/1) 28.4*† 35.3* 39.6 48.7 20.0*† 55.5*† 30.5*† 1.34*† 190.5* 935.5*†(0.1) (1.6) (3.4) (1.8) (2.1) (0.6) (0.0) (20.5) (185.9)
...................................................................................................................................................................................................................................................................................................................................................................See Methods for sample details and variable definitions. Standard deviations are in parentheses. Abbreviations: ASL, anterior sphenoid length; ACL, anterior cranial base length; MFL,midfacial length; LFL, lower facial length; MFP, midfacial projection; FRA, frontal angle; SOL, supraorbital length; GLO, neurocranial curvature (globularity); MCL, maximum cranial length;ECV, endocranial volume.* Significantly different (P , 0:01, Scheffe’s F) from Holocene H. sapiens.† Significantly different (P , 0:01, Scheffe’s F) form Pleistocene H. sapiens.

Nature © Macmillan Publishers Ltd 1998
8
letters to nature
162 NATURE | VOL 393 | 14 MAY 1998
modern H. sapiens (Abri Pataud, Obercassel II); male Neanderthals (LaChapelle aux Saints, La Ferrassie I, Monte Circeo, La Quina V); femaleNeanderthals (Gibraltar I); male H. heidelbergensis (Broken Hill, Petralona);female H. heidelbergensis (Steinheim); male H. erectus (OH 9); female H. erectus(KNMR-ER 3733). I radiographed all crania except for Skhul IV (B. Are-nsburg), Petrolona (C. Stringer), KNM-ER 3733 (A. Walker) and Obercassel Iand II, Monte Circeo, La Quina V (T. Molleson). F. Spoor provided CTscans ofthe OH 9, Broken Hill and Steinheim specimens.Measurements. Linear and angular measurements were taken from tracedradiographs using digital calipers accurate to 0.01 mm, and a protractoraccurate to 18. Measurements include: ASL (anterior sphenoid body length),the minimum distance from the sella to the posterior maxillary plane; ACL(anterior cranial base length), from the sella to the foramen caecum; MFL(midfacial length), the minimum distance from the posterior maxillary planeto nasion; LFL (lower facial length), from the anterior nasal spine to theposterior nasal spine; MFP (midfacial projection) from nasion to the foramencaecum (perpendicular to the posterior maxillary plane); FRA (frontal angle)from the metopion to the base of the frontal squama relative to the Frankfurthorizontal; SOL (supraorbital length) from the glabella to fronton (perpendi-cular to the posterior maxillary plane); GLO (neurocranial curvature orglobularity) from the glabella to the opistocranion; and ECV (endocranialvolume), which was measured by filling crania with beads; estimates of fossilendocranial volume are from ref. 28. For landmark definitions, see ref. 29.
Received 6 October 1997; accepted 10 February 1998.
1. Day, M. H. & Stringer, C. B. in L’Homo erectus et la Place de l’Homme de Tautavel parmi les HominidesFossiles Vol. 2 (ed. De Lumley, H.) 814–846 (Louis-Jean, Nice, 1982).
2. Lieberman, D. E. Testing hypotheses about recent human evolution from skulls: integratingmorphology, function, development and phylogeny. Curr. Anthropol. 36, 159–197 (1995).
3. Kidder, J. H., Jantz, R. L. & Smith, F. H. in Continuity or Replacement: Controversies in Homo sapiensEvolution (eds Brauer, G. & Smith, F. H.) 157–177 (A.A. Balkema, Rotterdam, 1992).
4. Lahr, M. M. The Evolution of Modern Human Cranial Diversity (Cambridge Univ. Press, 1996).5. Bilsborough, A. & Wood, B. A. Cranial morphometry of early hominids: facial region. Am. J. Phys.
Antrhropol. 76, 61–86 (1988).6. Enlow, D. H. & Azuma, M. in Morphogenesis and Malformations of the Face and Brain (ed. Langman,
J.) 217–230 (Harper and Row, New York, 1975).7. Enlow, D. H. Facial Growth 3rd edn (Saunders, Philadelphia, 1990).8. Bromage, T. G. The ontogeny of Pan troglodytes craniofacial architectural relationships and implica-
tions for early hominids. J. Hum. Evol. 23, 235–251 (1992).9. Duterloo, H. S. & Enlow, D. H. A comparative study of cranial growth in Homo and Macaca. Am. J.
Anat. 127, 357–368 (1970).10. Bromage, T. G. Ontogeny of the early hominid face. J. Hum. Evol. 18, 751–773 (1989).11. MacCammon, R. Human Growth and Development (C. C. Thomas, Springfield, 1970).12. Weidenreich, F. The brain and its role in the phylogenetic transformation of the human skull. Trans.
Am. Phil. Soc. 31, 321–442 (1941).13. Shea, B. T. On aspects of skull form in African apes and orangutans, with implications for hominid
evolution. Am. J. Phys. Anthropol. 68, 329–342 (1985).14. Ravosa, M. J. Ontogenetic perspective on mechanical and nonmechanical models of primate
circumorbital morphology. Am. J. Phys. Anthropol. 85, 95–112 (1991).15. Trinkaus, E. The Neandertal face: evolutionary and functional perspectives on a recent hominid face. J.
Hum. Evol. 16, 429–443 (1987).16. Spencer, M. A. & Demes, B. Biomechanical analysis of masticatory system configuration in
Neanderthals and Inuits. Am. J. Phys. Anthropol. 91, 1–20 (1995).17. Corruccini, R. M. Metrical reconsideration of the Skhul IV and IX and Border Cave 1 crania in the
context of modern human origins. Am. J. Phys. Anthropol. 87, 433–445 (1992).18. Krings, M. et al. Neandertal DNA sequences and the origin of modern humans. Cell 90, 19–30 (1997).19. Stringer, C. B. & Andrews, P. A. Genetic and fossil evidence for the origin of modern humans. Science
239, 1263–1268 (1988).20. Schwartz, J. H. & Tattersall, I. Significance of some previously unrecognized apomorphies in the nasal
region of Homo neanderthalensis. Proc. Natl Acad. Sci. USA 93, 10852–10854 (1996).21. Howells, W. W. Skull Shapes and the Map (Peabody Museum Papers no. 79, Cambridge, 1989).22. Lieberman, D. E. How and why recent humans grow thin skulls: experimental data on systemic
cortical robusticity. Am. J. Phys. Antropol. 101, 217–236 (1996).23. Ruff, C. B., Trinkaus, E. & Holliday, T. W. Body mass and encephalization in Pleistocene Homo. Nature
387, 173–176 (1997).24. Arensburg, B., Schepartz, L. A., Tillier, A. M., Vandermeersch, B. & Rak, Y. A reappraisal of the
anatomical basis for speech in Middle Paleolithic hominids. Am. J. Phys. Anthropol. 83, 137–146(1990).
25. Stevens, K. N. in Human Communication: A Unified View (eds David, E. E. & Denes, P. B.) 51–66(McGraw Hill, New York, 1972).
26. Fant, G. Acoustic Theory of Speech Production (Moulton, The Hague, 1960).27. Lieberman, P. The Biology and Evolution of Language (Harvard Univ. Press, Cambridge, MA, 1984).28. Aiello, L. & Dean, C. An Introduction to Human Evolutionary Anatomy (Academic, London, 1990).29. White, T. D. & Folkens, P. A. Human Osteology (Academic, San Diego, 1991).
Acknowledgements. I thank B. Arensburg, M. Chech, A. W. Crompton, J.-J. Hublin, L. Humphreey,L. Jellema, R. Kruszinski, P. Langaney, B. Latimer, T. Molleson, D. Pilbeam, A. Poole, C. Ross, G. Sawyer,F. Spoor, C. Stringer, I. Tattersall and A. Walker for help and/or permission to obtain radiographs and CTscans; R. McCarthy, K. Mowbray and R. Bernstein for help with collecting data; and L. Aiello, F. A. JenkinsJr, P. O’Higgins, O. Pearson, D. Pilbeam, G. P. Rightmire, N. Shubin, R. J. Smith, I. Tattersall and B. Woodfor comments on the manuscript. This work was supported by Rutgers University.
Correspondence and requests for materials should be addressed to the author (e-mail: [email protected]).
Gene transfer to thenucleusand theevolutionofchloroplastsWilliam Martin*, Bettina Stoebe†, Vadim Goremykin*,Sabine Hansmann*, Masami Hasegawa‡& Klaus V. Kowallik†
* Institut fur Genetik, Technische Universitat Braunschweig, Spielmannstrasse 7,38023 Braunschweig, Germany† Botanisches Institut, Heinrich-Heine-Universitat Dusseldorf,Universitatsstrasse 1, 40225 Dusseldorf, Germany‡ The Institute of Statistical Mathematics, 4-6-7 Minami-Azabu, Minato-ku,Tokyo 106, Japan. . . . . . . . . . . . . . . . . . . . . . . . . . . . . . . . . . . . . . . . . . . . . . . . . . . . . . . . . . . . . . . . . . . . . . . . . . . . . . . . . . . . . . . . . . . . . . . . . . . . . . . . . . . . . . . . . . . . . . . . .
Photosynthetic eukaryotes, particularly unicellular forms, pos-sess a fossil record that is either wrought with gaps or difficult tointerpret, or both. Attempts to reconstruct their evolution havefocused on plastid phylogeny, but were limited by the amount andtype of phylogenetic information contained within singlegenes1–5. Among the 210 different protein-coding genes containedin the completely sequenced chloroplast genomes from a glauco-cystophyte, a rhodophyte, a diatom, a euglenophyte and five landplants, we have now identified the set of 45 common to each and toa cyanobacterial outgroup genome. Phylogenetic inference withan alignment of 11,039 amino-acid positions per genome indi-cates that this information is sufficient—but just barely so—to
Synechocystis(branch drawn 1/2 scale)
Cyanophora
Odontella
Porphyra
Euglena
Pinus
Nicotiana
Marchantia
Zea
Oryza
0.1
2
1
3
45
6
7
Branches 1 - 7
NJ-K and MP trees.
a Preferred topology T1 found in all analyses
b Alternative topologies found at low BP in ML analyses
syn
cyapor odo
syn
cyaodo
por
syn
cya
odo por
T2 T3 T4
3 33
found at 1000‰ BP in NJ-D
Figure 1 Plastid phylogeny interpreted from chloroplast proteins. a, Rooted nine
species neighbour-joining (NJ) tree of Dayhoff distances for 11,039 amino-acid
positions from 45 orthologous proteins common to these chloroplast genomes
and Synechocystis. All seven branches of this topology (T1) are found in 1,000/
1,000 bootstrap samples in maximum parsimony (PROTPARS of PHYLIP) and NJ
analysisusingeither Kimura or Dayhoff distances. The root of the tree is assumed
from the model that all plastids sampled here arose from a common chloroplast
ancestor. Branches are numbered 1–7 for convenience (see text). The scale bar
indicates Dayhoff distance. b, Alternative topologies T2, T3 and T4 detected in
protein maximum likelihood10 analyses using the JTT-F model. Taxon abbrevia-
tions are given in Methods; branch 3 is the same as in a.