document
TRANSCRIPT
© 1999 Macmillan Magazines Ltd
body size — may be matched by the com-plexity of their social relationships.Richard C. Connor*, Michael R. Heithaus†,Lynne M. Barre‡*Biology Department, University of Massachusetts, Dartmouth, North Dartmouth, Massachusetts 02747, USAe-mail: [email protected]†Biology Department, Simon Fraser University,Burnaby, British Columbia, V5A 1S6, Canada‡Biology Department, Georgetown University,Washington, DC 20057, USA
1. Boehm, C. in Coalitions and Alliances in Humans and Other
Animals (eds Harcourt, A. H. & de Waal, F. B. M.) 137–173
(Oxford Univ. Press, 1992).
2. Falger, V. S. E. in Coalitions and Alliances in Humans and Other
Animals (eds Harcourt, A. H. & de Waal, F. B. M.) 323–348
(Oxford Univ. Press, 1992).
3. Connor, R. C., Smolker, R. A. & Richards, A. F. in Coalitions
and Alliances in Humans and Other Animals (eds Harcourt, A. H.
& deWaal, F. B. M.) 415–443 (Oxford Univ. Press, 1992).
4. Connor, R. C., Smolker, R. A. & Richards, A. F. Proc. Natl Acad.
Sci. USA 89, 987–990 (1992).
5. Connor, R. C. et al. Behaviour 133, 37–69 (1996).
6. Wells, R. S. in Dolphin Societies (eds Pryor, K. & Norris, K. S.)
199–225 (Univ. California Press, Berkeley, 1991).
7. Connor, R. C. et al. in Cetacean Societies: Field Studies of Whales
and Dolphins (eds Mann, J., Connor, R. C., Tyack, P. L. &
Whitehead, H.) (Chicago Univ. Press, in the press).
8. Smolker, R. A. et al. Behaviour 123, 38–69 (1992).
9. Nöe, R. Anim. Behav. 47, 211–213 (1994).
10.Harcourt, A. H. in Coalitions and Alliances in Humans and
Other Animals (eds Harcourt, A. H. & de Waal, F. B. M.)
445–471 (Oxford Univ. Press, 1992).
11.Cords, M. in Machiavellian Intelligence Vol. II, Extensions and
Evaluations (eds Whiten, A. & Byrne, R. W.) 24–49 (Cambridge
Univ. Press, 1997).12.Barton, R. A. & Dunbar, R. I .M. in Machiavellian Intelligence
Vol. II, Extensions and Evaluations (eds Whiten, A. & Byrne, R.W.) 240–263 (Cambridge Univ. Press, 1997).
scientific correspondence
572 NATURE | VOL 397 | 18 FEBRUARY 1999 | www.nature.com
Iodine oxide in themarine boundary layer
A striking example of the influence of halo-gen chemistry on tropospheric ozone levelsis the episodic destruction of boundary-layer ozone during the Arctic sunrise byreactive halogen species1,2. We detectediodine oxide in the boundary layer at MaceHead, Ireland (53°208 N, 9°548 W) duringMay 1997, which indicates that iodinechemistry is occurring in the troposphere.
Reactive halogen species in the atmos-phere act as catalysts in several photochemi-cal reaction cycles that are closely linkedwith ozone3. Iodine atoms react preferen-tially with ozone, forming iodine oxide, IO.IO can react with itself or with the halogenoxides BrO and ClO to produce O2 andhalogen atoms. If these react with ozone, acatalytic mechanism destroys two ozonemolecules per cycle. The reaction of IO withHO2 forms HOI, which is rapidly photol-ysed into I and OH. This catalytic cycle alsoeffectively destroys ozone.
The measurement of IO in the boundarylayer has so far been unsuccessful. Theupper limit of the mixing ratios, deter-mined as 0.5–0.9 part per trillion (p.p.t.)3,4,agreed with model predictions5–9. We mea-sured the concentrations of O3, NO2, SO2,HCHO, HONO, BrO, ClO and IO by usinglong-path differential optical absorptionspectroscopy (LP-DOAS)10 during the
Anterior sphenoid inmodern humans
Lieberman has proposed1 that reducedmidfacial projection (MFP), in which mostof the face lies beneath the neurocranium, is a major unique, derived character ofanatomically modern Homo sapiens, andthat this reduction is largely a consequenceof reduced anterior sphenoid length (ASL).Lieberman’s conclusions were based oncomparisons of a small sample of archaicHomo crania with those of Holocene andPleistocene anatomically modern H.sapiens. We have made new measurementsof ASL and MFP, and find that ASL wasincorrectly estimated in those archaic fossilcrania in which these landmarks are unam-biguously preserved. It turns out that theanterior sphenoid in modern humans is noshorter than in archaic Homo.
The new measurements were taken frombetter-quality radiographs and computedtomography scans2,3 and from the originalspecimens of Gibraltar 1 and Broken Hill(courtesy of C. Stringer, T. Molleson and F.Zonneveld). ASL values in Holocene andPleistocene modern humans are 19.9 mm(s.d. 2.0) and 20.0 mm (s.d. 1.8), respectively1,
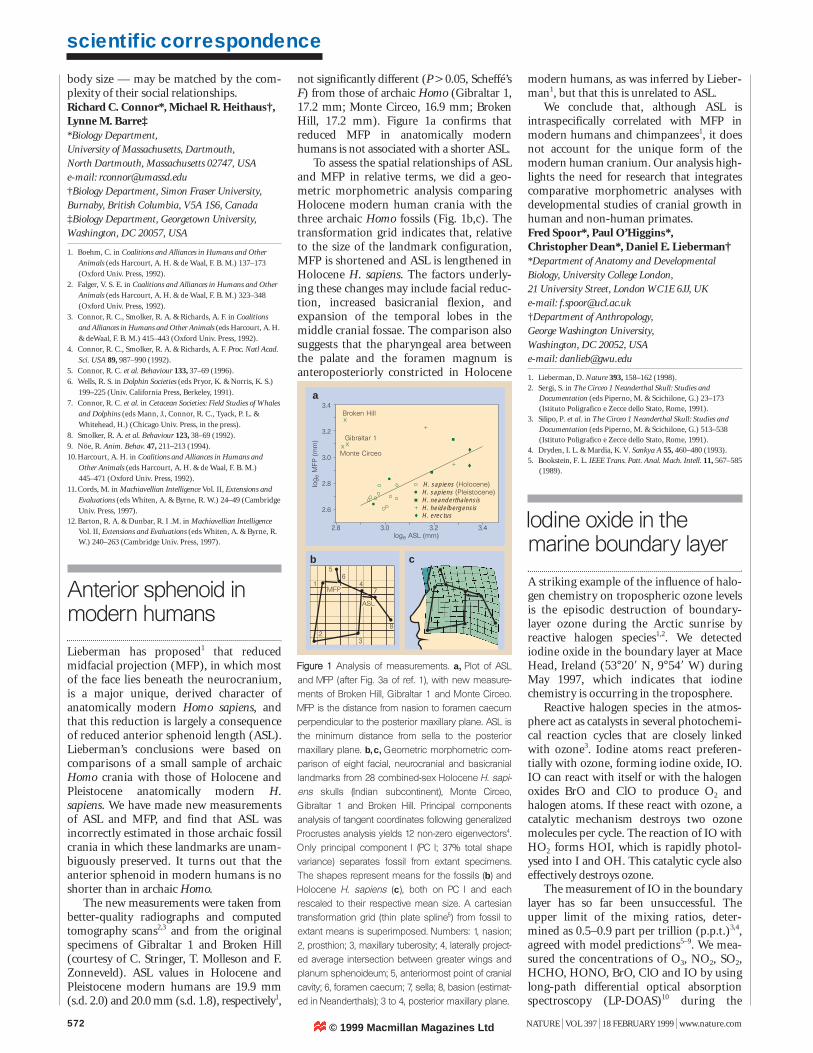
not significantly different (P¤0.05, Scheffé’sF) from those of archaic Homo (Gibraltar 1,17.2 mm; Monte Circeo, 16.9 mm; BrokenHill, 17.2 mm). Figure 1a confirms thatreduced MFP in anatomically modernhumans is not associated with a shorter ASL.
To assess the spatial relationships of ASLand MFP in relative terms, we did a geo-metric morphometric analysis comparingHolocene modern human crania with thethree archaic Homo fossils (Fig. 1b,c). Thetransformation grid indicates that, relativeto the size of the landmark configuration,MFP is shortened and ASL is lengthened inHolocene H. sapiens. The factors underly-ing these changes may include facial reduc-tion, increased basicranial flexion, andexpansion of the temporal lobes in the middle cranial fossae. The comparison also suggests that the pharyngeal area betweenthe palate and the foramen magnum isanteroposteriorly constricted in Holocene
2.8 3.0 3.2 3.4
3.4
3.2
3.0
2.8
2.6
x
xx
+
+
Broken Hill
Monte Circeo
Gibraltar 1
loge ASL (mm)
log e
MFP
(m
m)
a
H. sapiens (Holocene)
H. erectus H. heidelbergensis+ H. neanderthalensis H. sapiens (Pleistocene)
cb
3
1 4
5
7
28
6
MFP
ASL
FFiigguurree 11 Analysis of measurements. a, Plot of ASLand MFP (after Fig. 3a of ref. 1), with new measure-ments of Broken Hill, Gibraltar 1 and Monte Circeo.MFP is the distance from nasion to foramen caecumperpendicular to the posterior maxillary plane. ASL isthe minimum distance from sella to the posteriormaxillary plane. b, c, Geometric morphometric com-parison of eight facial, neurocranial and basicraniallandmarks from 28 combined-sex Holocene H. sapi-ens skulls (Indian subcontinent), Monte Circeo,Gibraltar 1 and Broken Hill. Principal componentsanalysis of tangent coordinates following generalizedProcrustes analysis yields 12 non-zero eigenvectors4.Only principal component I (PC I; 37% total shapevariance) separates fossil from extant specimens.The shapes represent means for the fossils (b) andHolocene H. sapiens (c), both on PC I and eachrescaled to their respective mean size. A cartesiantransformation grid (thin plate spline5) from fossil toextant means is superimposed. Numbers: 1, nasion;2, prosthion; 3, maxillary tuberosity; 4, laterally project-ed average intersection between greater wings andplanum sphenoideum; 5, anteriormost point of cranialcavity; 6, foramen caecum; 7, sella; 8, basion (estimat-ed in Neanderthals); 3 to 4, posterior maxillary plane.
modern humans, as was inferred by Lieber-man1, but that this is unrelated to ASL.
We conclude that, although ASL isintraspecifically correlated with MFP inmodern humans and chimpanzees1, it doesnot account for the unique form of themodern human cranium. Our analysis high-lights the need for research that integratescomparative morphometric analyses withdevelopmental studies of cranial growth inhuman and non-human primates.Fred Spoor*, Paul O’Higgins*, Christopher Dean*, Daniel E. Lieberman†*Department of Anatomy and DevelopmentalBiology, University College London, 21 University Street, London WC1E 6JJ, UKe-mail: [email protected]†Department of Anthropology, George Washington University, Washington, DC 20052, USAe-mail: [email protected]
1. Lieberman, D. Nature 393, 158–162 (1998).2. Sergi, S. in The Circeo 1 Neanderthal Skull: Studies and
Documentation (eds Piperno, M. & Scichilone, G.) 23–173(Istituto Poligrafico e Zecce dello Stato, Rome, 1991).
3. Silipo, P. et al. in The Circeo 1 Neanderthal Skull: Studies andDocumentation (eds Piperno, M. & Scichilone, G.) 513–538(Istituto Poligrafico e Zecce dello Stato, Rome, 1991).
4. Dryden, I. L. & Mardia, K. V. Sankya A 55, 460–480 (1993).5. Bookstein, F. L. IEEE Trans. Patt. Anal. Mach. Intell. 11, 567–585
(1989).
© 1999 Macmillan Magazines Ltd
scientific correspondence
NATURE | VOL 397 | 18 FEBRUARY 1999 | www.nature.com 573
HALOTROP/ACSOE field campaign at theatmospheric research station in Mace Headfrom 21 April to 30 May 1997. DOAS iden-tifies and quantifies trace gases by their spe-cific narrow-band (less than 5 nm) opticalabsorption structure in the open atmos-phere, separating trace gas absorptionsfrom broad-band molecule and aerosolextinction processes. A measured atmos-pheric spectrum after analysis is comparedwith a reference spectrum of IO in Fig. 1.The characteristic absorption bands of IOat 427.6 nm and 436.4 nm are both visible.
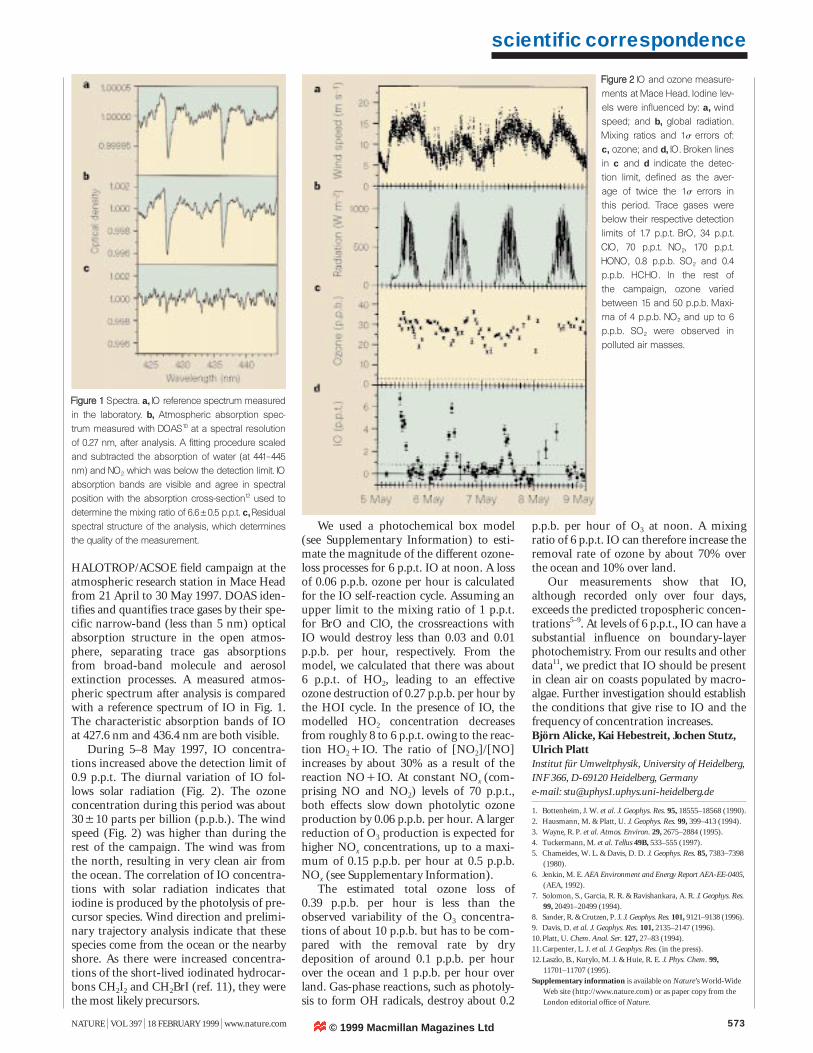
During 5–8 May 1997, IO concentra-tions increased above the detection limit of0.9 p.p.t. The diurnal variation of IO fol-lows solar radiation (Fig. 2). The ozoneconcentration during this period was about30510 parts per billion (p.p.b.). The windspeed (Fig. 2) was higher than during therest of the campaign. The wind was fromthe north, resulting in very clean air fromthe ocean. The correlation of IO concentra-tions with solar radiation indicates thatiodine is produced by the photolysis of pre-cursor species. Wind direction and prelimi-nary trajectory analysis indicate that thesespecies come from the ocean or the nearbyshore. As there were increased concentra-tions of the short-lived iodinated hydrocar-bons CH2I2 and CH2BrI (ref. 11), they werethe most likely precursors.
We used a photochemical box model(see Supplementary Information) to esti-mate the magnitude of the different ozone-loss processes for 6 p.p.t. IO at noon. A lossof 0.06 p.p.b. ozone per hour is calculatedfor the IO self-reaction cycle. Assuming anupper limit to the mixing ratio of 1 p.p.t.for BrO and ClO, the crossreactions withIO would destroy less than 0.03 and 0.01p.p.b. per hour, respectively. From themodel, we calculated that there was about6 p.p.t. of HO2, leading to an effectiveozone destruction of 0.27 p.p.b. per hour bythe HOI cycle. In the presence of IO, themodelled HO2 concentration decreasesfrom roughly 8 to 6 p.p.t. owing to the reac-tion HO2&IO. The ratio of [NO2]/[NO]increases by about 30% as a result of thereaction NO&IO. At constant NOx (com-prising NO and NO2) levels of 70 p.p.t.,both effects slow down photolytic ozoneproduction by 0.06 p.p.b. per hour. A largerreduction of O3 production is expected forhigher NOx concentrations, up to a maxi-mum of 0.15 p.p.b. per hour at 0.5 p.p.b.NOx (see Supplementary Information).
The estimated total ozone loss of0.39 p.p.b. per hour is less than theobserved variability of the O3 concentra-tions of about 10 p.p.b. but has to be com-pared with the removal rate by drydeposition of around 0.1 p.p.b. per hourover the ocean and 1 p.p.b. per hour overland. Gas-phase reactions, such as photoly-sis to form OH radicals, destroy about 0.2
FFiigguurree 22 IO and ozone measure-ments at Mace Head. Iodine lev-els were influenced by: a, windspeed; and b, global radiation.Mixing ratios and 1s errors of:c, ozone; and d, IO. Broken linesin c and d indicate the detec-tion limit, defined as the aver-age of twice the 1s errors inthis period. Trace gases werebelow their respective detectionlimits of 1.7 p.p.t. BrO, 34 p.p.t.ClO, 70 p.p.t. NO2, 170 p.p.t.HONO, 0.8 p.p.b. SO2 and 0.4p.p.b. HCHO. In the rest of the campaign, ozone variedbetween 15 and 50 p.p.b. Maxi-ma of 4 p.p.b. NO2 and up to 6p.p.b. SO2 were observed inpolluted air masses.
FFiigguurree 11 Spectra. a, IO reference spectrum measuredin the laboratory. b, Atmospheric absorption spec-trum measured with DOAS10 at a spectral resolutionof 0.27 nm, after analysis. A fitting procedure scaledand subtracted the absorption of water (at 441–445nm) and NO2 which was below the detection limit. IOabsorption bands are visible and agree in spectralposition with the absorption cross-section12 used todetermine the mixing ratio of 6.650.5 p.p.t. c, Residualspectral structure of the analysis, which determinesthe quality of the measurement.
p.p.b. per hour of O3 at noon. A mixingratio of 6 p.p.t. IO can therefore increase theremoval rate of ozone by about 70% overthe ocean and 10% over land.
Our measurements show that IO,although recorded only over four days,exceeds the predicted tropospheric concen-trations5–9. At levels of 6 p.p.t., IO can have asubstantial influence on boundary-layerphotochemistry. From our results and otherdata11, we predict that IO should be presentin clean air on coasts populated by macro-algae. Further investigation should establishthe conditions that give rise to IO and thefrequency of concentration increases.Björn Alicke, Kai Hebestreit, Jochen Stutz,Ulrich PlattInstitut für Umweltphysik, University of Heidelberg, INF 366, D-69120 Heidelberg, Germanye-mail: [email protected]
1. Bottenheim, J. W. et al. J. Geophys. Res. 95, 18555–18568 (1990).
2. Hausmann, M. & Platt, U. J. Geophys. Res. 99, 399–413 (1994).
3. Wayne, R. P. et al. Atmos. Environ. 29, 2675–2884 (1995).
4. Tuckermann, M. et al. Tellus 49B, 533–555 (1997).
5. Chameides, W. L. & Davis, D. D. J. Geophys. Res. 85, 7383–7398
(1980).
6. Jenkin, M. E. AEA Environment and Energy Report AEA-EE-0405,
(AEA, 1992).
7. Solomon, S., Garcia, R. R. & Ravishankara, A. R. J. Geophys. Res.
99, 20491–20499 (1994).
8. Sander, R. & Crutzen, P. J. J. Geophys. Res. 101, 9121–9138 (1996).
9. Davis, D. et al. J. Geophys. Res. 101, 2135–2147 (1996).
10.Platt, U. Chem. Anal. Ser. 127, 27–83 (1994).
11.Carpenter, L. J. et al. J. Geophys. Res. (in the press).
12.Laszlo, B., Kurylo, M. J. & Huie, R. E. J. Phys. Chem. 99,11701–11707 (1995).
Supplementary information is available on Nature’s World-Wide
Web site (http://www.nature.com) or as paper copy from the
London editorial office of Nature.