5.4 rayleigh number criterion for formation of a...
TRANSCRIPT

1
Rayleigh Number Criterion for Formation of A-Segregates in Steel Castings and Ingots
M. Torabi Rad1, P. Kotas2, C. Beckermann1*
1Department of Mechanical and Industrial Engineering, University of Iowa, Iowa City, IA 52242, USA
2Department of Mechanical Engineering, Technical University of Denmark, Kgs, Lyngby 2800, Denmark
ABSTRACT
A Rayleigh number based criterion is developed for predicting the formation of A-segregates in
steel castings and ingots. The criterion is calibrated using available experimental data for ingots
involving 27 different steel compositions. The critical Rayleigh number above which A-
segregates can be expected to form is found to be 17. The primary source of uncertainty in this
critical value is the dendrite arm spacing. The present Rayleigh number criterion is implemented
in a casting simulation code and used to predict A-segregates in three different shaped steel sand
castings. By comparing the predictions with observations made in the actual castings, the
Rayleigh number criterion is shown to correctly predict the regions where no A-segregates form.
However, the regions where A-segregates do form are somewhat over-predicted. Based on the
results of the three case studies, the primary reason for this over-prediction is believed to be the
presence of a central zone of equiaxed grains in the casting sections. A-segregates do not form
when the grain structure is equiaxed.
Keywords: A-segregates, Rayleigh number criterion, steel castings and ingots
* Author to whom correspondence should be addressed. Telephone: (319) 335-5681, fax: (319) 335-5669, e-mail: [email protected]

2
1. INTRODUCTION
A-segregates are narrow, pencil-like macrosegregation patterns that are often found in the
outer columnar zone of large steel ingots and castings. They contain small equiaxed grains and
are highly enriched by various solute elements such as carbon, sulfur, and phosphorus.
Sometimes, A-segregates are associated with porosity and inclusions. A-segregates diminish the
mechanical properties of the steel and should therefore be avoided. For steel ingots, they can
negatively affect subsequent rolling or forging operations. Shaped steel castings are sometimes
rejected when A-segregates are exposed during machining. A-segregates are, in principle, the
same as the freckles that are often observed in directionally solidified castings (e.g., turbine
blades).
A-segregates are initiated by convective instabilities in the high liquid fraction region of the
semi-solid mush, near the primary columnar dendrite tips [1]. In solidification of steel, most of the
light alloying elements (like C, Si, P and S) have a partition coefficient less than unity, implying
less solubility in the solid than in the liquid. Therefore, during solidification, these elements will
be rejected into the melt. The rejection of the light elements causes the density of the liquid to
decrease. Under certain conditions, the density decrease is large enough that the induced
buoyancy forces overcome the frictional retarding forces in the semi-solid mushy zone and
convection cells form. Since the mass diffusivity of the liquid is much lower than its heat
diffusivity, the segregated light liquid keeps its composition as it flows to the upper regions of
the mushy zone where the temperature is higher. In these regions, the segregated melt causes
delayed growth or even localized remelting of the solid, which leads to an increase in the local
permeability of the mush. The local increase in the permeability allows the segregated liquid to
flow more easily, which in turn delays solidification or enhances remelting further, until open
channels form that are completely free of solid. The channels are no larger than a few
millimeters in diameter and are fed by melt flow from the surrounding mush. The channels emit
highly segregated liquid into the central, still fully liquid, portion of a casting. The strong flow
inside of the channels can separate solid fragments from the dendrites surrounding the channels.
If the fragments remain in the channels, they will eventually grow into the equiaxed grains that
are associated with A-segregates. If the fragments are ejected into the central liquid region and
survive, they are a potent source of grains for the central equiaxed zone in castings.

3
The formation of A-segregates depends on a complicated interplay of numerous factors,
including the thermal gradient, G , the speed of the isotherms, R , the structure and permeability
of the semi-solid mush as dictated by the solid fraction and the dendrite arm spacings, and the
variation of the liquid density in the mush as a function of the alloy composition and the
segregation behavior of the various solute elements. Various criteria for the prediction and
control of A-segregates or freckles can be found in the literature. Copley et. al. [2] proposed a
criterion for freckle formation that is based on a critical cooling rate, T G R= × . Their
experiments showed that A-segregates will form if the cooling rate is below a critical value.
Pollock and Murphy [3] suggested that, for Ni-based superalloys, freckles will form if the value
of 1/2 1/4G R is less than a critical value. For steel ingots, Suzuki and Miyamoto [4] suggested a
criterion which is based on the value of 2.1R G . When 2.1R G drops below a certain critical value,
A-segregates are expected to form. Yamada et al. [5] found that the critical value of 2.1R G
depends strongly on the steel composition.
Since the formation of A-segregates and freckles is due to the competing effects of driving
buoyancy forces and retarding frictional forces, the Rayleigh number is an appropriate
dimensionless parameter to describe this convective instability [6-11]. The exact definition of the
mushy zone Rayleigh number that is used in the analysis of alloy solidification is provided
below. If the Rayleigh number exceeds a certain critical value, A-segregates or freckles can be
expected to form. As opposed to the above purely thermal criteria, a Rayleigh number criterion
can be expected to be more generally valid. The same value of the critical Rayleigh number can
in principle be used for different compositions in the same alloy class (e.g., for different steel
compositions), because the Rayleigh number contains the liquid density inversion and certain
thermophysical properties. Furthermore, the Rayleigh number contains the permeability of the
mush and, hence, accounts for the structure of the columnar dendrites and the variation of the
solid fraction. Nonetheless, it cannot be expected that the same value of the critical Rayleigh
number is valid for any alloy and any casting system. This is because the Rayleigh number is not
the only dimensionless parameter that governs convective instabilities during solidification [11].
A-segregate or freckle formation depends on numerous other characteristics of a solidification
system, such as the geometry of the domain and the orientation of the thermal gradient or
solidification front with respect to gravity.

4
Early examples where experimental results for freckle formation have been interpreted in
terms of a Rayleigh number can be found in several studies [12-14]. Beckermann et al. [15]
developed a Rayleigh number based freckle predictor for directionally solidified nickel-based
superalloy castings. Yang et al. [16] compared different versions of the Rayleigh number for
freckle analysis. Ramirez and Beckermann [17] compared critical Rayleigh numbers for freckle
formation in Pb-Sn alloys and nickel-based superalloys. Tewari and Tiwari [18] identified a
mushy zone Rayleigh number that takes into account the role of dendrite side branching. Very
recently, Yuan and Lee [19] applied a microstructural simulation model to predict the critical
Rayleigh number for Pb-Sn alloys.
The objective of the present study is to develop a Rayleigh number criterion for predicting
the formation of A-segregates in steel castings and ingots. This is accomplished using the
experimental data of Suzuki and Miyamoto [4] and Yamada et al. [5] for A-segregates in steel
ingots. The present Rayleigh number criterion is then implemented in a standard casting
simulation code. Case studies are performed where the predictions from the Rayleigh number
criterion are compared to observations of A-segregates in three different shaped steel sand
castings.
2. CRITERIA FOR THE FORMATION OF A-SEGREGATES 2.1 Suzuki Criterion
The experimental studies conducted by Suzuki and Miyamoto [4] and Yamada et al. [5] show
that the formation of A-segregates in steel ingots can be predicted by the following relationship: [4, 5]
1.1R T S= (1)
where R is the solidification (or isotherm) speed in µms-1, T is the cooling rate in Ks-1, and S is
termed here the Suzuki number in Ks-1(µms-1)1.1. The thermal parameters are evaluated at a
temperature of 15 K below the liquidus temperature, which for steel corresponds to a solid
fraction of about 0.3. In the original studies [4, 5], the units used for R , T , and S are mm/min,
Kmin-1, and Kmin-1(mm/min)1.1, respectively; the unit conversion factor to convert S from
Kmin-1(mm/min)1.1 to Ks-1(µms-1)1.1 is 0.37. The solidification speed and the cooling rate are
related to the temperature gradient by G T R= . As illustrated in Fig.1, A-segregates are

5
initiated when the value of 1.1R T is less than a certain critical value of the Suzuki number.
Conversely, no A-segregates are predicted to form when the value of 1.1R T is greater than the
critical Suzuki number. Suzuki and Miyamoto [4] found that for 0.7 wt% carbon steel (for the
exact composition, see case 1 in Table 1), the value of the critical Suzuki number is 3.2S = Ks-
1(µms-1)1.1. Table 1 also includes the values of the critical Suzuki number for 26 other steel
compositions. These values were extracted from Figs. 3, 8 and 9 in Yamada et al. [5]. The data in
the table show that the critical Suzuki number depends strongly on the steel composition. This
data is used in the present study to establish a Rayleigh number criterion for the prediction of A-
segregates. As opposed to the Suzuki criterion, the Rayleigh number criterion is expected to
result in a single critical value for all steel compositions.
2.2 Rayleigh Number Criterion
Various definitions of the Rayleigh number for predicting freckles and A-segregates in metal
alloy solidification have been reported in the literature [16, 17]. The major difference between
these definitions lies in a characteristic length scale ( L ) used in the definition. In this study,
following Ramirez and Beckermann [17], L Rα= is used as the characteristic length scale,
where α is the thermal diffusivity. Then, the Rayleigh number is given by [17]
0 0RagKL gK
R
ρ ρρ ραυ υ
∆ ∆
= = (2)
where υ is the kinematic viscosity of the liquid steel, g (= 9.81 ms-2) is the acceleration due to
gravity, ( )0 0 0ρ ρ ρ ρ ρ∆ = − is the relative liquid density inversion over some initial portion of
the mush, and K is the mean permeability of the initial portion of the mush. Freckles or A-
segregates are predicted to form when the Rayleigh number exceeds a certain critical value. The
reason why the same critical Rayleigh number is obtained for different alloy compositions is that
both the liquid density inversion and the mean permeability vary with alloy composition.
In the present study, the Rayleigh number is evaluated over the first 30% of the mush. In
other words, the liquid density inversion is evaluated as the difference between the density at the
liquidus temperature, 0ρ , and the density, ρ , at a solid fraction of 0.3sg = . The mean
permeability, K , is evaluated at a mean solid fraction of 0.5 0.15s sg g≈ × = . While this choice

6
is relatively arbitrary, it reflects the fact that A-segregates initiate near the columnar dendrite
tips. Using a different value for the solid fraction results in a different value of the Rayleigh
number, but as long as a consistent evaluation method is used, a unique value of the critical
Rayleigh number should result. Note that the choice of 0.3sg = is consistent with the method
used by Suzuki and Miyamoto [4] and Yamada et al. [5] for evaluating the Suzuki number.
The mean permeability, K , is obtained using the Blake-Kozeny equation [20]
( )3
0 2
1 s
s
gK K
g−
= (3)
where the reference permeability, 0K , corresponds to the permeability at a solid fraction of 0.43.
Different methods have been used in the literature to evaluate the reference permeability as a
function of the dendrite arm spacings. Schneider et al. [21] expressed the reference permeability
as a function of the primary dendrite arm spacing, 1λ , as
4 20 16 10K λ−= × (4)
Another common method is to calculate the reference permeability as a function of the secondary
dendrite arm spacing, 2λ , from: [20]
2
20 180
K λ= (5)
It should be emphasized that the two relations give the same reference permeability if 1 2 3λ λ ≈ .
This value for the ratio of the dendrite arm spacings is not unrealistic. In fact, Cicutti and Boeri [22] reported that in fully solidified continuously cast steel, 1 2 2 to 3λ λ ≈ . Experimental and
theoretical analyses of Imagumbai [23, 24] show that 1 2 2λ λ ≈ . For the prediction of A-
segregates, it is preferable to use equation (4) involving the primary dendrite arm spacing,
because during columnar dendritic solidification, the primary dendrite arm spacing is
approximately constant, whereas the secondary dendrite arm spacing increases strongly with
distance from the primary tips due to coarsening [20]. Moreover, for steel, no proven relations are
available for this variation; all available secondary dendrite arm spacing relations are for the final
spacing in the solidified steel, which has little relevance when trying to evaluate the permeability
near the primary dendrite tips. Hence, equation (4) is used in the present study. The dendrite arm

7
spacings are generally a function of the cooling rate, the alloy composition, and other variables.
Specific relations for evaluating the arm spacings in steel are provided in Section 3.2.
The thermophysical properties in the expression for the Rayleigh number are evaluated in the
present study using the software JMatPro [25]. The values obtained for the liquid density
inversion, ρ∆ , are discussed in Section 3.1. For all steel compositions in Table 1, the kinematic
viscosity and reference density are taken as 78 10υ −= × m2s-1 and 0 7002ρ = kgm-3, respectively.
2.3 Relation between Suzuki and Rayleigh Number Criteria
For a given composition, the Rayleigh number can be expressed solely as a function of the
thermal parameters T and R . This can be accomplished by assuming that the dendrite arm
spacing can be evaluated as a function of the cooling rate from a relation of the form mTλ
.
Such a relation, with 1 3m ≈ − , is generally accepted for the final secondary dendrite arm
spacing in a solidified casting [20, 26], but Taha et al. [27], Jacobi and Schwerdtfeger [28] and
Flemings et al. [29] have shown that for steels the same relation, with m close to 1 2− is also
valid for the primary dendrite arm spacing. Substitution into equation (2) gives
2
1 2Ram
mT R TR
−=
(6)
Hence, for a given critical value of the Rayleigh number and a given composition, the Rayleigh
number criterion can be written as
( 1/2 ) constantmR T− = (7)
which is in the same form as the Suzuki criterion. In fact, the two criteria have the same
dependence on the thermal parameters if ( )1 2 1.1 0.45m = − × = − . Given the above discussion
of dendrite arm spacing relations, this value for m is realistic. In conclusion, the Suzuki and
Rayleigh number criteria have essentially the same dependence on the thermal parameters.
3. EVALUATION OF THE RAYLEIGH NUMBERS IN THE EXPERIMENTS OF SUZUKI AND MIYAMOTO [4] AND YAMADA ET AL. [5]
3.1 Density Inversion

8
The liquid density inversions obtained from JMatPro for the 27 steels in Table 1 are listed in
Table 2. Table 2 also provides the primary solid phase that forms in these steels up to 0.3sg = .
The liquid density inversion depends strongly on the solidification mode, because ferrite (δ ) and
austenite (γ ) have different partition coefficients for the various elements present. As expected,
the low-carbon steels in Table 1 generally have ferrite as the primary solid phase, whereas the
high-carbon steels start to solidify as austenite. However, for the five low-carbon steels in Table
1 where the Ni content is greater than 3 wt% (Cases 6, 10, 11, 19, 20), the primary solid phase is
predicted to be austenite.
The critical Suzuki numbers (last column in Table 1) are plotted as a function of the liquid
density inversion (third column in Table 2) in Fig. 2. The overall trend in this figure is that the
critical Suzuki number increases with increasing density inversion. Hence, the tendency for
forming A-segregates generally increases with increasing density inversion. However, the critical
Suzuki number is not a unique function of the density inversion. At a given density inversion, the
critical Suzuki number can vary by as much as a factor of 10. This indicates that the formation of
A-segregates is not only governed by the liquid density inversion, but also by other factors such
as the permeability. Nonetheless, some interesting observations can be made. High-carbon steels
(solid circles) have generally a higher ρ∆ than low-carbon steels, implying that they have a
higher tendency for forming A-segregates. Increasing the contents of Si and Ti also increases
ρ∆ , whereas increasing the contents of Mo decreases ρ∆ .
3.2 Primary Dendrite Arm Spacing In the course of the present study, numerous relations for the primary dendrite arm spacing in
steel were examined [26-32]. Unfortunately, none of the available relations are valid for the entire
range of steel compositions in Table 1. It is not even clear from the literature, how the primary
dendrite arm spacing depends on the primary solidification phase (ferrite or austenite).
Therefore, a decision was made to calculate the final secondary dendrite arm spacing from
correlations available in the literature, and then determine the primary dendrite arm spacing
based on the relation of Imagumbai [23, 24] , i.e.,
1 22λ λ= (8)

9
Clearly, this procedure is only approximate, but in view of the discussion in Section 2.2, it can be
expected to provide reasonable estimates of the reference permeability. One should also keep in
mind that the absolute value of the critical Rayleigh number is not significant; it is more
important that a unique value for the critical Rayleigh number results for all 27 steels in Table 1.
Hence, the use of factor 2 (instead of, say 3) in equation (8) should not distract.
In order to illustrate the importance of the choice of the dendrite arm spacing correlation, two
different relations for steel are examined in the present study. The first one is by Ogino et al. (as
published in Miettinen et al. [33])
Mn Cr Mo Ni( 0.281 0.175 0.063 0.136 0.091 )0.332,O 123 CC C C C CT eλ − + − − −−= (9)
and the second one is by Won and Thomas,[34]
0.4935
2,WT (0.5501 1.996C )0.3616
(169.1 720.9 ) for 0 < < 0.15143.9 for 0.15C
C C
C C
C T CT C C
λ−
−−
− ×=
× >
(10)
where iC is the concentration of solute i in wt%, T is in Ks-1, and the resulting arm spacing is in
µm. It should be noted that in these correlations, the exponent on the cooling rate varies from
1 3m = − to 1 2m ≈ − , which is in accordance with the discussion in Section 2.3. Also note that
all steels in Table 1 have a carbon content greater than 0.15.
The above relations for evaluating the dendrite arm spacings require the knowledge of the
cooling rate. Unfortunately, the cooling rates could not be extracted from the original papers by
Suzuki and Miyamoto [4] and Yamada et al. [5] To circumvent this problem, a procedure was
adopted where the unknown cooling rate is replaced by the known critical Suzuki number for
each alloy and an estimated solidification speed, R . Substituting the Suzuki number definition,
equation (1), into equation (6) gives
2 2
1 2.2Ra m m
mT S
R R +=
(11)
With 1 3m ≈ − from equations (9) and (10) (for 0.15CC > wt%), it can be seen that the
exponent on R is only about 0.25. Hence, if an estimated R is consistently used, the resulting
uncertainty in the Rayleigh number will be relatively small. For example, for a factor of 2
variation in R , the resulting variation in Ra will only be a factor of 1.19. This variation is still
significant, but provides much better results than trying to estimate the cooling rate directly. Also
10
note that for 1 2m = − , which is still realistic, the exponent on R in equation (11) is equal to -
0.1, which makes the Rayleigh number even less sensitive to R . Case 1 in Table 1 corresponds
to a small 14 kg experimental ingot. Based on Fig. 1, the solidification speed at which A-
segregates form in this experimental ingot varies from 32 to 85R = µms-1. Therefore, an
approximate solidification speed of 55R = µms-1 is adopted for evaluating the Rayleigh
number for all small experimental ingot cases in Table 1 (i.e., Case 1 and Cases 14 to 27). For
the large commercial ingots of Cases 5, 7 and 8, figures in Yamada et al .[5] reveal that the
solidification speed at which A-segregates form varies from 18 to 38R = µms-1. Hence, a value
of 28R = µms-1 is adopted for all large commercial ingot cases in Table 1 (Cases 2 to 13). Note
that, as expected, the solidification speed in the large commercial ingots is generally less than the
one in the experimental ingots.
3.3 Results for the Rayleigh Number
Table 2 provides the calculated Rayleigh numbers for the Suzuki and Miyamoto [4] and
Yamada et al. [5] experiments. The Rayleigh numbers evaluated using equation (9) are denoted
by ORa and the ones using equation (10) are denoted by WTRa . These results are plotted in Fig.
3 as a function of the critical Suzuki number. A log scale is used for the Suzuki number in order
to better separate the lower values. The following observations can be made. Using the dendrite
arm spacing relation from Ogino et al. [33] [Fig. 3(a)], the Rayleigh numbers for the cases where
ferrite is the primary solidification phase are consistently above those cases where austenite
forms first. Case 27, which is the only steel with a significant Ti content, appears to be an outlier
among the austenite cases. On the other hand, using the dendrite arm spacing relation from Won
and Thomas [34] [Fig. 3(b)] results in a much better overlap of the Rayleigh numbers for the cases
where ferrite and austenite are the primary solidification phases. While this result is encouraging,
there is still considerable scatter in the Rayleigh numbers. Now, Cases 25 and 27 appear to be
outliers. The reason for the scatter and the outliers is not entirely clear, but could easily be
attributed to uncertainties in the liquid density and dendrite arm spacing calculations. Note that
the Won and Thomas [35] relation only accounts for the carbon content, but not for the
concentrations of the other elements. In view of equation (9), it is clear that the dendrite arm
spacing is a function of the contents of all alloying elements.

11
In lieu of better dendrite arm spacing relations, it is recommended to use the one by Won and
Thomas [34], since it better collapses the Rayleigh numbers to a single value. As can be seen from
Fig. 3(b), the mean value of the Rayleigh numbers for all 27 steel compositions is equal to 17 ,
with a standard deviation of 8 . Hence, the value of the critical Rayleigh number established in
the present study for A-segregates in steel ingots is equal to 17. If in Eq. (8) for the primary
dendrite arm spacing a factor of 3 were used instead of 2, the critical Rayleigh number would be
equal to 38. It is noteworthy that, using similar procedures as in the present study, Ramirez and
Beckermann [17] found critical Rayleigh numbers of 38 to 46 for Pb-Sn alloys and 30 to 33 for
Ni-based superalloys. Certainly, the present critical value for steel is in reasonable agreement
with the ones found previously for Pb-Sn alloys and Ni-based superalloys. However, this
agreement may be fortuitous because the previous critical Rayleigh numbers are for freckles in
upward directional solidification, whereas the present one is for inclined A-segregates in ingot
solidification.
4. APPLICATION OF THE RAYLEIGH CRITERION TO PREDICT A-SEGREGATES IN STEEL CASTINGS
In this section, three case studies are presented where the Rayleigh number criterion is
applied to predict A-segregates in shaped steel sand castings. The castings are simulated using
the software package MAGMASOFT® [35]. Performing a casting simulation requires numerous
process parameters and material properties to be specified. The present case study castings are
adopted from previous investigations [36, 37, 38], and the reader is referred to these studies for the
details of the simulations. As a first approximation, filling and melt convection during
solidification are neglected. The simulations provide the values of the thermal parameters
necessary in the evaluation of the Rayleigh number. The thermal parameters are evaluated
locally, at each position in the casting, such that a map of Rayleigh numbers over the entire
casting is obtained. Details of the implementation of the Rayleigh number criterion within the
casting simulation software are provided in the next section.
4.1 Implementation of the Rayleigh number criterion in the casting simulation software The present Rayleigh number criterion, using the dendrite arm spacing relation by Won and
Thomas [34], was implemented as a user result in the casting simulation software. This requires the

12
Rayleigh number to be expressed in terms of the cooling rate and the temperature gradient, rather
than the solidification speed. Substituting equations (8) and (10) into equation (4) gives
1.1 3.9912 0.72320 49.70 10 CC
CK T C −− −= × (12)
Substituting this result into equation (3), and using 0.15sg = (see section 2.2) gives
1.1 3.999 0.72321.36 10 CCCK T C −− −= × (13)
Substituting equation (13) into the Rayleigh number definition, equation (2), and using
T R G= × yields
( )1.1 3.996WT 1.7232Ra 2.38 10 C
Cc GC
Tρ−−= × × ∆
(14)
where CC is in wt%, ρ∆ in kgm-3, G in Km-1, and T in Ks-1. The thermal parameters, G and
T , are evaluated at the average temperature between the liquidus temperature and the
temperature corresponding to 0.3sg = . The compositions of the steels used in the three case
studies are listed in Table 3. The carbon content is directly substituted into equation (14). Table 3
also provides the liquid density inversion that was obtained from JMatPro for each of the three
compositions. The liquid density inversion is also substituted into equation (14).
4.2 Case study 1 - Cubes
The first case study considers four cube castings with different riser toppings and riser neck
geometries [36]. Schematics of the castings are shown in Fig. 4. All four castings are 10 inch
cubes, with 8 inch diameter by 9.4 inch high risers at the top. The risers are surrounded by an
exothermic sleeve. In the first casting, the riser is covered with dry sand after filling. The other
three castings have an exothermic hot topping. In the first and second castings, the riser is placed
directly on the top of the cube. In the third and fourth castings, a 1 inch thick breaker core is
inserted between the cube and the riser. The inner diameter of the breaker core is 6 inches (75%
open) for the third casting and 4 inches (50% open) for the fourth casting. Details of the
simulations of these castings can be found in Carlson and Beckermann [37].
Comparisons between the A-segregates observed in the four cube castings and the predicted
Rayleigh numbers are presented in Figures 5 to 8. The figures show a vertical mid-thickness
section through the castings. On the sections of the experimental castings [Figures 5(a) to 8(a)],

13
A-segregates can be observed to form near the vertical side walls of the cubes, at approximately
mid-height (red arrows). These A-segregates extend toward the cube-riser junction. As is typical
for A-segregates, they are inclined relative to gravity. Additional A-segregates originate inside of
the risers. The predicted Rayleigh numbers are plotted in Figures 5(b) to 8(b) on a scale from 17
to 25, with 17 being the mean and 25 being one standard deviation above the critical Rayleigh
number determined in Section 3 [see Figure 3(b)]. It can be seen that the experimentally
observed A-segregates all fall into regions where the Rayleigh number is predicted to be above
the critical value of 17. Conversely, no A-segregates exist in the regions of the cubes where the
Rayleigh number is predicted to be below the critical value. This comparison instills some
confidence in the present Rayleigh number criterion. It should be kept in mind that the Rayleigh
number criterion is only intended to predict the onset of A-segregates, not their subsequent (non-
linear) evolution. In other words, the Rayleigh number contours cannot be expected to provide
the exact number and shape of the A-segregates. They only provide the regions where the
conditions are favorable for the formation of A-segregates. Furthermore, the diameter of the A-
segregates is no larger than a few millimeters. Hence, their appearance on a section of a casting
depends strongly on where the cut is made. The predicted Rayleigh number contours show a
relatively sharp transition between sub- and super-critical values. In the sub-critical regions, the
Rayleigh number is generally well below 17, while in the super-critical regions, it is typically
much above 17 (up to almost 1000). This indicates that the present uncertainty in the value of the
critical Rayleigh number (17 8± ) is not of great consequence.
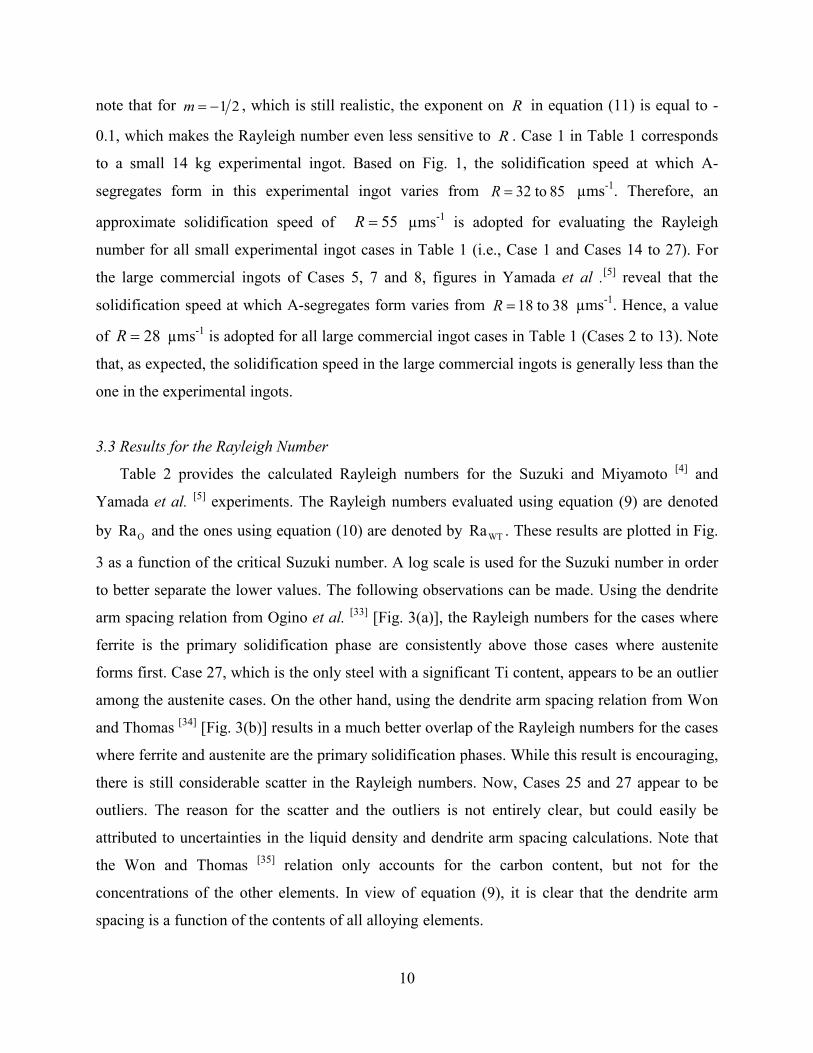
Overall, the differences in the formation of A-segregates between the four cube castings are
relatively minor. Nonetheless, with decreasing size of the opening that is formed by the breaker
core between the cube and the riser, the tendency for A-segregates to form inside of the cubes
appears to decrease. In particular for the 50% breaker core (Figure 8), the A-segregates near the
vertical side walls of the cube are much shorter and less pronounced than in the two castings
without a breaker core (Figures 5 and 6). This tendency is also predicted by the present Rayleigh
number criterion. Small isolated regions with super-critical values of the Rayleigh number are
predicted directly adjacent to the breaker core of the fourth cube casting [Figure 8(b)], and A-
segregates can indeed be observed to form in these regions [Figure 8(a)].
There are a few regions in the cube castings where the Rayleigh number is predicted to be
above the critical value, but no A-segregates are observed experimentally. An example is given

14
by the relatively small super-critical region that is predicted for all four cubes in the center near
the bottom of the castings. There can be multiple reasons for this discrepancy. One possibility is
that the center bottom portion of the cubes has an equiaxed grain structure, rather than a
columnar one. A-segregates cannot form in central equiaxed zones of castings. Another reason
could be that at the bottom of the castings, the super-critical zone is not of sufficient height to
support the melt convection patterns that are needed to sustain A-segregates. This was already
noted by Schneider et al. [20] in their study of freckle formation in Ni-based superalloy castings.
Therefore, the Rayleigh number criterion is more suitable for predicting regions in a casting
where A-segregates do not form, rather than where they do form.
4.3 Case study 2 - Forging Ram
The second case study involves the steel forging ram casting shown in Fig. 9. This case study
is adopted from Kotas and Happel [38], where all details of the simulation settings are provided.
The forging ram casting is more than 5.3 m tall and 2.3 m in diameter. The lower portion of the
outer wall of the forging ram is chilled. The casting is fed using a single top riser. Figure 10(a)
shows that there are numerous A-segregates emanating near the vertical sidewalls in the bottom
portion of the forging ram casting (red arrows). These A-segregates continue almost vertically
along the sidewalls toward the upper portion of the casting (not shown). In addition, the center
portion of the casting contains several V-segregates and porosity. The predicted Rayleigh
number contours are shown in Fig. 10(b). There are large regions parallel to the vertical
sidewalls where the Rayleigh number is predicted to be above the critical value. These regions
correspond reasonably well with the areas in the casting where A-segregates are observed.
However, the supercritical regions next to the sidewalls extend much further to the bottom and
center of the casting than the areas where A-segregates are observed [see Fig. 10(a)]. There is
also an isolated large region with super-critical Rayleigh numbers predicted at the very bottom of
the casting. Again, no A-segregates are present there. These discrepancies can be directly
attributed to the fact that the central bottom portion of the casting has an equiaxed grain
structure. The grain structure in the bottom portion of the forging ram casting is shown in Fig.
10(c). As mentioned in the previous section, A-segregates do not form in central equiaxed zones
of castings. Hence, if the present Rayleigh number criterion could be combined with a simulation
of the columnar-to-equiaxed transition, the prediction of A-segregates could be improved.

15
Kotas and Hattel [38] applied the original Suzuki criterion to predict the A-segregates
observed in the present forging ram casting. By performing simulations with different critical
Suzuki numbers, and comparing the results with the observations in Fig. 10(a), they found that
the value of the critical Suzuki number for the forging ram casting is 0.4 Kmin-1(mm/min)1.1.
Using equations (1) and (14), together with a critical Rayleigh number of 17 and 28R = µms-1
(as discussed in section 3.2), the same value of the critical Suzuki number is obtained here.
4.4 Case study 3 - Ring
In the third case study, A-segregates are investigated for the large steel ring casting shown in
Fig. 11. The outer diameter of the ring is 7.74 m (305 inches) and the height, including the riser,
is 2.12 m (84 inches). Both the outer and inner walls of the ring are chilled. The riser extends
over the entire top surface of the ring. On the vertical section through the wall of the machined
ring in Fig. 12(a), numerous A-segregates can be observed along both the outer and the inner
walls. Note that the machining of the outer wall of the ring casting results in the A-segregates
extending all the way to the surface. At the outer wall, A-segregates are present over almost the
entire height of the ring, whereas at the inner wall the A-segregates are formed primarily in the
upper portion.
The casting was simulated using similar settings as in the previous case study. The predicted
Rayleigh number contours are shown in Fig. 12(b). Overall, the regions containing A-segregates
are predicted well. In particular, the fact that no A-segregates are observed in the lower portion
of the ring near the inner wall is also reflected by the Rayleigh number contours. The absence of
A-segregates in this region of the casting can therefore be explained by the lower thermal
gradients there. As in the previous two case studies, the regions where the Rayleigh number is
predicted to be above the critical value extend too far to the center and the bottom of the section.
No A-segregates form in the center and bottom portions of the ring wall because the grain
structure in these regions is presumably equiaxed.
5. CONCLUSIONS A Rayleigh number based criterion is developed for predicting the formation of A-segregates
in steel castings and ingots. The Rayleigh number is a function of the thermal gradient, cooling
rate, liquid density inversion, and primary dendrite arm spacing over the first 30% of the semi-

16
solid mush forming during solidification. Using experimental data from previous studies [4, 5], the
critical value of the Rayleigh number is found to be 17. Below this value, no A-segregates are
expected to form. The critical Rayleigh number is the same for any steel composition, whereas in
the original Suzuki criterion for A-segregates in ingots, the critical value varies by more than two
orders of magnitude over the range of steel compositions investigated by Suzuki and Miyamoto [4] and Yamada et al. [5]. It is shown that the Rayleigh number is quite sensitive to the relation
used for evaluating the dendrite arm spacing. Available dendrite arm spacing relations for steel
do not always take into account the primary solidification mode (ferrite or austenite) and the
effect of the various alloying elements present in the steel. In lieu of a better relation, the use of
the one by Won and Thomas [34] is recommended.
Three case studies are presented where the present Rayleigh number criterion is applied to
predict A-segregates in shaped steel sand castings. The local thermal parameters are obtained
from a standard casting simulation. By comparing the predictions with observations made in the
actual castings, the Rayleigh number criterion is shown to correctly predict the regions where no
A-segregates form. However, the regions where A-segregates do form are somewhat over-
predicted. Based on the results of the three case studies, the primary reason for this over-
prediction is believed to be the presence of a central zone of equiaxed grains in the casting
sections. A-segregates do not form when the grain structure is equiaxed.
REFERENCES 1. J.J. Moore and N.A.Shah: Int. Met. Rev., 1983, vol. 28, pp. 338-56.
2. S.M. Copley, A. F. Giamei, S. M. Johnson and M. F. Hornbecker: Metall. Trans., 1970, vol.
1, pp. 2193-2204.
3. T.M. Pollock and W.H. Murphy: Metall. Mater. Trans. A, 1996, vol. 27A, pp. 1081-1094. 4. K. Suzuki and T. Miyamoto: Trans. Iron Steel Inst. Jpn, 1978, vol. 18, pp. 80-89.
5. H. Yamada, T. Sakurai and T. Takenouchi: J. Iron Steel Inst. Jpn, vol. 75, 1989, pp. 97-104.
6. P. Nandapurkar, D.R. Poirier, J.C. Heinrich and S. Felicelli: Metall. Mater. Trans. B, 1989,
vol. 20B, pp. 711-21.
7. J.C. Heinrich, S. Felicelli, P. Nandapurkar, and D.R. Poirier: Metall. Mater. Trans. B, 1989,
vol. 20B, pp. 883-91.
8. M.G. Worster: J. Fluid Mech., 1992, vol. 237, pp. 649-69

17
9. G. Amberg and G.M. Homsy: J. Fluid Mech., 1993, vol. 252, pp. 79-98
10. D.M. Anderson and M.G. Worster: J. Fluid Mech., 1995, vol. 252, pp. 307-31
11. M.G. Worster: Annu. Rev. Fluid Mech., 1997, vol 29, pp. 91-122.
12. J.R. Sarazin and A. Hellawell: Metall. Mater. Trans. A, 1988, vol. 19A, pp. 1861-71.
13. S. Tait and C. Jaupart: J. Geophys. Res., 1992, vol. 97, pp. 6735-56.
14. M.I. Bergman, D.R. Fearn, J.Bloxham, and M.C. Shannon: Metall. Mater. Trans. A, 1997,
vol. 28A, pp. 859-66.
15. C. Beckermann, J.P. Gu, and W.J. Boettinger: Metall. Mater. Trans. A, 2000, vol. 31A, pp.
2545-57.
16. W. Yang, W. Chen, K. Chang, S. Mannan and J. deBarbadilli: Metall. Mater. Trans. A, 2001,
vol. 32A, pp. 397-405.
17. J.C. Ramirez and C. Beckermann: Metall. Mater. Trans. A, 2003, vol. 34A, pp. 1525-36.
18. S.N. Tewari and R. Tiwari: Metall. Mater. Trans. A, 2003, vol. 34A, pp. 2365-2376.
19. L. Yuan, P.D. Lee: Acta Materialia, 2012, vol. 60, pp. 4917-4926
20. J.A. Dantzig and M. Rappaz: Solidification, 1st ed., EPFL Press, Lausanne, 2009, pp. 127-32.
21. M.C. Schneider, J.P. Gu, C. Beckermann, W.J. Boettinger, and U.R. Kattner: Metall. Mater.
Trans. A, 1997, vol. 28A, pp. 1517-1531.
22. C. Cicutti and R. Boeri: Scr. Mater., 2001, vol. 45, pp. 1455-60.
23. M. Imagumbai: ISIJ Int., 1994, vol. 34, No. 11, pp. 896-905.
24. M. Imagumbai: ISIJ Int., 1994, vol. 34, No. 12, pp. 986-991.
25. N. Saunders, U.K.Z. Guo, X. Li, A. P. Miodownik and J. Ph. Schille: JOM, vol. 55, pp. 60-
65.
26. M. El-Bealy, B.G. Thomas: Metall. Mater. Trans. B, 1996, vol. 27B, pp. 689-93.
27. M.A. Taha, H. Jacobi, M. Imagumbai and K. Schwerdtfeger: Metall. Mater. Trans. A, 1982,
vol. 13A, pp. 2182-41.
28. H. Jacobi and K. Schwerdtfeger: Metall. Mater. Trans. A, 1976, vol. 7A, pp. 811-20.
29. M.C. Flemings, D.R. Poirier, R.V. Barone and H.D. Brody: J. Iron Steel Inst., 1970, vol.
208, pp. 371-81.
30. G. Wei and Z. Miao-Young: J. Iron Steel Res. Int.,2009, vol. 16, No. 1, pp. 17-21.
31. A. Suzuki and Y. Nagaoka: J. Jpn. Inst. Met., 1969, vol. 33, pp. 658-63.
32. M. Wolf: PhD Thesis, Technischen Hochschule, Lausanne, 1978.

18
33. J. Miettinen, S. Louhenkilpi, H. Kytönen and J. Laine: Math. Comp. Sim., 2010, vol. 80, pp.
1536-1550.
34. Y.M. Won and B.G. Thomas: Metall. Mater. Trans. A, 2000, vol. 32A, pp. 1755-67.
35. MAGMASOFT® v4.6, Magma GmbH, Aachen, Germany.
36. W.T. Adams Jr., and K.W. Murphy: AFS Trans., 1980, vol. 88, pp. 389-404.
37. K.D. Carlson and C. Beckermann: 64th Steel Founders Society of America Technical and
Operating Conference, Paper No. 3.2, Chicago, IL, 2010.
38. P. Kotas and J.H. Hattel: Mater. Sci. Technol., 2012, vol. 28, No. 7, pp. 872-878.

19
Cas
e St
eel T
ype
Com
posi
tion
(wt %
) S
C
Si
Mn
P S
Ni
Cr
Mo
V
Ti
(Ks-1
(µm
s-1)1.
1 )
Smal
l exp
erim
enta
l ing
ot[4
] 1
Car
bon
Stee
l 0.
69
0.47
0.
62
0.01
7 0.
014
3.
2 L
arge
com
mer
cial
ingo
ts[5
] 2
Cr -
Mo
0.88
0.
60
0.39
0.
012
0.00
08
0.19
2.
86
0.21
1.
9 3
Cr -
Mo
0.89
1.
00
0.33
0.
018
0.01
0 0.
16
2.90
0.
38
3.4
4 C
arbo
n St
eel
0.30
0.
32
0.66
0.
009
0.01
7 0.
13
0.10
0.
06
0.36
5
Mn
- Ni -
Mo
0.19
0.
30
1.35
0.
007
0.00
8 0.
76
0.06
0.
49
0.21
6
Ni -
Mo
- V
0.31
0.
35
0.55
0.
018
0.01
9 3.
12
0.09
0.
42
0.07
0.44
7
Cr -
Mo
0.29
0.
25
0.7
0.01
0 0.
012
0.29
1.
16
0.35
0.
24
8 C
r - M
o 0.
28
0.06
0.
67
0.01
0 0.
007
0.20
1.
06
0.35
0.
09
9 C
arbo
n St
eel
0.33
0.
31
0.76
0.
008
0.00
7 0.
28
0.24
0.
10
0.48
10
N
i - C
r - M
o - V
0.
25
0.05
0.
26
0.00
7 0.
012
3.66
1.
69
0.44
0.
12
0.
07
11
Ni -
Cr -
Mo
- V
0.26
0.
05
0.26
0.
005
0.01
0 3.
98
1.79
0.
45
0.12
0.05
12
C
r - M
o -V
0.
27
0.24
0.
75
0.00
3 0.
002
0.18
1.
17
1.22
0.
28
0.
14
13
Mn
- Ni -
Mo
0.22
0.
26
1.41
0.
007
0.00
7 0.
76
0.11
0.
52
0.21
Sm
all e
xper
imen
tal i
ngot
s[5]
14
Mn
- Ni -
Mo
0.19
0.
21
1.45
0.
003
0.01
1 0.
79
0.15
0.
50
0.20
15
M
n - N
i - M
o 0.
20
0.18
1.
42
0.00
3 0.
009
0.73
0.
12
0.51
0.
17
16
Mn
- Ni -
Mo
0.21
0.
05
1.50
0.
003
0.00
9 0.
75
0.07
0.
52
0.14
17
M
n - N
i - M
o 0.
31
0.05
1.
39
0.00
4 0.
014
0.76
0.
08
0.51
0.
01
18
Mn
- Ni -
Mo
0.18
0.
04
1.31
0.
003
0.01
2 0.
78
0.14
0.
52
0.01
19
N
i - C
r - M
o - V
0.
23
0.14
0.
27
0.00
6 0.
008
3.20
1.
57
0.50
0.
14
0.
14
20
Ni -
Cr -
Mo
- V
0.26
0.
05
0.33
0.
006
0.00
9 3.
20
1.63
0.
46
0.11
0.08
21
H
igh
Car
bon
0.
70
0.48
0.
62
0.01
7 0.
014
0.10
0.
14
0.04
3.
2 22
H
igh
Car
bon
0.
61
0.01
0.
62
0.00
8 0.
009
0.01
0.
03
0.01
0.
64
23
Hig
h C
arbo
n
0.67
0.
50
0.60
0.
010
0.01
2 1.
01
0.10
0.
05
1.2
24
Hig
h C
arbo
n
0.66
0.
50
0.53
0.
010
0.01
1 0.
11
1.03
0.
04
0.84
25
H
igh
Car
bon
0.
70
0.56
0.
64
0.01
0 0.
013
0.11
0.
08
1.09
0.
24
26
Hig
h C
arbo
n
0.66
0.
50
0.59
0.
010
0.01
2 0.
10
0.08
0.
04
0.47
2.1
27
Hig
h C
arbo
n
0.63
0.
59
0.63
0.
009
0.01
1 0.
11
0.09
0.
04
0.
65
1.2
Tabl
e 1.
Crit
ical
Suz
uki v
alue
s for
form
atio
n of
A-s
egre
gate
s in
stee
l ing
ots m
easu
red
by S
uzuk
i and
Miy
amot
o [4]
and
Yam
ada
et. a
l. [5] .

20
Table 2. Liquid density inversion, primary solid phase, and calculated Rayleigh numbers for the 27 steels in Table 1.
Case Primary solid ρ∆ (kgm-3) ORa WTRa
1 Austenite 11.0 2.5 9.2 2 Austenite 6.77 1.3 6.8 3 Austenite 10.1 1.3 6.7 4 Ferrite 8.14 11 23 5 Ferrite 6.73 14 14 6 Austenite 9.12 5.5 23 7 Ferrite 6.13 8.8 22 8 Ferrite 3.68 10 25 9 Ferrite 5.67 6.2 15 10 Austenite 3.07 4.5 23 11 Austenite 2.37 3.8 22 12 Ferrite 2.61 4.4 13 13 Ferrite 6.08 13 16 14 Ferrite 5.77 10 11 15 Ferrite 4.53 9.3 11 16 Ferrite 3.06 7.2 8.6 17 Ferrite 4.38 12 28 18 Ferrite 3.75 11 11 19 Austenite 3.09 2.5 10 20 Austenite 2.70 3.4 17 21 Austenite 10.8 2.3 9.0 22 Austenite 5.31 3.6 15 23 Austenite 9.50 3.3 16 24 Austenite 9.59 4.4 21 25 Austenite 6.36 5.7 34 26 Austenite 11.2 3.2 13 27 Austenite 19.8 8.6 35

21
C
ompo
sitio
n (w
t%)
C
ase
Stud
y C
Si
M
n P
S N
i C
r M
o T
i A
l N
(k
gm-3
) C
ubes
0.
36
0.
76
0.02
8 0.
02
0.04
8
7.7
Forg
ing
Ram
0.
18
0.34
1.
33
0.00
8 0.
005
0.75
0.
16
0.06
0.
023
0.03
6 0.
0069
6.
95
Rin
g 0.
3 0.
4 1.
35
0.00
35
0.00
35
7.97
Ta
ble
3. C
ompo
sitio
n an
d liq
uid
dens
ity in
vers
ion
for t
he st
eels
in th
e th
ree
case
stud
ies.

22
Figure 1. Illustration of the Suzuki criterion for the formation of A-segregates in steel ingots [4].
The critical Suzuki value of 3.2S = Ks-1(µms-1)1.1 corresponds to case 1 in Table 1 (0.7 wt%
carbon steel).
-2
-1.8
-1.6
-1.4
-1.2
-1
1.5 1.6 1.7 1.8 1.9 2
log
T
log R
•
No A-Segregates
A-segregates
1.13.2T R−=

23
Figure 2. Critical Suzuki number for the formation of A-segregates as a function of the liquid
density inversion. The numbers correspond to the different cases in Table 1.
0.01
0.10
1.00
10.00
2 20
Crit
ical
Suz
uki n
umbe
r, S
(Ks-1
(µm
s-1)1.
1 )
Liquid density inversion, Δρ (kgm-3)
3,21,1
2
4
27
6 9
10 11
12
14,13,7,25,5
15 16,19
17
8,18
20
23
22
26
24
30
Solid Circle: High C, Austenite Hashed Circle: Low C, Austenite Open Circle: Low C, Ferrite
8

24
Figu
re 3
. Cal
cula
ted
criti
cal R
ayle
igh
num
bers
as a
func
tion
of th
e Su
zuki
num
ber:
(a) d
endr
ite a
rm sp
acin
gs fr
om O
gino
et a
l. [3
3];
(b) d
endr
ite a
rm sp
acin
gs fr
om W
on a
nd T
hom
as [3
4].
(a)
(b)

25
Figure 4. Schematics of the cube castings of case study 1 (light purple: cube; green: riser; light
green: breaker core; light brown: riser sleeve). All dimensions are in inches.
10”
9.4”
(b) 75% breaker core
10”
9.4”
1”
(c) 50% breaker core
10”
9.4”
1”
(a) No breaker core

26
(a) (b)
Figure 5. Comparison of A-segregates (red arrows) observed in the cube casting with no breaker
core and a dry sand topping (a) with the predicted Rayleigh numbers (b) for a vertical mid-
thickness section. Photograph courtesy of K.W. Murphy [36].

27
(a) (b)
Figure 6. Comparison of A-segregates (red arrows) observed in the cube casting with no breaker
core and an exothermic hot topping (a) with the predicted Rayleigh numbers (b) for a vertical
mid-thickness section. Photograph courtesy of K.W. Murphy [36].

28
(a) (b)
Figure 7. Comparison of A-segregates (red arrows) observed in the cube casting with a 75%
breaker core (a) with the predicted Rayleigh numbers (b) for a vertical mid-thickness section.
Photograph courtesy of K.W. Murphy [36] (the numbers and holes should be ignored).
29
(a) (b)
Figure 8. Comparison of A-segregates (red arrows) observed in the cube casting with a 50%
breaker core (a) with the predicted Rayleigh numbers (b) for a vertical mid-thickness section.
Photograph courtesy of K.W. Murphy [36] (the numbers and holes should be ignored).

30
Figure 9. Three-dimensional model of the forging ram casting of case study 2. Left panel: geometry of the machined forging ram; right panel: casting with rigging (light purple: casting; light blue: chills; green: riser; dark blue: riser sleeve; brown: gating system).

31
(c)
(a) (b)
Figure 10. Comparison of A-segregates (red arrows) observed in the lower portion of the machined
forging ram (a) with the predicted Rayleigh numbers in the casting (b) for a vertical mid-thickness
section. The dashed red line in (b) indicates the outline of the machined forging ram. The grain
structure in the lower part of the casting is shown in (c). Photographs courtesy of Vitkovice Heavy
Machinery a.s.

32
Figure 11. Three-dimensional model of the steel ring casting of case study 3 (light purple: casting; light blue: chills; green: riser; brown: gating system). The outer diameter of the ring is 7.74 m (305 inches).

33
Figure 12. Comparison of A-segregates observed in the wall of the machined steel ring (a) with
the predicted Rayleigh numbers in the casting (b). The dashed black line in (b) indicates the
outline of the machined steel ring wall. Photographs courtesy of Vitkovice Heavy Machinery a.s.
(a) (b)