53 - mathematical sciences research institutelibrary.msri.org/books/book53/files/18wilson.pdf ·...
TRANSCRIPT

Assessing Mathematical ProficiencyMSRI PublicationsVolume53, 2007
Chapter 18Assessment to Improve Learning in
Mathematics:The BEAR Assessment SystemMARK WILSON AND CLAUS CARSTENSEN
Introduction
The Berkeley Evaluation and Assessment Research (BEAR) Center has forthe last several years been involved in the development of anassessment sys-tem, which we call the BEAR Assessment System. The system consists of fourprinciples, each associated with a practical “building block” [Wilson 2005] aswell as an activity that helps integrate the four parts together (see the sectionstarting on p. 325). Its original deployment was as a curriculum-embedded sys-tem in science [Wilson et al. 2000], but it has clear and logical extensions toother contexts such as in higher education [Wilson and Scalise 2006], in large-scale assessment [Wilson 2005]; and in disciplinary areas,such as chemistry[Claesgens et al. 2002], and the focus of this chapter, mathematics.
In this paper, the four principles of the BEAR Assessment System are dis-cussed, and their application to large-scale assessment isdescribed using an ex-ample based on a German assessment of mathematical literacyused in conjunc-tion with the Program for the International Student Assessment [PISA 2005a];see also Chapter 7, this volume). The BEAR Assessment Systemis based on aconception of a tight inter-relationship between classroom-level and large-scaleassessment [Wilson 2004a; Wilson and Draney 2004]. Hence, in the process ofdiscussing this large-scale application, some arguments and examples will bedirected towards classroom-level applications, or, more accurately, towards thecommon framework that binds the two together [Wilson 2004b].
311
312 MARK WILSON AND CLAUS CARSTENSEN
The Assessment Triangle and the BEAR Approach
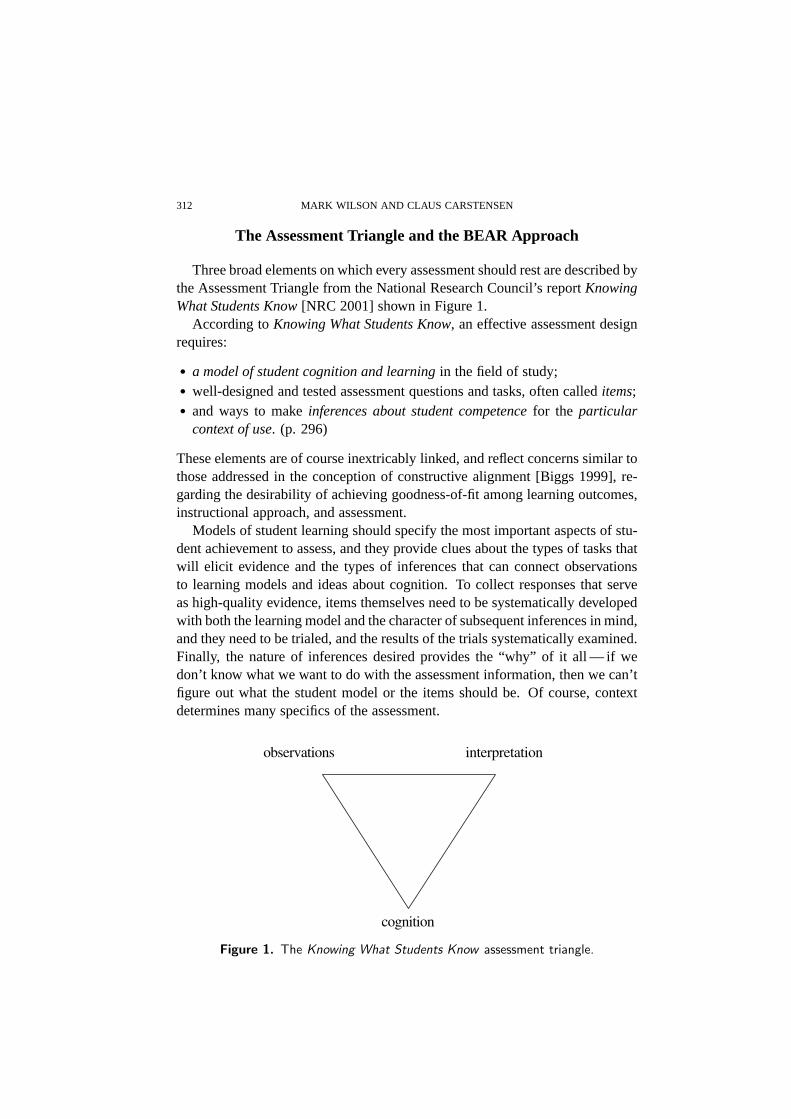
Three broad elements on which every assessment should rest are described bythe Assessment Triangle from the National Research Council’s reportKnowingWhat Students Know[NRC 2001] shown in Figure 1.
According toKnowing What Students Know, an effective assessment designrequires:
� a model of student cognition and learningin the field of study;� well-designed and tested assessment questions and tasks, often calleditems;� and ways to makeinferences about student competencefor the particular
context of use. (p. 296)
These elements are of course inextricably linked, and reflect concerns similar tothose addressed in the conception of constructive alignment [Biggs 1999], re-garding the desirability of achieving goodness-of-fit among learning outcomes,instructional approach, and assessment.
Models of student learning should specify the most important aspects of stu-dent achievement to assess, and they provide clues about thetypes of tasks thatwill elicit evidence and the types of inferences that can connect observationsto learning models and ideas about cognition. To collect responses that serveas high-quality evidence, items themselves need to be systematically developedwith both the learning model and the character of subsequentinferences in mind,and they need to be trialed, and the results of the trials systematically examined.Finally, the nature of inferences desired provides the “why” of it all — if wedon’t know what we want to do with the assessment information, then we can’tfigure out what the student model or the items should be. Of course, contextdetermines many specifics of the assessment.
observations interpretation
cognition
Figure 1. The Knowing What Students Know assessment triangle.

18. THE BEAR ASSESSMENT SYSTEM 313
III. Management by teachers IV. High-quality evidence
II. Match between instruction and assessment
I. Developmental perspective
Figure 2. The principles of the BEAR assessment system.
The BEAR Assessment System is based on the idea that good assessmentaddresses these considerations through four principles: (1) a developmentalperspective, (2) a match between instruction and assessment, (3) the generatingof high-quality evidence, and (4) management by instructors to allow appropri-ate feedback, feed-forward, and follow-up. Connections between these princi-ples and the assessment triangle are illustrated in Figure 2. See [Wilson 2005]for a detailed account of an instrument development processbased on theseprinciples. Next, we discuss each of these principles and their implementation.
Principle 1: Developmental Perspective
A “developmental perspective” regarding student learningmeans assessingthe development of student understanding of particular concepts and skills overtime, as opposed to, for instance, making a single measurement at some final orsupposedly significant time point. Criteria for developmental perspectives havebeen challenging goals for educators for many years. What toassess and howto assess it, whether to focus on generalized learning goalsor domain-specificknowledge, and the implications of a variety of teaching andlearning theoriesall impact what approaches might best inform developmentalassessment. FromBruner’s nine tenets of hermeneutic learning [Bruner 1996]to considerations ofempirical, constructivist, and sociocultural schools of thought [Olson and Tor-rance 1996] to the recent National Research Council reportHow People Learn[NRC 2000], broad sweeps of what might be considered in a developmental
314 MARK WILSON AND CLAUS CARSTENSEN
perspective have been posited and discussed. Cognitive taxonomies such asBloom’s Taxonomy of Educational Objectives [1956], Haladyna’s CognitiveOperations Dimensions [1994] and the Structure of the Observed Learning Out-come (SOLO) Taxonomy [Biggs and Collis 1982] are among many attemptsto concretely identify generalizable frameworks. One issue is that as learningsituations vary, and their goals and philosophical underpinnings take differentforms, a “one-size-fits-all” development assessment approach rarely satisfiescourse needs. Much of the strength of the BEAR Assessment System comes inproviding tools to model many different kinds of learning theories and learningdomains. What is to be measured and how it is to be valued in each BEARassessment application is drawn from the expertise and learning theories of theteachers and/or curriculum developers involved in the developmental process.
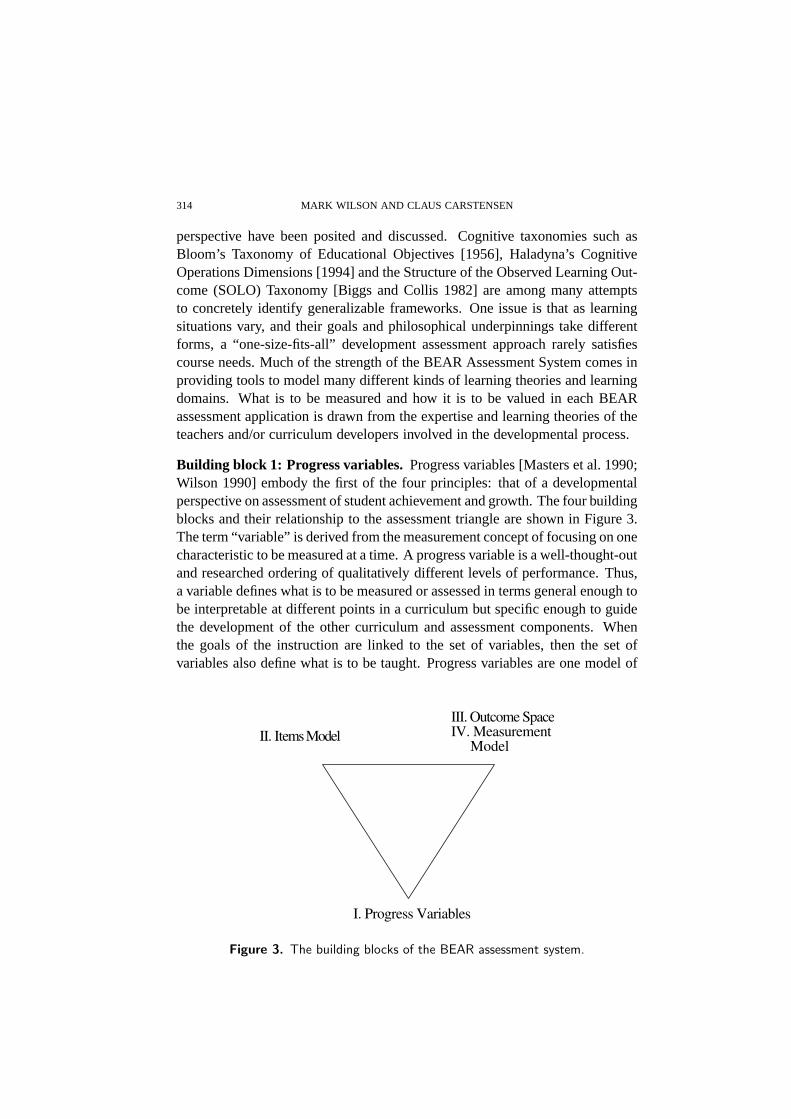
Building block 1: Progress variables. Progress variables [Masters et al. 1990;Wilson 1990] embody the first of the four principles: that of adevelopmentalperspective on assessment of student achievement and growth. The four buildingblocks and their relationship to the assessment triangle are shown in Figure 3.The term “variable” is derived from the measurement conceptof focusing on onecharacteristic to be measured at a time. A progress variableis a well-thought-outand researched ordering of qualitatively different levelsof performance. Thus,a variable defines what is to be measured or assessed in terms general enough tobe interpretable at different points in a curriculum but specific enough to guidethe development of the other curriculum and assessment components. Whenthe goals of the instruction are linked to the set of variables, then the set ofvariables also define what is to be taught. Progress variables are one model of
III. Outcome SpaceIV. Measurement Model
II. Items Model
I. Progress Variables
Figure 3. The building blocks of the BEAR assessment system.

18. THE BEAR ASSESSMENT SYSTEM 315
how assessments can be connected with instruction and accountability. Progressvariables provide a way for large-scale assessments to be linked in a principledway to what students are learning in classrooms, while remaining independentof the content of a specific curriculum.
The approach assumes that, within a given curriculum, student performanceon progress variables can be traced over the course of the year, facilitating amore developmental perspective on student learning. Assessing the growth ofstudents’ understanding of particular concepts and skillsrequires a model ofhow student learning develops over a set period of (instructional) time. A growthperspective helps one to move away from “one-shot” testing situations, and awayfrom cross-sectional approaches to defining student performance, toward an ap-proach that focuses on the process of learning and on an individual’s progressthrough that process. Clear definitions of what students areexpected to learn,and a theoretical framework of how that learning is expectedto unfold, as thestudent progresses through the instructional material, are necessary to establishthe construct validity of an assessment system.
Explicitly aligning the instruction and assessment addresses the issue of thecontent validity1 of the assessment system as well. Traditional testing prac-tices — in standardized tests as well as in teacher-made tests — have long beencriticized for oversampling items that assess only basic levels of knowledge ofcontent and ignore more complex levels of understanding. Relying on progressvariables to determine what skills are to be assessed means that assessmentsfocus on what is important, not what is easy to assess. Again,this reinforcesthe central instructional objectives of a course. Resnick and Resnick [1992,p. 59] have argued: “Assessments must be designed so that when teachers dothe natural thing — that is, prepare their students to perform well — they willexercise the kinds of abilities and develop the kinds of skill and knowledge thatare the real goals of educational reform.” Variables that embody the aims ofinstruction (e.g., “standards”) can guide assessment to dojust what the Resnickswere demanding. In a large-scale assessment, the notion of aprogress variablewill be more useful to the parties involved than simple number-correct scoresor standings relative to some norming population, providing the diagnostic in-formation so often requested (see also Chapters 10, 12, 14, 21 and 22 of thisvolume.)
The idea of using variables (note that, for the sake of brevity, I will refer tothese as “variables”) also offers the possibility of gaining significantefficiencyinassessment: Although each new curriculum prides itself on bringing somethingnew to the subject matter, in truth, most curricula are composed of a common
1Content validity is evidence that the content of an assessment is a good representation of the construct itis intended to cover (see [Wilson 2005, Chapter 8]).
316 MARK WILSON AND CLAUS CARSTENSEN
stock of content. And, as the influence of national and state standards increases,this will become more true, and also easier to codify. Thus, we might expectinnovative curricula to have one, or perhaps even two progress variables that donot overlap with typical curricula, but the remainder will form a fairly stable setthat will be common across many curricula.
Progress variables are derived in part from research into the underlying cog-nitive structure of the domain and in part from professionalopinion about whatconstitutes higher and lower levels of performance or competence, but are alsoinformed by empirical research into how students respond toinstruction orperform in practice [NRC 2001]. To more clearly understand what a progressvariable is, let us consider an example.
The example explored in this chapter is a test of mathematicscompetencytaken from one booklet of a German mathematics test administered to a ran-dom subsample of the German PISA sample of 15-year-old students in the2003 administration [PISA 2004]. The test was developed under the same gen-eral guidelines as the PISA mathematics test (see Chapter 7 in this volume),where Mathematical Literacy is a “described variable” (i.e., the PISA jargon forprogress variable) with several successive levels of sophistication in performingmathematical tasks [PISA 2005a; 2005b]. These levels are asfollows:
PISA Levels of Mathematical Literacy
VI. At Level VI students can conceptualize, generalize, andutilize informationbased on their investigations and modeling of complex problem situations.They can link different information sources and representations and flexiblytranslate among them. Students at this level are capable of advanced math-ematical thinking and reasoning. These students can apply their insight andunderstandings along with a mastery of symbolic and formal mathematicaloperations and relationships to develop new approaches andstrategies forattacking novel situations. Students at this level can formulate and preciselycommunicate their actions and reflections regarding their findings, interpre-tations, arguments, and the appropriateness of these to theoriginal situations.
V. At Level V students can develop and work with models for complex sit-uations, identifying constraints and specifying assumptions. They can se-lect, compare, and evaluate appropriate problem-solving strategies for deal-ing with complex problems related to these models. Studentsat this levelcan work strategically using broad, well-developed thinking and reasoningskills, appropriate linked representations, symbolic andformal characteriza-tions, and insight pertaining to these situations. They canreflect on theiractions and formulate and communicate their interpretations and reasoning.

18. THE BEAR ASSESSMENT SYSTEM 317
IV. At Level IV students can work effectively with explicit models for com-plex concrete situations that may involve constraints or call for making as-sumptions. They can select and integrate different representations, includingsymbolic, linking them directly to aspects of real-world situations. Studentsat this level can utilize well-developed skills and reason flexibly, with someinsight, in these contexts. They can construct and communicate explanationsand arguments based on their interpretations, arguments, and actions.
III. At Level III students can execute clearly described procedures, includingthose that require sequential decisions. They can select and apply simpleproblem-solving strategies. Students at this level can interpret and use rep-resentations based on different information sources and reason directly fromthem. They can develop short communications reporting their interpretations,results and reasoning.
II. At Level II students can interpret and recognize situations in contexts thatrequire no more than direct inference. They can extract relevant informationfrom a single source and make use of a single representational mode. Studentsat this level can employ basic algorithms, formulae, procedures, or conven-tions. They are capable of direct reasoning and making literal interpretationsof the results.
I. At Level I students can answer questions involving familiar contexts whereall relevant information is present and the questions are clearly defined. Theyare able to identify information and to carry out routine procedures accordingto direct instructions in explicit situations. They can perform actions that areobvious and follow immediately from the given stimuli.
The levels shown above were derived from a multistep process[PISA 2005b]as follows: (a) Mathematics curriculum experts identified possible subscales inthe domain of mathematics, (b) PISA items were mapped onto each subscale,(c) a skills audit of each item in each subscale was carried out on the basis of adetailed expert analysis, (d) field test data were analyzed to yield item locationson subscales, (e) the information from the two previous steps was combined.In this last step, the ordering of the items was linked with the descriptions ofassociated knowledge and skills, giving a hierarchy of knowledge and skillsthat defined possible values of the progress variable. This results in naturalclusters of skills, which provides a basis for understanding and describing theprogress variable. The results of this last step were also validated with laterempirical data, and by using a validation process involvingexperts. Note thatthis method of developing a progress variable is much less precise than theapproaches described in the references above (e.g., [Wilson et al. 2000; Wilsonand Scalise 2006], and will thus usually result in a progressvariable that is muchbroader in its content.

318 MARK WILSON AND CLAUS CARSTENSEN
Principle 2: Match Between Instruction and Assessment
The match between instruction and assessment in the BEAR AssessmentSystem is established and maintained through two major parts of the system:progress variables, described above, and assessment tasksor activities, describedin this section. The main motivation for the progress variables so far devel-oped is that they serve as a framework for the assessments anda method ofmaking measurement possible. However, this second principle makes clear thatthe framework for the assessments and the framework for the curriculum andinstruction must be one and the same. This is not to imply thatthe needs ofassessment must drive the curriculum, nor that the curriculum description willentirely determine the assessment, but rather that the two,assessment and in-struction, must be in step — they must both be designed to accomplish the samething, the aims of learning, whatever those aims are determined to be.
Using progress variables to structure both instruction andassessment is oneway to make sure that the two are in alignment, at least at the planning level.In order to make this alignment concrete, however, the matchmust also exist atthe level of classroom interaction and that is where the nature of the assessmenttasks becomes crucial. Assessment tasks need to reflect the range and stylesof the instructional practices in the curriculum. They musthave a place in the“rhythm” of the instruction, occurring at places where it makes instructionalsense to include them, usually where instructors need to seehow much progresstheir students have made on a specific topic. See [Minstrell 1998] for an insight-ful account of such occasions.
One good way to achieve this is to develop both the instructional materi-als and the assessment tasks at the same time — adapting good instructionalsequences to produce assessable responses and developing assessments intofull-blown instructional activities. Doing so brings the richness and vibrancyof curriculum development into assessment, and also bringsthe discipline andhard-headedness of explaining assessment data into the design of instruction.
By developing assessment tasks as part of curriculum materials, they can bemade directly relevant to instruction. Assessment can become indistinguishablefrom other instructional activities, without precluding the generation of high-quality, comparative, and defensible assessment data on individual students andclasses.
Building block 2: The items design. The items design governs the matchbetween classroom instruction and the various types of assessment. The criticalelement to ensure this in the BEAR assessment system is that each assessmenttask is matched to at least one variable.
A variety of different task types may be used in an assessmentsystem, based
18. THE BEAR ASSESSMENT SYSTEM 319
on the requirements of the particular situation. There has always been a tensionin assessment situations between the use of multiple-choice items, which areperceived to contribute to more reliable assessment, and other, alternative formsof assessment, which are perceived to contribute to the validity of a testingsituation. The BEAR Assessment System includes designs that use differentitem types to resolve this tension.
When using this assessment system within a curriculum, a particularly effec-tive mode of assessment is what we callembedded assessment. By this we meanthat opportunities to assess student progress and performance are integrated intothe instructional materials and are virtually indistinguishable from the day-to-day classroom activities. We found it useful to think of the metaphor of a streamof instructional activity and student learning, with the teacher dipping into thestream of learning from time to time to evaluate student progress and perfor-mance. In this model or metaphor, assessment becomespart of the teaching andlearning process, and we can think of it being assessment forlearning [Blacket al. 2003]. If assessment is also a learning event, then it does not take un-necessary time away from instruction,and the number of assessment tasks canbe more efficiently increased in order to improve the reliability of the results[Linn and Baker 1996]. But, for assessment to become fully and meaningfullyembedded in the teaching and learning process, the assessment must be linkedto a specific curriculum, i.e. it must be curriculum dependent, not curriculumindependent as must be the case in many high-stakes testing situations [Wolfand Reardon 1996].
In embedded assessment in classrooms, there will be a variety of differenttypes of assessment tasks, just as there is variety in the instructional tasks. Thesemay include individual and group “challenges,” data processing questions, ques-tions following student readings, and even instruction/assessment events such as“town meetings.” Such tasks may be constructed-response, requiring studentsto fully explain their responses in order to achieve a high score, or they may bemultiple choice, freeing teachers from having to laboriously hand score all ofthe student work [Briggs et al. 2006].
There are many variations in the way that progress variablescan be madeconcrete in practice, from using different assessment modes (multiple choice,performance assessment, mixed modes, etc.), to variationsin the frequency ofassessing students (once a week, once a month, etc.), to variations in the use ofembedding of assessments (all assessments embedded, some assessments in amore traditional testing format, etc.).
In large-scale testing situations, the basis on which the mix of assessmentmodes is decided may be somewhat different from that in embedded assessmentcontexts. Many large-scale tests are subject to tight constraints both in terms of

320 MARK WILSON AND CLAUS CARSTENSEN
the time available for testing, and in terms of the financial resources available forscoring. Thus, although performance assessments are valued because of theirperceived high validity, it may not be possible to collect enough informationthrough performance assessments alone to accurately estimate each examinee’sproficiency level; multiple-choice items, which require less time to answer andwhich may be scored by machine rather than by human raters, may be used toincrease the reliability of the large-scale test.
Returning to the German Mathematical Literacy example, thetest bookletcontained 64 dichotomous items; 18 of these items were selected for this ex-ample. Examples of these items are the tasks Function, Rectangle and Differ-ence, shown on the next page. Each item was constructed according to TopicAreas and the Types of Mathematical Modeling required. The Topic Areaswere: Arithmetic, Algebra, and Geometry. The Modeling Types were: Tech-nical Processing, Numerical Modeling, and Abstract Modeling. The TechnicalProcessing dimension requires students to carry out operations that have beenrehearsed such as computing numerical results using standard procedures — see,for example, the item Function. Numerical Modeling requires the students toconstruct solutions for problems with given numbers in one or more steps —see the item Rectangle. In contrast, Abstract Modeling requires students toformulate rules in a more general way, for example by giving an equation or bydescribing a general solution in some way — see the item Difference. Becausethe collection of items follows an experimental design, theresponses may alsobe considered data from a psychological experiment. The experimental designhas two factors, Topic Area and Modeling Type. In sum, the selected set of itemshas a3� 3 design with two observations of each pair of conditions, resulting in18 items in total.
Principle 3: Management by Teachers
For information from the assessment tasks and the BEAR analysis to be usefulto instructors and students, it must be couched in terms thatare directly relatedto the instructional goals associated with the progress variables. Constructedresponse tasks, if used, must be quickly, readily, and reliably scorable. Thecategories into which the scores are sorted must be readily interpreted in aneducational setting, whether it is within a classroom, by a parent, or in a policy-analysis setting. The requirement for transparency in the relationship betweenscores and actual student responses to an item leads to the third building block.

18. THE BEAR ASSESSMENT SYSTEM 321
Example tasks from the German Mathematical Literacy booklet
(Copyright German PISA Consortium)
Function (a technical processing item in algebra)
Consider the function given by the equationy D 2x�1. Fill in the missingvalues.
x �2 �1 0 3 � � �
y � � � 19
Rectangles (a numerical modeling item in algebra)
Around a small rectangle a second one is drawn. A third rectangle is drawnaround the two and so on. The distance between the sides is always 1 cm.
1 cm
1 c
m
By how much do the length, width and perimeter increase from rectangleto rectangle?
The length increases by cm. The width increases by cm.
The perimeter increases by cm.
Difference (an abstract modeling item in algebra)
Put the digits 3, 6, 1, 9, 4, 7 in the boxes so that the difference betweenthe two three-digit numbers is maximized. (Each digit may beused onlyonce.)
first number
second number
322 MARK WILSON AND CLAUS CARSTENSEN
Building block 3: The outcome space. The outcome space is the set of out-comes into which student performances are categorized for all the items as-sociated with a particular progress variable. In practice,these are presentedas scoring guides for student responses to assessment tasks. This is the pri-mary means by which the essential element of teacher professional judgmentis implemented in the BEAR Assessment System. These are supplemented by“exemplars”: examples of student work at every scoring level for every taskand variable combination, and “blueprints,” which providethe teachers with alayout showing opportune times in the curriculum to assess the students on thedifferent progress variables.
For the information from assessment opportunities to be useful to teachers,it must be couched in terms that are directly interpretable with respect to theinstructional goals associated with the progress variables. Moreover, this mustbe done in a way that is intellectually and practically efficient. Scoring guideshave been designed to meet these two criteria. A scoring guide serves as a oper-ational definition for a progress variable by describing theperformance criterianecessary to achieve each score level of the variable.
The scoring guides are meant to help make the performance criteria for theassessments clear and explicit (or “transparent and open” to use Glaser’s [1990]terms) — not only to the teachers but also to the students and parents, adminis-trators, or other “consumers” of assessment results. In fact, we strongly recom-mend to teachers that they share the scoring guides with administrators, parentsand students, as a way of helping them understand what types of cognitive per-formance were expected and to model the desired processes.
In addition, students appreciate the use of scoring guides in the classroom. Ina series of interviews with students in a Kentucky middle school that was usingthe BEAR Assessment System (reported in [Roberts and Sipusic 1999]), thestudents spontaneously expressed to us their feeling that,sometimes for the firsttime, they understood what it was that their teachers expected of them, and feltthey knew what was required to get a high score. The teachers of these studentsfound that the students were often willing to redo their workin order to merit ahigher score.
Traditional multiple-choice items are, of course, based onan implicit scor-ing guide — one option is correct, the others all incorrect. Alternative types ofmultiple-choice items can be constructed that are explicitly based on the levelsof a construct map [Briggs et al. 2006], and thus allow a stronger interpretationof the test results. For the German Mathematical Literacy example, the items areall traditional multiple choice — their development did notinvolve the explicitconstruction of an outcome space.

18. THE BEAR ASSESSMENT SYSTEM 323
Principle 4: High-Quality Evidence
Technical issues of reliability and validity, fairness, consistency, and bias canquickly sink any attempt to measure values of a progress variable as describedabove, or even to develop a reasonable framework that can be supported byevidence. To ensure comparability of results across time and context, proceduresare needed to (a) examine the coherence of information gathered using differ-ent formats, (b) map student performances onto the progressvariables, (c) de-scribe the structural elements of the accountability system — tasks and raters —in terms of the progress variables, and (d) establish uniform levels of systemfunctioning, in terms of quality control indices such as reliability. Althoughthis type of discussion can become very technical to consider, it is sufficient tokeep in mind that the traditional elements of assessment standardization, such asvalidity/reliability studies and bias/equity studies, must be carried out to satisfyquality control and ensure that evidence can be relied upon.
Building block 4: Wright maps. Wright maps represent the principle of high-quality evidence. Progress maps are graphical and empirical representations ofa progress variable, showing how it unfolds or evolves in terms of increasinglysophisticated student performances. They are derived fromempirical analysesof student data on sets of assessment tasks. Maps are based onan ordering ofthese assessment tasks from relatively easy tasks to more difficult and complexones. A key feature of these maps is that both students and tasks can be lo-cated on the same scale, giving student proficiency the possibility of substantiveinterpretation, in terms of what the student knows and can doand where thestudent is having difficulty. The maps can be used to interpret the progressof one particular student, or the pattern of achievement of groups of students,ranging from classes to nations.
Wright maps can be very useful in large-scale assessments, providing infor-mation that is not readily available through numerical score averages and othertraditional summary information — they are used extensively, for example, inreporting on the PISA assessments [PISA 2005a]. A Wright mapillustratingthe estimates for the Rasch model is shown in Figure 4. On thismap, an “X”represents a group of students, all at the same estimated achievement level. Thelogits (on the left-hand side) are the units of the Wright map— they are relatedto the probability of a student succeeding at an item, and arespecifically the logof the odds of that occurring. The symbols “T,” “N” and “A” each represent aTechnical Processing, Numerical Modeling, and Abstract Modeling item, withthe Topic Area indicated by the column headings above. Wherea student islocated near an item, this indicates that there is approximately a 50% chance ofthe student getting the item correct. Where the student is above the item, the

324 MARK WILSON AND CLAUS CARSTENSEN
logits students| Topic Areas ________________| __________________________________ 3 | X| Arithmetic Geometry Algebra Levels X| ___________________________________________ XX| XXX| XX| 2 XX| XXX| . XXX| . XXXX| | XXXX| | XXXXXXXX| A | 1 XXXXXXX| V XXXXXXX| | XXXXXXXX| A N | XXXXXXXXX| A A N - XXXXXXXX|N | XXXXXXXXXX| IV 0 XXXXXXXX|N N N - XXXXXXX| T T | XXXXXXX| T T | XXXXXXXX|A | XXXXXXXXX|A | XXXXXXXXXX| III -1 XXXXXXXX| | XXXXXXXX|T | XXXXX|T | XXXX| | XXXXX| . XXXX| . -2 XX| XX| XX| X| X| X| X| -3 |
Figure 4. A Wright map of the mathematical literacy variable.
chance is greater than 50%, and the further it is above, the greater the chance.Where the student is lower than the item, the chance is less than 50%, and thefurther it is below, the lesser the chance. Thus this map illustrates the descriptionof the Mathematical Literacy progress variable in terms of the Levels from page316 as well as the Topic Areas and the Modeling Types in the items design. TheTopic Areas reflect the earlier placement of Arithmetic in the curriculum thanGeometry and Algebra. The ordering of Modeling Types is generally consistentwith what one might expect from the definitions of the Levels,except for theArithmetic Abstract Modeling items, which seem to be somewhat easier thanexpected. This is a topic that deserves a follow-up investigation.
18. THE BEAR ASSESSMENT SYSTEM 325
We typically use a multi-dimensional Rasch modeling approach to calibratethe maps for use in the BEAR Assessment System (see [Adams et al. 1997]for the specifics of this model). These maps have at least two advantages overthe traditional method of reporting student performance astotal scores or per-centages: First, it allows teachers to interpret a student’s proficiency in termsof average or typical performance on representative assessment activities; andsecond, it takes into consideration the relative difficulties of the tasks involvedin assessing student proficiency.
Once constructed, maps can be used to record and track student progress andto illustrate the skills that students have mastered and those that the studentsare working on. By placing students’ performance on the continuum defined bythe map, teachers, administrators, and the public can interpret student progresswith respect to the standards that are inherent in the progress variables. Wrightmaps can come in many forms, and have many uses in classroom and othereducational contexts. In order to make the maps flexible and convenient enoughfor use by teachers and administrators, we have also developed software forteachers to use to generate the maps. This software, which wecall GradeMap[Kennedy et al. 2005], allows consumers to enter the scores given to the studentson assessments, and then map the performance of groups of students, either ata particular time or over a period of time.
Bringing It All Together: Performance Standard Setting
The final ingredient in the BEAR Assessment System is the means by whichthe four building blocks discussed thus far are brought together into a coherentsystem — in the case of large-scale assessment, by standard setting. We havedeveloped a standard-setting procedure, called “construct mapping” [Wilson andDraney 2002], that allows the standard-setting committee members to use theitem response map as a model of what a student at a given level knows and cando. The map is represented in a piece of software [Hoskens andWilson 1999]that allows standard-setting committee members to find out about the details ofstudent performance at any given proficiency level, and to assist them in decidingwhere the cutoffs between performance levels should be.
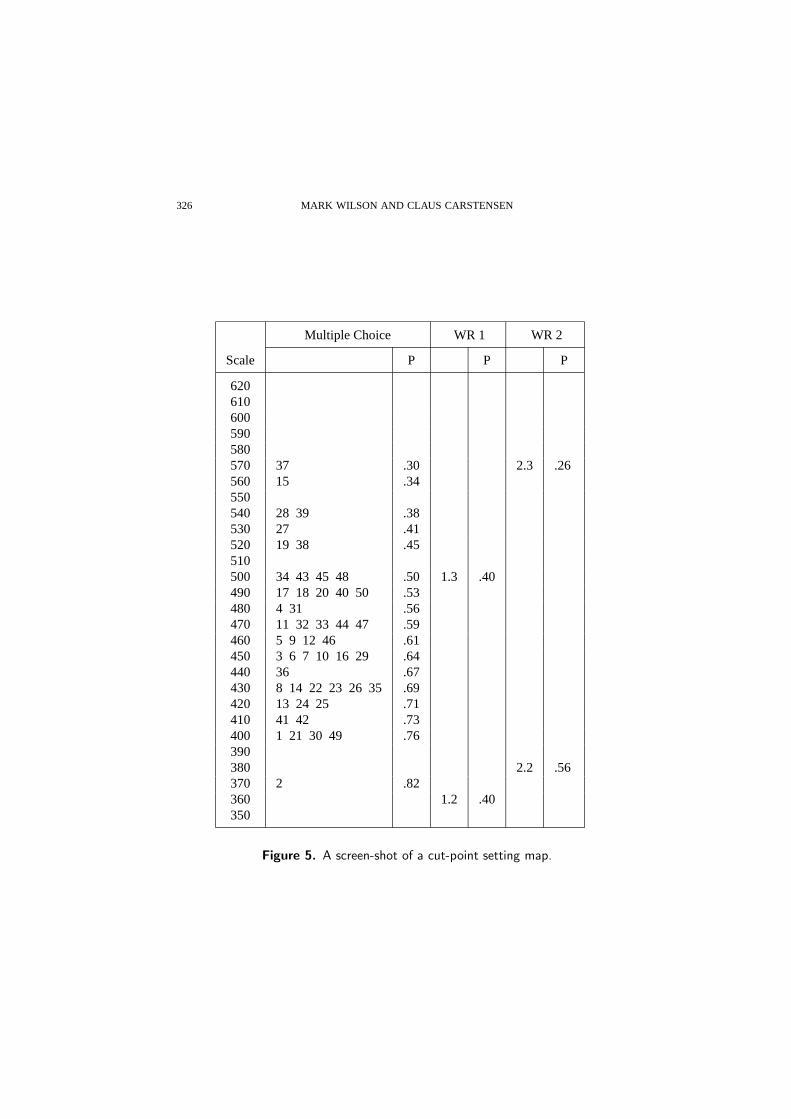
An example showing a section of such an item map is given in Figure 5.This illustration is from a somewhat more complicated example than the Ger-man Mathematical Literacy Test, involving both multiple-choice items and twoitems that required written responses (WR1 and WR2) and which were scoredinto five ordered categories [Wilson 2005]. The column on thefar left containsa numerical scale that allows the selection and examinationof a given pointon the map, and the selection of the eventual cut scores for the performancelevels. This scale is a transformation of the original logitscale, designed to
326 MARK WILSON AND CLAUS CARSTENSEN
Multiple Choice WR 1 WR 2
Scale P P P
620610600590580570 37 .30 2.3 .26560 15 .34550540 28 39 .38530 27 .41520 19 38 .45510500 34 43 45 48 .50 1.3 .40490 17 18 20 40 50 .53480 4 31 .56470 11 32 33 44 47 .59460 5 9 12 46 .61450 3 6 7 10 16 29 .64440 36 .67430 8 14 22 23 26 35 .69420 13 24 25 .71410 41 42 .73400 1 21 30 49 .76390380 2.2 .56370 2 .82360 1.2 .40350
Figure 5. A screen-shot of a cut-point setting map.

18. THE BEAR ASSESSMENT SYSTEM 327
have a mean of 500, and to range from approximately 0 to 1000. (This choice ofscale is a somewhat arbitrary, but designed to avoid negative numbers and smalldecimals, which some members of standard-setting committees find annoying.)The next two columns contain the location of the multiple-choice items (labeledby number of appearance on the examination), and the probability that a personat the selected point would get each item correct (in this case, a person at 500on the scale — represented by the shaded band across the map).The next twosets of columns display the thresholds for the two written-response items — forexample, the threshold levels for scores of 2 and 3 on written-response item 1are represented by 1.2 and 1.3, respectively (although eachitem is scored on ascale of 1 to 5 on this particular examination, only the part of the scale where aperson would be most likely to get a score of 2 or 3 on either item is shown) —and the probability that a person at 500 on the scale would score at that particularscore level on each item. The software also displays, for a person at the selectedpoint on the logit scale, the expected score total on the multiple-choice section(Figure 5 does not show this part of the display), and the expected score on eachof the written response items.
In order to set the cut points, the committee first acquaints itself with the testmaterials. The meaning of the various parts of the map is thenexplained, andthe committee members and the operators of the program spendtime with thesoftware familiarizing themselves with points on the scale.
The display of multiple-choice item locations in ascendingdifficulty, next tothe written-response thresholds, helps to characterize the scale in terms of whatincreasing proficiency “looks like” in the pool of test-takers. For example, if acommittee were considering 500 as a cut point between performance levels, itcould note that 500 is a point at which items like 34, 43, 45, and 48 are expectedto be chosen correctly about 50% of the time, a harder item like 37 is expectedto be chosen correctly about 30%, and easier items like 2 are expected to bechosen correctly 80% of the time. The set of multiple-choiceitems, sorted sothey are in order of ascending difficulty, is available to thecommittee so that themembers can relate these probabilities to their understanding of the items. Thecommittee could also note that a student at that point (i.e.,500), would be equallylikely to score a 2 or a 3 on the first written-response item (40% each) and morelikely to score a 2 than a 3 on the second (56% vs. 26%). Examples of studentwork at these levels would be available to the committee for consideration of theinterpretation of these scores. Committee members can examine the responsesof selected examinees to both the multiple-choice and written-response items,chart their locations on the map, and judge their levels.
The committee then, through a consensus-building process,sets up cut pointson this map, using the item response calibrations to allow interpretation in

328 MARK WILSON AND CLAUS CARSTENSEN
terms of predicted responses to both multiple-choice itemsand open-endedconstructed-response items. Locations of an individual student’s scores anddistributions of the scaled values of the progress variableare also available forinterpretative purposes. This procedure allows both criterion-referenced andnorm-referenced interpretations of cut scores.
Use of the maps available from the item response modeling approach notonly allows the committees to interpret cut-offs in a criterion-referenced way,it also allows maintenance of similar standards from year toyear by equatingof the item response scales. This can be readily accomplished by using linkingitems on successive tests to keep the waves of data on the samescale — hencethe cut-offs set one year can be maintained in following years.
Discussion
A central tenet of the assessment reforms of recent years (“authentic,” “per-formance,” etc.) has been the WYTIWYG principle — “What you test is whatyou get.” This principle has led the way for assessment reform at the state ordistrict level nationwide. The assumption behind this principle is that assessmentreforms will not only affect assessmentsper se, but these effects will trickledown into the curriculum and instruction that students receive in their dailywork in classrooms. Hence, when one looks to the curricula that students areexperiencing, one would expect to see such effects, and, in particular, one wouldexpect to see these effects even more strongly in the cutting-edge curricula thatcentral research agencies such as the U.S. National ScienceFoundation (NSF)sponsor. Thus it is troubling to find that this does not seem tobe the case: AnNSF review of new middle school science curricula [NSF 1997]found only onewhere the assessment itself reflected the recent developments in assessment.For that one (theIEY Assessment System— see [Wilson et al. 2000]), it wasfound that the reformed assessment did indeed seem to have the desired sortsof effects [Wilson and Sloane 2000], but for the other curricula no such effectswere possible, because the assessment reforms have not, in general, made it intothem.
We have demonstrated a way in which large-scale assessmentscan be morecarefully linked to what students are learning. The key hereis the use of progressvariables to provide a common conceptual framework across curricula. Vari-ables developed and used in the ways we have described here can mediatebetween the level of detail that is present in the content of specific curriculaand the necessarily more vague contents of standards documents. This idea of a“crosswalk between standards and assessments” has also been suggested by EvaBaker of the Center for Research on Evaluation, Standards, and Student Testing[Land 1997, p. 6]. These variables also create a “conceptualbasis” for relating
18. THE BEAR ASSESSMENT SYSTEM 329
a curriculum to standards documents, to other curricula, and to assessments thatare not specifically related to that curriculum.
With the assessments to be used across curricula structuredby progress vari-ables, the problem of item development is lessened — ideas and contexts forassessment tasks may be adapted to serve multiple curriculathat share progressvariables. The cumulative nature of the curricula is expressed through (a) theincreasing difficulty of assessments and (b) the increasingsophistication neededto gain higher scores using the assessment scoring guides. Having the sameunderlying structure makes clear to teachers, policy-makers, and parents whatis the ultimate purpose of each instructional activity and each assessment, andalso makes easier the diagnostic interpretation of studentresponses to the as-sessments.
The idea of a progress variable is not radically new — it has grown out ofthe traditional approach to test content — most tests have a “blueprint” or planthat assigns items to particular categories, and hence, justifies why certain itemsare there, and others aren’t. The concept of a progress variable goes beyondthis by looking more deeply into why we use certain assessments when we do(i.e., by linking them to growth through the curriculum), and by calibrating theassessments with empirical information.
Although the ideas inherent in components of the BEAR Assessment Systemare not unique, the combination of these particular ideas and techniques into ausable system does represent a new step in assessment development. The impli-cations for this effort for other large-scale tests, for curricula, and for assessmentreform on a broader level, need to be explored and tested through other relatedefforts. We hope our efforts and experiences will encourageincreased discussionand experimentation of the use of state of the art assessmentprocedures acrossa broad range of contexts from classroom practice to large-scale assessments.
References
[Adams et al. 1997] R. J. Adams, M. Wilson, and W.-C. Wang, “The multidimensionalrandom coefficients multinomial logit model”,Applied Psychological Measurement21:1 (1997), 1–23.
[Biggs 1999] J. B. Biggs,Teaching for quality learning at university, Buckingham:SRHE and Open University Press, 1999.
[Biggs and Collis 1982] J. B. Biggs and K. F. Collis,Evaluating the quality of learning:The SOLO taxonomy, New York: Academic Press, 1982.
[Black et al. 2003] P. Black, C. Harrison, C. Lee, B. Marshall, and D. Wiliam,Assess-ment for learning, London: Open University Press, 2003.
330 MARK WILSON AND CLAUS CARSTENSEN
[Bloom 1956] B. S. Bloom (editor),Taxonomy of educational objectives: The classifi-cation of educational goals: Handbook I, cognitive domain, New York and Toronto:Longmans, Green, 1956.
[Briggs et al. 2006] D. Briggs, A. Alonzo, C. Schwab, and M. Wilson, “Diagnos-tic assessment with ordered multiple-choice items”,Educational Assessment11:1(2006), 33–63.
[Bruner 1996] J. Bruner,The culture of education, Cambridge, MA: Harvard UniversityPress, 1996.
[Claesgens et al. 2002] J. Claesgens, K. Scalise, K. Draney,M. Wilson, and A. Stacy,“Perspectives of chemists: A framework to promote conceptual understanding ofchemistry”, paper presented at the annual meeting of the American EducationalResearch Association, New Orleans, April 2002.
[Glaser 1990] R. Glaser,Testing and assessment: O tempora! O mores!, Pittsburgh:Learning Research and Development Center, University of Pittsburgh, 1990.
[Haladyna 1994] T. M. Haladyna, “Cognitive taxonomies”, pp. 104–110 inDevelopingand validating multiple-choice test items, edited by T. M. Haladyna, Hillsdale, NJ:Lawrence Erlbaum Associates, 1994.
[Hoskens and Wilson 1999] M. Hoskens and M. Wilson,StandardMap[Computerprogram], Berkeley, CA: University of California, 1999.
[Kennedy et al. 2005] C. A. Kennedy, M. Wilson, and K. Draney,GradeMap 4.1[Computer program], Berkeley, California: Berkeley Evaluation and AssessmentCenter, University of California, 2005.
[Land 1997] R. Land, “Moving up to complex assessment systems”, Evaluation Com-ment7:1 (1997), 1–21.
[Linn and Baker 1996] R. Linn and E. Baker, “Can performance-based student as-sessments be psychometrically sound?”, pp. 84–103 inPerformance-based studentassessment: Challenges and possibilities. Ninety-fifth Yearbook of the National So-ciety for the Study of Education, edited by J. B. Baron and D. P. Wolf, Chicago:University of Chicago Press, 1996.
[Masters et al. 1990] G. N. Masters, R. A. Adams, and M. Wilson, “Charting studentprogress”, pp. 628–634 inInternational encyclopedia of education: Research andstudies, vol. 2 (Supplementary), edited by T. Husen and T. N. Postlethwaite, Oxfordand New York: Pergamon, 1990.
[Minstrell 1998] J. Minstrell, “Student thinking and related instruction: Creating afacet-based learning environment”, paper presented at themeeting of the Committeeon Foundations of Assessment, Woods Hole, MA, October 1998.
[NRC 2000] National Research Council (Committee on Developments in the Scienceof Learning, Commission on Behavioral and Social Sciences and Education),Howpeople learn: Brain, mind, experience, and school, expanded ed., edited by J. D.Bransford et al., Washington, DC: National Academy Press, 2000.

18. THE BEAR ASSESSMENT SYSTEM 331
[NRC 2001] National Research Council Committee on the Foundations of Assessment,Board on Testing and Assessment, Center for Education, Division of Behavioraland Social Sciences and Education),Knowing what students know: The science anddesign of educational assessment, edited by J. Pelligrino et al., Washington, DC:National Academy Press, 2001.
[NSF 1997] National Science Foundation,Review of instructional materials for middleschool science, Arlington, VA: Author, 1997.
[Olson and Torrance 1996] D. R. Olson and N. Torrance (editors), Handbook ofeducation and human development: New models of learning, teaching and schooling,Oxford: Blackwell, 1996.
[PISA 2004] PISA,PISA 2003: Der Bildungsstand der Jugendlichen in Deutschland:Ergebnisse des zweiten internationalen Vergleichs, Munster: Waxmann, 2004.
[PISA 2005a] Programme for International Student Assessment, “Learning for tomor-row’s world: First results from PISA 2003”, Technical report, Paris: Organisation forEconomic Co-operation and Development, 2005.
[PISA 2005b] Programme for International Student Assessment, “PISA 2003 Techni-cal Report”, Technical report, Paris: Organisation for Economic Co-operation andDevelopment, 2005.
[Resnick and Resnick 1992] L. B. Resnick and D. P. Resnick, “Assessing the thinkingcurriculum: New tools for educational reform”, pp. 37–76 inChanging assessments,edited by B. R. Gifford and M. C. O’Connor, Boston: Kluwer, 1992.
[Roberts and Sipusic 1999] L. Roberts (producer) and M. Sipusic (director), “Moder-ation in all things: A class act” [Film], available from the Berkeley Evaluation andAssessment Center, Graduate School of Education, University of California, Berke-ley, CA 94720–1670, 1999.
[Wilson 1990] M. Wilson, “Measurement of developmental levels”, pp. 628–634 inInternational encyclopedia of education: Research and studies, vol. Supplementaryvol. 2, edited by T. Husen and T. N. Postlethwaite, Oxford: Pergamon Press, 1990.
[Wilson 2004a] M. Wilson, “A perspective on current trends in assessment and account-ability: Degrees of coherence”, pp. 272–283 in [Wilson 2004b], 2004.
[Wilson 2004b] M. Wilson (editor),Towards coherence between classroom assessmentand accountability: One hundred and third yearbook of the National Society for theStudy of Education,part 2, Chicago: University of Chicago Press, 2004.
[Wilson 2005] M. Wilson,Constructing measures: An item response modeling ap-proach, Mahwah, NJ: Lawrence Erlbaum Associates, 2005.
[Wilson and Draney 2002] M. Wilson and K. Draney, “A technique for setting standardsand maintaining them over time”, pp. 325–332 inMeasurement and multivariateanalysis, edited by S. Nishisato et al., Tokyo: Springer-Verlag, 2002.
[Wilson and Draney 2004] M. Wilson and K. Draney, “Some linksbetween large-scaleand classroom assessments: The case of the BEAR Assessment System”, pp. 132–154 in [Wilson 2004b], 2004.

332 MARK WILSON AND CLAUS CARSTENSEN
[Wilson and Scalise 2006] M. Wilson and K. Scalise, “Assessment to improve learn-ing in higher education: The BEAR Assessment System”,Higher Education52:4(2006), 635–663.
[Wilson and Sloane 2000] M. Wilson and K. Sloane, “From principles to practice:An embedded assessment system”,Applied Measurement in Education13:2 (2000),181–208.
[Wilson et al. 2000] M. Wilson, L. Roberts, K. Draney, and K. Sloane,SEPUP assess-ment resources handbook, Berkeley, CA: Berkeley Evaluation and Assessment Re-search Center, University of California, 2000.
[Wolf and Reardon 1996] D. P. Wolf and S. Reardon, “Access to excellence throughnew forms of student assessment”, pp. 52–83 inPerformance-based student assess-ment: Challenges and possibilities. Ninety-fifth yearbookof the National Society forthe Study of Education, edited by J. B. Baron and D. P. Wolf, Chicago: University ofChicago Press, 1996.