5/25/16 · per aga based on eia and colorado school of mines = 2,170 tcf = almost 100 year supply...
TRANSCRIPT

© 2016 Energy Solutions Center Inc. – All Rights Reserved
Understanding the Natural Gas Industry
5/25/16
Eric Burgis, Energy Solutions Center

2 © Energy Solutions Center Inc. – All Rights Reserved
What is natural gas? Market information Gas wells Gas Storage and LNG Pipeline Operations & Delivery Winter Peak Operation Gas measurement Gas Rates Natural gas advantages
Presentation Outline

© 2016 Energy Solutions Center Inc. – All Rights Reserved
What is Natural Gas
4 © Energy Solutions Center Inc. – All Rights Reserved
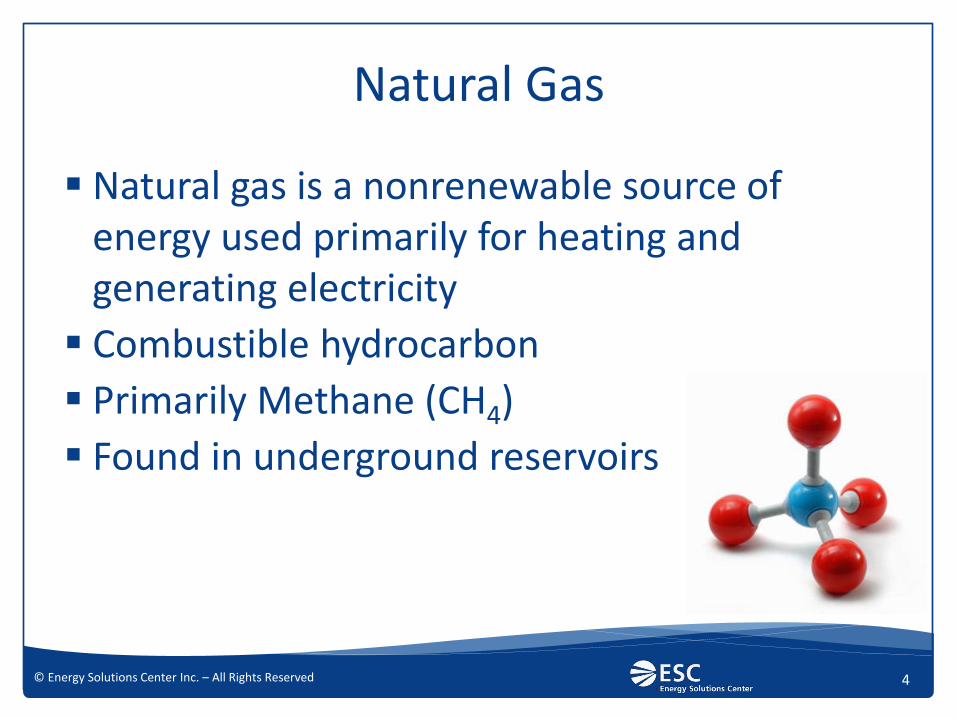
Natural gas is a nonrenewable source of energy used primarily for heating and generating electricity
Combustible hydrocarbon
Primarily Methane (CH4)
Found in underground reservoirs
Natural Gas

5 © Energy Solutions Center Inc. – All Rights Reserved
Natural Gas Accounts for Roughly 1/4 of Primary Energy Consumption
Coal
Oil
Other
Natural Gas
Source: Dept. of Energy, Energy Information Administration

6 © Energy Solutions Center Inc. – All Rights Reserved
Millions of years ago remains of plants & animals decayed and built up in thick layers
Mud & soil changed to rock, covered & trapped the organic material beneath the rock
Pressure & heat changed some of this organic material into coal, oil & gas
How Gas Is Formed
7 © Energy Solutions Center Inc. – All Rights Reserved
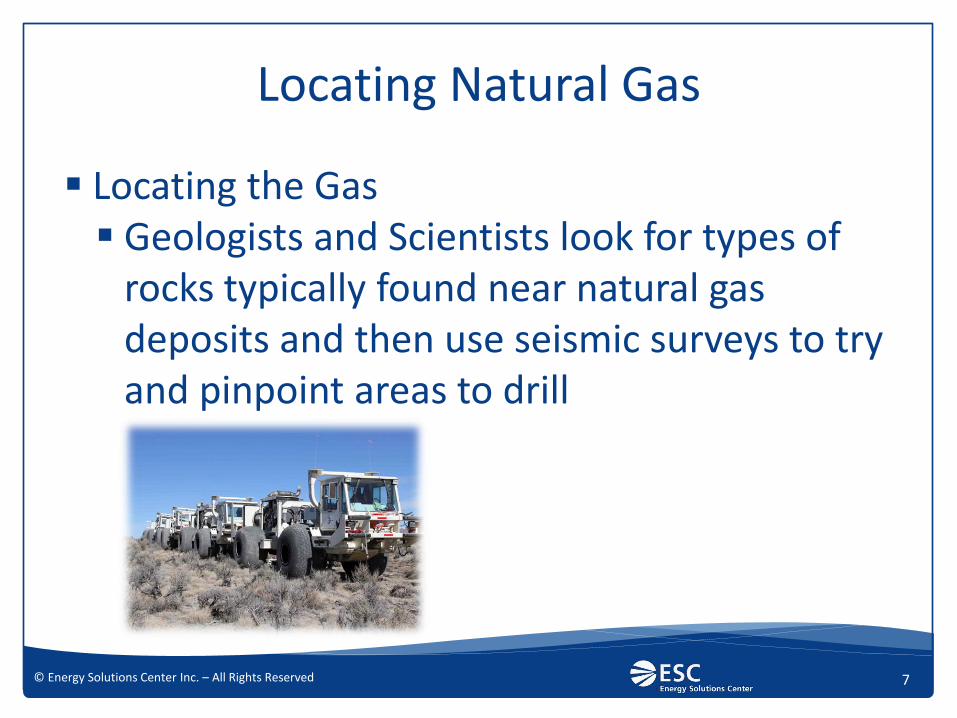
Locating the Gas Geologists and Scientists look for types of
rocks typically found near natural gas deposits and then use seismic surveys to try and pinpoint areas to drill
Locating Natural Gas
8 © Energy Solutions Center Inc. – All Rights Reserved
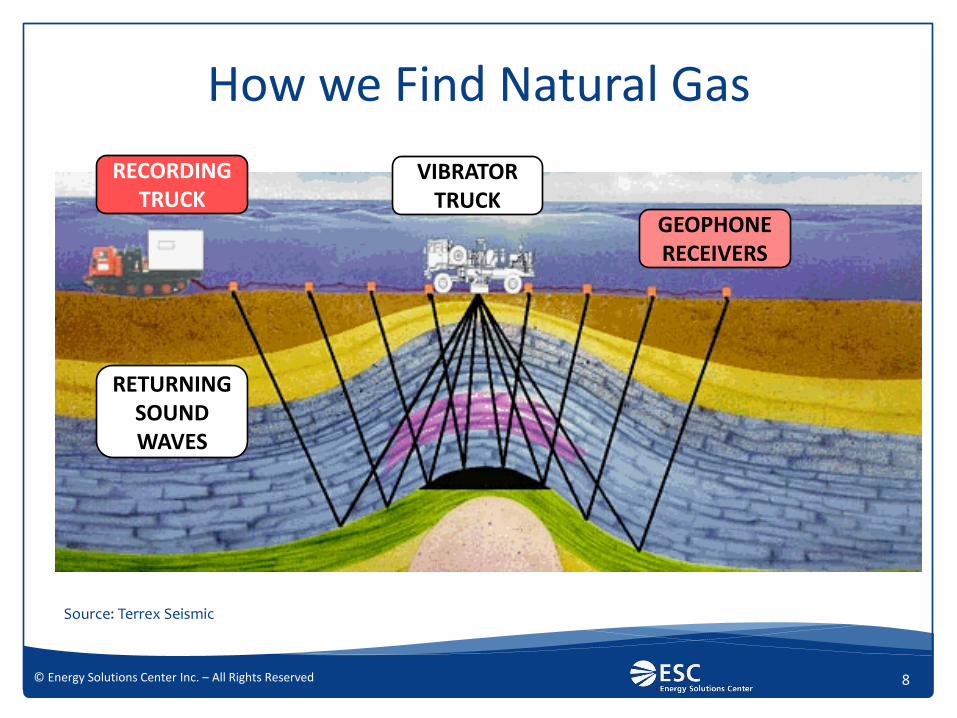
VIBRATOR TRUCK
How we Find Natural Gas
RECORDING TRUCK
RETURNING SOUND WAVES
GEOPHONE RECEIVERS
Source: Terrex Seismic

© 2016 Energy Solutions Center Inc. – All Rights Reserved
Natural Gas Market Info

10 © Energy Solutions Center Inc. – All Rights Reserved
Stable Pricing Predicted Into the Future
Source: Rethinking Natural Gas, A Future for Natural Gas in the U.S. Economy.

11 © Energy Solutions Center Inc. – All Rights Reserved
Supply Future
NG Undiscovered Resources NG Reserves (EIA)
Trill
ion
cu
bic
fe
et

12 © Energy Solutions Center Inc. – All Rights Reserved
North American Natural Gas Production
Source: www.eia.gov/oiaf/aeo/tablebrowser/#release=IEO2011&subject=0-IEO2011&table=6-IEO2011®ion=0-0&cases=Reference-0504a_1630
0
5
10
15
20
25
30
35
40
2005 2010 2015 2020 2025 2030 2035
Vo
lum
es
(Tc
f)
Mexico
Canada
United States
Historic Projected

13 © Energy Solutions Center Inc. – All Rights Reserved
Natural Gas Supply Source - U.S.
United States 84%
Canada 15%
LNG 1%

14 © Energy Solutions Center Inc. – All Rights Reserved
Consensus on Long Term Supply
Source: www.eia.gov/tools/faqs/faq.cfm?id=58&t=8
How much natural gas does the United States have and how long will it last?
100 Years !
Per EIA 2,203 Tcf @ 24 Tcf/year = 92 Years
Per AGA Based on EIA and Colorado School of Mines = 2,170 Tcf = almost 100 year supply
Based on CGA 22,521 Cubic Metres @ 144 cubic metres / year = 156 years in Canada

15 © Energy Solutions Center Inc. – All Rights Reserved
In 2012, the Low Income Home Energy Assistance Program (LIHEAP provided approximately $3.5 billion to help utility customers pay their energy bills
622,000 jobs are directly involved in exploring for, producing, transporting and distributing natural gas(direct employment)
Economic Impacts
Natural gas distribution employment provided between 116,000 and 122,000 (nearly 20%) of these direct jobs

16 © Energy Solutions Center Inc. – All Rights Reserved
Commercial Energy Price History & Forecast
EIA Short Term Energy Outlook as of 3/17/16
$-
$5.00
$10.00
$15.00
$20.00
$25.00
$30.00
$35.00
2000 2001 2002 2003 2004 2005 2006 2007 2008 2009 2010 2011 2012 2013 2014 2015 2016 2017
Average Retail Commercial U.S. Energy Prices including Short Term EIA Outlook ($/MMBTU)
Heating Oil Commercial Electric Commercial Natural Gas
Electric
Oil
Gas

© 2016 Energy Solutions Center Inc. – All Rights Reserved
Gas Wells
18 © Energy Solutions Center Inc. – All Rights Reserved
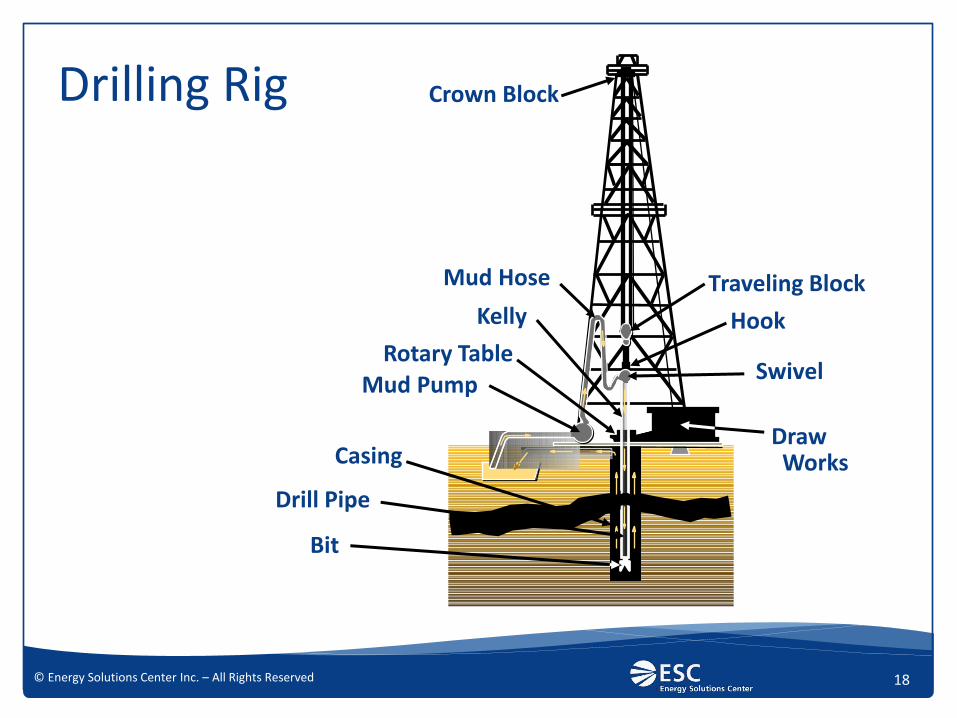
Drilling Rig
T raveling Block
Hook
Swivel
Draw Works
Mud Pump Rotary Table
Kelly
Mud Hose
Crown Block
Casing
Drill Pipe
Bit

19 © Energy Solutions Center Inc. – All Rights Reserved
Directional Drilling
Source: American Petroleum Institute
Gas
Oil Water

20 © Energy Solutions Center Inc. – All Rights Reserved
North American Shale Gas Deposits
Source: www.cga.ca/wp-content/uploads/2011/12/CGA_bulletin_SUPPLY-Billingual.pdf

21 © Energy Solutions Center Inc. – All Rights Reserved
Shale – One Source of Natural Gas
Sedimentary Rock - combination of clay, silica, carbonate and organic materials
Typically collects at the bottom of large lakes, deep seas or oceans
Bacteria feeds on the organic material, producing oil and natural gas Dark layers are shale, light layers are
limestone. A writing pen is shown for scale. Source: National Energy Board - Canada A Primer for Understanding Canadian Shale Gas - Energy Briefing Note ISSN 1917-506X

22 © Energy Solutions Center Inc. – All Rights Reserved
Pump Fluid into the well at high pressure
Pressure creates Fractures in the shale
Filler material mixed with fluid keeps fractures open
Natural Gas then able to move to the well
Basics of Fracking
Source: National Energy Board - Canada A Primer for Understanding Canadian Shale Gas - Energy Briefing Note ISSN 1917-506X
Source: www.neb.gc.ca/clf-nsi/rnrgynfmtn/nrgyrprt/ntrlgs/prmrndrstndngshlgs2009/prmrndrstndngshlgs2009-eng.html#s8

23 © Energy Solutions Center Inc. – All Rights Reserved
Horizontal Drilling for Shale Gas
Operators have strong economic incentives to ensure that fractures do not propagate beyond the shale
Waste of materials, time, and money
Potential loss of the well and the associated gas
Lead to excess water production from adjacent strata – increasing production costs
Source: www.netl.doe.gov/technologies/oil-gas/publications/EPreports/Shale_Gas_Primer_2009.pdf

24 © Energy Solutions Center Inc. – All Rights Reserved
Drilling for Shale Gas
Drill Rig Water Storage
Diamond Drill Bit

25 © Energy Solutions Center Inc. – All Rights Reserved
Producing Shale Well
Well Heads and Sand Traps
Heaters
Control Shed

© 2016 Energy Solutions Center Inc. – All Rights Reserved
Natural Gas Storage & LNG

27 © Energy Solutions Center Inc. – All Rights Reserved
Gas can be stored in huge storage tanks, in underground wells, or in liquefied form
How Gas is Stored and Delivered
CONTINUED

28 © Energy Solutions Center Inc. – All Rights Reserved 28 © Energy Solutions Center Inc. – All Rights Reserved
Underground Gas Storage
http://www.eia.gov/cfapps/ngqs/images/storage_2010.png
CenterPoint Energy has underground storage in MN
29 © Energy Solutions Center Inc. – All Rights Reserved
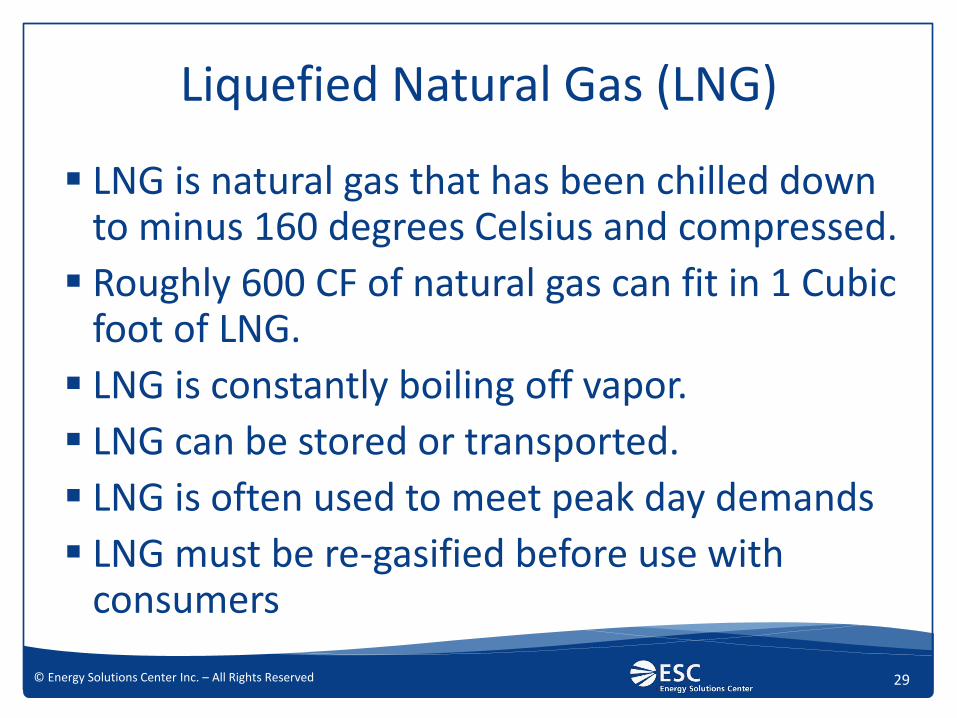
LNG is natural gas that has been chilled down to minus 160 degrees Celsius and compressed.
Roughly 600 CF of natural gas can fit in 1 Cubic foot of LNG.
LNG is constantly boiling off vapor.
LNG can be stored or transported.
LNG is often used to meet peak day demands
LNG must be re-gasified before use with consumers
Liquefied Natural Gas (LNG)

30 © Energy Solutions Center Inc. – All Rights Reserved
LNG Storage Tank
CenterPoint Energy has an LNG Facility in MN

31 © Energy Solutions Center Inc. – All Rights Reserved
LNG Transportation
Tanker Truck
Rail Car
Tanker Ships
CenterPoint Energy sells LNG in MN
32 © Energy Solutions Center Inc. – All Rights Reserved
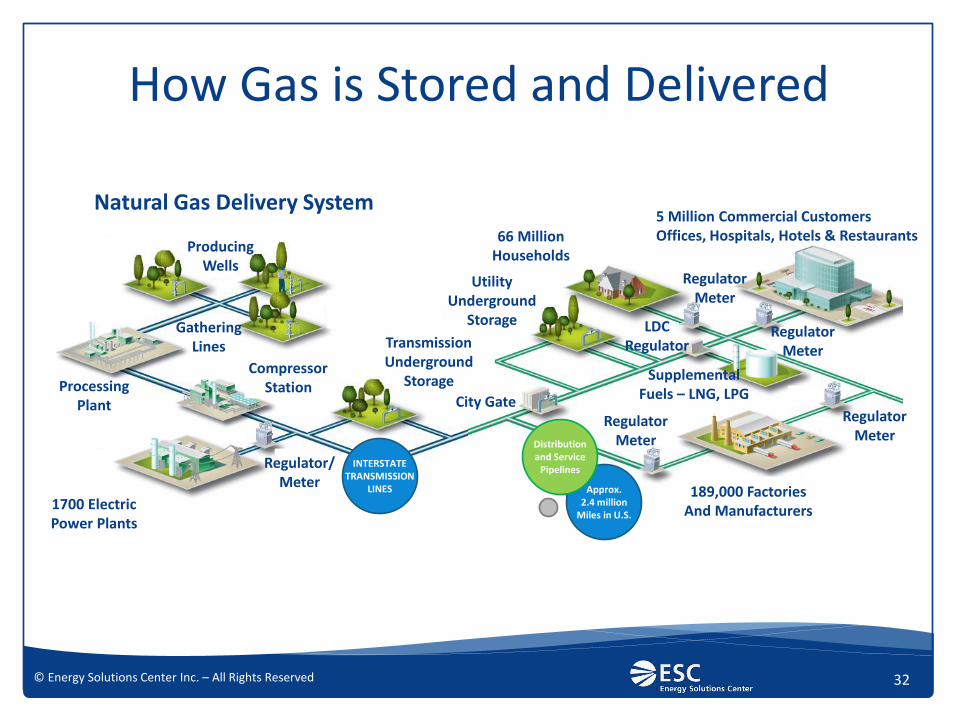
How Gas is Stored and Delivered
Natural Gas Delivery System
Transmission Underground
Storage
City Gate Processing
Plant
1700 Electric Power Plants
Compressor Station
Regulator/ Meter
INTERSTATE TRANSMISSION
LINES
Gathering Lines
Producing Wells
Utility Underground
Storage
66 Million Households
5 Million Commercial Customers Offices, Hospitals, Hotels & Restaurants
Regulator Meter
Regulator Meter
Regulator Meter
Regulator Meter
LDC Regulator
Supplemental Fuels – LNG, LPG
Approx. 2.4 million
Miles in U.S.
Distribution and Service
Pipelines
189,000 Factories And Manufacturers

33 © Energy Solutions Center Inc. – All Rights Reserved
Transportation System
CITY GATE REGULATORS &
METERING
PRODUCING WELLS
OFF SHORE WELLS
GATHERING LINES
GATHERING LINES
COMPRESSOR STATION
COMPRESSOR STATION
PROCESSING PLANT
UNDERGROUND STORAGE
LNG/LPG
RESIDENTIAL
CUSTOMERS
COMMERCIAL
CUSTOMERS
INDUSTRIAL
CUSTOMERS
TRANSMISSION LINES

© 2016 Energy Solutions Center Inc. – All Rights Reserved
Natural Gas Pipeline Operation & Delivery

35 © Energy Solutions Center Inc. – All Rights Reserved
Pipeline Operations
Compression
Maintenance
Underground Storage
Distribution Operations
Gate Stations
Mains and Services
Metering
Operations

36 © Energy Solutions Center Inc. – All Rights Reserved
Compressor stations are facilities that assists the transportation process of natural gas from one location to another
Natural gas, transported through a gas pipeline, needs to be re-pressurized at intervals of about 40 to 100 miles
Gas Compressor Station

37 © Energy Solutions Center Inc. – All Rights Reserved
2.4 million mile underground system
2.1 million LDC, 300,000 Transmission
Interstate Pipeline Network
Source: AGA

38 © Energy Solutions Center Inc. – All Rights Reserved
On-going Maintenance Projects
Composite Wraps
Cast Iron Joint Sealing Robots
Cast Iron Replacement Programs
Beltline replacement project underway in twin Cities for safety and reliability
Pipeline Maintenance

39 © Energy Solutions Center Inc. – All Rights Reserved
Facility owned and operated by the interstate pipeline and interconnects the long-distance interstate pipeline with a local distribution network
Gate Stations
Town Border Stations are composed of valves, pipes, and pressure reduction devices to allow gas to be delivered safely to customers
Odorant is often added at the City gate Station

40 © Energy Solutions Center Inc. – All Rights Reserved
Mains and Services
Gas Main Line
Customer Service Line
Customer Meter & Regulator
Customer Meter & Regulator

© 2016 Energy Solutions Center Inc. – All Rights Reserved
Winter Operation & Peak Demand

42 © Energy Solutions Center Inc. – All Rights Reserved
Natural Gas Demand Peaks in Winter
0%
20%
40%
60%
80%
100%
Natural Gas Demand Peaks in
the Winter

43 © Energy Solutions Center Inc. – All Rights Reserved
The Gas Utility meets peak demand in a number of ways
Uses base load from pipeline
Draws from gas storage
Potentially draw down line pack pressure
Potentially interrupts customers on interruptible rates
CenterPoint Energy also meets peaks with LNG
CenterPoint Energy uses Propane-Air facilities
Meeting Peak Day Requirements

44 © Energy Solutions Center Inc. – All Rights Reserved
Natural Gas in Underground Storage
Source: U.S. Energy Information Administration, Natural Gas Monthly and Weekly Natural Gas Storage Report. Note: Data for March 31, 2015 is an interpolated value, based on the Weekly Natural Gas Storage Report. http://www.eia.gov/naturalgas/weekly/archive/2015/04_09/index.cfm
Start of winter
Withdrawals
End of withdrawal season

© 2016 Energy Solutions Center Inc. – All Rights Reserved
Natural Gas Measurement

46 © Energy Solutions Center Inc. – All Rights Reserved
LDC (Gas Utility) buys natural gas in Therms
Buy on heating value
LDC meter measures gas usage in Cubic Feet (U.S.) 1 British Thermal Unit (BTU) is the
amount of heat required to raise 1 Pound of water by 1°F at atmospheric conditions
CenterPoint bills in Therms 1 Therm = 100,000 BTU
Natural Gas Measurement

© 2016 Energy Solutions Center Inc. – All Rights Reserved
Natural Gas Rates

48 © Energy Solutions Center Inc. – All Rights Reserved
Regulatory authorities allow rates to vary within classes based on distinctions in the service rendered
The two most common types of service distinctions are
Type of service
Quality of the service provided to the customer
Rate Design is Based on Service Distinctions

49 © Energy Solutions Center Inc. – All Rights Reserved
Bundled Natural Gas Sales and Distribution Service
Prior to the 1980s, nearly all natural gas sold to customers was sold as a bundled product of natural gas commodity and natural gas delivery service
Utilities owned the gas commodity and passed through the commodity cost
In addition, utilities recovered the cost of service for the distribution service they provided to customers
Distinctions Based on Type of Service Sales Service

50 © Energy Solutions Center Inc. – All Rights Reserved
Unbundled Transportation Service Customers who wish to purchase their natural gas
commodity from a third party supplier or marketer take transportation service from the utility, which delivers but does not buy the gas
The administrative costs of acquiring and managing gas supply are removed from the transportation cost of service
The customer class that makes the greatest use of transportation service is the industrial class
Distinctions Based on Type of Service Transportation Service

51 © Energy Solutions Center Inc. – All Rights Reserved
Firm Service
Firm service comes with the utility’s commitment to provide all the natural gas demanded by the customer, even at times of peak usage and strained capacity
Distinctions Based on Quality of Service

52 © Energy Solutions Center Inc. – All Rights Reserved
Interruptible Service Interruptible service is a lesser quality service that may be cut
off at the utility’s discretion.
Many industrial and some larger commercial customers have the ability to shut down operations or switch to an alternate fuel during times that the utility would be strained to serve all customers equally.
By interrupting these customers, the utility is able to serve its residential and smaller commercial customers without having to invest in additional facilities that might be used only during extremely peak times.
For this lesser service, the customer pays a reduced rate.
Distinctions Based on Quality of Service

© 2016 Energy Solutions Center Inc. – All Rights Reserved
Advantages of Natural Gas

54 © Energy Solutions Center Inc. – All Rights Reserved
Natural gas is the cleanest burning fossil fuel
When burned, it produces virtually no emissions of sulfur dioxide or particulate matter and far lower levels of "greenhouse" gases and nitrogen oxides than oil or coal
Unlike the oil, coal and nuclear processes, the natural gas process produces virtually no solid waste
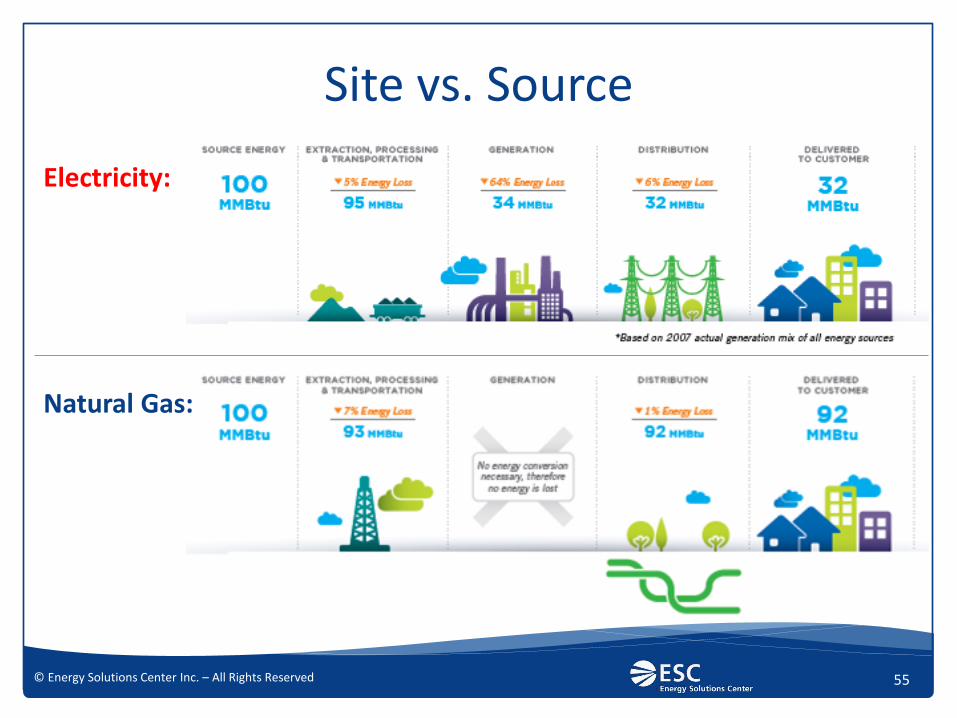
Natural gas is delivered to the customer with around 90% efficiency, compared to electricity which is around 30%
Gas and the Environment
55 © Energy Solutions Center Inc. – All Rights Reserved
Electricity:
Natural Gas:
Site vs. Source

56 © Energy Solutions Center Inc. – All Rights Reserved
Domestic Product
Approximately 85 % of natural gas is produced in the US with almost all the remainder coming from Canada
Reliable
Ample supply
Competitively priced
Environmentally friendly
Greater comfort
Advantages of Natural Gas

© 2016 Energy Solutions Center Inc. – All Rights Reserved
Questions???