5207&5201 trouble creek rd -...
TRANSCRIPT
5207&5201 TROUBLE CREEK RD5207&5201 TROUBLE CREEK RD, New Port Richey,FL 34652
Eric CedermanCederman Properties3060 Alternate 19, Ste B16,Palm Harbor, FL [email protected](727) 688-5859License: BK 659676

Price: $129,500
Building Size: 2,468 SF
Price/SF: $52.47
Property Type: Office
Property Sub-type: Office Building
Additional Sub-types:
Medical Office, Office-R&D, Office Condo
Property Use Type: Investment
Commission Split: 3%
Cap Rate: 10%
Occupancy: 50%
5207&5201 TROUBLECREEK RD$129,500
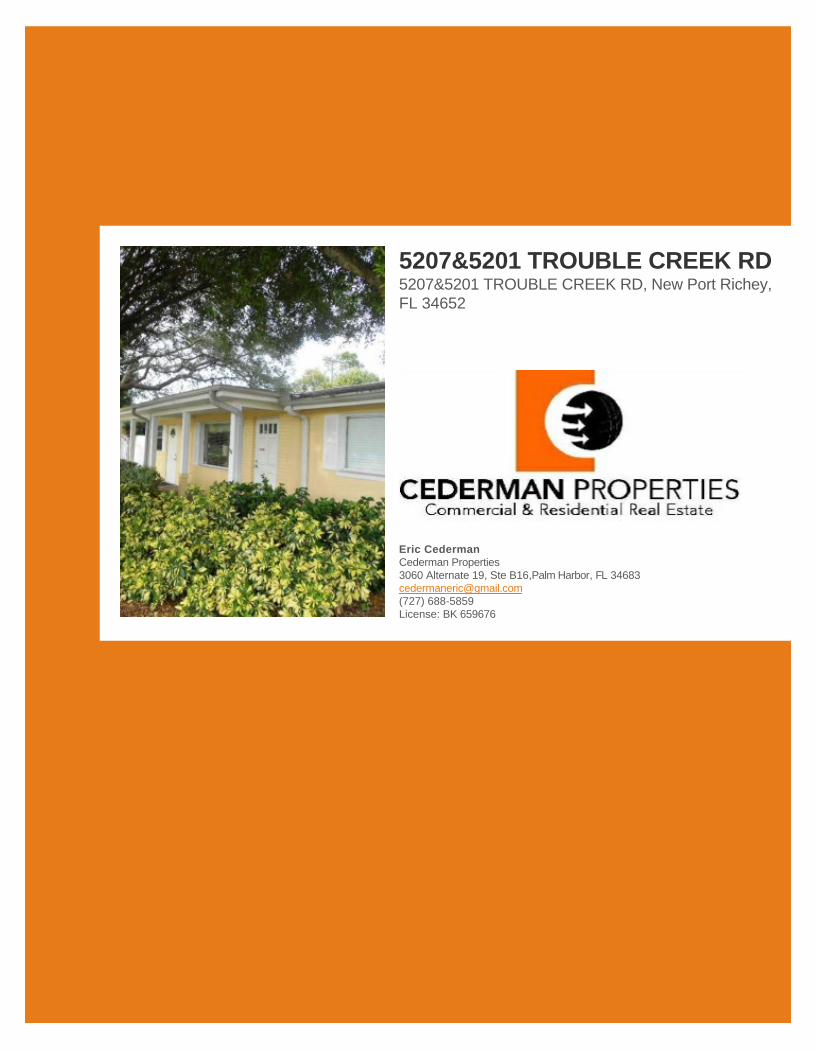
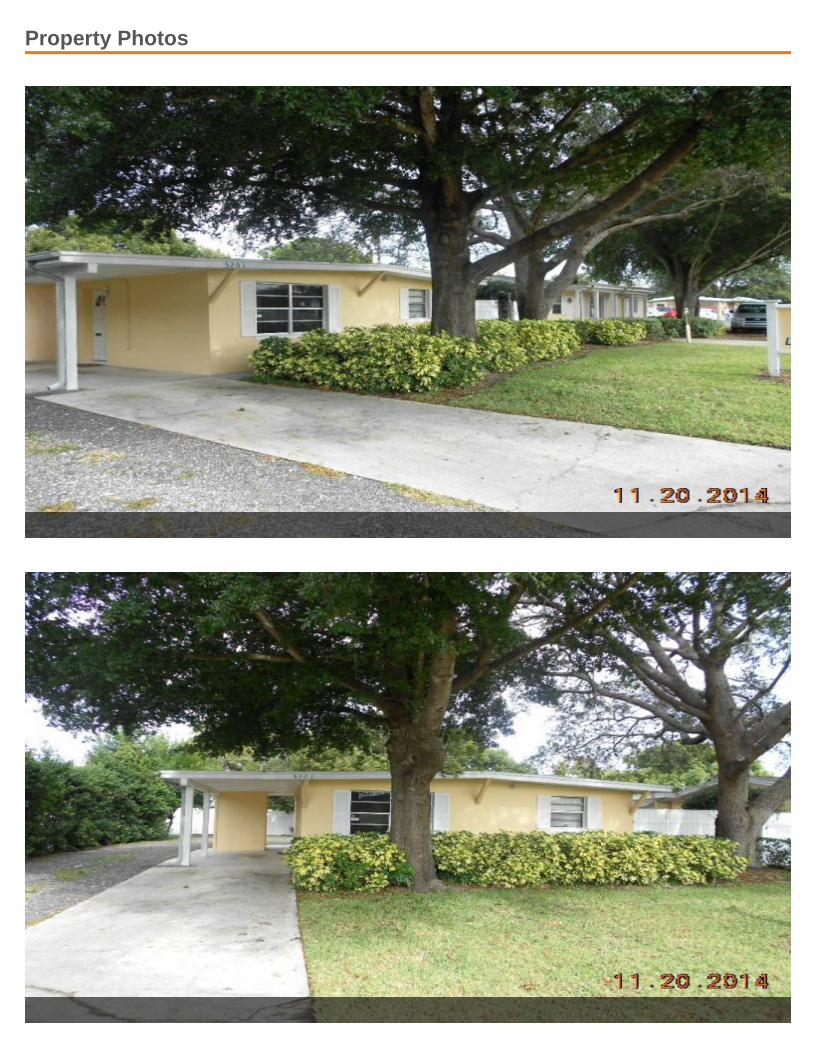
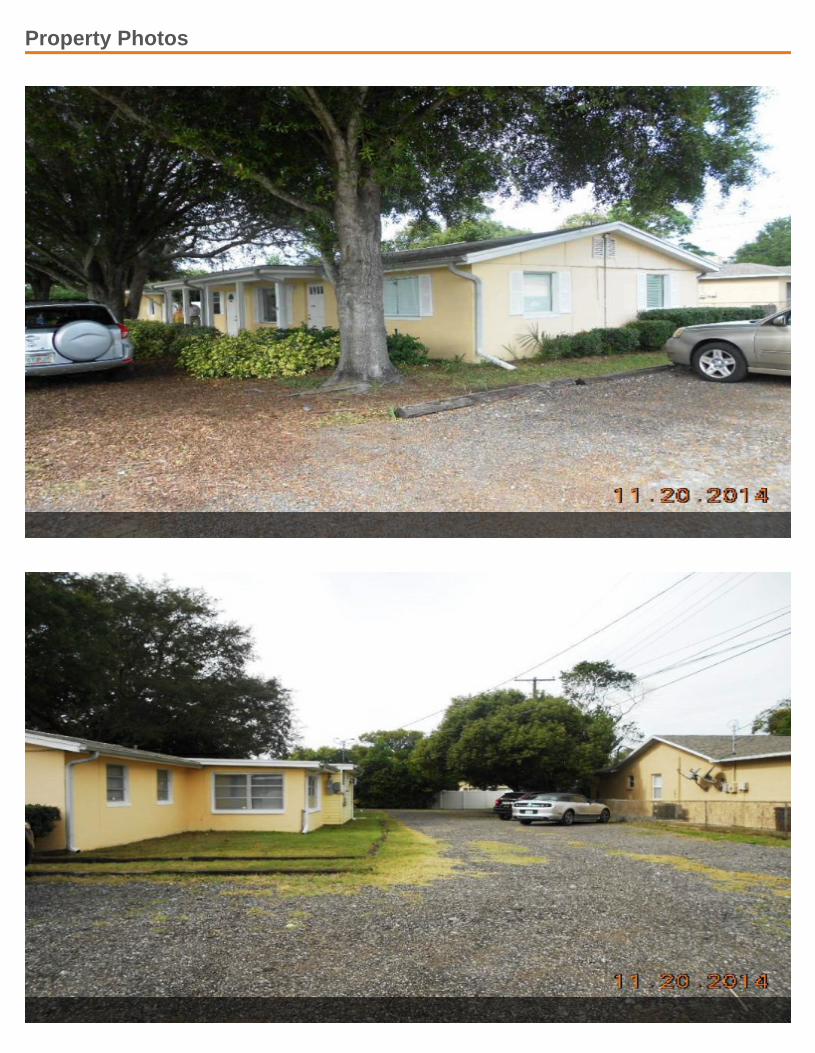
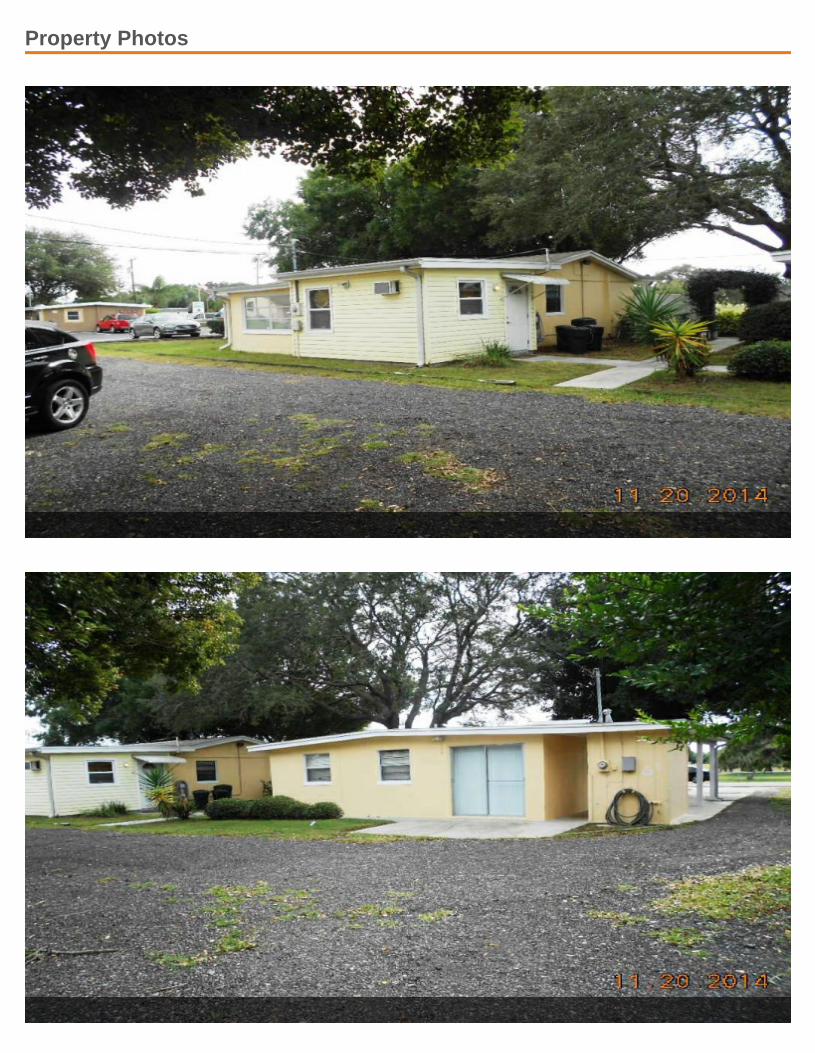
Investor property, generating passive investment 10%Cap rate. Two Buildings, two Parcels, zoned for StoreOffice, Residence Combination, 130 ft. frontage onTrouble Creek Rd. Building 5207 Trouble Creek Rd.,1532 sqft., lot 7000 sqft. Building 5201 Trouble CreekRd., 936 sqft.,lot 6000 sqft. Both properties are in goodcondition and well maintained. Discretion is requested,please call for additional information's.
For more information visit:http://www.crelisting.net/Vmt4yhs1Q/?StepID=107

5207&5201 TROUBLE CREEK RD, New Port Richey, FL 34652
From US 19, turn east on Trouble Creek Rd. Property is located 0.3 miles from US 19N oncorner Trouble Creek and Kennedy dr.
Property Photos

Property Photos
Property Photos

Property Photos
Property Photos

Property Photos

Property Photos

Property Photos

Property Photos

Property Photos

Property Photos

Property Photos

Property Photos

Property Photos

Property Photos

Property Photos

Property Photos

Jan 16 vs. 3 mo. prior Y-O-Y
— State $139 +1.4% +3.8%
— Metro $123 +1.4% +2.0%
— County $110 +5.8% +1.1%
Jan 16 vs. 3 mo. prior Y-O-Y
— State $17.22 +0.5% +3.1%
— Metro $16.41 +0.5% +0.9%
— County $11.85 +0.1% -4.5%
Market Trends

Demographics
Population 1-mi. 3-mi. 5-mi.
2015 Male Population 4,136 35,052 66,860
2015 Female Population 4,298 37,873 72,269
% 2015 Male Population 49.04% 48.07% 48.06%
% 2015 Female Population 50.96% 51.93% 51.94%
2015 Total Population: Adult 6,692 60,026 113,880
2015 Total Daytime Population 9,940 73,176 137,956
2015 Total Employees 4,302 25,084 46,918
2015 Total Population: Median Age 42 47 47
2015 Total Population: Adult Median Age 51 54 54
2015 Total population: Under 5 years 470 3,442 6,350
2015 Total population: 5 to 9 years 516 3,657 7,098
2015 Total population: 10 to 14 years 481 3,642 7,444
2015 Total population: 15 to 19 years 472 3,655 7,292
2015 Total population: 20 to 24 years 548 4,129 7,668
2015 Total population: 25 to 29 years 534 4,094 7,160
2015 Total population: 30 to 34 years 542 4,060 7,307
2015 Total population: 35 to 39 years 435 3,631 6,960
2015 Total population: 40 to 44 years 517 4,434 8,585
2015 Total population: 45 to 49 years 567 4,761 9,267
2015 Total population: 50 to 54 years 648 5,507 10,531
2015 Total population: 55 to 59 years 530 5,096 9,946
2015 Total population: 60 to 64 years 447 4,489 8,850
2015 Total population: 65 to 69 years 450 4,775 9,321
2015 Total population: 70 to 74 years 437 4,172 8,064
2015 Total population: 75 to 79 years 344 3,476 6,580
2015 Total population: 80 to 84 years 268 2,743 5,209
2015 Total population: 85 years and over 228 3,162 5,497
% 2015 Total population: Under 5 years 5.57% 4.72% 4.56%
% 2015 Total population: 5 to 9 years 6.12% 5.01% 5.10%
% 2015 Total population: 10 to 14 years 5.70% 4.99% 5.35%
% 2015 Total population: 15 to 19 years 5.60% 5.01% 5.24%
% 2015 Total population: 20 to 24 years 6.50% 5.66% 5.51%
% 2015 Total population: 25 to 29 years 6.33% 5.61% 5.15%
% 2015 Total population: 30 to 34 years 6.43% 5.57% 5.25%
% 2015 Total population: 35 to 39 years 5.16% 4.98% 5.00%
% 2015 Total population: 40 to 44 years 6.13% 6.08% 6.17%
% 2015 Total population: 45 to 49 years 6.72% 6.53% 6.66%
% 2015 Total population: 50 to 54 years 7.68% 7.55% 7.57%
% 2015 Total population: 55 to 59 years 6.28% 6.99% 7.15%
% 2015 Total population: 60 to 64 years 5.30% 6.16% 6.36%
% 2015 Total population: 65 to 69 years 5.34% 6.55% 6.70%
% 2015 Total population: 70 to 74 years 5.18% 5.72% 5.80%
% 2015 Total population: 75 to 79 years 4.08% 4.77% 4.73%

Demographics
Population (Cont.) 1-mi. 3-mi. 5-mi.
% 2015 Total population: 80 to 84 years 3.18% 3.76% 3.74%
% 2015 Total population: 85 years and over 2.70% 4.34% 3.95%
2015 White alone 7,314 65,384 125,063
2015 Black or African American alone 296 2,269 4,285
2015 American Indian and Alaska Native alone 45 281 501
2015 Asian alone 180 1,261 2,665
2015 Native Hawaiian and OPI alone 2 47 68
2015 Some Other Race alone 346 1,819 3,204
2015 Two or More Races alone 251 1,864 3,343
2015 Hispanic 1,250 7,893 13,977
2015 Not Hispanic 7,184 65,032 125,152
% 2015 White alone 86.72% 89.66% 89.89%
% 2015 Black or African American alone 3.51% 3.11% 3.08%
% 2015 American Indian and Alaska Native alone 0.53% 0.39% 0.36%
% 2015 Asian alone 2.13% 1.73% 1.92%
% 2015 Native Hawaiian and OPI alone 0.02% 0.06% 0.05%
% 2015 Some Other Race alone 4.10% 2.49% 2.30%
% 2015 Two or More Races alone 2.98% 2.56% 2.40%
% 2015 Hispanic 14.82% 10.82% 10.05%
% 2015 Not Hispanic 85.18% 89.18% 89.95%
2015 Not Hispanic: White alone 7,284 65,221 115,784
2015 Not Hispanic: Black or African American alone 46 677 1,311
2015 Not Hispanic: American Indian and Alaska Native alone 35 235 371
2015 Not Hispanic: Asian alone 86 655 1,288
2015 Not Hispanic: Native Hawaiian and OPI alone n/a 35 42
2015 Not Hispanic: Some Other Race alone 17 75 113
2015 Not Hispanic: Two or More Races 103 836 1,391
% 2015 Not Hispanic: White alone 90.99% 92.06% 92.30%
% 2015 Not Hispanic: Black or African American alone 0.57% 0.96% 1.05%
% 2015 Not Hispanic: American Indian and Alaska Native alone 0.44% 0.33% 0.30%
% 2015 Not Hispanic: Asian alone 1.07% 0.92% 1.03%
% 2015 Not Hispanic: Native Hawaiian and OPI alone 0.00% 0.05% 0.03%
% 2015 Not Hispanic: Some Other Race alone 0.21% 0.11% 0.09%
% 2015 Not Hispanic: Two or More Races 1.29% 1.18% 1.11%
Population Change 1-mi. 3-mi. 5-mi.
Total: Employees (NAICS) n/a n/a n/a
Total: Establishements (NAICS) n/a n/a n/a
2015 Total Population 8,434 72,925 139,129
2015 Households 3,504 32,060 59,467

Demographics
Population Change (Cont.) 1-mi. 3-mi. 5-mi.
Population Change 2010-2015 108 1,129 3,173
Household Change 2010-2015 -56 -310 -182
% Population Change 2010-2015 1.30% 1.57% 2.33%
% Household Change 2010-2015 -1.57% -0.96% -0.31%
Population Change 2000-2015 429 2,079 13,686
Household Change 2000-2015 -217 -580 2,772
% Population Change 2000 to 2015 5.36% 2.93% 10.91%
% Household Change 2000 to 2015 -5.83% -1.78% 4.89%
Housing 1-mi. 3-mi. 5-mi.
2015 Housing Units 4,388 38,564 65,899
2015 Occupied Housing Units 3,721 32,639 56,695
2015 Owner Occupied Housing Units 2,955 25,492 45,156
2015 Renter Occupied Housing Units 766 7,147 11,539
2015 Vacant Housings Units 667 5,924 9,203
% 2015 Occupied Housing Units 84.80% 84.64% 86.03%
% 2015 Owner occupied housing units 79.41% 78.10% 79.65%
% 2015 Renter occupied housing units 20.59% 21.90% 20.35%
% 2000 Vacant housing units 15.20% 15.36% 13.97%
Income 1-mi. 3-mi. 5-mi.
2015 Household Income: Median $33,084 $34,728 $37,335
2015 Household Income: Average $43,031 $47,254 $51,352
2015 Per Capita Income $17,910 $21,000 $22,159
2015 Household income: Less than $10,000 299 3,080 5,386
2015 Household income: $10,000 to $14,999 294 2,694 4,672
2015 Household income: $15,000 to $19,999 371 2,915 4,988
2015 Household income: $20,000 to $24,999 267 2,427 4,127
2015 Household income: $25,000 to $29,999 326 2,558 4,573
2015 Household income: $30,000 to $34,999 316 2,491 4,288
2015 Household income: $35,000 to $39,999 247 2,132 3,638
2015 Household income: $40,000 to $44,999 262 1,992 3,470
2015 Household income: $45,000 to $49,999 211 1,761 3,257
2015 Household income: $50,000 to $59,999 237 2,581 4,892
2015 Household income: $60,000 to $74,999 269 2,405 4,751
2015 Household income: $75,000 to $99,999 211 2,456 5,356
2015 Household income: $100,000 to $124,999 92 1,004 2,368
2015 Household income: $125,000 to $149,999 14 502 1,328
2015 Household income: $150,000 to $199,999 53 641 1,448
2015 Household income: $200,000 or more 35 421 925
% 2015 Household income: Less than $10,000 8.53% 9.61% 9.06%
% 2015 Household income: $10,000 to $14,999 8.39% 8.40% 7.86%

Demographics
Income (Cont.) 1-mi. 3-mi. 5-mi.
% 2015 Household income: $15,000 to $19,999 10.59% 9.09% 8.39%
% 2015 Household income: $20,000 to $24,999 7.62% 7.57% 6.94%
% 2015 Household income: $25,000 to $29,999 9.30% 7.98% 7.69%
% 2015 Household income: $30,000 to $34,999 9.02% 7.77% 7.21%
% 2015 Household income: $35,000 to $39,999 7.05% 6.65% 6.12%
% 2015 Household income: $40,000 to $44,999 7.48% 6.21% 5.84%
% 2015 Household income: $45,000 to $49,999 6.02% 5.49% 5.48%
% 2015 Household income: $50,000 to $59,999 6.76% 8.05% 8.23%
% 2015 Household income: $60,000 to $74,999 7.68% 7.50% 7.99%
% 2015 Household income: $75,000 to $99,999 6.02% 7.66% 9.01%
% 2015 Household income: $100,000 to $124,999 2.63% 3.13% 3.98%
% 2015 Household income: $125,000 to $149,999 0.40% 1.57% 2.23%
% 2015 Household income: $150,000 to $199,999 1.51% 2.00% 2.43%
% 2015 Household income: $200,000 or more 1.00% 1.31% 1.56%
Retail Sales Volume 1-mi. 3-mi. 5-mi.
2015 Childrens/Infants clothing stores $863,189 $7,881,005 $14,820,664
2015 Jewelry stores $300,050 $2,821,043 $5,359,001
2015 Mens clothing stores $998,316 $9,273,723 $17,556,445
2015 Shoe stores $1,011,055 $9,370,204 $17,721,314
2015 Womens clothing stores $1,750,212 $16,328,406 $30,886,898
2015 Automobile dealers $13,393,941 $125,438,805 $238,463,214
2015 Automotive parts and accessories stores $2,698,985 $25,199,545 $47,687,328
2015 Other motor vehicle dealers $412,658 $3,837,493 $7,199,103
2015 Tire dealers $1,205,207 $11,255,164 $21,297,368
2015 Hardware stores $53,404 $505,633 $971,981
2015 Home centers $548,692 $5,217,982 $10,011,032
2015 Nursery and garden centers $684,467 $6,517,189 $12,436,828
2015 Outdoor power equipment stores $314,878 $2,959,786 $5,632,762
2015 Paint andwallpaper stores $63,847 $598,363 $1,147,020
2015 Appliance, television, and other electronics stores $1,812,807 $17,001,601 $32,341,432
2015 Camera andphotographic supplies stores $131,165 $1,237,204 $2,370,535
2015 Computer andsoftware stores $5,126,350 $47,559,478 $89,560,825
2015 Beer, wine, and liquor stores $865,045 $8,057,730 $15,235,556
2015 Convenience stores $3,832,592 $35,356,127 $66,633,606
2015 Restaurant Expenditures $3,553,726 $33,245,476 $63,054,235
2015 Supermarkets and other grocery (except convenience) stores $14,618,135 $135,271,712 $254,356,228
2015 Furniture stores $1,253,281 $11,761,446 $22,352,234
2015 Home furnishings stores $4,581,047 $42,933,352 $81,343,567
2015 General merchandise stores $23,632,971 $221,387,716 $420,029,847
2015 Gasoline stations with convenience stores $12,247,594 $113,387,911 $213,875,313
2015 Other gasoline stations $8,876,256 $82,250,954 $155,155,870
2015 Department stores (excl leased depts) $23,332,921 $218,566,673 $414,670,846
2015 General merchandise stores $23,632,971 $221,387,716 $420,029,847
2015 Other health and personal care stores $918,935 $8,626,763 $16,365,237

Demographics
Retail Sales Volume (Cont.) 1-mi. 3-mi. 5-mi.
2015 Pharmacies and drug stores $3,835,610 $35,849,286 $67,634,503
2015 Pet and pet supplies stores $1,025,202 $9,582,888 $18,124,184
2015 Book, periodical, and music stores $152,203 $1,438,451 $2,736,211
2015 Hobby, toy, and game stores $427,134 $4,013,319 $7,608,269
2015 Musical instrument and supplies stores $40,354 $382,855 $734,188
2015 Sewing, needlework, and piece goods stores $81,339 $772,647 $1,469,589
2015 Sporting goods stores $396,158 $3,716,129 $7,102,325