52 - barrie hall/budget/documents... · rebecca james-reid manager of marketing and promotions...
TRANSCRIPT
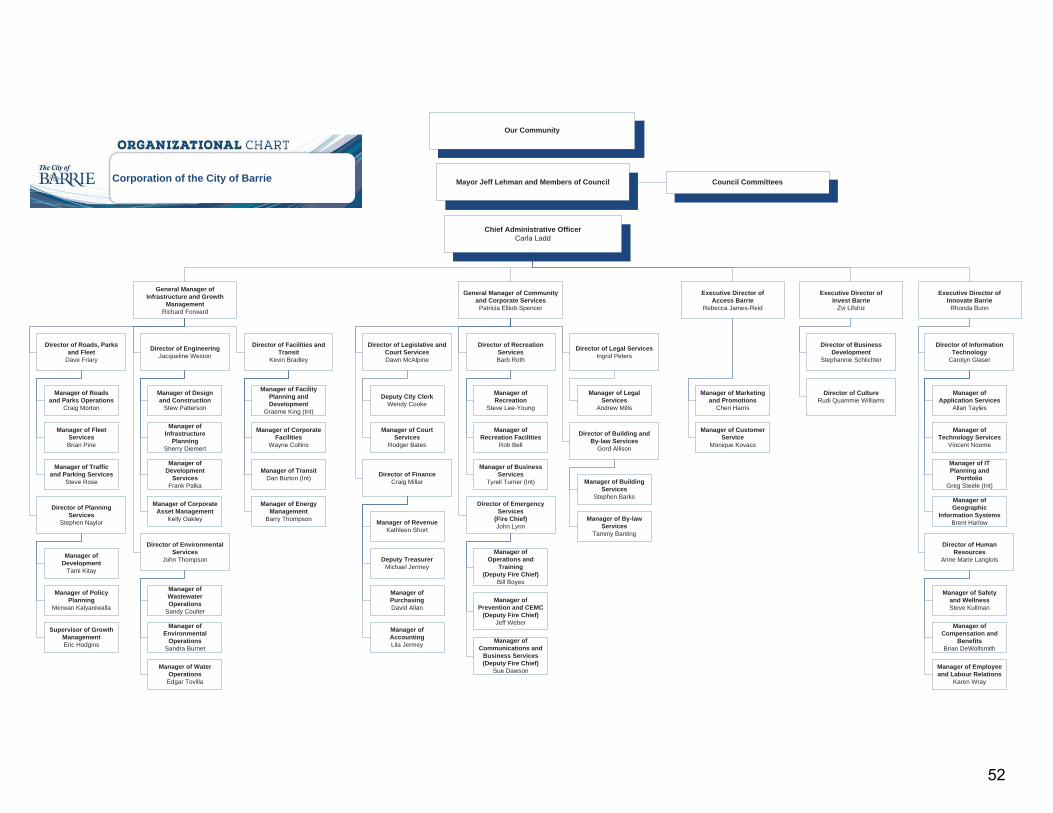
Chief Administrative OfficerCarla Ladd
General Manager ofInfrastructure and Growth
ManagementRichard Forward
Our Community
Mayor Jeff Lehman and Members of Council Council Committees
Director of Roads, Parksand Fleet
Dave Friary
Director of PlanningServices
Stephen Naylor
Director of EnvironmentalServices
John Thompson
Director of Facilities andTransit
Kevin Bradley
Director of EngineeringJacqueline Weston
Corporation of the City of Barrie
Manager of Roadsand Parks Operations
Craig Morton
Manager of FleetServicesBrian Pirie
Manager of Trafficand Parking Services
Steve Rose
Manager of FacilityPlanning andDevelopment
Graeme King (Int)
Manager of CorporateFacilities
Wayne Collins
Manager of TransitDan Burton (Int)
Manager of EnergyManagement
Barry Thompson
Manager ofDevelopment
Tami Kitay
Manager of PolicyPlanning
Merwan Kalyaniwalla
Manager of Designand Construction
Stew Patterson
Manager ofInfrastructure
PlanningSherry Diemert
Manager ofDevelopment
ServicesFrank Palka
Manager of CorporateAsset Management
Kelly Oakley
Manager ofWastewaterOperations
Sandy Coulter
Manager of WaterOperations
Edgar Tovilla
Manager ofEnvironmental
OperationsSandra Burnet
General Manager of Communityand Corporate ServicesPatricia Elliott-Spencer
Director of Legislative andCourt ServicesDawn McAlpine
Director of FinanceCraig Millar
Director of EmergencyServices
(Fire Chief)John Lynn
Director of Legal ServicesIngrid Peters
Director of RecreationServicesBarb Roth
Deputy City ClerkWendy Cooke
Manager of CourtServices
Rodger Bates
Manager of LegalServices
Andrew Mills
Manager of RevenueKathleen Short
Deputy TreasurerMichael Jermey
Manager ofRecreation
Steve Lee-Young
Manager ofRecreation Facilities
Rob Bell
Manager of BusinessServices
Tyrell Turner (Int)
Manager ofOperations and
Training(Deputy Fire Chief)
Bill Boyes
Manager ofCommunications and
Business Services(Deputy Fire Chief)
Sue Dawson
Manager ofPrevention and CEMC
(Deputy Fire Chief)Jeff Weber
Manager ofPurchasingDavid Allan
Manager ofAccountingLila Jermey
Director of Building andBy-law Services
Gord Allison
Manager of BuildingServices
Stephen Barks
Manager of By-lawServices
Tammy Banting
Executive Director ofAccess Barrie
Rebecca James-Reid
Manager of Marketingand Promotions
Cheri Harris
Manager of CustomerService
Monique Kovacs
Executive Director ofInvest Barrie
Zvi Lifshiz
Director of BusinessDevelopment
Stephannie Schlichter
Director of CultureRudi Quammie Williams
Executive Director ofInnovate Barrie
Rhonda Bunn
Director of InformationTechnology
Carolyn Glaser
Director of HumanResources
Anne Marie Langlois
Manager ofApplication Services
Allan Tayles
Manager of Safetyand WellnessSteve Kullman
Manager ofCompensation and
BenefitsBrian DeWolfsmith
Manager of Employeeand Labour Relations
Karen Wray
Manager ofTechnology Services
Vincent Noome
Manager of ITPlanning and
PortfolioGreg Steele (Int)
Manager ofGeographic
Information SystemsBrent Harlow
Supervisor of GrowthManagementEric Hodgins
52

Chief Administrative OfficerCarla Ladd
General Manager ofCommunity and Corporate
ServicesPatricia Elliott-Spencer
General Manager ofInfrastructure and Growth
ManagementRichard Forward
Executive Director ofInvest Barrie
Zvi Lifshiz
Executive Director ofAccess Barrie
Rebecca James-Reid
Executive Director ofInnovate Barrie
Rhonda Bunn
Executive Assistant tothe CAO
Deborah Ferrier
Executive Assistant tothe Mayor
Nina Brancaccio
Stakeholder andSpecial Projects
CoordinatorLauren Wild
Indicates temporaryposition
Office of the Mayor & Chief Administrative Officer
MayorJeff Lehman
53

P D
K
E B
Performanc
Division Goal
To direct andby City Counc
To ensure soassets.
To set the str To build a po To strengthen
improvement
Key Division S
Develop a cotools.
Provide overscollaboration,
Strengthen Fexploration of
Implement an Implement a Oversee the Ensure the de
External Fact
General econ Partnerships Policy directio
Budget Summ
Department
CAO & Mayor’s
ce Plan 2016
s
coordinate the gcil to ensure deliv
olid performance w
rategic focus of thsitive and passion organizational cs and innovations
Service Deliv
omprehensive stra
sight of a process, innovation, cominancial Managemf operating efficien Internal Audit prperformance meaimplementation oevelopment and i
ors Influencin
nomic conditions with neighboring
ons and funding c
mary
Req
Office
6 - OFFICE O
general managemvery of the higheswithin the busines
he organization thnate organizationcapacity to more s in service delive
ery Initiatives
ategic plan for the
s leading to Cultumunications and ment through theencies and new sorogram asurement frame
of the City’s Growimplementation o
ng Activities &
municipalities, aconstraints of oth
2016 Net quested Budget
$ 930,739
OF THE CHI
ment and operatiost quality servicesss management f
hat is aligned withn culture that is cuefficiently deliver ery.
s
e corporation whic
ural Change acroscontinuous impro continued implemources of revenu
work that enhancwth Plan in a mannof an ERP solution
& Outcomes
nd the developmeer levels of gover
Base Complem
5
IEF ADMINI
ns of the Corporas at the best valueframework to prot
h Council’s strategustomer focusedservice through t
ch includes Coun
ss the corporationovement mentation of longe
ces accountabilityner consistent witn that strengthens
ent industry rnment
2016 St
ment Service
Chan
1
STRATIVE
ation in accordane for the citizens tect and grow the
gies and priorities
the introduction o
ncil priorities, orga
n with a focus on
g-term financial pl
y and transparencth the approved fs processes and
taffing
e Level nges
TReq
1
OFFICER
ce with by-laws, and businesses o
e City’s financial,
s
of new tools (tech
anization goals, a
leadership, custo
lan, internal contr
cy financial framewoprovides effectiv
Total quested
6
policies and planof Barrie built and human
hnology), process
and strategies for
omer service, acc
rols and processe
ork for growth e reporting and in
s adopted
resource
s
r people and
countability,
es,
ntelligence.
54

2014 2015 2015 2016 Service 2016Actual Approved Forecasted Base Level Requested
Expenditures Budget Expenditure Budget Change(s) Budget$ $ $ $ $ $ $ %
EXPENSESSalaries 497,131 554,330 473,283 553,560 59,400 612,960 58,630 11%Fringe Benefits 110,585 122,677 108,116 122,179 12,606 134,785 12,108 10%Total Salaries and Benefits 607,716 677,007 581,399 675,739 72,006 747,745 70,738 10%OPERATING EXPENSESGeneral Operations 208,062 270,500 220,610 273,000 4,000 277,000 6,500 2%Minor Capital 701 3,000 800 2,000 - 2,000 (1,000) -33%Hydro, Water, Sewer, Gas - - - - - - - 0%Transfers to other Boards, Municipalities, Agencies - - - - - - - 0%
Total Operating Expenses before Debenture Costs and Transfers
208,763 273,500 221,410 275,000 4,000 279,000 5,500 2%
DEBENTURE COSTS AND TRANSFERSLease Equipment/Property - - - - - - - 0%Financial Expenses - - - - - - - 0%Transfer to/from User Rate Reserve Funds - - - - - - - 0%Transfer to Reserves - - - - - - - 0%Transfer to Capital Fund - - - - - - - 0%Total Debenture Costs and Transfers - - - - - - - 0%Gross Expenditures 816,479 950,507 802,809 950,739 76,006 1,026,745 76,238 8% Revenues Other Government Funding (25,000) - - - - - - 0% Contribution from Reserves/Reserve Funds - - - - - - - 0% Licences, Permits, Application Fees - - - - - - - 0% Fines - - - - - - - 0% Fees, Charges, Service Rentals - - - - - - - 0% Other Revenue (22,991) - (24,080) (20,000) - (20,000) (20,000) 0% Total Revenues (47,991) - (24,080) (20,000) - (20,000) (20,000) 0% Net Operating Expense/(Revenue) 768,488 950,507 778,729 930,739 76,006 1,006,745 56,238 6%
to 2015 Approved BudgetRequested Budget
CHIEF ADMINISTRATIVE OFFICER
2016 Base Budget Change Report
Change in 2016
55

CHIEF ADMINISTRATIVE OFFICECAO & MAYOR'S OFFICE
2014 2015 2015 2016 2017 2018ACTUAL BUDGET FORECAST BUDGET FORECAST FORECAST
EXPENSESSalaries 497,131 554,330 473,283 553,560 561,773 570,109 Fringe Benefits 110,585 122,677 108,116 122,179 124,012 125,872 Total Salaries and Benefits 607,716 677,007 581,399 675,739 685,785 695,981 OPERATING EXPENSESGeneral Operations 208,062 270,500 220,610 273,000 273,500 274,000 Minor Capital 701 3,000 800 2,000 2,000 2,000 Hydro, Water, Sewer, Gas - - - - - - Transfers to other Boards, Municipalities, Agencies - - - - - - Total Operating Expenses before Debenture Costs and Transfers 208,763 273,500 221,410 275,000 275,500 276,000 DEBENTURE COSTS AND TRANSFERSLease Equipment/Property - - - - - - Financial Expenses - - - - - - Transfer to/from User Rate Reserve Funds - - - - - - Transfer to Reserves - - - - - - Transfer to Capital Fund - - - - - - Total Debenture Costs and Transfers - - - - - - Gross Expenditures 816,479 950,507 802,809 950,739 961,285 971,981 Revenues Other Government Funding (25,000) - - - - - Contribution from Reserves/Reserve Funds - - - - - - Licences, Permits, Application Fees - - - - - - Fines - - - - - - Fees, Charges, Service Rentals - - - - - - Other Revenue (22,991) - (24,080) (20,000) - - Total Revenues (47,991) - (24,080) (20,000) - - Net Operating Expense/(Revenue) 768,488 950,507 778,729 930,739 961,285 971,981
CITY OF BARRIE2016 OPERATING BUDGET
EXPENDITURES
56

2014 2015 2015 2016 Service 2016Actual Approved Forecasted Base Level Requested
Expenditures Budget Expenditure Budget Change(s) Budget$ $ $ $ $ $ $ % $ % Comments
EXPENSESSalaries 497,131 554,330 473,283 553,560 59,400 612,960 (770) 0% 58,630 11% Increase attributed to Internal Auditor Intake
Form #1083.Fringe Benefits 110,585 122,677 108,116 122,179 12,606 134,785 (498) 0% 12,108 10% Same as above.Total Salaries and Benefits 607,716 677,007 581,399 675,739 72,006 747,745 (1,268) 0% 70,738 10%OPERATING EXPENSES General Operations 208,062 270,500 220,610 273,000 4,000 277,000 2,500 1% 6,500 2% Increase from Internal Auditor training,
supplies, and memberships on Intake Form #1083.
Minor Capital 701 3,000 800 2,000 - 2,000 (1,000) -33% (1,000) -33% Reduction within the Mayor's Office.Hydro, Water, Sewer, Gas - - - - - - - 0% - 0%Transfers to other Boards, Municipalities, Agencies - - - - - - - 0% - 0%Total Operating Expenses before Debenture Costs and Transfers 208,763 273,500 221,410 275,000 4,000 279,000 1,500 1% 5,500 2%
DEBENTURE COSTS AND TRANSFERSLease Equipment/Property - - - - - - - 0% - 0%Financial Expenses - - - - - - - 0% - 0%Transfer to/from User Rate Reserve Funds - - - - - - - 0% - 0%Transfer to Reserves - - - - - - - 0% - 0%Transfer to Capital Fund - - - - - - - 0% - 0%Total Debenture Costs and Transfers - - - - - - - 0% - 0%Gross Expenditures 816,479 950,507 802,809 950,739 76,006 1,026,745 232 0% 76,238 8% Revenues Other Government Funding (25,000) - - - - - - 0% - 0% Contribution from Reserves/Reserve Funds - - - - - - - 0% - 0% Licences, Permits, Application Fees - - - - - - - 0% - 0% Fines - - - - - - - 0% - 0% Fees, Charges, Service Rentals - - - - - - - 0% - 0% Other Revenue (22,991) - (24,080) (20,000) - (20,000) (20,000) 0% (20,000) 0% Council Constituent Administrator funding
from LUMCO. Total Revenues (47,991) - (24,080) (20,000) - (20,000) (20,000) 0% (20,000) 0% Net Operating Expense/(Revenue) 768,488 950,507 778,729 930,739 76,006 1,006,745 (19,768) -2% 56,238 6%
CHIEF ADMINISTRATIVE OFFICER CAO & Mayor's Office
2016 Base Budget Change Report
to 2015 Approved BudgetBase Budget
Change in 2016
to 2015 Approved BudgetRequested Budget
Change in 2016
57

Executive DirectorAccess Barrie
Rebecca James-Reid
Web and New MediaCoordinator
Pamela MacFadden
Manager of Marketing andPromotionsCheri Harris
Graphic DesignerSandy Friary
Senior CommunicationsAdvisor
Scott Lamantia
Manager of Customer ServiceMonique Kovacs
Communication Clerk(2)
AdministrativeAssistant
Shirley Elliott
CommunicationsAdvisor
Emma Sharpe
Access Barrie Portfolio
Online EngagementAdvisor
Apryl Munro
58

Performance Plan 2016 - ACCESS BARRIE EXECUTIVE PORTFOLIO
Portfolio Goals To develop innovative communication and advertising strategies to build effective relationships internally and externally, address public
relations and marketing needs and identify and encourage opportunities for proactive and positive media coverage. To foster an organization culture that embraces corporate communications as a priority to ensure proactive, consistent and meaningful
communications. To provide policy support and communication services to Council, the Office of the CAO and all other Divisions/Portfolios/Departments to
assist them in their delivery of customer-focused, cost-effective municipal services, strategic issues management and change management. To develop and maintain Strategic Communication, Marketing and Customer Service policies, plans and standards that support Council’s
strategic goals, protect the City’s Corporate Identity and increase Community Engagement. Enhance Customer Service access options across multiple channels and in multiple locations. To advance the City’s interests at all levels of Government both as the City of Barrie and collectively with other municipalities, when doing so
is strategically to our advantage. This includes advocacy meetings with officials of other governments, the Large Urban Mayors Caucus of Ontario (LUMCO), the Association of Municipalities of Ontario and/or Federation of Canadian Municipalities.
Key Portfolio Service Delivery Initiatives Lead and facilitate Intergovernmental relations with other levels of government. Develop innovative and effective marketing campaigns to increase the city’s profile and exposure. Lead and be an ambassador for Cultural Change across the corporation with a focus on customer service through the development of
Corporate Customer Service guidelines and service level expectations. Enhance Customer Service access options by leading the development and implementation of the Customer Contact Centre as approved by
Council. Monitor and lead ongoing enhancements of the after hours call handling system. Provide easily retrievable information for staff when responding to customers through the development of a knowledge management solution
to support contact centre operations. Implement technology solutions to monitor, track and analyze customer interactions. Continue proactive communications externally with the community on City initiatives and improve internal communications within the
corporation. Seek new opportunities for public engagement through the creation of a Community Engagement Strategy; Keep abreast of communication
trends (I.e. online, social media) in an effort to increase dialogue with residents. Develop and begin implementation of a new brand for Barrie. External Factors Influencing Activities & Outcomes General economic conditions Customer Contact Centre could be impacted by organizational change readiness. Relations with other levels of government
59

Corporate Scorecard Indicators All Departments measure performance using a Balanced Scorecard. Access Barrie contributes the following indicators to a corporate scorecard:
Department Indicator 2015 Plan
2015 Forecast
2016 Plan
Access Barrie- Communications
Number of communications strategies written and implemented 35 45 45
Access Barrie- Marketing % increase in the number of visitors to Barrie.ca 12 9 10
Access Barrie- Marketing Total # of impressions on Twitter and Facebook 12M 16.8M 18M
Access Barrie – Customer Service
# of Ping Street “report a Problem” submitted 500 600 700
Budget Summary
2016 Net Requested
Budget
2016 Staffing
Department Base
Complement
Service Level
Changes
Total Requested
Access Barrie $ 1,456,110 11 1 12
60

Performance Plan 2016
Department:
Departmental Overview
Access Barrie
Access Barrie is responsible for leading and overseeing three key areas: Corporate Communications (including intergovernmental affairs, strategic initiatives), Marketing and Customer Service. The Department is comprised of 11 staff supporting each of the three portfolios.
Corporate Communications involves two areas of focus: internal communications and external communications. As the City's primary resource for corporate communication services, the department works closely with staff from all City departments, the Mayor, the CAO and City Council to develop strategic and operational corporate communications plans. Corporate Communications activities include facilitating all aspects of media relations and community awareness of City services and initiatives, which include the preparation of media releases, advisories, monitoring all levels of media to determine the potential impact of issues on the City of Barrie; and managing all critical communications through the role of Emergency Information Officer for the Emergency Control Group. Primary lead for Intergovernmental relations with Municipal, Provincial and Federal Partners.
Marketing activities include maintaining and managing the City's corporate identity through all communication mediums; directing and overseeing the content and use of both the internal and external websites; and City advertising through print (posters, newspapers, brochures), broadcasts (radio and TV), digital video and other online communication tools (external website, Facebook, blogs, Twitter).
Customer Service is leading the multi-year implementation of a corporate wide Customer Service Plan that was approved in principle by Council in September 2014. The major focus of the Plan is to consolidate access to most general city services through developing a Customer Contact Centre as approved by Council in October 2015. The Customer Contact Centre will handle phone, counter and online service requests and introduce customer management and knowledge management technology. Launch of the centre is expected in Q3/Q4 2016. Additional responsibilities include management of the City Switchboard Services (until amalgamated into the contact centre) and After Hours call service contractor management.
Key Departmental Objectives� Continue to improve and expand opportunities for community involvement and feedback regarding city
programs, services and initiatives. � Continue to leverage a variety of communication mediums (print, broadcast, online) to enhance public
communications and marketing opportunities. � Continue to proactively communicate with staff Council's strategic direction, and the corporate
strategic and operational initiatives.� Implementation of the Customer Service Plan to provide new methods of delivery and services that
increase level of satisfaction of customers with their City interactions.� Development of the Corporate Customer Contact centre through collaboration with departments to
effectively and efficiently transition their customer service delivery into the contact centre. � To advance the City’s interests at all levels of Government both as the City of Barrie and collectively
with other municipalities, when doing so is strategically to our advantage. This includes advocacy meetings with officials of other governments, the Large Urban Mayors Caucus of Ontario (LUMCO),
61

the Association of Municipalities of Ontario and/or Federation of Canadian Municipalities. � Develop and begin implementation of a new brand for Barrie.� Develop a formal Citizen Engagement Strategy including a 2016 survey of our residents.
Strategic Plan & Other Program Deliverables� Support all internal and external communication needs of the corporation, City Council and the public
(including the media).� Support all Council goals, strategies and motions.� Execute the Emergency Information Officer role in the City's Emergency Plan, as required.� Monitoring and report progress to Council & the public on the Strategic Plan� Communications and Strategic support of Council's key priorities� Development of the knowledge management system to support the customer contact centre
operations.� Implementation planning and launch of the Customer Contact Centre � Report to Council on status of Customer Contact Centre implementation.
Major Initiatives/Issues
� Expand enhanced marketing and communication tools for use by departments.� Develop and implement the Invest Barrie Communications Plan.� Review and evaluation of Social Media pilot.� Development and implementation of the Customer Contact Centre.� Development of Customer Service standards and service levels for the Customer Contact Centre.� Monitor and lead ongoing enhancements of the After Hours call handling system.� Advocacy for Provincial and Federal Funding for Barrie� Continued support for LUMCO advocacy� Continued support for the Staff Strategic Plan implementation.
Key Performance IndicatorsCommunications
Indicator 2014 Actual 2015 Plan 2015 Projected 2016 Plan# of communications strategies written and implemented
35 35 45 45
% of confirmed recipients who opened each Barrie Digest campaign (avg. gov't open rate 25)
n/a 50 60 60
# of unique users of PingStreet, City App 3034 3500 3800 4250
# of comments made in the Make a Suggestion forum
n/a 450 300 300
MarketingIndicator 2014 Actual 2015 Plan 2015 Projected 2016 Plan
% of increase in the number of visitors to Barrie.ca
11 12 9 10
Number of total Twitter followers and Facebook fans on Corporate social media accounts
14000 16000 17,950 21,000
# of impressions (clicks/likes/ favorites/comments/shares/retweets/follows etc) resulting from our tweets / posts.
n/a 12M 16.8M 18M
Customer ServiceIndicator 2014 Actual 2015 Plan 2015 Projected 2016 Plan
62

# of Ping St "report a problem" submitted 350 500 650 800
Additional KPI's will be developed through 2016 as the Customer Contact Centre gets up and running. Opening is expected in Q3/Q4 of 2016.
n/a na/ na/ tbd
63

2014 2015 2015 2016 Service 2016Actual Approved Forecasted Base Level Requested
Expenditures Budget Expenditure Budget Change(s) Budget$ $ $ $ $ $ $ %
EXPENSESSalaries 776,911 831,818 815,691 906,689 46,820 953,509 121,691 15%Fringe Benefits 185,635 197,920 210,725 217,543 12,068 229,611 31,691 16%Total Salaries and Benefits 962,546 1,029,738 1,026,416 1,124,232 58,888 1,183,120 153,382 15%OPERATING EXPENSESGeneral Operations 371,170 388,520 372,950 345,580 90,000 435,580 47,060 12%Minor Capital 1,075 1,500 1,500 1,500 10,000 11,500 10,000 667%Hydro, Water, Sewer, Gas - - - - - - - 0%Transfers to other Boards, Municipalities, Agencies - - - - - - - 0%
Total Operating Expenses before Debenture Costs and Transfers
372,245 390,020 374,450 347,080 100,000 447,080 57,060 15%
DEBENTURE COSTS AND TRANSFERSLease Equipment/Property - - - - - - - 0%Financial Expenses - - - - - - - 0%Transfer to/from User Rate Reserve Funds - - - - - - - 0%Transfer to Reserves - - - - - - - 0%Transfer to Capital Fund - - - - - - - 0%Total Debenture Costs and Transfers - - - - - - - 0%Gross Expenditures 1,334,791 1,419,758 1,400,866 1,471,312 158,888 1,630,200 210,442 15% Revenues Other Government Funding - - - - - - - 0% Contribution from Reserves/Reserve Funds (4,569) (15,202) - (15,202) - (15,202) - 0% Licences, Permits, Application Fees - - - - - - - 0% Fines - - - - - - - 0% Fees, Charges, Service Rentals - - - - - - - 0% Other Revenue (32,500) - - - (49,000) (49,000) (49,000) 0% Total Revenues (37,069) (15,202) - (15,202) (49,000) (64,202) (49,000) 322% Net Operating Expense/(Revenue) 1,297,722 1,404,556 1,400,866 1,456,110 109,888 1,565,998 161,442 11%
to 2015 Approved BudgetRequested Budget
ACCESS BARRIE DIVISIONEXECUTIVE PORTFOLIO SUMMARY
2016 Base Budget Change Report
Change in 2016
64

ACCESS BARRIEACCESS BARRIE
2014 2015 2015 2016 2017 2018ACTUAL BUDGET FORECAST BUDGET FORECAST FORECAST
EXPENSESSalaries 776,911 831,818 815,691 906,689 920,295 934,106 Fringe Benefits 185,635 197,920 210,725 217,543 220,806 224,118 Total Salaries and Benefits 962,546 1,029,738 1,026,416 1,124,232 1,141,101 1,158,224 OPERATING EXPENSESGeneral Operations 371,170 388,520 372,950 345,580 325,063 336,241 Minor Capital 1,075 1,500 1,500 1,500 1,550 1,600 Hydro, Water, Sewer, Gas - - - - - - Transfers to other Boards, Municipalities, Agencies - - - - - - Total Operating Expenses before Debenture Costs and Transfers 372,245 390,020 374,450 347,080 326,613 337,841 DEBENTURE COSTS AND TRANSFERSLease Equipment/Property - - - - - - Financial Expenses - - - - - - Transfer to/from User Rate Reserve Funds - - - - - - Transfer to Reserves - - - - - - Transfer to Capital Fund - - - - - - Total Debenture Costs and Transfers - - - - - - Gross Expenditures 1,334,791 1,419,758 1,400,866 1,471,312 1,467,714 1,496,065 Revenues Other Government Funding - - - - - - Contribution from Reserves/Reserve Funds (4,569) (15,202) - (15,202) (20,419) (20,419) Licences, Permits, Application Fees - - - - - - Fines - - - - - - Fees, Charges, Service Rentals - - - - - - Other Revenue (32,500) - - - - - Total Revenues (37,069) (15,202) - (15,202) (20,419) (20,419) Net Operating Expense/(Revenue) 1,297,722 1,404,556 1,400,866 1,456,110 1,447,295 1,475,646
CITY OF BARRIE2016 OPERATING BUDGET
EXPENDITURES
65

2014 2015 2015 2016 Service 2016Actual Approved Forecasted Base Level Requested
Expenditures Budget Expenditure Budget Change(s) Budget$ $ $ $ $ $ $ % $ % Comments
EXPENSESSalaries 776,911 831,818 815,691 906,689 46,820 953,509 74,871 9% 121,691 15% Annualization of Citizen Engagement
Advisor and Grid amendments, Customer Contact Centre staff request 2016
Fringe Benefits 185,635 197,920 210,725 217,543 12,068 229,611 19,623 10% 31,691 16% As aboveTotal Salaries and Benefits 962,546 1,029,738 1,026,416 1,124,232 58,888 1,183,120 94,494 9% 153,382 15%OPERATING EXPENSESGeneral Operations 371,170 388,520 372,950 345,580 90,000 435,580 (42,940) -11% 47,060 12% Decrease to base budget to offset new staff
in 2015 as per intake form, Customer Contact Centre Intake Form #331 for 2016 requests
Minor Capital 1,075 1,500 1,500 1,500 10,000 11,500 - 0% 10,000 667% Customer Contact Centre implementation Intake Form #331
Hydro, Water, Sewer, Gas - - - - - - - 0% - 0%Transfers to other Boards, Municipalities, Agencies - - - - - - - 0% - 0%Total Operating Expenses before Debenture Costs and Transfers 372,245 390,020 374,450 347,080 100,000 447,080 (42,940) -11% 57,060 15%
DEBENTURE COSTS AND TRANSFERSLease Equipment/Property - - - - - - - 0% - 0%Financial Expenses - - - - - - - 0% - 0%Transfer to/from User Rate Reserve Funds - - - - - - - 0% - 0%Transfer to Reserves - - - - - - - 0% - 0%Transfer to Capital Fund - - - - - - - 0% - 0%Total Debenture Costs and Transfers - - - - - - - 0% - 0%Gross Expenditures 1,334,791 1,419,758 1,400,866 1,471,312 158,888 1,630,200 51,554 4% 210,442 15% Revenues Other Government Funding - - - - - - - 0% - 0% Contribution from Reserves/Reserve Funds (4,569) (15,202) - (15,202) - (15,202) - 0% - 0% Licences, Permits, Application Fees - - - - - - - 0% - 0% Fines - - - - - - - 0% - 0% Fees, Charges, Service Rentals - - - - - - - 0% - 0% Other Revenue (32,500) - - - (49,000) (49,000) - 0% (49,000) 0% Funding from Water, Wastewater, and
Parking for Intake Form #331. Total Revenues (37,069) (15,202) - (15,202) (49,000) (64,202) - 0% (49,000) 322% Net Operating Expense/(Revenue) 1,297,722 1,404,556 1,400,866 1,456,110 109,888 1,565,998 51,554 4% 161,442 11%
to 2015 Approved Budget to 2015 Approved Budget
2016 Base Budget Change Report
Change in 2016 Change in 2016Base Budget Requested Budget
ACCESS BARRIEAccess Barrie
66

Executive DirectorInnovate Barrie
Rhonda Bunn
Director of InformationTechnology
Carolyn Glaser
Innovation AnalystDana Clarke
Director of Human ResourcesAnne Marie Langlois
Indicates temporarypositions
Senior ERP Portfolio ManagerAngelina Seguin
Innovate Barrie Portfolio
Manager of ApplicationServices
Allan Tayles
Manager of TechnologyServices
Vincent Noome
Manager of IT Planning andPortfolio
Greg Steele (Interim)
Manager of GeographicInformation Services
Brent Harlow
Manager of Safety andWellness
Steve Kullman
Manager of Compensationand Benefits
Brian DeWolfsmith
Manager of Employee andLabour Relations
Karen Wray
67

P P
Ov
K
Performanc
Portfolio Goa
Our vision: “Innovision, we plan to
Continue to eCouncil’s stra
Support a cultemplates andthrough traini
Deliver a repoperformance
Deliver a trandelivering a sdecisions, an
Continue to leResource Pla
Integrate dive Build a positiv
Key Portfolio
Review, revis Rollout a con Continue wor Implement St Develop a co Enhance emp
Corporate-wid Implement re
o No Co V
Implement th Implement th
ce Plan 2016
ls
vate Barrie leverao:
enhance the City’sategic goals lture of continuoud processes for cng and facilitationorting tool that alllevels to staff, co
nsformational ERPsystem that enabld improve organiead the organizatanning (ERP) anderse computer syve, engaged and
Service Deliv
se and enhance thsistent innovationrk on a performantaff Strategic Plan
omprehensive comployee wellness bde peer support g
emaining CorporaNew Wi-Fi DeployCompletion of DisVoice Communicae GIS Strategy, ine Mobility Enable
6 - INNOVAT
ages people and
s portfolio manag
us improvement, ichange managemn lows departmentsommunity and CoP system that brines them to accesizational efficienction through projed related enterprisstems in a way thproductive workp
very Initiatives
he Portfolio Goven and process imnce managementn that includes strmpensation strateby introducing newgroup and fitnesste Technology St
yments to City Fastributed Data Ceations (Telephonencluding developement Plan
TE BARRIE
technology to ign
gement framewor
nnovation and crment and project m
s to accurately meuncil ngs new best prass accurate data icies . ect and change mse software applichat minimizes dupplace culture thro
s
ernance framewoprovement methot system based onrategic workforceegy that is compew initiatives focus
s initiatives trategy recomme
acilities ntre Environmente) Upgrade ment of a data m
EXECUTIVE
nite positive chan
rk to include optim
ross-departmentamanagement, and
easure process p
actices and empowin a timely manne
management initiacations to deliver plication and imp
ough the impleme
rk and report proodology; develop n community outc
e planning and deetitive, cost effectised on employee
ndations, includin
ts, including deplo
management plan
E PORTFOL
nge and inspire pr
mal allocation of r
al communication d building the cap
performance and
wers our staff, inter, provide inform
atives throughout r transformationalroves data acces
entation of the Sta
gress updates to training material
comes and legislaevelopment (focusive and aligned w
e mental and phys
ng
oyments of new s
LIO
rogressive solutio
resources and en
through the use pacity and capab
build dashboards
ternal partners, amation required to
the implementatl business systemss and sharing acaff Strategic Plan
o Council on a qua, facilitations andated reporting strs areas for 2016)
with Corporate strsical health includ
server, network a
ons”. In our realiz
sure alignment w
of standardized tility in the organiz
s that communica
and decision mako make informativ
ion of the Enterprms. cross the corporat
arterly basis d education prograructures
rategic objectivesding the developm
and storage techn
zation of this
with
tools, zation
ate
ers by ve business
rise
tion
ams for staff
s ment of a
nology
68

E
C A
D
H
I
Implement ne Implement ne Upgrade wor Complete the
Phase II)
External Fact
General econ
Corporate Sco
All Departments m
Department
Human Resourc
IT
ew Building Permew Energy Managk order managem
e implementation
ors Influencin
nomic conditions
orecard Indic
measure perform
Indicator
ces
# lost time
Cost of los
Avg. # sick
Quarterly %
Corporate
% turnove
% turnove
Internal Pr
% grievanc
% grievanc
Annual nu
Corporate
City of Ba
mit Application Solgement Solution
ment solution withof the ERP Proje
ng Activities &
cators
ance using a Bal
accidents
st time accidents
k/STD/LTD/WSIB
% EFAP usage
training $ spent p
r voluntary
r in first 2 years o
romotion rate
ce rate CUPE
ce rate BPFFA
umber of visits to
e Network availab
rrie Website avai
lution (Accela)
h new functionalitiect for Phase I (in
& Outcomes
anced Scorecard
B days per employ
per permanent em
of employment
the City of Barrie
bility
lability
ies cludes all items i
d. Innovate Barrie
yee
mployee
e’s website
n the project scop
e contributes the f
20Pl
5
$40
9.
19
$53
4.5
0.5
4
5
2
2.9 m
99.9
99
pe; budget and ta
following indicato
015 lan
2015 Forecac
5 12
0,000 $69,37
50 9.0
9% 12.55%
3.00 $53.00
5% 3.8%
5% 0%
4% 6%
5% 7%
2% 2%
million 2.96 millio
99% 99.997%
9% 99.7%
ax to be impleme
ors to a corporate
cst 2016 Plan
5
9 $40,000
9.0
% 19%
0 $100.00
3.5%
0%
6%
5%
2%
on 3 million
% 99.998%
% 99.9%
nted in
scorecard:
69

B
Budget Summ
Department
Innovate Barrie
Human Resourc
IT
TOTAL
mary
Admin
ces
2016 NReques
Budge
$ 330,5
$ 2,219,9
$ 6,278,0
$ 8,828,5
Net ted et
BaseComplem
516 2
908 15
081 41
505 58
2016 Staffi
e ment
ServicLevel
Change
0
0
6
6
ng e es
Total Requested
2
15
47
64
d
70

2014 2015 2015 2016 Service 2016Actual Approved Forecasted Base Level Requested
Expenditures Budget Expenditure Budget Change(s) Budget$ $ $ $ $ $ $ %
EXPENSESSalaries 4,255,851 5,191,894 4,873,743 5,355,551 273,888 5,629,439 437,545 8%Fringe Benefits 1,008,693 1,623,247 1,659,426 1,291,390 73,133 1,364,523 (258,724) -16%Total Salaries and Benefits 5,264,544 6,815,141 6,533,169 6,646,941 347,021 6,993,962 178,821 3%OPERATING EXPENSESGeneral Operations 2,837,394 3,146,457 3,167,203 3,295,484 269,030 3,564,514 418,057 13%Minor Capital 84,133 78,690 68,824 84,500 13,910 98,410 19,720 25%Hydro, Water, Sewer, Gas 14,100 18,800 13,603 16,799 - 16,799 (2,001) -11%Transfers to other Boards, Municipalities, Agencies - - - - - - - 0%
Total Operating Expenses before Debenture Costs and Transfers
2,935,627 3,243,947 3,249,630 3,396,783 282,940 3,679,723 435,776 13%
DEBENTURE COSTS AND TRANSFERSLease Equipment/Property 2,053 2,100 767 2,100 - 2,100 - 0%Financial Expenses - - - - - - - 0%Transfer to/from User Rate Reserve Funds - - - - - - - 0%Transfer to Reserves - - - - - - - 0%Transfer to Capital Fund - - - - - - - 0%Total Debenture Costs and Transfers 2,053 2,100 767 2,100 - 2,100 - 0%Gross Expenditures 8,202,224 10,061,188 9,783,566 10,045,824 629,961 10,675,785 614,597 6% Revenues Other Government Funding (191,259) (193,410) (192,400) (204,103) - (204,103) (10,693) 6% Contribution from Reserves/Reserve Funds (83,701) (287,606) (221,178) (400,373) (161,530) (561,903) (274,297) 95% Licences, Permits, Application Fees - - - - - - - 0% Fines - - - - - - - 0% Fees, Charges, Service Rentals (61,856) (63,500) (65,528) (66,000) - (66,000) (2,500) 4% Other Revenue (540,800) (532,321) (549,719) (546,843) (128,943) (675,786) (143,465) 27% Total Revenues (877,616) (1,076,837) (1,028,825) (1,217,319) (290,473) (1,507,792) (430,955) 40% Net Operating Expense/(Revenue) 7,324,608 8,984,351 8,754,741 8,828,505 339,488 9,167,993 183,642 2%
to 2015 Approved BudgetRequested Budget
INNOVATE BARRIE DIVISIONEXECUTIVE PORTFOLIO SUMMARY
2016 Base Budget Change Report
Change in 2016
71

INNOVATE BARRIEINNOVATE BARRIE ADMINISTRATION
2014 2015 2015 2016 2017 2018ACTUAL BUDGET FORECAST BUDGET FORECAST FORECAST
EXPENSESSalaries 259,367 269,094 261,184 261,518 265,441 269,422 Fringe Benefits 53,565 57,884 62,405 56,498 57,346 58,206 Total Salaries and Benefits 312,932 326,978 323,589 318,016 322,787 327,628 OPERATING EXPENSESGeneral Operations 12,394 12,500 12,058 12,500 12,500 12,500 Minor Capital - - - - - - Hydro, Water, Sewer, Gas - - - - - - Transfers to other Boards, Municipalities, Agencies - - - - - - Total Operating Expenses before Debenture Costs and Transfers 12,394 12,500 12,058 12,500 12,500 12,500 DEBENTURE COSTS AND TRANSFERSLease Equipment/Property - - - - - - Financial Expenses - - - - - - Transfer to/from User Rate Reserve Funds - - - - - - Transfer to Reserves - - - - - - Transfer to Capital Fund - - - - - - Total Debenture Costs and Transfers - - - - - - Gross Expenditures 325,326 339,478 335,647 330,516 335,287 340,128 Revenues Other Government Funding (6,750) - - - - - Contribution from Reserves/Reserve Funds - - - - - - Licences, Permits, Application Fees - - - - - - Fines - - - - - - Fees, Charges, Service Rentals - - - - - - Other Revenue - (10,000) (11,727) - - - Total Revenues (6,750) (10,000) (11,727) - - - Net Operating Expense/(Revenue) 318,576 329,478 323,920 330,516 335,287 340,128
CITY OF BARRIE2016 OPERATING BUDGET
EXPENDITURES
72

2014 2015 2015 2016 Service 2016Actual Approved Forecasted Base Level Requested
Expenditures Budget Expenditure Budget Change(s) Budget$ $ $ $ $ $ $ % $ % Comments
EXPENSESSalaries 259,367 269,094 261,184 261,518 - 261,518 (7,576) -3% (7,576) -3%Fringe Benefits 53,565 57,884 62,405 56,498 - 56,498 (1,386) -2% (1,386) -2%Total Salaries and Benefits 312,932 326,978 323,589 318,016 - 318,016 (8,962) -3% (8,962) -3%OPERATING EXPENSESGeneral Operations 12,394 12,500 12,058 12,500 - 12,500 - 0% - 0%Minor Capital - - - - - - - 0% - 0%Hydro, Water, Sewer, Gas - - - - - - - 0% - 0%Transfers to other Boards, Municipalities, Agencies - - - - - - - 0% - 0%Total Operating Expenses before Debenture Costs and Transfers 12,394 12,500 12,058 12,500 - 12,500 - 0% - 0%
DEBENTURE COSTS AND TRANSFERSLease Equipment/Property - - - - - - - 0% - 0%Financial Expenses - - - - - - - 0% - 0%Transfer to/from User Rate Reserve Funds - - - - - - - 0% - 0%Transfer to Reserves - - - - - - - 0% - 0%Transfer to Capital Fund - - - - - - - 0% - 0%Total Debenture Costs and Transfers - - - - - - - 0% - 0%Gross Expenditures 325,326 339,478 335,647 330,516 - 330,516 (8,962) -3% (8,962) -3% Revenues Other Government Funding (6,750) - - - - - - 0% - 0% Contribution from Reserves/Reserve Funds - - - - - - - 0% - 0% Licences, Permits, Application Fees - - - - - - - 0% - 0% Fines - - - - - - - 0% - 0% Fees, Charges, Service Rentals - - - - - - - 0% - 0% Other Revenue - (10,000) (11,727) - - - 10,000 -100% 10,000 -100% AMCTO position funding removed as it
changed to Council Constituent Administrator funded by LUMCO in the CAO's Office.
Total Revenues (6,750) (10,000) (11,727) - - - 10,000 -100% 10,000 -100% Net Operating Expense/(Revenue) 318,576 329,478 323,920 330,516 - 330,516 1,038 0% 1,038 0%
Base Budget Requested Budgetto 2015 Approved Budget to 2015 Approved Budget
INNOVATE BARRIEInnovate Barrie Administration
2016 Base Budget Change Report
Change in 2016 Change in 2016
73

Director of InformationTechnology
Carolyn Glaser
Service Desk SupervisorFrank Barbaro
Supervisor of TechnologyOperations
Arshdeep Singh
Manager of ApplicationServices
Allan Tayles
Manager of TechnologyServices
Vincent Noome
Administrative Assistant -IT
Lisa Huitema
Supervisor of EnterpriseApplications
John Mastroianni
Manager of IT Planning andPortfolio
Greg Steele (Interim)
Supervisor of BusinessApplications
Vacant
Manager of GeographicInformation Services
Brent Harlow
Innovate Barrie PortfolioInformation Technology Department
New Approved 2015Non-Union Position
Vacant
74

Performance Plan 2016
Department:
Departmental Overview
IT
IT provides information technology expertise and professional services to all City departments, affiliated agencies (Barrie Public Library, Barrie Police Services) and area municipalities receiving Barrie fire dispatch services. The Department is responsible for delivering, administering, managing and supporting (in partnership with the business units) all data and voice communications, including but not limited to network infrastructure, servers, storage infrastructure, printers, computing infrastructure, applications and software, databases, web services, geographic information systems, and project and portfolio management. IT provides daily technology support to over 1100 users at more than 40 City locations across the City. The Department is organized into five branches.
Administration Branch
The Administration branch requires approximately 6% of the Department's staff resources to perform the following services in support of the Department's program areas:
� Strategic Planning, Leadership and Visioning - from a department and corporate strategic level� Financial and Resource Management - includes payroll, performance and variance reporting,
budget planning, budget management, purchasing and invoicing activities, and resource planning� Staff Management - includes performance appraisals, team building, organization and change
management, relationship management, and staff development activities� Administrative Duties - includes office support, furniture and office supplies, policies, and
procedures� IT Purchasing and Procurement - includes requisitions, invoices, purchase orders, inquiries, and
vendor management
Application Services Branch
The Application Services branch requires approximately 25% of the Department's staff resources to perform the following services:
� 24x7 Support - provide 24x7 support for public safety services including Fire Dispatching, Water and Wastewater operations.
� Application and Solutions Development - collaboratively architect, design, implement and support new system solutions (commercial off the shelf and/or internally built).
� Enterprise Application and Solution Support – provide support for all key corporate enterprise and business systems and databases.
� Support over $3.5 million in recreation transactions and $1 million in building permit transactions annually.
� Database - support the backup, maintenance, optimization and security of over 3TB of organized data.
� Internal and External Website – support, maintain and perform all daily technical administration tasks for the internal and externally facing corporate websites, including content and e-services.
� Application Support and Leadership - provide application-specific subject matter expertise for information technology projects.
� Server and Desktop Software - manage software and application licensing for the City.
Technology Services Branch
The Technology Services Branch utilizes 39% of the Department's staff resources to provide the following services associated with computing and network infrastructure and security, service desk,
75

telecommunications, mobility and IT asset management:� 24x7 support for public safety services including Fire Dispatching, and Water/Wastewater
SCADA communications. � Telecommunications - ensure the voice communications services are provided throughout the City. � Network Infrastructure - use both wireless and wired technologies to deliver connectivity for
technology services delivered to 42 sites.� Radio Networks - provide support for first responder services of the Barrie Police Service and the
Barrie Fire & Emergency Service and all the 2-way radio communications requirements of all the Departments of the City.
� Data Network Equipment - provide support for all data and network infrastructure. � Technology Leadership- collaborate with all departments to provide technology specification
requirements for new facilities, projects and administrative functions. � Technical User Support (AskIT) - provide service request management and technology support and
training.� Desktop Equipment - Provide installation and maintenance support for 1100 computing equipment. � Asset tracking - track and management of computing equipment.
IT Planning and Portfolio Branch
The IT Planning and Portfolio Branch requires approximately 12% of the Department's staff resources to perform the following services:
� Provide Project Management leadership and/or coordination of information technology projects within IT and across all City departments.
� Maintain project management methodology standards within IT adhering to Corporate project management methodologies and technology.
� Provide IT Department coordination on all technology projects to ensure corporate strategic alignment, effective resource and financial planning and adherence to governance processes.
� Provide leadership sequencing projects based on project priority, department objectives and availability of resources.
� Provide regular status reporting on project health, project schedules and project budgets. � Promote Project Management within IT and other City Departments as the means of maximizing
the full value of project initiatives.� Continue to build strong partnerships with all City departments and all project stakeholders.
Geographic Information Services Branch
The Geographic Information Services Branch utilizes 18% of the Department's staff resources to provide the following services:
� Manage, administer and support all corporate Geographic Information Systems. � Support, maintain and perform regular administration to the Fire Dispatching and Internal, External
and mobile GIS systems � Provide subject matter expertise on GIS related projects � Obtain, support and maintain corporate enterprise spatial, asset and related datasets � Develop and design the corporate GIS application and database architecture � Integrate GIS functionality into corporate systems and business process � Provide mapping products and information to internal and external stakeholders � Develop spatial agreements and partner with external agencies to share and obtain spatial
information
Key Departmental Objectives� Maintain existing technology operations and infrastructure for the Corporation � Enhance network, computing and mobility environments to meet existing and new business
requirements of the City � Ensure technology systems and equipment support new project readiness regarding network
performance, data storage and server stability; and disaster recovery/business continuity initiatives � Identify, implement and manage new and upgraded business application and technology
infrastructure solutions to meet service delivery needs � Provision and support technology (communications and computing equipment) for the 2014-2018
Council members � Support and manage technology infrastructure for affiliated agencies (Barrie Public Library, Barrie
76

Police) � Support and manage technology systems (hardware, software) for fire dispatch services � Provide secure, accessible technology services to the corporation that align with the City's
operational and strategic objectives � Provide enhanced public access to services through online(web) applications � Manage the corporation's investment in technology so that its total cost of ownership is minimized
Strategic Plan & Other Program DeliverablesUpgrade/optimization of corporate systems and technology:
� Computerized Maintenance Management Systems (Cityworks & Archibus) � New Wi-Fi Deployments to City Facilities� Completion of Distributed Data Centre Environments, including deployments of new server, network
and storage technology � Voice Communications (Telephone) Upgrade
Implement new enterprise and business applications � Building Permit Application Solution (Accela)� Land and Growth Application Solution (Accela) � Enterprise Resource Planning (SAP) � Energy Management Solution� Unified Communications (e.g. Instant Messaging) Solution
Major Initiatives/Issues� Implement remaining Corporate Technology Strategy recommendations� Implement the GIS Strategy, including development of a data management plan� Implement the Mobility Enablement Plan� Continue to optimize the use of corporate applications by business units� Manage IT projects in alignment with Corporate Governance� Ongoing transformation of IT from 'service provider' to 'service partner'� Support process re-engineering and change management
Key Performance IndicatorsEnergy Conservation
Indicator 2014 Actual 2015 Plan 2015 Projected 2016 PlanRatio of Virtual to Physical Servers 70:30 75:25 84:16 85:15
Enhanced Public Access to Services through Online Applications Indicator 2014 Actual 2015 Plan 2015 Projected 2016 Plan
Annual Number of Visits to the City of Barrie Website
2.8 million 2.9 million 2.96 million 3 million
Technology AvailabilityIndicator 2014 Actual 2015 Plan 2015 Projected 2016 Plan
Corporate Network Availability 99.8% 99.99% 99.997% 99.998%
City of Barrie Website Availability 97% 99% 99.7% 99.9%
77

INNOVATE BARRIEINFORMATION TECHNOLOGY
2014 2015 2015 2016 2017 2018ACTUAL BUDGET FORECAST BUDGET FORECAST FORECAST
EXPENSESSalaries 2,917,341 3,477,365 3,347,186 3,588,566 3,721,642 3,777,599 Fringe Benefits 668,663 829,501 862,952 862,579 889,832 903,179 Total Salaries and Benefits 3,586,004 4,306,866 4,210,138 4,451,145 4,611,474 4,680,778 OPERATING EXPENSESGeneral Operations 2,531,643 2,813,242 2,806,603 2,945,856 3,093,491 3,134,291 Minor Capital 84,133 78,690 68,824 79,500 79,500 79,500 Hydro, Water, Sewer, Gas 14,100 18,800 13,603 16,799 17,572 18,398 Transfers to other Boards, Municipalities, Agencies - - - - - - Total Operating Expenses before Debenture Costs and Transfers 2,629,876 2,910,732 2,889,030 3,042,155 3,190,563 3,232,189 DEBENTURE COSTS AND TRANSFERSLease Equipment/Property 2,053 2,100 767 2,100 2,100 2,100 Financial Expenses - - - - - - Transfer to/from User Rate Reserve Funds - - - - - - Transfer to Reserves - - - - - - Transfer to Capital Fund - - - - - - Total Debenture Costs and Transfers 2,053 2,100 767 2,100 2,100 2,100 Gross Expenditures 6,217,933 7,219,698 7,099,935 7,495,400 7,804,137 7,915,067 Revenues Other Government Funding (184,509) (193,410) (192,400) (204,103) (215,200) (225,700) Contribution from Reserves/Reserve Funds (83,701) (287,606) (221,178) (400,373) (391,049) (393,765) Licences, Permits, Application Fees - - - - - - Fines - - - - - - Fees, Charges, Service Rentals (61,856) (63,500) (65,528) (66,000) (67,000) (68,000) Other Revenue (540,800) (522,321) (544,942) (546,843) (553,047) (559,345) Total Revenues (870,866) (1,066,837) (1,024,048) (1,217,319) (1,226,296) (1,246,810) Net Operating Expense/(Revenue) 5,347,067 6,152,861 6,075,887 6,278,081 6,577,841 6,668,257
CITY OF BARRIE2016 OPERATING BUDGET
EXPENDITURES
78

2014 2015 2015 2016 Service 2016Actual Approved Forecasted Base Level Requested
Expenditures Budget Expenditure Budget Change(s) Budget$ $ $ $ $ $ $ % $ % Comments
EXPENSESSalaries 2,917,341 3,477,365 3,347,186 3,588,566 206,688 3,795,254 111,201 3% 317,889 9% Increase due to lower than expected 2015
forecasted salaries as a result of staff transfers and delays in recruitment.
Fringe Benefits 668,663 829,501 862,952 862,579 56,333 918,912 33,078 4% 89,411 11%Total Salaries and Benefits 3,586,004 4,306,866 4,210,138 4,451,145 263,021 4,714,166 144,279 3% 407,300 9%OPERATING EXPENSESGeneral Operations 2,531,643 2,813,242 2,806,603 2,945,856 179,030 3,124,886 132,614 5% 311,644 11% Increase due to addition of new software
maintenance costs for two new enterprise application systems (SAP - $275,000 and Accela - $70,000).
Minor Capital 84,133 78,690 68,824 79,500 13,910 93,410 810 1% 14,720 19%Hydro, Water, Sewer, Gas 14,100 18,800 13,603 16,799 - 16,799 (2,001) -11% (2,001) -11% Decrease due to budget adjustment
(changed calculation methodology).Transfers to other Boards, Municipalities, Agencies - - - - - - - 0% - 0%Total Operating Expenses before Debenture Costs and Transfers 2,629,876 2,910,732 2,889,030 3,042,155 192,940 3,235,095 131,423 5% 324,363 11%
DEBENTURE COSTS AND TRANSFERSLease Equipment/Property 2,053 2,100 767 2,100 - 2,100 - 0% - 0%Financial Expenses - - - - - - - 0% - 0%Transfer to/from User Rate Reserve Funds - - - - - - - 0% - 0%Transfer to Reserves - - - - - - - 0% - 0%Transfer to Capital Fund - - - - - - - 0% - 0%Total Debenture Costs and Transfers 2,053 2,100 767 2,100 - 2,100 - 0% - 0%Gross Expenditures 6,217,933 7,219,698 7,099,935 7,495,400 455,961 7,951,361 275,702 4% 731,663 10% Revenues Other Government Funding (184,509) (193,410) (192,400) (204,103) - (204,103) (10,693) 6% (10,693) 6% Increase due to growth in fire dispatching
revenues. Contribution from Reserves/Reserve Funds (83,701) (287,606) (221,178) (400,373) (161,530) (561,903) (112,767) 39% (274,297) 95% Increase due to recovery from additional
reserve funds (fed gas tax reserve, building reserve, WSIB).
Licences, Permits, Application Fees - - - - - - - 0% - 0% Fines - - - - - - - 0% - 0% Fees, Charges, Service Rentals (61,856) (63,500) (65,528) (66,000) - (66,000) (2,500) 4% (2,500) 4% Other Revenue (540,800) (522,321) (544,942) (546,843) (128,943) (675,786) (24,522) 5% (153,465) 29% Decrease due to reduction in water and
wastewater reserves for contract staff. Total Revenues (870,866) (1,066,837) (1,024,048) (1,217,319) (290,473) (1,507,792) (150,482) 14% (440,955) 41% Net Operating Expense/(Revenue) 5,347,067 6,152,861 6,075,887 6,278,081 165,488 6,443,569 125,220 2% 290,708 5%
Change in 2016 Change in 2016Base Budget Requested Budget
to 2015 Approved Budget to 2015 Approved Budget
INNOVATE BARRIEInformation Technology Department
2016 Base Budget Change Report
79

Director of Human ResourcesAnne Marie Langlois
Manager of Safetyand Wellness
Steven Kullman
Manager of Employee andLabour Relations
Karen Wray
HR Analyst –PerformanceManagementKim Hickling
AccessibilityCoordinatorCheryl Dillon
Indicates temporaryposition
Human ResourcesCoordinator
Vacant
Manager of Compensationand Benefits
Brian DeWolfsmith
Strategic WorkforcePlanning Specialist
Erin Christopher
Innovate Barrie PortfolioHuman Resources Department
80

Performance Plan 2016
Department:
Departmental Overview
Human Resources
The Department develops and guides the Corporation's human resource policy framework and includes three branches: Compensation and Benefits, Safety and Wellness and Employee and Labour Relations. The managers in each branch, along with the Director also assist in labour and employee relations as well as other administrative functions.
Corporate Human Resources Administration
Provides expert guidance, advice and leadership on all matters related to human resources management including employee relations, labour-management relations, organizational design, recruitment and selection of senior and executive staff, and employee related legislation. Provides support for Human Resource Planning including but not limited to organizational design, restructuring, HR strategic planning and succession planning.Provides support for employee relations, including employee terminations, handling and resolving employee-relations problems, promoting staff morale and well-being; workplace violence and workplace human rights, tolerance and harmony.Provides labour relations support including collective bargaining for two bargaining units, advice to management regarding discipline, grievance administration, attending regular Labour-Management meetings and assisting management with local labour-management committee meetings.Provides expert guidance and advice to all staff regarding the AODA legislation and the IASR standards. Ensures compliance is met and maintained internally and from a community perspective, sits on the AAC as a member and managing all accessibility related complaints.Leads the assessment, design and development of training programs and other performance interventions to enhance the capabilities of individuals and teams within the Corporation. Collects data for Key Performance Indicators, employee demographics and the departmental balanced scorecard.Compensation and Benefits
Provides expert guidance, advise and leadership in the area of compensation and benefits. This includes job classification, job evaluation, pay equity, administration of HR policies and procedures as well as Collective agreements provisions regarding salary, benefits, promotions, transfers, premiums.Provides oversight for all benefit related contracts. This includes extended health and dental, life, AD&D and long term disability insurance coverage.Provides oversight and guidance for all payroll and pension related items including legislative compliance, labour relations and process improvements.Safety and Wellness
Provides expert guidance, advice, and leadership on occupational health and safety, disability management (accommodation, WSIB, sick leave, short-term disability, long-term disability, attendance management), Employee Assistance Program oversight and workplace violence.Coordinates the Joint Health and Safety CommitteeProvides and/or coordinates health and safety related trainingInvestigates and/or assists in the coordination of investigations under the Violence in the Workplace Program and the Workplace Human Rights Program.Provides support in occupational health and safety and disability management, including accident prevention, WSIB claims management and modified work arrangements.
81

Employee and Labour Relations
Provides expert guidance, advice and leadership on recruitment procedures, advertising, job posting, candidate selection, job offers, seniority issues, orientation, staff and corporate development, performance management and performance measurement.Provides support for employee relations, including employee terminations, handling and resolving employee-relations problems, promoting staff morale and well-being; workplace violence and workplace human rights, tolerance and harmony.Provides labour relations support including collective bargaining for two bargaining units, advice to management regarding discipline, grievance administration, attending regular Labour-Management meetings and assisting management with local labour-management committee meetings.
Key Departmental ObjectivesProvide the City's Departments with the business infrastructure to:
� Invest in staff to improve workforce effectiveness � Develop and energetic and inspiring leadership group � Attract and retain top talent � Build respectful relationships with Unions � Ensure employee well-being
Strategic Plan & Other Program Deliverables� Implement the Staff Strategic Plan � Develop a Compensation Strategy � Enhance Employee Wellness
Major Initiatives/Issues� Support ERP implementation � Deploy the 2016 Priorities of the Staff Strategic Plan � Develop supporting policies, procedures and tools to support the Compensation Strategy� Develop supporting policies, procedures and tools to support the Wellness Initiatives
Key Performance IndicatorsInvest in Staff to improve workforce effectiveness
Indicator 2014 Actual 2015 Plan 2015 Projected 2016 PlanCorporate training $ spent per permanent employee
$55.19 $53.00 $53.00 $100.00
% Departmental Budget allocated to training 103 100 75 100
Attract and retain top employeesIndicator 2014 Actual 2015 Plan 2015 Projected 2016 Plan
% turnover (voluntary) 3.8 4.5 3.8 4.5
% turnover in first 2 yrs of employment 0.48 0.5 0 0
Internal Promotion rate 6.2 4% 6% 6%
Build respectful relationships with UnionsIndicator 2014 Actual 2015 Plan 2015 Projected 2016 Plan
% grievance rate CUPE 5.2 5.0 7.0 5%
% grievance rate BPFFA 1.2 2.0 2.0 2%
Ensure employee well-beingIndicator 2014 Actual 2015 Plan 2015 Projected 2016 Plan
# lost time accidents 6 5 12 5
82

Cost of lost time accidents $47,900 $40,000 $69,379 $40,000
Avg # sick/STD/LTD/WSIB days per employee
9.44 9.50 9.0 9.0
Quarterly % EFAP usage 17.2 19.0 12.55 19%
83

INNOVATE BARRIEHUMAN RESOURCES
2014 2015 2015 2016 2017 2018ACTUAL BUDGET FORECAST BUDGET FORECAST FORECAST
EXPENSESSalaries 1,079,143 1,445,435 1,265,373 1,505,467 1,567,949 1,498,551 Fringe Benefits 286,465 735,862 734,069 372,313 385,883 399,681 Total Salaries and Benefits 1,365,608 2,181,297 1,999,442 1,877,780 1,953,832 1,898,232 OPERATING EXPENSESGeneral Operations 293,357 320,715 348,542 337,128 330,025 351,320 Minor Capital - - - 5,000 5,000 5,000 Hydro, Water, Sewer, Gas - - - - - - Transfers to other Boards, Municipalities, Agencies - - - - - - Total Operating Expenses before Debenture Costs and Transfers 293,357 320,715 348,542 342,128 335,025 356,320 DEBENTURE COSTS AND TRANSFERSLease Equipment/Property - - - - - - Financial Expenses - - - - - - Transfer to/from User Rate Reserve Funds - - - - - - Transfer to Reserves - - - - - - Transfer to Capital Fund - - - - - - Total Debenture Costs and Transfers - - - - - - Gross Expenditures 1,658,965 2,502,012 2,347,984 2,219,908 2,288,857 2,254,552 Revenues Other Government Funding - - - - - - Contribution from Reserves/Reserve Funds - - - - - - Licences, Permits, Application Fees - - - - - - Fines - - - - - - Fees, Charges, Service Rentals - - - - - - Other Revenue - - 6,950 - - - Total Revenues - - 6,950 - - - Net Operating Expense/(Revenue) 1,658,965 2,502,012 2,354,934 2,219,908 2,288,857 2,254,552
CITY OF BARRIE2016 OPERATING BUDGET
EXPENDITURES
84

2014 2015 2015 2016 Service 2016Actual Approved Forecasted Base Level Requested
Expenditures Budget Expenditure Budget Change(s) Budget$ $ $ $ $ $ $ % $ % Comments
EXPENSESSalaries 1,079,143 1,445,435 1,265,373 1,505,467 67,200 1,572,667 60,032 4% 127,232 9% Significant reduction due to the
redistribution of salary related accounts to the Departments held Corporately for negotiation purposes and JE Project
Fringe Benefits 286,465 735,862 734,069 372,313 16,800 389,113 (363,549) -49% (346,749) -47% Significant reduction due to the redistribution of benefit related accounts to the Departments held Corporately for negotiation purposes
Total Salaries and Benefits 1,365,608 2,181,297 1,999,442 1,877,780 84,000 1,961,780 (303,517) -14% (219,517) -10%OPERATING EXPENSESGeneral Operations 293,357 320,715 348,542 337,128 90,000 427,128 16,413 5% 106,413 33%Minor Capital - - - 5,000 - 5,000 5,000 #DIV/0! 5,000 0% New minor Capital contingency fund
intended to support Corporately required accommodation needs specific to work stations. Centralizing a cost that was being absorbed by impacted Departments so that work stations can be reassigned by HR based on needs.
Hydro, Water, Sewer, Gas - - - - - - - 0% - 0%Transfers to other Boards, Municipalities, Agencies - - - - - - - 0% - 0%Total Operating Expenses before Debenture Costs and Transfers 293,357 320,715 348,542 342,128 90,000 432,128 21,413 7% 111,413 35%
DEBENTURE COSTS AND TRANSFERSLease Equipment/Property - - - - - - - 0% - 0%Financial Expenses - - - - - - - 0% - 0%Transfer to/from User Rate Reserve Funds - - - - - - - 0% - 0%Transfer to Reserves - - - - - - - 0% - 0%Transfer to Capital Fund - - - - - - - 0% - 0%Total Debenture Costs and Transfers - - - - - - - 0% - 0%Gross Expenditures 1,658,965 2,502,012 2,347,984 2,219,908 174,000 2,393,908 (282,104) -11% (108,104) -4% Revenues Other Government Funding - - - - - - - 0% - 0% Contribution from Reserves/Reserve Funds - - - - - - - 0% - 0% Licences, Permits, Application Fees - - - - - - - 0% - 0% Fines - - - - - - - 0% - 0% Fees, Charges, Service Rentals - - - - - - - 0% - 0% Other Revenue - - 6,950 - - - - 0% - 0% Related to a late invoice from 2014. Do not
anticipate this in 2016. Total Revenues - - 6,950 - - - - 0% - 0% Net Operating Expense/(Revenue) 1,658,965 2,502,012 2,354,934 2,219,908 174,000 2,393,908 (282,104) -11% (108,104) -4%
INNOVATE BARRIEHuman Resources Department
2016 Base Budget Change Report
Change in 2016 Change in 2016Base Budget Requested Budget
to 2015 Approved Budget to 2015 Approved Budget
85

Executive DirectorInvest Barrie
Zvi Lifshiz
Director of CultureRudi Quammie Williams
Director of BusinessDevelopment
Stephannie Schlichter
Airport Manager – LSRAMike Drumm
Indicates temporaryposition
Indicates that positionexists outside of City ofBarrie Staff Complement
Invest Barrie Portfolio
86

Performance Plan 2016 - INVEST BARRIE EXECUTIVE PORTFOLIO
Portfolio Goals
To begin implementing the Invest Barrie Strategy, with a focus on the Startup Ecosystem, Innovation, Talent Attraction, and Investment Attraction activities.
To introduce tools that will allow the division to track progress, measure results against the strategic objectives and make necessary adjustments
To earn and maintain a strong reputation for delivery excellence amongst Barrie’s business community, as well as our partners, so as to
establish the necessary credibility and network required to implement the Invest Barrie Strategy. Key Portfolio Service Delivery Initiatives
Create and begin to deploy a plan for increasing the level of engagement with the broader business community in support of the economic development strategy and several departmental initiatives.
In conjunction with ecosystem partners, scale the number of initiatives aimed at growing the startup ecosystem and startup culture in Barrie. These include: offering acceleration support services in Barrie, providing industry-targeted entrepreneurship training (food industry, creative industry including creative technology), hosting startup events, and growing the startup ecosystem.
Implement a minimum of 2 “Open Innovation” pilot programs. Develop a series of “Innovation Workshops” aimed at providing value to the employer community and supporting innovation programs
within the business community. Conduct research into the feasibility, costs and benefits of a film office (and promoted film industry) in Barrie. Increase the growth of culture and creative entrepreneurs into the broader entrepreneurship ecosystem. Develop a talent attraction plan, and begin to pilot talent attraction initiatives. Conducted comprehensive business architecture review of the City to guide decision-making related to Business Retention & Expansion,
development of cluster-based strategies, planning of supply chain based attraction strategies, and more. Begin deployment of the sponsorship strategy throughout the corporation Engage in efforts to align the organization with initiatives that reduce barriers to investment and promote a pro-business approach. Deploy a pilot program that provides support to employers who wish to apply for a government grant in support of new job creation, new
innovation investment, expansion, and more. Begin to pursue integration with Tourism Barrie as part of new model. Deploy a robust accountability framework for culture-based grants and other investments. Develop a business case for a downtown entrepreneurship centre. Begin implementing targeted lead generation and promotion program. Continue implementation of disposition plan for Downtown Parking Lots.
87

External Factors Influencing Activities & Outcomes
General economic conditions Trends or changes in target industries (e.g. changes in the dollar exchange rate) Regulatory environment from other levels of government Availability of government funding for innovation, new business investment, and other related activities
Corporate Scorecard Indicators
All Departments measure performance using a Balanced Scorecard. Invest Barrie contributes the following indicators to a corporate scorecard:
Department Indicator 2015 Plan
2015 Projected
2016 Plan
Business Development
Number of new, prospective start-up entrepreneurs that engage with the City through start-up cluster initiatives
100 100 60
Proportion of new businesses participating in Invest Barrie events/initiatives. (New is defined as businesses not previously engaged with Invest Barrie)
NA NA 10%
Number of Business Leaders that are actively engaged in projects/initiatives that support the Invest Barrie strategy.
NA NA 75
Culture
Number of events in the downtown that engage business and the creative sector NA NA 8
Percentage of workshop participants with a year-end increase in revenue or audience 75% 85% 85%
88

Budget Summary
2016 Net Requested
Budget
2016 Staffing
Department Base
Complement
Service Level
Changes
Total Requested
Invest Barrie Admin $ 347,920 2 1 3 Business Development $ 832,388 5 1 6 Culture $ 1,849,690 6 0 6 Total $ 3,029,998 13 2 15
89

2014 2015 2015 2016 Service 2016Actual Approved Forecasted Base Level Requested
Expenditures Budget Expenditure Budget Change(s) Budget$ $ $ $ $ $ $ %
EXPENSESSalaries 1,481,379 1,714,855 1,767,533 1,767,333 194,069 1,961,402 246,547 14%Fringe Benefits 301,063 315,018 338,422 370,986 45,896 416,882 101,864 32%Total Salaries and Benefits 1,782,442 2,029,873 2,105,955 2,138,319 239,965 2,378,284 348,411 17%OPERATING EXPENSESGeneral Operations 1,174,981 1,235,695 1,232,271 1,247,064 136,530 1,383,594 147,899 12%Minor Capital - - - - - - - 0%Hydro, Water, Sewer, Gas 2,279 5,000 5,000 5,000 - 5,000 - 0%Transfers to other Boards, Municipalities, Agencies - - - - - - - 0%
Total Operating Expenses before Debenture Costs and Transfers
1,177,260 1,240,695 1,237,271 1,252,064 136,530 1,388,594 147,899 12%
DEBENTURE COSTS AND TRANSFERSLease Equipment/Property 350,185 380,244 339,534 346,250 - 346,250 (33,994) -9%Financial Expenses 16,066 10,150 19,324 20,000 - 20,000 9,850 97%Transfer to/from User Rate Reserve Funds - - - - - - - 0%Transfer to Reserves - 183,200 147,487 114,700 - 114,700 (68,500) -37%Transfer to Capital Fund - - - - - - - 0%Total Debenture Costs and Transfers 366,251 573,594 506,345 480,950 - 480,950 (92,644) -16%Gross Expenditures 3,325,953 3,844,162 3,849,571 3,871,333 376,495 4,247,828 403,666 11% Revenues Other Government Funding (203,429) (185,093) (123,182) (181,935) - (181,935) 3,158 -2% Contribution from Reserves/Reserve Funds (77,586) (20,000) (277) (20,000) - (20,000) - 0% Licences, Permits, Application Fees (214,350) (264,000) (217,919) (265,000) - (265,000) (1,000) 0% Fines - - - - - - - 0% Fees, Charges, Service Rentals (221,821) (139,700) (233,051) (174,700) - (174,700) (35,000) 25% Other Revenue (53,260) (279,200) (274,358) (199,700) - (199,700) 79,500 -28% Total Revenues (770,446) (887,993) (848,787) (841,335) - (841,335) 46,658 -5% Net Operating Expense/(Revenue) 2,555,507 2,956,169 3,000,784 3,029,998 376,495 3,406,493 450,324 15%
to 2015 Approved BudgetRequested Budget
INVEST BARRIE DIVISIONEXECUTIVE PORTFOLIO SUMMARY
2016 Base Budget Change Report
Change in 2016
90

INVEST BARRIEINVEST BARRIE ADMINISTRATION
2014 2015 2015 2016 2017 2018ACTUAL BUDGET FORECAST BUDGET FORECAST FORECAST
EXPENSESSalaries 179,975 251,973 232,008 232,266 235,660 239,105 Fringe Benefits 34,689 54,107 51,941 50,154 50,906 51,670 Total Salaries and Benefits 214,664 306,080 283,949 282,420 286,566 290,775 OPERATING EXPENSESGeneral Operations 37,835 65,500 77,492 65,500 65,500 65,500 Minor Capital - - - - - - Hydro, Water, Sewer, Gas - - - - - - Transfers to other Boards, Municipalities, Agencies - - - - - - Total Operating Expenses before Debenture Costs and Transfers 37,835 65,500 77,492 65,500 65,500 65,500 DEBENTURE COSTS AND TRANSFERSLease Equipment/Property - - - - - - Financial Expenses - - - - - - Transfer to/from User Rate Reserve Funds - - - - - - Transfer to Reserves - - - - - - Transfer to Capital Fund - - - - - - Total Debenture Costs and Transfers - - - - - - Gross Expenditures 252,499 371,580 361,441 347,920 352,066 356,275 Revenues Other Government Funding - - - - - - Contribution from Reserves/Reserve Funds - - - - - - Licences, Permits, Application Fees - - - - - - Fines - - - - - - Fees, Charges, Service Rentals - - - - - - Other Revenue - - - - - - Total Revenues - - - - - - Net Operating Expense/(Revenue) 252,499 371,580 361,441 347,920 352,066 356,275
CITY OF BARRIE2016 OPERATING BUDGET
EXPENDITURES
91

2014 2015 2015 2016 Service 2016Actual Approved Forecasted Base Level Requested
Expenditures Budget Expenditure Budget Change(s) Budget$ $ $ $ $ $ $ % $ % Comments
EXPENSESSalaries 179,975 251,973 232,008 232,266 53,631 285,897 (19,707) -8% 33,924 13% 1. Investment Coordinator vs. City Centre
Revitalization (CCR) Coordinator. A previous Invest Barrie position, CCR Coordinator was rated in the 2015 budget at a higher pay scale than the current position of Investment Coordinator. 2. The Strategy & Entrepreneurship Officer position (Intake Form # 1246), which will support the deployment of several pillars of the Invest Barrie Strategy.
Fringe Benefits 34,689 54,107 51,941 50,154 13,718 63,872 (3,953) -7% 9,765 18% As aboveTotal Salaries and Benefits 214,664 306,080 283,949 282,420 67,349 349,769 (23,660) -8% 43,689 14%OPERATING EXPENSESGeneral Operations 37,835 65,500 77,492 65,500 105,000 170,500 - 0% 105,000 160% Intake Form #1186 Invest Barrie Strategic
Initiatives including: a. Entrepreneurship: Accelerator programming for Startups, Sector specific entrepreneurship workshops (eg foodpreneur). b. Engagement & Mobilization: Initiatives to activate the business community.
Minor Capital - - - - - - - 0% - 0%Hydro, Water, Sewer, Gas - - - - - - - 0% - 0%Transfers to other Boards, Municipalities, Agencies - - - - - - - 0% - 0%Total Operating Expenses before Debenture Costs and Transfers 37,835 65,500 77,492 65,500 105,000 170,500 - 0% 105,000 160%
DEBENTURE COSTS AND TRANSFERSLease Equipment/Property - - - - - - - 0% - 0%Financial Expenses - - - - - - - 0% - 0%Transfer to/from User Rate Reserve Funds - - - - - - - 0% - 0%Transfer to Reserves - - - - - - - 0% - 0%Transfer to Capital Fund - - - - - - - 0% - 0%Total Debenture Costs and Transfers - - - - - - - 0% - 0%Gross Expenditures 252,499 371,580 361,441 347,920 172,349 520,269 (23,660) -6% 148,689 40% Revenues Other Government Funding - - - - - - - 0% - 0% Contribution from Reserves/Reserve Funds - - - - - - - 0% - 0% Licences, Permits, Application Fees - - - - - - - 0% - 0% Fines - - - - - - - 0% - 0% Fees, Charges, Service Rentals - - - - - - - 0% - 0% The Sponsorship Revenue is moving to a
Corporate Revenue account. Other Revenue - - - - - - - 0% - 0% Total Revenues - - - - - - - 0% - 0% Net Operating Expense/(Revenue) 252,499 371,580 361,441 347,920 172,349 520,269 (23,660) -6% 148,689 40%
Base Budget Requested Budgetto 2015 Approved Budget to 2015 Approved Budget
INVEST BARRIEInvest Barrie Administration
2016 Base Budget Change Report
Change in 2016 Change in 2016
92

Director of Business DevelopmentStephannie Schlichter
AdministrativeAssistant – Business
DevelopmentEllen Baker
Business DevelopmentOfficer
(3)
Indicates temporaryposition
Small BusinessConsultant
(2)
Small Business CentreClerk
Youth ProgramsCoordinator
Invest Barrie PortfolioBusiness Development Branch
9393

Performance Plan 2016
Department:
Departmental Overview
Business Development
Within the Invest Barrie Division, Business Development is focused on delivering the operational activities and actions that most often result in short-term returns to the community. Specifically through providing service in the operational areas of:- Investment Attraction- Investment Services- Business Retention & Expansion- Small Business Support
The operational activities are aligned and compliment the 4 pillars identified in the Invest Barrie Strategy that will foster long-term economic vitality and growth for the City of Barrie. The 4 pillars are: - Entrepreneurship- Innovation - Downtown Creative Hub - Mobilization & Collaboration
The overall function of the Business Development Department (BDD) is the deployment of coordinated services, actions, and initiatives that together serve to deliver on the strategic objectives outlined in the Invest Barrie Strategy:
•Diversify Barrie’s economy to grow knowledge-based industries such as technology, internet, life sciences.•Support the growth of a vibrant community of startup companies that have the potential to grow very quickly. •Ensure the availability of a diverse workforce that can meet the needs of both current and future industries.•Create sustainable competitive advantage and resiliency by focusing on innovation.•Maximize how much we can do through internal coordination and external collaboration.•Focus on strongly supporting existing employers, while attracting new ones, as part of a balanced approach to economic growth.
The department is comprised of 5 full-time permanent staff who are engaged in three primary service areas: attraction of net new business investment and industrial land development, support for growth/expansion of existing businesses, and promotion/support for the creation of new Barrie-based enterprises. The department also includes the Small Business Centre, with 3 full-time temporary staff and 1 part-time staff.
The Business Development team works with both internal City Hall stakeholders (including departments, the Senior Leadership Team, Council, and the Mayor's Office) and a large network of external partners and service providers (including the business community in Barrie and the GTA, Federal and Provincial governments, chambers of commerce and boards of trade, universities, startup accelerators and incubators, investors, and many more) to successfully perform its functions.
Key Departmental Objectives
In support of the strategic goals of Invest Barrie, the Business Development Department will deploym coordinated services, actions, and initiatives that together serve to deliver on the strategic objectives
9494

outlined in the Invest Barrie Strategy:
•Diversify Barrie’s economy to grow knowledge-based industries such as technology, internet, life sciences.•Support the growth of a vibrant community of startup companies that have the potential to grow very quickly. •Ensure the availability of a diverse workforce that can meet the needs of both current and future industries.•Create sustainable competitive advantage and resiliency by focusing on innovation.•Maximize how much we can do through internal coordination and external collaboration.•Focus on strongly supporting existing employers, while attracting new ones, as part of a balanced approach to economic growth.
Strategic Plan & Other Program DeliverablesIn support of the economic future and vision for the City of Barrie, Invest Barrie is committed to achieving the following strategic goals:
� Ensure that the economy creates and supports more high quality careers, leading to continued increases in quality of life.
� Focus on enhancing the diversity and range of employment opportunities for the community, so that all residents are able to pursue local employment.
� Enable an economy that can withstand changes in economic conditions and global competition. � Ensure that the economy’s ability to create high quality careers matches the pace of growth in the
community. � Be a premiere destination for business investment.
The Invest Barrie Strategy is built upon 4 Pillars that will foster the economic vitality and growth of the City of Barrie: Entrepreneurship, Innovation, Downtown Creative Hub and True Growth. Within each Pillar includes operational activities and actions that relate to the core activities of Invest Barrie that include investment attraction, investment services, business retention and expansion, cultural services and small business support.
Phase 1 of the Invest Barrie Strategy Deployment contains initiatives that support each of Pillars with the intent of creating both short-term returns to community and developing the foundation of a long-term vision for Barrie's economic future. The Invest Barrie Strategy Deployment is aligned with, and directly supports Council's 2014-2018 Strategic Goal of building a Vibrant Business Community through:- Build a global startup community- Eliminate obstacles to business growth and investment - Attract and retain a talented workforce - Promote Barrie’s strengths Major Initiatives/IssuesThere are several initiatives planned for 2016 as part of the implementation of the Invest Barrie Strategy. Initiatives/Pilot Projects have been identified in support of the Invest Barrie Strategy at both the Transformational and Operational Layers. While many of the initiatives within the Transformational layer are lead by the Invest Barrie staff, the Business Development team is integrated in the delivery of the initiatives.
Transformational Layer:Pillar 1 - Entrepreneurship (Also supports Pillar 3 - Downtown Creative Hub):Initiatives:1. Locally deliver Venture Lab BUILD Programming for Start-ups. VentureLAB develops and delivers support programs and services that target technology based entrepreneurs starting and growing global enterprises. The objectives of the project:- Provide high quality educational and mentoring opportunities to help innovators grow and scale their businesses - Retain the start-ups and talent in Barrie both for local employment growth and to cultivate a start-up culture and cluster within the City- Raise the visibility and profile of Barrie as a leader in innovation and entrepreneurship 2. Start-up/Entrepreneurship Events In order to grow and foster the development of a start-up cluster in Barrie, Invest Barrie needs to increase the level of engagement with entrepreneurs. This can be done through events where the City can provide a value added experience to participants.
9595

Objectives of delivering events:- Connect the Community– The business community will have an opportunity to make valuable network connections to help their businesses grow.- Celebrate Local Successes – strengthen the startup ecosystem through communicating our story internally and externally.- Create a culture that supports entrepreneurship 3. Foodpreneur Pilot Program - Deliver a Pilot Program that will:- Explore and assess the viability and opportunities around creating a food entrepreneurship cluster. - Identify the needs of foodpreneurs and the gaps that exist in supporting their success in the community.- Test the viability of a kitchen incubation model.4. Entrepreneurship Centre Business Case: This project is to produce a study that will support a business case for creating a common space for entrepreneurial support and services in the future. The future Sandbox-Entrepreneur Collision Centre is a physical space, co-located with other business service providers where entrepreneurs can go to work on their business ideas, collide with other entrepreneurs, seek out mentor advice, receive assistance and guidance to accessing resources. The first phase of this project in 2016 will involve the development of the business case and assessing feasibility of this type of model in the City of Barrie. A key component of the feasibility study will include the exploration of funding models that include business community involvement, sponsorship and alternate revenue generation to support the creation of this type of entrepreneurship centre.
Pillar 2: Innovation Manufacturing is a critically important sector of Barrie’s economy from an employment, export and cluster development perspective. The manufacturing sector creates spins-off employment in other sectors in addition to creating high-paying, skilled employment from engineering and project management through the skilled trades. In order to stay competitive while adopting new technologies to reduce costs and stay competitive manufacturers will need to increase their capacity to innovate. Utilizing Open Innovation, Invest Barrie has the opportunity to marry the strategic priority of developing a start-up eco-system with the business retention opportunities within the manufacturing sector. As this will be the first iteration of the model, the intent will be to implement it with 2-3 local manufacturers as a pilot project in order to ensure there is adequate resourcing to support the project, and to refine the adaptation of the model and associated processes. Once the model is refined, the intent will be to scale it to provide opportunity to companies within this industry sector to participate.
Pillar 4: Mobilization & Collaboration (Also supports Pillar 3 - Downtown Creative Hub) Business Engagement - Implement a model in support of business growth, retention and expansion within the City of Barrie, the engagement of business owners in identifying the needs, opportunities and solutions within their industry sector and community at large is a critical component to creating and delivering meaningful programs and services that derive economic dividends back to the community. Harnessing the expertise, talent and resources of local business owners and leaders will increase the overall capacity of Business Development to achieve meaningful outcomes and results that will enhance economic prosperity. Implementing an action-based framework will accelerate collaboration within and between organizations through common goals and projects. The process creates a collaborative ecosystem that identifies opportunities, provides solutions and makes partners out of the business community.
Talent Recruitment: our relationships with Barrie businesses continue to highlight talent attraction as a need for their business. The inability to attract the talent they need hinders their ability to grow, expand and develop new areas of expertise. The talent attraction project will provide a service that is unique. Talent activities can be not only tactical with the talent toolkit but also strategic as a service offered for businesses considering to move to Barrie by introducing them to talent that would be attracted to Barrie and would likely be "stickier" to the area helping businesses with employee retention. There is a need to create solutions that address the question of access to talent in both existing and emerging clusters. Deliverables:- Increase the number of events such as the Train in Trades.- Gain an enhanced understanding of what skills leave the City daily through commuting, and attempt to engage with the commuters in an ongoing way.- Deploy innovative methods for enhancing certain types of skills (for example, by facilitating MOOC-based training for interested members of the community)- Develop partnerships with additional post-secondary institutions and attempt to facilitate more internships with Barrie-based businesses.
9696

Operational Initiatives:
Investment Attraction:In alignment with the Invest Barrie Strategy, which will identify the areas of value where Barrie will perform best and will determine modes of competition for attraction and growth of business investment, a key initiative for Business Development in 2016 will be the identification of target industries, lines of business, or specific business functional areas that Barrie should focus on because it's general value proposition andproposed strategic focus most closely aligns with the business drivers/needs/challenges within those targets. Completion of an environmental scan and supply chain analysis will provide focus on very specific types of business or operations where the City's general value proposition will most clearly resonate and add value. In consultation with Access Barrie and Innovate Barrie, discussing options for promoting Barrie generally to the Greater Toronto Area communities. This is not specific to Economic Development, but rather aims to address certain misconceptions or lack of information about Barrie. This could take the form of a social media campaign, traditional media campaign, events in the GTA, and many more. Since such an initiative was not budgeted or planned for 2015, the implementation may or may not occur in 2015. However, the process of validation using data that was collected through previous research at Union Station and planning can be performed in 2015, so that budget can be requested for 2016.Deliverables:- Increase the size of the Investment Pipeline with more qualified prospects through targeted lead generation and promotion.- Complete supply chain analysis for the manufacturing sector, to identify gaps for attraction and BR+E opportunities through business collaboration.- Complete a study of existing sector clusters to be utilized as part of the City's value proposition and content marketing to position the City as a premiere destination for business investment.- Hosting Provincial Trade Commissioners in Barrie, and highlighting bot the value proposition of the City, as well as the world-class companies that choose to be in Barrie (by facilitating tours of Barrie-based businesses).- Leveraging business-lead initiatives such as the Barrie Business Ambassadors by providing them with the tools and value-proposition messaging to support, communicate and share amongst their influencer networks.- Targeted outcalls to businesses, associations, and influencer organizations (such as venture capitalists, startup accelerators, site selector firms, etc.) that align with the analysis that will identify target industries, lines of business, or specific business functional areas that Barrie should focus on.- Create development opportunities for the City through the implementation of the strategic disposition plan for City Owned parking lots in the City Centre.
Investment ServicesInitiate ongoing efforts to improve servicing methods for working with businesses, investors, and startups. This will be achieved by developing an investment services model that will involve the entire Corporation in fostering the Open for Business culture. Specifically, a concierge service model will seek to qualify potential investors via pre-determined criteria to determine their stage within the investment lifecycle and benefit to the City in terms of employment, tax revenue, generating growth in target sectors, etc. Based upon level of qualification, the appropriate level of service would be applied.Developing a defined process for qualification for servicing will allow Business Development and other required City departments to prioritize their time and resources on the greatest returns to the City and create a differentiation within the marketplace that will allow the City to stand-out amongst other competing Cities. Focusing and delivering on service will be key to the effectiveness of this program. Deliverables - Develop a Concierge Service and Investment Service Program for Business Investment Inquiries (Attraction and Retention)- Revitalize Investment Readiness Team- Develop and strengthen relationships with the ICI community, both local and GTA to gather local land development data, business intelligence and identify investment opportunities- Use Content Marketing to Showcase Program Success and Position and Differentiate Barrie in the Marketplace.
Business Retention & ExpansionIncrease the level of engagement with the broader business community. This activity will occur as a result of the implementation of projects/initiatives identified through Pillar 4, Mobilization and Engagement, in addition
9797

to the other Transformational and Operational initiatives as part of Phase One of the Invest Barrie strategy implementation. Businesses will be engaged with Business Development and Invest Barrie through a variety of initiatives that will be deployed that will strengthen and broaden the department's relationship with established businesses. For example, a highly engaged business community across the city and across industries will:
� Strengthen ties with the business community, resulting in a deeper understanding of issues that are facing the various industries, barriers to growth, points of leverage, and more.
� Support the development of a more robust entrepreneurial ecosystem with a balance of both feeders and leaders. An engaged business community is considered to be a powerful feeder into a startup ecosystem and is one of the key differentiators in successful entrepreneurial hubs, where larger and established firms work as mentors, advisors, partners, and customers of smaller startups.
� Pave the way for more business-led initiatives and groups that can be supported by the City, and which have a variety of purposes (as well as benefits for the City). Such groups have the ability to access vast network resources, innovative thinking, energies, etc…and can be a key strategic advantage for the City.
Small Business SupportThe City of Barrie continues its partnership with the Province of Ontario to deliver service, education and consultation resources to small businesses through the Small Business Centre of Barrie, Simcoe County and Orillia. Primarily funded by the Province of Ontario, the Small Business Centre is an integral component of the entrepreneurial eco-system and works to align, partner and compliment programs and initiatives aimed at the start-up community through Invest Barrie.Deliverables:- A partner in promotion and delivery of initiatives identified in Pillar 1 of the Transformational Layer- Small Business Centre will continue to drive youth program initiatives through the Province, the regional Pilot Project with the County.- Increase focus on small business growth (up to 5-years in operation) through development of broad mentor program and access to advisors and education opportunities that are specialized in key growth-related areas.
Key Performance IndicatorsStart-Up Eco-System and Small Business Support
Indicator 2014 Actual 2015 Plan 2015 Projected 2016 Plan% of clientele that use/participate in2 or more entrepreneurial program/servicesfrom GBBEC
N/A N/A N/A 30%
% capacity utilized for new initiatives/programs offered to the start-up community (ie. Artrepreneur, BUILD Program)
N/A N/A N/A 85%
Number of new, prospective start-up entrepreneurs that engage with the City through start-up cluster initiatives
N/A 100 100 60
InnovationIndicator 2014 Actual 2015 Plan 2015 Projected 2016 Plan
Proportion of new businesses participating in Invest Barrie events/initiatives. (New is defined as businesses not previously engaged with Invest Barrie)
N/A N/A N/A 10%
Mobilization & CollaborationIndicator 2014 Actual 2015 Plan 2015 Projected 2016 Plan
9898

Number of Business Leaders that are actively engaged in projects/initiatives that support the Invest Barrie strategy.
N/A N/A N/A 75
Investment Attraction & ServicingIndicator 2014 Actual 2015 Plan 2015 Projected 2016 Plan
Proportion of proactive prospects that are converted to qualified leads
N/A N/A N/A 5%
9999

INVEST BARRIEBUSINESS DEVELOPMENT
2014 2015 2015 2016 2017 2018ACTUAL BUDGET FORECAST BUDGET FORECAST FORECAST
EXPENSESSalaries 528,223 639,825 652,818 680,464 690,424 700,534 Fringe Benefits 122,095 118,888 132,374 144,045 146,206 148,399 Total Salaries and Benefits 650,318 758,713 785,192 824,509 836,630 848,933 OPERATING EXPENSESGeneral Operations 252,511 284,507 267,913 283,814 283,814 283,814 Minor Capital - - - - - - Hydro, Water, Sewer, Gas - - - - - - Transfers to other Boards, Municipalities, Agencies - - - - - - Total Operating Expenses before Debenture Costs and Transfers 252,511 284,507 267,913 283,814 283,814 283,814 DEBENTURE COSTS AND TRANSFERSLease Equipment/Property 5,100 - - - - - Financial Expenses - - - - - - Transfer to/from User Rate Reserve Funds - - - - - - Transfer to Reserves - - 36,487 - - - Transfer to Capital Fund - - - - - - Total Debenture Costs and Transfers 5,100 - 36,487 - - - Gross Expenditures 907,929 1,043,220 1,089,592 1,108,323 1,120,444 1,132,747 Revenues Other Government Funding (153,756) (173,093) (123,182) (171,935) (171,935) (171,935) Contribution from Reserves/Reserve Funds (77,586) (20,000) - (20,000) (20,000) (20,000) Licences, Permits, Application Fees - - - - - - Fines - - - - - - Fees, Charges, Service Rentals - - - - - - Other Revenue 1,763 (84,000) (136,451) (84,000) (84,000) (84,000) Total Revenues (229,579) (277,093) (259,633) (275,935) (275,935) (275,935) Net Operating Expense/(Revenue) 678,350 766,127 829,959 832,388 844,509 856,812
CITY OF BARRIE2016 OPERATING BUDGET
EXPENDITURES
100100

2014 2015 2015 2016 Service 2016Actual Approved Forecasted Base Level Requested
Expenditures Budget Expenditure Budget Change(s) Budget$ $ $ $ $ $ $ % $ % Comments
EXPENSESSalaries 528,223 639,825 652,818 680,464 53,631 734,095 40,639 6% 94,270 15% One of the Business Development Officer
positions was setup in the 2015 Base Budget as a .5 FTE instead of a 1.0 FTE., cost of living increases to all staff, job evaluations and associated increases, and Intake Form request #1247 (Grant Writing & Recruitment Specialist).
Fringe Benefits 122,095 118,888 132,374 144,045 13,718 157,763 25,157 21% 38,875 33% As aboveTotal Salaries and Benefits 650,318 758,713 785,192 824,509 67,349 891,858 65,796 9% 133,145 18%OPERATING EXPENSESGeneral Operations 252,511 284,507 267,913 283,814 30,000 313,814 (693) 0% 29,307 10% This increase is due to Intake Form #1177
(Enterprise Centre Business Case).Minor Capital - - - - - - - 0% - 0%Hydro, Water, Sewer, Gas - - - - - - - 0% - 0%Transfers to other Boards, Municipalities, Agencies - - - - - - - 0% - 0%Total Operating Expenses before Debenture Costs and Transfers 252,511 284,507 267,913 283,814 30,000 313,814 (693) 0% 29,307 10%
DEBENTURE COSTS AND TRANSFERSLease Equipment/Property 5,100 - - - - - - 0% - 0%Financial Expenses - - - - - - - 0% - 0%Transfer to/from User Rate Reserve Funds - - - - - - - 0% - 0%Transfer to Reserves - - 36,487 - - - - 0% - 0%Transfer to Capital Fund - - - - - - - 0% - 0%Total Debenture Costs and Transfers 5,100 - 36,487 - - - - 0% - 0%Gross Expenditures 907,929 1,043,220 1,089,592 1,108,323 97,349 1,205,672 65,103 6% 162,452 16% Revenues Other Government Funding (153,756) (173,093) (123,182) (171,935) - (171,935) 1,158 -1% 1,158 -1% Contribution from Reserves/Reserve Funds (77,586) (20,000) - (20,000) - (20,000) - 0% - 0% Licences, Permits, Application Fees - - - - - - - 0% - 0% Fines - - - - - - - 0% - 0% Fees, Charges, Service Rentals - - - - - - - 0% - 0% Other Revenue 1,763 (84,000) (136,451) (84,000) - (84,000) - 0% - 0% Total Revenues (229,579) (277,093) (259,633) (275,935) - (275,935) 1,158 0% 1,158 0% Net Operating Expense/(Revenue) 678,350 766,127 829,959 832,388 97,349 929,737 66,261 9% 163,610 21%
Base Budget Requested Budgetto 2015 Approved Budget to 2015 Approved Budget
INVEST BARRIEBusiness Development Department2016 Base Budget Change Report
Change in 2016 Change in 2016
101101

Community EventsCoordinator
Culture Officer(Development)
AdministrativeAssistant -
CultureElaine Britnell
Community EventsProgrammer
Technical Director(Theatre)
(0)
Director of CultureRudi Quammie Williams
Indicates a temporaryposition
Invest Barrie PortfolioCulture Department
New Non-UnionManagement Position
Vacant
102102

Performance Plan 2016
Department:
Departmental Overview
Culture
A member of the Invest Barrie team, the Department of Culture (DOC) supports excellence and growth in local cultural and creative sector initiatives, as well as in culture-based businesses and entrepreneurship. This is done in an effort to promote a higher quality of life in a City (that includes a variety of cultural amenities for residents and visitors), and positively affect the GDP of Barrie and its City Centre. The DOC helps to create an environment in which creative and culture sector participants can thrive in order to enhance the experiences of residents and visitors, attract talent and generate revenue and economic opportunities. The DOC manages cultural infrastructure, promotes plans and co-ordinates cultural initiatives with artists, arts organizations, cultural entrepreneurs, private sector participants, other departments within the City of Barrie and other levels of government as necessary. The DOC, working as part of the Invest Barrie portfolio, executes the City of Barrie's Plan for Culture, and participates in (or leads) key Invest Barrie strategic initiatives. Our department's mission is to establish cultural policy, build capacity for the arts and other cultural activities, encourage culture as an economic driver, and engage community members across a wide spectrum.
The Department of Culture has four functional areas of focus.
Development Programming MarketingYoung and Emerging Artists
In fulfilling Development objectives, the department provides support through training, funding and information to Barrie culture sector workers, in an effort to support and sustain cultural development and capacity building. As part of providing access to information about development activities, the DOC maintains a database of current statistical and financial information on the culture sector and produces a Culture Report Card.
To fulfill Programming objectives, DOC staff oversee and co-ordinate activities in the City of Barrie’s cultural spaces, and are involved in both community events and the City of Barrie’s own annual events. Staff also participate in the planning and implementation of City infrastructure projects and manage two of the City's physical infrastructure assets dedicated to arts and culture.
Culture's Marketing objectives are laid out in "Creating Cultural Connections", Barrie's Plan for Culture. The DOC plays a leadership role in the implementation of Barrie's marketing plan for its cultural/creative assets. The department works with a variety of partners ranging from other City departments to Tourism Barrie, arts organizations, artists, the Business Development Department and the Downtown BIA to market Barrie’s culture sector and its opportunities.
In achieving the objective of supporting Young and Emerging Artists, the DOC works with other departments and organizations and takes a leadership role in the creation of opportunities for creative entrepreneurs and young and emerging artists, so as to ensure their continued growth and contribution to the culture sector and to the growth of Barrie's economy. Key Departmental ObjectivesTo provide benefit to the community by harnessing cultural resources and creative potential to achieve both social and economic benefits.
103103

To support and enhance the City's existing vibrancy, livability and attractiveness to residents, newcomers and investment.
To leverage culture as an economic driver. This includes developing arts/culture/creative-based businesses in Barrie, creating an environment that is attractive to top talent, creating a vibrant City Centre that fosters "synergistic collisions" and is conducive to the formation of an innovation/startup cluster, supporting business expansion and more.
To support and enhance Barrie's sense of place and positively impact perceptions of the City.
To provide opportunities for the business community and other stakeholders to participate in, contribute to and derive benefit from Barrie's growing creative sector (including creative technology) and broader startup ecosystem (that typically develops in conjunction with a thriving creative sector).
To increase the number of people that participate in arts education and culture and creative sector training in order to build capacity within the culture sector.
To provide economic and information resources to the artists, producers, presenters, entrepreneurs and programmers of Barrie's cultural initiatives, through information sharing opportunities and arts grants, for the purpose of supporting the growth of the culture sector in Barrie.
Ensure the availability of public and private physical infrastructure for use as cultural/creative spaces.
Strategic Plan & Other Program DeliverablesEncourage culture and the creative sector as an economic driver for the City of Barrie.
Nurture Culture as an opportunity to advance Council's strategic goals of vitalization of the City Centre, community involvement and the creation of a Downtown Creative Hub that will be the intersection of culture, business and technology.
Using measurement and analysis tools, track community-based and economic-based benefits of cultural investments, including enhanced accountability for culture grants, in alignment with council's strategic goal of Strengthening Barrie's financial condition.
Support the creation of a startup culture, thereby forwarding council's priority of establishing Barrie as a center of excellence for innovation and entrepreneurship.
Support the attraction and retention of talent and businesses, thereby forwarding council's priority of establishing Barrie as a preferred community for "live, work and play".
Major Initiatives/IssuesIssues:
There exist a lack of understanding amongst some residents for the value of Culture.
There is a need for a marketing culture amongst culture/creative participants, entrepreneurs, start-ups and innovation clusters.
Resources are limited and many competing priorities exist.
Initiatives:
In support of a formal program aimed at increasing revenue from sponsorship of City programs and assets, the DOC will take a leadership role in overseeing the deployment of the sponsorship strategy, methodology and culture throughout the corporation.
Continue working with the Central Ontario Music Council, the Department will help to position Barrie and Central Ontario as a live music capital.
104104

We will investigate opportunities to grow the quantity of films shot annually in our community and develop a process for stewarding and servicing the film makers and film companies. We will also investigate the feasibility and benefit of developing a film office in Barrie.
Artrepreneur is an initiative in partnership with other members of the Invest Barrie Portfolio and York Region. This is an example of our efforts to lead the development of a startup culture that includes Culture Sector participants and will build-on what already exists in Barrie. We will leverage best practices to create an environment where people are excited about the idea of entrepreneurship, eager to attend startup-related events, are enthusiastic about participating in the development of the ecosystem, and most importantly are collaborating to get new ideas off the ground.
Create a robust method of measuring, analyzing and tracking benefits of culture, both intermediate and final benefits, as well as implement an accountability framework for culture-based grants and other investments.
Policy Development to support strategic direction, including implementing the marketing plan for culture sector products and an arts policy.
In support of creating a startup culture and startup ecosystem, create opportunities for "beneficial collisions" between talent, investors, entrepreneurs and other stakeholders.
Investigate options for a single resource for Culture based information in Barrie (not just City-based culture programs and events, but rather a single resource that captures all culture activities happening in the City at a given time).
Implement "Created in Barrie, Understanding Barrie's Arts and Culture Market", the marketing plan for culture and continue to celebrate excellence.
Key Performance IndicatorsObjective: To provide opportunities for corporate and other stake holders to participate in and contribute to Barrie's culture sector.
Indicator 2014 Actual 2015 Plan 2015 Projected 2016 PlanNumber of attendees at corporate events 125000 125000 125000 130,000
Total value of sponsorships from all corporate events
Not Available
46,000 50,000 60,000
Number of community volunteer and student hours spent in DOC work
2,349 2,349 2,500 2,500
% of out of town visitors (from greater than 40km away) at City events
16.4% 18.0% 19.0% 20.0%
Number of events in the downtown that engage business and the creative sector, and where the two can intersect.
Not Available
Not Available
Not Available 8
Objective: To increase the number of people that participate in arts education to build capacity in and contribute within the culture sector.
Indicator 2014 Actual 2015 Plan 2015 Projected 2016 PlanPercentage of workshop participants with a year end increase in revenue or audience
75% 85% 85%
Objective: To provide information and economic resources to arts organizations of performers, producers, presenters, creative sector entrepreneurs and programmers.
Indicator 2014 Actual 2015 Plan 2015 Projected 2016 PlanArts grants as a percentage of arts organization's gross revenues
9% 9% 9% 9%
105105

Arts grants as a percentage of arts organization's revenue from government sources
23% 23% 23% 23%
Percentage of organizations completing 80-100% of granting agreement deliverables
95% 75% 85% 85%
Objective: To deliver efficient culture services to the community as measured by the gross culture spending including grants per capita.
Indicator 2014 Actual 2015 Plan 2015 Projected 2016 PlanGross culture spending per capita $15.90 $15.90 $15.90 $16.00
Consumer spending on culture Not Available
Not Available
Not Available Not Available
Objective: To create and manage physical infrastructure such as performing arts centers for displays of arts.
Indicator 2014 Actual 2015 Plan 2015 Projected 2016 PlanRental revenue - Mady Centre for the Performing Arts
$72,872 $104,000 $70,000 $100,000
Rental revenue - Georgian Theatre $141,476 $160,000 $147,918 $165,000
Net Revenue from theatres@barriepresentations
$500 $2,000 $2,000 $2,500
Days of Use - Mady Centre for the Performing Arts
199 146 146 160
Days of Use - Georgian Theatre 118 135 135 140
106106

INVEST BARRIECULTURE
2014 2015 2015 2016 2017 2018ACTUAL BUDGET FORECAST BUDGET FORECAST FORECAST
EXPENSESSalaries 773,181 823,057 882,707 854,603 867,447 880,483 Fringe Benefits 144,279 142,023 154,107 176,787 179,440 182,132 Total Salaries and Benefits 917,460 965,080 1,036,814 1,031,390 1,046,887 1,062,615 OPERATING EXPENSESGeneral Operations 884,635 885,688 886,866 897,750 922,538 952,540 Minor Capital - - - - - - Hydro, Water, Sewer, Gas 2,279 5,000 5,000 5,000 5,100 5,202 Transfers to other Boards, Municipalities, Agencies - - - - - - Total Operating Expenses before Debenture Costs and Transfers 886,914 890,688 891,866 902,750 927,638 957,742 DEBENTURE COSTS AND TRANSFERSLease Equipment/Property 345,085 380,244 339,534 346,250 367,590 385,188 Financial Expenses 16,066 10,150 19,324 20,000 20,400 20,803 Transfer to/from User Rate Reserve Funds - - - - - - Transfer to Reserves - 183,200 111,000 114,700 67,450 63,975 Transfer to Capital Fund - - - - - - Total Debenture Costs and Transfers 361,151 573,594 469,858 480,950 455,440 469,966 Gross Expenditures 2,165,525 2,429,362 2,398,538 2,415,090 2,429,965 2,490,323 Revenues Other Government Funding (49,673) (12,000) - (10,000) - - Contribution from Reserves/Reserve Funds - - (277) - - - Licences, Permits, Application Fees (214,350) (264,000) (217,919) (265,000) (270,300) (275,706) Fines - - - - - - Fees, Charges, Service Rentals (221,821) (139,700) (233,051) (174,700) (177,160) (179,665) Other Revenue (55,023) (195,200) (137,907) (115,700) (66,500) (60,806) Total Revenues (540,867) (610,900) (589,154) (565,400) (513,960) (516,177) Net Operating Expense/(Revenue) 1,624,658 1,818,462 1,809,384 1,849,690 1,916,005 1,974,146
CITY OF BARRIE2016 OPERATING BUDGET
EXPENDITURES
107107

2014 2015 2015 2016 Service 2016Actual Approved Forecasted Base Level Requested
Expenditures Budget Expenditure Budget Change(s) Budget$ $ $ $ $ $ $ % $ % Comments
EXPENSESSalaries 773,181 823,057 882,707 854,603 86,807 941,410 31,546 4% 118,353 14% Community Events Programmer position
now full-time, addition of Sponsorship Coordinator as per Intake Form #1192.
Fringe Benefits 144,279 142,023 154,107 176,787 18,460 195,247 34,764 24% 53,224 37% Same as aboveTotal Salaries and Benefits 917,460 965,080 1,036,814 1,031,390 105,267 1,136,657 66,310 7% 171,577 18%OPERATING EXPENSESGeneral Operations 884,635 885,688 886,866 897,750 1,530 899,280 12,062 1% 13,592 2%Minor Capital - - - - - - - 0% - 0%Hydro, Water, Sewer, Gas 2,279 5,000 5,000 5,000 - 5,000 - 0% - 0%Transfers to other Boards, Municipalities, Agencies - - - - - - - 0% - 0%Total Operating Expenses before Debenture Costs and Transfers 886,914 890,688 891,866 902,750 1,530 904,280 12,062 1% 13,592 2%
DEBENTURE COSTS AND TRANSFERSLease Equipment/Property 345,085 380,244 339,534 346,250 - 346,250 (33,994) -9% (33,994) -9% Reduction in 2015 Mady theatre rentals
resulted in a reduction in equipment rentals to service the needs of clients.
Financial Expenses 16,066 10,150 19,324 20,000 - 20,000 9,850 97% 9,850 97% Increase in credit card charges over 2014 is driven by a behaviour shift and customers' propensity to purchase tickets online or via telephone. 2016 budget has been adjusted to closer reflect current patterns. These charges have been passed on to the client and will be covered and reflected in a revenue account.
Transfer to/from User Rate Reserve Funds - - - - - - - 0% - 0%Transfer to Reserves - 183,200 111,000 114,700 - 114,700 (68,500) -37% (68,500) -37% Reduction over previous years driven by
Naming Rights sponsor's (Mady) inability to continue financial responsibilities to the theatre.
Transfer to Capital Fund - - - - - - - 0% - 0%Total Debenture Costs and Transfers 361,151 573,594 469,858 480,950 - 480,950 (92,644) -16% (92,644) -16%Gross Expenditures 2,165,525 2,429,362 2,398,538 2,415,090 106,797 2,521,887 (14,272) -1% 92,525 4% Revenues Other Government Funding (49,673) (12,000) - (10,000) - (10,000) 2,000 -17% 2,000 -17% County of Simcoe funds contributed to
Culture Grows Here Conference in 2015. In 2016, Choralfest will be programmed without the same support. The Cultural Development Fund has concluded. Decrease in Celebrate Canada funding.
Contribution from Reserves/Reserve Funds - - (277) - - - - 0% - 0% Licences, Permits, Application Fees (214,350) (264,000) (217,919) (265,000) - (265,000) (1,000) 0% (1,000) 0% Rental revenue decreased. Reduction in
bookings and significant show cancellations.
Fines - - - - - - - 0% - 0% Fees, Charges, Service Rentals (221,821) (139,700) (233,051) (174,700) - (174,700) (35,000) 25% (35,000) 25% The success of larger children's shows with
merchandising opportunities at Georgian has driven an increase in cost recovery along with credit card charge recovery.
Other Revenue (55,023) (195,200) (137,907) (115,700) - (115,700) 79,500 -41% 79,500 -41% Sponsorship $ reduced due to Mady's financial circumstances and inability to meet responsibilities.
Total Revenues (540,867) (610,900) (589,154) (565,400) - (565,400) 45,500 -7% 45,500 -7% Net Operating Expense/(Revenue) 1,624,658 1,818,462 1,809,384 1,849,690 106,797 1,956,487 31,228 2% 138,025 8%
to 2015 Approved Budget to 2015 Approved Budget
2016 Base Budget Change Report
Change in 2016 Change in 2016Base Budget Requested Budget
INVEST BARRIEDepartment of Culture
108108

General Manager of Communityand Corporate ServicesPatricia Elliott-Spencer
Director of Recreation ServicesBarb Roth
Director of Legislative andCourt ServicesDawn McAlpine
Director of FinanceCraig Millar
Executive Assistant to theGeneral Manager
Jill Taylor
Director of EmergencyServices
(Fire Chief)John Lynn
Director of Legal ServicesIngrid Peters
Director of Building and By-lawServices
Gord Allison
Community and Corporate Services Division
109

Performance Plan 2016 - COMMUNITY AND CORPORATE SERVICES DIVISION
Division Goals To reduce the risk of harm or loss of life by providing timely Fire and Emergency services and Building Code review and enforcement To provide inclusive recreation facilities and programming that meets community needs and ensures all residents have the opportunity to
participate To inform, encourage individual compliance with and enforce community standards through the administration and enforcement of municipal
by-laws and licensing to enhance the safety and quality of life in the community To deliver advice, policy support and administrative services to City Council and the corporation for legislative, legal, real estate and financial
services To develop and maintain financial policies and plans that support Council’s strategic goals and protect the City’s creditworthiness and assets To provide open and transparent communication to the public and staff on the decision making process associated with Council and
Committee meetings Key Division Service Delivery Initiatives Continue to develop and implement financing strategies for growth management Enhance the City Council’s Agenda Management process through increased automation Prepare for and implement the by-election for Ward 7 Develop expertise and provide internal support to the expropriation process and handling of liability and cost issues on remediation and sale of
environmentally contaminated property (same as below) Implement the policy for unpaid, overdue POA fines deemed uncollectible Develop the Recreation Neighbourhood Strategies which will identify the program, facility and service priorities to identify both short and long-
term priorities for each neighbourhood area which will guide the effective planning and efficient delivery of service improvements in future years
Implement the new database system for permits, licenses and inspections Prepare for residential development in the annexed lands, to ensure efficient processing of permits, legal agreements and financial obligations Implement the Fire Master Plan Report on Key Performance Indicators for the Made in Barrie benchmarking initiative Implement the process recommendations from the Purchasing Services Review and Deloitte Facility Audit Recommendations Develop a long-term financial plan, incorporating the financial management policies identified in the FIA Enhance the city’s cash management and investment program Implement a Budget Software solution to streamline the city’s operating and capital budget processes Provide strategic financial and legal advice on the city’s investment in Barrie Hydro Holdings and PowerStream Develop a succession management plan for senior management positions
110

External Factors Influencing Activities & Outcomes General economic conditions Federal/Provincial financial condition and the potential for funding impacts from these orders of government Federal/Provincial legislative or regulatory changes Water consumption trends Corporate Scorecard Indicators All Departments measure performance using a Balanced Scorecard. Corporate Services contributes the following indicators to a corporate scorecard:
Department Indicator 2015 Plan
2015 Projected
2016 Plan
Finance Average Number of Bids received per Bid Process 5.00 5.00 5.00 Number of months between residential occupancy and assessment received on assessment roll 14 14 13
Recreation
Recreation Services Operating Cost Recovery Rate 57.7% 56.3% 55%
Participant Visits to Recreation Facilities 1,998,000 2,144,000 2,150,000
Utilization Rate for Directly Provided Registered Programs 80% 79.5% 80%
Fire and Emergency Services
Less than 6 minute Road Response – 90% of the time 95% 93% 94%
Emergency Response Call Volumes for Barrie 8,200 8,200 8,450
Total Fire Code Inspections 1,600 1,600 1,650
Public Education community touch points 10,000 11,000 11,500
Legal Services % of Prosecutorial Success 65% 65% 65%
Building and By-law Services
Average # of inspections to approve occupancy for new dwelling units 1.8 1.8 1.7
Percent of Business Licenses Renewed by Due Date 85% 83% 85%
Operating cost for Building Permits per $1,000 of Construction Activity $12.00 $12.00 $11.80 Percentage of Building Permit applications reviewed within legislated timeframes 96% 95% 96%
Legislative and Court Services/Clerk’s Office
# of trial requests processed – Barrie 19,000 21,443 20,000
Average time to trial – Part 1 charges 6 months 5 months 5 months
111

Budget Summary
2016 Net Requested
Budget
2016 Staffing
Department Base
Complement
Service Level
Changes
Total Requested
Office of the General Manager $ 342,253 2 0 2 Legislative & Court Services $ 718,760 47 0 47 Finance $ 3,668,951 51 2 53 Recreation $ 7,138,226 60 1 61 Fire & Emergency Services $ 24,393,397 180 0 180 Legal Services $ 1,574,255 19 0 19 Building & By-Law Services $ 547,006 61 2 63 Total $ 38,382,848 420 5 425
112

2014 2015 2015 2016 Service 2016Actual Approved Forecasted Base Level Requested
Expenditures Budget Expenditure Budget Change(s) Budget$ $ $ $ $ $ $ %
EXPENSESSalaries 36,220,195 38,204,736 37,074,195 39,349,057 170,381 39,519,438 1,314,702 3%Fringe Benefits 8,109,699 8,279,375 8,531,105 8,903,969 41,080 8,945,049 665,674 8%Total Salaries and Benefits 44,329,894 46,484,111 45,605,300 48,253,026 211,461 48,464,487 1,980,376 4%OPERATING EXPENSESGeneral Operations 6,890,463 6,455,035 6,926,969 6,686,991 3,200 6,690,191 235,156 4%Minor Capital 466,605 505,870 493,880 486,643 - 486,643 (19,227) -4%Hydro, Water, Sewer, Gas 2,650,303 2,746,543 2,648,076 2,796,144 - 2,796,144 49,601 2%Transfers to other Boards, Municipalities, Agencies 2,281,988 2,200,435 2,223,486 1,949,036 - 1,949,036 (251,399) -11%
Total Operating Expenses before Debenture Costs and Transfers
12,289,359 11,907,883 12,292,411 11,918,814 3,200 11,922,014 14,131 0%
DEBENTURE COSTS AND TRANSFERSLease Equipment/Property 1,945,968 1,993,770 1,957,746 1,993,224 - 1,993,224 (546) 0%Financial Expenses 282,331 269,912 268,902 347,270 - 347,270 77,358 29%Transfer to/from User Rate Reserve Funds - - - - 1,530 1,530 1,530 0%Transfer to Reserves 412,180 (130,879) (129,483) (133,333) - (133,333) (2,454) 2%Transfer to Capital Fund - - - - - - - 0%Total Debenture Costs and Transfers 2,640,479 2,132,803 2,097,165 2,207,161 1,530 2,208,691 75,888 4%Gross Expenditures 59,259,732 60,524,797 59,994,876 62,379,001 216,191 62,595,192 2,070,395 3% Revenues Other Government Funding (492,736) (547,911) (522,016) (566,001) - (566,001) (18,090) 3% Contribution from Reserves/Reserve Funds (741,705) (285,956) (386,844) (317,476) - (317,476) (31,520) 11% Licences, Permits, Application Fees (5,126,361) (4,966,115) (4,636,327) (5,055,853) (80,485) (5,136,338) (170,223) 3% Fines (8,791,751) (8,928,636) (9,155,544) (8,957,359) - (8,957,359) (28,723) 0% Fees, Charges, Service Rentals (8,289,049) (8,706,953) (8,371,172) (8,449,644) - (8,449,644) 257,309 -3% Other Revenue (634,686) (609,809) (523,123) (649,820) - (649,820) (40,011) 7% Total Revenues (24,076,288) (24,045,380) (23,595,026) (23,996,153) (80,485) (24,076,638) (31,258) 0% Net Operating Expense/(Revenue) 35,183,444 36,479,417 36,399,850 38,382,848 135,706 38,518,554 2,039,137 6%
to 2015 Approved BudgetRequested Budget
COMMUNITY AND CORPORATE SERVICES DIVISIONDIVISION SUMMARY
2016 Base Budget Change Report
Change in 2016
113

COMMUNITY AND CORPORATE SERVICESGENERAL MANAGER'S OFFICE
2014 2015 2015 2016 2017 2018ACTUAL BUDGET FORECAST BUDGET FORECAST FORECAST
EXPENSESSalaries 268,991 264,944 259,785 268,840 272,780 276,779 Fringe Benefits 53,947 55,928 59,911 56,513 57,361 58,221 Total Salaries and Benefits 322,938 320,872 319,696 325,353 330,141 335,000 OPERATING EXPENSESGeneral Operations 17,807 14,700 9,133 16,900 16,900 16,900 Minor Capital - 300 - - - - Hydro, Water, Sewer, Gas - - - - - - Transfers to other Boards, Municipalities, Agencies - - - - - - Total Operating Expenses before Debenture Costs and Transfers 17,807 15,000 9,133 16,900 16,900 16,900 DEBENTURE COSTS AND TRANSFERSLease Equipment/Property - - - - - - Financial Expenses - - - - - - Transfer to/from User Rate Reserve Funds - - - - - - Transfer to Reserves - - - - - - Transfer to Capital Fund - - - - - - Total Debenture Costs and Transfers - - - - - - Gross Expenditures 340,745 335,872 328,829 342,253 347,041 351,900 Revenues Other Government Funding - - - - - - Contribution from Reserves/Reserve Funds - - - - - - Licences, Permits, Application Fees - - - - - - Fines - - - - - - Fees, Charges, Service Rentals - - - - - - Other Revenue (21,000) - - - - - Total Revenues (21,000) - - - - - Net Operating Expense/(Revenue) 319,745 335,872 328,829 342,253 347,041 351,900
CITY OF BARRIE2016 OPERATING BUDGET
EXPENDITURES
114

2014 2015 2015 2016 Service 2016Actual Approved Forecasted Base Level Requested
Expenditures Budget Expenditure Budget Change(s) Budget$ $ $ $ $ $ $ % $ % Comments
EXPENSESSalaries 268,991 264,944 259,785 268,840 - 268,840 3,896 1% 3,896 1%Fringe Benefits 53,947 55,928 59,911 56,513 - 56,513 585 1% 585 1%Total Salaries and Benefits 322,938 320,872 319,696 325,353 - 325,353 4,481 1% 4,481 1%OPERATING EXPENSESGeneral Operations 17,807 14,700 9,133 16,900 - 16,900 2,200 15% 2,200 15% Increase due to GM office assuming the full
cost for the Municipal Information Network subscription for the Corporation.
Minor Capital - 300 - - - - (300) -100% (300) -100%Hydro, Water, Sewer, Gas - - - - - - - 0% - 0%Transfers to other Boards, Municipalities, Agencies - - - - - - - 0% - 0%Total Operating Expenses before Debenture Costs and Transfers 17,807 15,000 9,133 16,900 - 16,900 1,900 13% 1,900 13%
DEBENTURE COSTS AND TRANSFERSLease Equipment/Property - - - - - - - 0% - 0%Financial Expenses - - - - - - - 0% - 0%Transfer to/from User Rate Reserve Funds - - - - - - - 0% - 0%Transfer to Reserves - - - - - - - 0% - 0%Transfer to Capital Fund - - - - - - - 0% - 0%Total Debenture Costs and Transfers - - - - - - - 0% - 0%Gross Expenditures 340,745 335,872 328,829 342,253 - 342,253 6,381 2% 6,381 2% Revenues Other Government Funding - - - - - - - 0% - 0% Contribution from Reserves/Reserve Funds - - - - - - - 0% - 0% Licences, Permits, Application Fees - - - - - - - 0% - 0% Fines - - - - - - - 0% - 0% Fees, Charges, Service Rentals - - - - - - - 0% - 0% Other Revenue (21,000) - - - - - - 0% - 0% Total Revenues (21,000) - - - - - - 0% - 0% Net Operating Expense/(Revenue) 319,745 335,872 328,829 342,253 - 342,253 6,381 2% 6,381 2%
Change in 2016 Change in 2016Base Budget Requested Budget
to 2015 Approved Budget to 2015 Approved Budget
COMMUNITY AND CORPORATE SERVICES DIVISIONGeneral Manager of Community and Corporate Services
2016 Base Budget Change Report
115

Manager of Operations andTraining
Deputy Fire ChiefBill Boyes
Director of Emergency ServicesFire ChiefJohn Lynn
Platoon Chief"A" Shift
Mick Caldwell
Platoon Chief"B" Shift
Len Mitchell
Platoon Chief"C" Shift
Robert Taylor
Platoon Chief"D" Shift
Jeff Catteau
Office Coordinator INancy Archer
Payroll/Admin AssistantAnne VanDyke
Fire Support Administrator(2)
Chief Fire PreventionOfficer
Tracy Stevenson
Chief Training OfficerTony Weir
Community and Corporate Services DivisionBarrie Fire and Emergency Services Department
Manager of Prevention andCEMC
Deputy Fire ChiefJeff Weber
Manager of Communicationsand Business Services
Deputy Fire ChiefSue Dawson
116116

Performance Plan 2016
Department:
Departmental Overview
Fire and Emergency Services
Barrie Fire & Emergency Service (BFES) is governed by "By-law 2012-200, a By-law to Establish and Regulate the Barrie Fire & Emergency Service." This By-law sets out definitions, the mission of the department and the mandate. The mandate sets out distinct areas of operation for the department, Fire Suppression, Technical Rescues, Public Education Programs, Public Assistance, Fire Investigation, Training and Communications and "By-law 2013-142 Emergency Management By-law" sets out the sixth area of operations for the Department. BFES is governed and charged with the responsibilities under several legislative requirements, including and not limited to the Fire Protection & Prevention Act. An Ontario Fire Marshal’s Directive also outlines a mandate implementing and focusing fire department activities under three lines of defense. These three lines of defense are:
• public education, • inspection and enforcement, and• fire suppression
Administration Branch
The Administration Branch requires approximately 8.7% of the Department's resources to perform the following services:
� Overall administration of 180 staff in six branches � Evaluate community fire risk and make recommendations to council to manage risk � Using the risk evaluation determine and recommend an appropriate standard of cover considering
the three lines of defense � Develop and implement a strategic plan for the Department. � Co-ordination with other City Departments and external agencies. � Ensure departmental compliance with municipal, provincial and federal legislated requirements and
best practices.Communications Branch
The Communications Branch requires approximately 4.5% of the Department's resources to perform the following services:
� The Communications Branch is responsible for call processing from receipt of call to the dispatching of fire apparatus for Barrie Fire & Emergency Service and for those municipalities or other agencies with which contractual agreements are in effect.
� Convey instructions, information and direction to the service requester, provide logistical support to the fire scene and maintain radio communications with emergency responders.
� Monitor performance to identify areas of best practice, ability to meet industry standards and compliance with current legislation.
� Manage and monitor 9-1-1 and emergency communications systems.� Participate in projects EMS-TIF (project to reduce overall emergency response time to the public
for tiered medical responses and motor vehicle collisions) and Text with 9-1-1 for the DHHSI Community.
Emergency Management Branch
The Emergency Management Branch requires approximately 1% of the Department's resources to perform the following services:
The Community Emergency Management Coordinator is responsible for the development, implementation
117117

and maintenance of the City of Barrie's emergency management program in accordance with By-law 2013-142 and the Emergency Management and Civil Protection Act and associated regulations. Fulfillment of this mandate comprises:
� Managing and administering the City's emergency management program. � Identifying hazards and assessing risks to public safety in the community. � Develop and maintain a hazard identification risk assessment of probable events or incidents that
could cause threats to public safety. � Using information obtained from the hazard identification risk assessment assess and promote
corporate and departmental preparation for highest probable events. � Formulating and maintaining comprehensive emergency plans and capabilities for the City of
Barrie. � Train management and staff to ensure they are ready and able to implement the emergency plans. � Conducting education programs to ensure the public are able to respond appropriately in an
emergency. � Providing emergency management advice and guidance to City staff and the community. � Perform practice exercises involving specific staff designed to build confidence and familiarity
within the emergency management structure. � Coordinate emergency management efforts with appropriate corporate, community, provincial, and
federal partners.Fire Prevention Branch
The Fire Prevention Branch requires approximately 4.9% of the Department's resources. The Fire Prevention Branch provides services focused on the first two lines of defense. Our first line of defense is public education which involves the following services:
� Create and promote public education programs based on risks and vulnerabilities to ensure the general public has the necessary tools to:
� Prevent fires from happening � Detect and react to fires that do occur.
� Educate the public and target specific behaviour in the community for the purpose of creating and promoting a fire safe community.
� Maintain a media presence with fire prevention messaging in conjunction with Access Barrie representatives.
� Promote fire safety and fire prevention education at community events and events planned by the fire department.
The second line of defense encompasses the following services:
� Enforcement of the Ontario Fire Code, and applicable City of Barrie By-laws. � Perform fire safety inspections of buildings to ensure compliance to the Fire Code based on:
� Complaint about fire safety conditions � Requests for inspections � Routine inspection schedules based on risk determined out of probability and consequence
evaluations. � Required annual inspections that are mandated by legislation.
� Implement and maintain a fire alarm and carbon monoxide alarm program for city of Barrie required by provincial legislation.
� Conduct investigations of fires that occur in City of Barrie to determine cause and origin to promote improvements to the first two lines of defense.
Legislated requirement to follow-up on complaints, investigate fires and inspect occupancies
Operations Branch
The Operations Branch requires approximately 76% of the Department’s resources to perform the following services:
� The Operations Branch responds to an array of emergency incidents, public events and public education opportunities.
� The Operations Branch strives to achieve Council’s direction of a less than 6 minute road response to all incidents.
118118

� Types of emergency responses include the following, but not limited to: reported fires, fire and CO alarms, technical rescues, hazardous materials responses, motor vehicle collisions, assisting other emergency services and medical emergencies.
� BFES has been aggressively been promoting its ability to provide technical rescue support to the Municipalities of Simcoe County, which has resulted in revenue generation opportunities. This revenue will be directed to the enhancement of training in these disciplines and the purchase of supporting pieces of equipment.
� BFES responds to medical related incidents, which has resulted in BFES personnel successfully resuscitating a number of vital signs absent patients. Continued emergency response in this area will directly improve the safety of Barrie residents.
� Over the past number of years, BFES has enhanced its level of training to remain in compliance with the requirements of training under the Occupational Health & Safety Act and numerous NFPA Professional Qualification Standards.
� The Operations Branch is committed to providing the highest level of service to the citizens of Barrie and surrounding areas.
� BFES will solicit feedback from its citizens on the level of service it provides through public consultation in order to identify opportunities for improvement in our service provision.
Training Branch
The Training Branch requires approximately 3.9% of the Department’s resources to perform the following service:
� The Training Branch is responsible for program development and delivery of all disciplines as identified in the Establishing and Regulating By-Law 2012-200, of which the Operations Branch responds to.
� These include, but are not limited to: fires, fire and CO alarms, technical rescue, hazardous materials, medical, motor vehicle collisions, ice rescues.
� All programs are governed by numerous pieces of legislation, regulations and standards.� All training must outline the objectives, the method of delivery and the program outcomes.� The training branch shall document all training assignments and provide supporting documentation
indicating that these assignments have been completed, and are in accordance with the program as developed.
� Provide various types of support training for numerous fire services in Simcoe County. Given the increasing amount of services being provided to surrounding departments, the goal is to maximize the interoperability between BFES and the departments within Simcoe County.
Key Departmental Objectives� Prevent or reduce loss of life and/or property damage by responding with an effective response force
to emergency calls for service for an array of incidents. � Establish and deliver risk based public education programs for appropriate ages with the goal of
reducing or eliminating preventable fires and/or actions to take when a fire does occur. � Provide request, complaint routine annual inspection services and establish a risk based inspection
program to leverage resources to focus on the greatest vulnerabilities to the risk of fire. � Provide training and education to all staff to meet required legislated training and safety standards
and to enhance career and development and promote succession planning. � Provide communication services to Barrie and contracted municipalities that meet service delivery
standards. � Provide for public safety by creating an emergency resilient community through:
� Emergency plans that address the likely hazards, risks and potential emergencies that could arise in the City.
� Capability to respond to and recover from emergency situations while continuing to provide necessary services to residents not directly affected by the emergency.
A citizenry that is well informed about and prepared to deal with the potential hazards, risks and emergencies that could affect them.Strategic Plan & Other Program Deliverables
� Comply with the Office of the Fire Marshal & Emergency Management guidelines, Fire Code, FPPA (Fire Protection & Prevention Act) and other legislated requirements.
� Comply with the requirements for the fire service as set out by the Occupational Health & Safety Act.
119119

� Review, revise and implement the Fire Master Plan. � Comply with Council direction and priorities. � Promote safety to the citizens of Barrie through proactive public education. � Enhance service delivery levels to the public. � Enhance the health and safety of responding personnel.� Compliance with the annual requirements for municipal emergency management programs and plans
under the Emergency Management and Civil Protection Act.Major Initiatives/Issues
� Review, revise and implement the Fire Master Plan including the Short Term, Medium Term and Long Term Objectives.
� Review staffing levels in the branches consistent with an organization review of service delivery needs of the department/public and anticipated growth aligned with the annual business planning process.
� Participate in a regional CBRNE (Chemical/Biological/Radiological/Nuclear/Explosive) response team in partnership with the County of Simcoe.
� Enter into service provision contracts with other Fire Services within the County, primarily technical rescue.
� BFES will solicit feedback from its citizens on the level of service it provides through public consultation in order to identify opportunities for improvement in our service provision.
� Continue to enhance technical rescue capabilities of the department. � Monitor response benchmarking including turnout time, less than 6 minute road response on a
monthly basis and identify areas of concern. � Review, track and monitor emergency service benchmarks established for Emergency
Communication Centres. � Increase the number of inspections performed through the use of an appropriate inspection-based
program using new technology. � Capture, analyze and interpret data with the sole purpose of developing suitable community-oriented
public education programs.� Effectively and actively investigate all fires with the purpose of ensuring compliance is met within
specific time periods.� Monitor and tract all occupancy inspections with the purpose of ensuring compliance is met with
specific time periods. � Develop specific, targeted messages to homeowners and tenants on fire safety through the use of
educational material and the local media. � Develop a new school program to educate children on matters of fire safety with the involvement of
prevention and operations staff.� Create an e-learning environment through the creation of a web-based program and establish
electronic data storage for training materials. � Enhance
� Emergency operations centre operational capability.� Hazard-based emergency plans and supporting agreements with stakeholders.� Public participation in awareness programs
Key Performance Indicators
Indicator 2014 Actual 2015 Plan 2015 Projected 2016 PlanEmergency call handling time for NFPA 1221 - Barrie only
98% 96% 96% 95%
Emergency response call volumes - Barrie only
7963 8200 8200 8450
Less than 6 minute road response - 90% of the time, all calls
92.35% 95% 93% 94%
Public education community touch points 10,000 11,000 11,500
Total fire code inspections - All 1649 1600 1600 1650
120120

COMMUNITY AND CORPORATE SERVICESBARRIE FIRE & EMERGENCY
2014 2015 2015 2016 2017 2018ACTUAL BUDGET FORECAST BUDGET FORECAST FORECAST
EXPENSESSalaries 17,232,075 18,328,137 18,119,692 19,163,822 19,447,129 19,739,156 Fringe Benefits 3,884,688 4,035,634 4,278,491 4,357,417 4,422,716 4,489,133 Total Salaries and Benefits 21,116,763 22,363,771 22,398,183 23,521,239 23,869,845 24,228,289 OPERATING EXPENSESGeneral Operations 641,212 580,205 603,036 613,055 630,265 643,000 Minor Capital 211,846 247,900 245,807 250,400 255,400 260,450 Hydro, Water, Sewer, Gas - - - - - - Transfers to other Boards, Municipalities, Agencies - - - - - - Total Operating Expenses before Debenture Costs and Transfers 853,058 828,105 848,843 863,455 885,665 903,450 DEBENTURE COSTS AND TRANSFERSLease Equipment/Property 1,058,798 1,014,743 1,015,102 1,019,092 1,064,887 1,090,360 Financial Expenses 346 360 419 700 700 700 Transfer to/from User Rate Reserve Funds - - - - - - Transfer to Reserves - - - - - - Transfer to Capital Fund - - - - - - Total Debenture Costs and Transfers 1,059,144 1,015,103 1,015,521 1,019,792 1,065,587 1,091,060 Gross Expenditures 23,028,965 24,206,979 24,262,547 25,404,486 25,821,097 26,222,799 Revenues Other Government Funding (319,007) (387,518) (362,434) (408,536) (413,536) (413,536) Contribution from Reserves/Reserve Funds (138,274) (233,553) (350,872) (270,553) (273,553) (273,553) Licences, Permits, Application Fees - - - - - - Fines - - - - - - Fees, Charges, Service Rentals (278,038) (293,000) (258,291) (307,000) (314,000) (314,000) Other Revenue - - - (25,000) (27,000) (27,000) Total Revenues (735,319) (914,071) (971,597) (1,011,089) (1,028,089) (1,028,089) Net Operating Expense/(Revenue) 22,293,646 23,292,908 23,290,950 24,393,397 24,793,008 25,194,710
CITY OF BARRIE2016 OPERATING BUDGET
EXPENDITURES
121121

2014 2015 2015 2016 Service 2016Actual Approved Forecasted Base Level Requested
Expenditures Budget Expenditure Budget Change(s) Budget$ $ $ $ $ $ $ % $ % Comments
EXPENSESSalaries 17,232,075 18,328,137 18,119,692 19,163,822 - 19,163,822 835,685 5% 835,685 5% Salary increases as per the Collective
Agreement, Step increases and increase to experience pay. Filling of various vacancies throughout 2015.
Fringe Benefits 3,884,688 4,035,634 4,278,491 4,357,417 - 4,357,417 321,783 8% 321,783 8% As a result of increase in Salaries and as noted above
Total Salaries and Benefits 21,116,763 22,363,771 22,398,183 23,521,239 - 23,521,239 1,157,468 5% 1,157,468 5%OPERATING EXPENSESGeneral Operations 641,212 580,205 603,036 613,055 - 613,055 32,850 6% 32,850 6% Equipment repairs are up as is medical
supplies and as a result of the lower Canadian $.
Minor Capital 211,846 247,900 245,807 250,400 - 250,400 2,500 1% 2,500 1% Minor increaseHydro, Water, Sewer, Gas - - - - - - - 0% - 0%Transfers to other Boards, Municipalities, Agencies - - - - - - - 0% - 0%Total Operating Expenses before Debenture Costs and Transfers 853,058 828,105 848,843 863,455 - 863,455 35,350 4% 35,350 4%
DEBENTURE COSTS AND TRANSFERSLease Equipment/Property 1,058,798 1,014,743 1,015,102 1,019,092 - 1,019,092 4,349 0% 4,349 0% Minor increaseFinancial Expenses 346 360 419 700 - 700 340 94% 340 94% Debit and Credit Card charges expected to
increase as a result of greater use for permits.
Transfer to/from User Rate Reserve Funds - - - - - - - 0% - 0%Transfer to Reserves - - - - - - - 0% - 0%Transfer to Capital Fund - - - - - - - 0% - 0%Total Debenture Costs and Transfers 1,059,144 1,015,103 1,015,521 1,019,792 - 1,019,792 4,689 0% 4,689 0%Gross Expenditures 23,028,965 24,206,979 24,262,547 25,404,486 - 25,404,486 1,197,507 5% 1,197,507 5% Revenues Other Government Funding (319,007) (387,518) (362,434) (408,536) - (408,536) (21,018) 5% (21,018) 5% Addition of Midland and Blue Mountains as
dispatch customers. Contribution from Reserves/Reserve Funds (138,274) (233,553) (350,872) (270,553) - (270,553) (37,000) 16% (37,000) 16% Large amount in 2015 transfer from WSIB
as a result of occupational injuries. Expected to be down in 2016
Licences, Permits, Application Fees - - - - - - - 0% - 0% Fines - - - - - - - 0% - 0% Fees, Charges, Service Rentals (278,038) (293,000) (258,291) (307,000) - (307,000) (14,000) 5% (14,000) 5% Annual increase in OSFBA permits in 2016
and increase in the # of MVCs and chargeable incidents
Other Revenue - - - (25,000) - (25,000) (25,000) #DIV/0! (25,000) 0% Tech Rescue Charges to other municipalities
Total Revenues (735,319) (914,071) (971,597) (1,011,089) - (1,011,089) (97,018) 11% (97,018) 11% Net Operating Expense/(Revenue) 22,293,646 23,292,908 23,290,950 24,393,397 - 24,393,397 1,100,489 5% 1,100,489 5%
COMMUNITY AND CORPORATE SERVICES DIVISIONBarrie Fire & Emergency Services 2016 Base Budget Change Report
Change in 2016 Change in 2016Base Budget Requested Budget
to 2015 Approved Budget to 2015 Approved Budget
122122

Director of Building andBy-law Services
Gord Allison
Office Coordinator ISandy Geary
Office ServicesAssistant
(2)
Manager of Building ServicesStephen Barks
Supervisor of BuildingServices
Karl Korpela
Office ServicesAssistant (PPT)
(1)Supervisor of Building
ServicesChris Glanville
Manager of By-law ServicesTammy Banting
Supervisor of By-lawServices
Jason Forgrave
Supervisor of By-lawServices
Ron Osborne
Community and Corporate Services DivisionBuilding and By-law Services Department
123123

Performance Plan 2016
Department:
Departmental Overview
Building & By-law Services
This department is entrusted to administer and enforce several municipal by-laws and the Ontario Building Code. Through public education we encourage the community and visitors to voluntarily comply with the by-law regulations involving the parking of vehicles, pet controls, land uses, property maintenance, business licensing, sign placement, pool enclosures and building construction. Non-compliant situations brought to the attention of staff may trigger enforcement activity to obtain compliance.
Building Services Branch
This branch requires approximately 66% of the department's resources. Based on historical data and future expectations, the Building Services Branch will deliver the following services in 2016:
� Process 1,500 permits for construction of approximately 300 dwelling units and approximately 80,000m2 of industrial, commercial and institutional floor area with a total construction value of $200 million.
� Conduct approximately 13,000 site inspections of construction projects.� Respond to 140 complaints/enquiries about building construction and grading.
By-law Services Branch
This branch requires approximately 66% of the departments resources. Based on historical data and future expectations, the By-law Services Branch will deliver the following services in 2016 including but not limited to:
� Patrol to monitor 2,353 paid parking areas within the Downtown Core � Patrol to monitor Waterfront paid/permit parking areas � Respond to approximately 50,000 enforcement files � Process and or issue approximately 9,000 administrative files
Key Departmental Objectives� To inspire the community to voluntarily comply with minimum by-law standards � To provide high quality service promptly and at a reasonable cost
Strategic Plan & Other Program Deliverables� Use of web site, newspaper and pamphlets to educate the public � Regular and frequent patrols of the metered parking spaces � Regular patrols, including evenings, of street parking and fire routes � Easily accessible applications with prompt processing for licenses, permits and other approvals � Regular inspections and prompt complaint investigations for licensed businesses and activities and
building construction � Knowledgeable staff for the subject matter of assigned by-laws, with the skills and abilities to evaluate
applications and situations for by-law compliance, communicate deficiencies tactfully to appropriate parties, and use enforcement tools to obtain by-law compliance when necessary.
Major Initiatives/Issues� Being ready for residential development in annexed lands.� Implement and "go live" with APLI system, spring of 2016. Allowing for electronic submissions for
permits, inspection requests and complaints. � Further review the approach to Boarding Lodging Rooming House Licenses and Two Unit
Registration processes. Look at potential revisions and/or streamlining objectives.
124124

Key Performance IndicatorsObjective: Increased voluntary compliance
Indicator 2014 Actual 2015 Plan 2015 Projected 2016 PlanAverage # of inspections to approve occupancy for new dwelling units
2.1 1.8 1.8 1.7
Percent of Business Licenses Renewed by Due Date
81.7% 85% 83% 85%
Volume of By-law Administration Files 8,841 9,300 8,750 9,300
Volume of By-law Enforcement Files 50,484 52,000 49,000 52,000
Objective: Delivery of ServicesIndicator 2014 Actual 2015 Plan 2015 Projected 2016 Plan
Operating cost for Building Permits per $1000 of Construction Activity
12.00 12.00 12.00 11.8
Percentage of Cost Recovery from Fees and Fines (Building Services)
100% 100% 100% 100%
Percentage of Cost Recovery from Fees and Fines (By-law Services)
43.4% 45% 48.4% 50%
Objective: Timely Delivery of ServicesIndicator 2014 Actual 2015 Plan 2015 Projected 2016 Plan
Percentage of Building Permit applications reviewed within legislated timeframes
94% 95% 95% 96%
125125

COMMUNITY AND CORPORATE SERVICESBUILDING AND BY-LAW ENFORCEMENT
2014 2015 2015 2016 2017 2018ACTUAL BUDGET FORECAST BUDGET FORECAST FORECAST
EXPENSESSalaries 3,245,188 3,662,631 3,355,252 3,729,064 3,784,789 3,841,343 Fringe Benefits 773,127 804,502 799,019 883,185 896,433 909,879 Total Salaries and Benefits 4,018,315 4,467,133 4,154,271 4,612,249 4,681,222 4,751,222 OPERATING EXPENSESGeneral Operations 508,758 535,768 502,408 535,150 543,468 560,182 Minor Capital 40,740 17,732 13,348 17,820 17,820 17,820 Hydro, Water, Sewer, Gas - - - - - - Transfers to other Boards, Municipalities, Agencies - - - - - - Total Operating Expenses before Debenture Costs and Transfers 549,498 553,500 515,756 552,970 561,288 578,002 DEBENTURE COSTS AND TRANSFERSLease Equipment/Property 250,180 305,026 295,693 305,377 305,953 307,999 Financial Expenses 37,032 18,800 22,698 40,000 44,000 50,000 Transfer to/from User Rate Reserve Funds - - - - - - Transfer to Reserves 383,469 (260,672) (260,672) (260,700) (260,700) (260,700) Transfer to Capital Fund - - - - - - Total Debenture Costs and Transfers 670,681 63,154 57,719 84,677 89,253 97,299 Gross Expenditures 5,238,494 5,083,787 4,727,746 5,249,896 5,331,763 5,426,523 Revenues Other Government Funding - - - - - - Contribution from Reserves/Reserve Funds (647) - (349) - - - Licences, Permits, Application Fees (3,748,738) (3,362,802) (3,199,224) (3,551,290) (3,567,597) (3,609,352) Fines (869,219) (899,000) (943,732) (924,000) (935,000) (946,000) Fees, Charges, Service Rentals (276,804) (213,900) (201,955) (206,600) (209,600) (213,600) Other Revenue (29,712) (21,000) (22,589) (21,000) (21,000) (21,000) Total Revenues (4,925,120) (4,496,702) (4,367,849) (4,702,890) (4,733,197) (4,789,952) Net Operating Expense/(Revenue) 313,374 587,085 359,897 547,006 598,566 636,571
CITY OF BARRIE2016 OPERATING BUDGET
EXPENDITURES
126126

2014 2015 2015 2016 Service 2016Actual Approved Forecasted Base Level Requested
Expenditures Budget Expenditure Budget Change(s) Budget$ $ $ $ $ $ $ % $ % Comments
EXPENSESSalaries 3,245,188 3,662,631 3,355,252 3,729,064 60,215 3,789,279 66,433 2% 126,648 3% Increase attributed to COLA, merit
increases, JE adjustments and full year impact of complement changes in 2015
Fringe Benefits 773,127 804,502 799,019 883,185 15,655 898,840 78,683 10% 94,338 12% Contract changesTotal Salaries and Benefits 4,018,315 4,467,133 4,154,271 4,612,249 75,870 4,688,119 145,116 3% 220,986 5%OPERATING EXPENSESGeneral Operations 508,758 535,768 502,408 535,150 - 535,150 (618) 0% (618) 0%Minor Capital 40,740 17,732 13,348 17,820 - 17,820 88 0% 88 0%Hydro, Water, Sewer, Gas - - - - - - - 0% - 0%Transfers to other Boards, Municipalities, Agencies - - - - - - - 0% - 0%Total Operating Expenses before Debenture Costs and Transfers 549,498 553,500 515,756 552,970 - 552,970 (530) 0% (530) 0%
DEBENTURE COSTS AND TRANSFERSLease Equipment/Property 250,180 305,026 295,693 305,377 - 305,377 351 0% 351 0%Financial Expenses 37,032 18,800 22,698 40,000 - 40,000 21,200 113% 21,200 113% Increased use of on-line payments has
increased the bank service feesTransfer to/from User Rate Reserve Funds - - - - 1,530 1,530 - 0% 1,530 0%Transfer to Reserves 383,469 (260,672) (260,672) (260,700) - (260,700) (28) 0% (28) 0%Transfer to Capital Fund - - - - - - - 0% - 0%Total Debenture Costs and Transfers 670,681 63,154 57,719 84,677 1,530 86,207 21,523 34% 23,053 37%Gross Expenditures 5,238,494 5,083,787 4,727,746 5,249,896 77,400 5,327,296 166,109 3% 243,509 5% Revenues Other Government Funding - - - - - - - 0% - 0% Contribution from Reserves/Reserve Funds (647) - (349) - - - - 0% - 0% Licences, Permits, Application Fees (3,748,738) (3,362,802) (3,199,224) (3,551,290) (77,400) (3,628,690) (188,488) 6% (265,888) 8% Despite an increase in fee rates, land
constraints have leveled out building permit activities
Fines (869,219) (899,000) (943,732) (924,000) - (924,000) (25,000) 3% (25,000) 3% Fees, Charges, Service Rentals (276,804) (213,900) (201,955) (206,600) - (206,600) 7,300 -3% 7,300 -3% Due to effective enforcement efforts, higher
compliance rates are being achieved resulting in fewer tickets and service fee charges
Other Revenue (29,712) (21,000) (22,589) (21,000) - (21,000) - 0% - 0% Total Revenues (4,925,120) (4,496,702) (4,367,849) (4,702,890) (77,400) (4,780,290) (206,188) 5% (283,588) 6% Net Operating Expense/(Revenue) 313,374 587,085 359,897 547,006 - 547,006 (40,079) -7% (40,079) -7% When corporate overheads are added,
the services delivered by this department cost approximately $6.6 million, with an overall cost recovery of over 90% from collected revenues.
Base Budget Requested Budgetto 2015 Approved Budget to 2015 Approved Budget
COMMUNITY AND CORPORATE SERVICES DIVISIONBuilding and By-Law Enforcement Department
2016 Base Budget Change Report
Change in 2016 Change in 2016
127127

Director of FinanceCraig Millar
Deputy TreasurerMichael Jermey
Manager of PurchasingDavid Allan
Supervisor of Budget andTreasury
Heather Miller
Supervisor of DevelopmentCharges
Alison Gallant
Manager of RevenueKathleen Short
Manager of AccountingLila Jermey
Senior Financial AnalystVacant
Administrative Assistant –Finance
Lisa Weiland
Revenue and TaxationSupervisor
Renate McDougall
Supervisor of WaterWastewater Billing
Allison Bullock
Indicates temporaryposition
Supervisor of AccountingServices
Wendy Oickle
Performance AnalystVanessa Goodfellow/
Darrell Cowen/Vacant
Performance AnalystArthur Clarke
Community and Corporate Services DivisionFinance Department
128128

Performance Plan 2016
Department:
Departmental Overview
Finance
The Finance Department supports the Corporation deliver on Council’s Strategic plan by providing four essential services: accounting services, corporate finance, procurement and revenue management. The departments main deliverables include the audited financial statements, coordinating the annual business plan and budget, treasury and debt management, procurement administration and support, property tax revenue management, and water and wastewater revenue management
Accounting Services
Accounting Services is responsible for delivering the following:
� Compile draft consolidated financial statements, Financial Information Return, and all related working schedules for external audit.
� Compile and submit all mandatory external financial reporting documents and facilitate related audit requirements
� Develop and maintain appropriate internal control policies and practices, as well as test for compliance and provide regular compliance reporting to the City's Executive Management team.
� Provide advisory services to the Corporation regarding appropriate accounting treatment for transactions in accordance with PSAB.
� Provide financial guidance and support to related Boards & Commissions
� Provide business support as it relates to financial and non-financial performance reporting
� Process over 39,000 vendor invoices within 30 days (on average)
� Process, monitor and follow up on all outstanding municipal billings, collecting over 4,500 invoices.
Corporate Finance
Corporate Finance is responsible for delivering the following:
� Coordinates the annual business plan and budget development process
� Recommends key corporate financial policies and strategies including those related to development charges, reserve management, debt management and investment strategies
� Provides financial support to the Corporation through the development and monitoring long range financial plans and strategies to ensure that operating and capital plans are sustainable.
� Provides financial support to departments and senior management in the areas of financial management, performance management, budget development and special projects.
129129

� Provides quarterly performance reporting based on the annual business plan, semi annual reporting on the Capital Plan which includes project status, additional capital funding requirements and project closures .
� Treasury management which includes the execution of all cash, investment and debt transactions
Corporate Procurement
Procurement services are administered through the City’s procurement by-law and responsibilities include:
� Provide professional support to city departments with regards to developing and executing annual procurement plans.
� Work with Client departments to develop and facilitate a projected 175 procurement documents that will attract competitive bids from qualified suppliers.
� Internal training offered semi-annually to the corporation� Compliance monitoring and regular reporting to the City's Executive Management Team. � Policy analysis including monitoring legislation and researching best practices for the City of Barrie� Maintain Appropriate levels of inventory, personal equipment and tooling to meet operation needs
and ensure effective cost controls; and provide 24/7 customer support through two stores operations (SWTP and Ops Centre).
Revenue Management
The Revenue Branch delivers tax, water and wastewater billing, collection and customer services:
� Handling 36,000 customer phone calls and 33,000 in person inquiries relating to property taxes, water and wastewater
� Issuance and collection of 75,000 municipal property tax bills
� Proactive assessment management which includes direct involvement and participation in assessment appeals, tracking permits and following up with MPAC ensuring timely updating of assessment rolls, continuous monitoring and reconciling existing property tax classifications against MPAC tax rolls
� Issuance and collection of 280,000 water and wastewater bills annually
Key Departmental ObjectivesIn supporting the corporation’s mission, vision, and values, the key objectives for the Finance department include:
� Financial information – accurate, complete, timely� Promoting innovation – internal and external customers� Mitigating business risk – internal policies and controls, procurement, long range financial planning,
compliance reporting.� Enhancing transparency – financial reporting, legislative reporting, procurement, business plan and
budget� Identifying business opportunities – policy, analysis, revenue management, procurement
Strategic Plan & Other Program Deliverables� Improve the timeliness, relevance and accuracy of financial reporting to the Corporation to support
decision making
� Develop and maintain internal control policies and practices, including compliance monitoring
� Proactive management of assessment, including a review of property taxation processes and
130130

procedures
� Establish mechanisms to monitor the financial aspects of growth and to administer developer agreements
� Update the Long Range Financial Plan to reflect approved growth management plans
Major Initiatives/Issues� Continue to support and participate in the implementation of the Enterprise Resource Planning
System (ERP)
� Support and participate in the implementation of a new budgeting solution as part of the ERP project
� Develop and maintain Internal Control Policies and practices, including compliance monitoring
� Work with Engineering, Building and Planning to develop a process to monitor actual development activity against planned development activity for reporting to all stakeholders and to Develop process for administering developer agreements
� Support the implementation of the Corporate Customer Service Project
� Implementation of the procurement services review - updated procurement by-law, revised policy, protocols and templates
� Taxation service review including policies, processes and efficienciesKey Performance Indicators
Financial Information - accurate, complete, timelyIndicator 2014 Actual 2015 Plan 2015 Projected 2016 Plan
Audited Financial Statement Completion Date
July 2014 NA June 2015 June 2016
Quarterly Reports 3 3 3 3
Capital Status Reports 2 2 2 2
Promoting InnovationIndicator 2014 Actual 2015 Plan 2015 Projected 2016 Plan
Days to complete a procurement process 95 77 92 77
Percentage of invoices paid in 30 days 76.87% 75% 70% 75%
Percentage of tax, water, and wastewater bills paid electronically
NA NA NA 92%
Mitigating Business RiskIndicator 2014 Actual 2015 Plan 2015 Projected 2016 Plan
Corporate procurement training for staff with spending authority
NA NA NA 100%
Compliance reports - procurement, P-card, and AP processing
NA NA NA 3
Identifying Business OpportunitiesIndicator 2014 Actual 2015 Plan 2015 Projected 2016 Plan
Benefits of tendering process 7.08% 10% 10% 10%
131131

Average number of bids received per bid process
4.3 5.0 4.7 5.0
Tax arrears as a per cent of current year levy
6.25% 6.5% 6.5% 6.5%
Water Wastewater arrears as a percentage of last 12 months of billing
14.0% 10.0% 10.0% 9.0%
Number of months between occupancy and assessment received on assessment roll
18 14 14 13
Return on Investments NA NA NA Average Bank Rate plus 1.0 %
132132

COMMUNITY AND CORPORATE SERVICESFINANCE
2014 2015 2015 2016 2017 2018ACTUAL BUDGET FORECAST BUDGET FORECAST FORECAST
EXPENSESSalaries 3,416,266 3,596,449 3,222,599 3,724,685 3,659,792 3,714,650 Fringe Benefits 817,001 843,198 831,194 920,374 934,179 948,192 Total Salaries and Benefits 4,233,267 4,439,647 4,053,793 4,645,059 4,593,971 4,662,842 OPERATING EXPENSESGeneral Operations 654,118 567,248 552,669 616,983 319,913 321,268 Minor Capital 4,529 3,335 4,352 5,000 1,000 1,000 Hydro, Water, Sewer, Gas - - - - - - Transfers to other Boards, Municipalities, Agencies - - - - - - Total Operating Expenses before Debenture Costs and Transfers 658,647 570,583 557,021 621,983 320,913 322,268 DEBENTURE COSTS AND TRANSFERSLease Equipment/Property 2,495 2,628 2,585 2,824 1,140 1,150 Financial Expenses 8,769 12,628 8,374 12,600 4,200 4,200 Transfer to/from User Rate Reserve Funds - - - - - - Transfer to Reserves - - - - - - Transfer to Capital Fund - - - - - - Total Debenture Costs and Transfers 11,264 15,256 10,959 15,424 5,340 5,350 Gross Expenditures 4,903,178 5,025,486 4,621,773 5,282,466 4,920,224 4,990,460 Revenues Other Government Funding - - - - - - Contribution from Reserves/Reserve Funds (112,291) (4,800) 5,682 (22,500) - - Licences, Permits, Application Fees (209,402) (215,325) (212,343) (224,400) - - Fines - - - - - - Fees, Charges, Service Rentals (415,278) (550,190) (548,418) (574,000) (336,000) (336,000) Other Revenue (725,723) (763,278) (643,739) (792,616) (794,573) (796,559) Total Revenues (1,462,694) (1,533,593) (1,398,818) (1,613,516) (1,130,573) (1,132,559) Net Operating Expense/(Revenue) 3,440,484 3,491,893 3,222,955 3,668,950 3,789,651 3,857,901
CITY OF BARRIE2016 OPERATING BUDGET
EXPENDITURES
133133

2014 2015 2015 2016 Service 2016Actual Approved Forecasted Base Level Requested
Expenditures Budget Expenditure Budget Change(s) Budget$ $ $ $ $ $ $ % $ % Comments
EXPENSESSalaries 3,416,266 3,596,449 3,222,599 3,724,685 107,189 3,831,874 128,236 4% 235,425 7% In addition to economic adjustments of 1.5
per cent, increases reflect annualization costs for the Supervisor of DC's approved in 2015. In addition, cost increase reflects two new positions requested as described on intake forms #1017 & #1027.
Fringe Benefits 817,001 843,198 831,194 920,374 25,317 945,691 77,176 9% 102,493 12% Same as above.Total Salaries and Benefits 4,233,267 4,439,647 4,053,793 4,645,059 132,506 4,777,565 205,412 5% 337,918 8%OPERATING EXPENSESGeneral Operations 654,118 567,248 552,669 616,983 3,200 620,183 49,735 9% 52,935 9%Minor Capital 4,529 3,335 4,352 5,000 - 5,000 1,665 50% 1,665 50%Hydro, Water, Sewer, Gas - - - - - - - 0% - 0%Transfers to other Boards, Municipalities, Agencies - - - - - - - 0% - 0%Total Operating Expenses before Debenture Costs and Transfers 658,647 570,583 557,021 621,983 3,200 625,183 51,400 9% 54,600 10%
DEBENTURE COSTS AND TRANSFERSLease Equipment/Property 2,495 2,628 2,585 2,824 - 2,824 196 7% 196 7%Financial Expenses 8,769 12,628 8,374 12,600 - 12,600 (28) 0% (28) 0%Transfer to/from User Rate Reserve Funds - - - - - - - 0% - 0%Transfer to Reserves - - - - - - - 0% - 0%Transfer to Capital Fund - - - - - - - 0% - 0%Total Debenture Costs and Transfers 11,264 15,256 10,959 15,424 - 15,424 168 1% 168 1%Gross Expenditures 4,903,178 5,025,486 4,621,773 5,282,466 135,706 5,418,172 256,980 5% 392,686 8% Revenues Other Government Funding - - - - - - - 0% - 0% Contribution from Reserves/Reserve Funds (112,291) (4,800) 5,682 (22,500) - (22,500) (17,700) 369% (17,700) 369% Licences, Permits, Application Fees (209,402) (215,325) (212,343) (224,400) - (224,400) (9,075) 4% (9,075) 4% Fines - - - - - - - 0% - 0% Fees, Charges, Service Rentals (415,278) (550,190) (548,418) (574,000) - (574,000) (23,810) 4% (23,810) 4% Other Revenue (725,723) (763,278) (643,739) (792,616) - (792,616) (29,338) 4% (29,338) 4% The revenue recoveries associated with 2
finance positions are budgeted within Planning and Building , which total $199k. In addition, interest revenues associated with the proposed Supervisor of Investments and Debt Management (intake form #1027) is Budgeted within Corporate Revenue with a net positive impact of $153K.
Total Revenues (1,462,694) (1,533,593) (1,398,818) (1,613,516) - (1,613,516) (79,923) 5% (79,923) 5% Net Operating Expense/(Revenue) 3,440,484 3,491,893 3,222,955 3,668,950 135,706 3,804,656 177,057 5% 312,763 9% The 2016 proposed Finance budget is
increasing by 3%, which includes the revenues noted above.
Base Budget Requested Budgetto 2015 Approved Budget to 2015 Approved Budget
COMMUNITY AND CORPORATE SERVICES DIVISIONFinance Department
2016 Base Budget Change Report
Change in 2016 Change in 2016
134134

Director of Legal ServicesIngrid Peters
Office Coordinator ICinthia Owen
Legal CounselPeter Krysiak
Legal Counsel – SolicitorZarah Walpole
Law Clerk(2)
Prosecutions Clerk
Manager of Legal ServicesAndrew Mills
Community and Corporate Services DivisionLegal Services Department
Prosecutions Clerk(Bilingual)
Legal Office Assistant
Senior ProsecutorMichael Skof
Municipal ProsecutorChristopher Bennett/ SandraDoyle/ Seamus Feeney/ AprilPatterson/ Catherine Powell
Insurance Risk ExaminerShelley Haughton
Senior Real EstateOfficer
Real Estate ServicesOfficer
135135

Performance Plan 2016
Department:
Departmental Overview
Legal Services
The Legal Services Department provides: (i) timely and high quality legal advice to City Council, the CAO and City staff, and provides a full range of legal services to the Corporation, its boards and agencies in a cost effective manner (ii) insurance administration and risk management (iii) professional execution of the City's real estate programme including acquisition, disposition, leasing and encroachments (iv) prosecutorial services for charges laid under the provisions of the Provincial Offences Act and Highway Traffic Act for the Barrie and Orillia Court Service areas. The department strives to ensure that every measure is taken to provide a cost effective, high quality standard of service.
Legal SupportLegal Support requires approximately 24% of the department's staff resources to perform the following services:
� coordination of all legal services for the City� legal advice and direction to Council and City Departments� management of litigation and administrative tribunal proceedings to which the City is a party.� discussion and negotiation with external parties, lawyers, tribunals, governmental bodies and boards for protection of the City's
interests� oversight of prosecution activities� review, preparation and registration of all by-laws (including part lot control by-laws, deeming by-laws, site specific amendments to
the zoning by-law, site specific development charge act by-laws) and real estate documents� preparation of precedent and customized agreements including development agreements� title and corporate searches� provision of legal advice, including document preparation and negotiation on City strategic initiatives� permanent road closures
Real Estate Matters
Real Estate Services requires approximately 20% of the Department's staff resources to perform the following services:� acquisition and disposition of City real estate assets � lease/licence of property for the City as both tenant and landlord � evaluation and appraisal services and advice� encroachments and releases of easements
Prosecutorial Services
Prosecutions requires approximately 50% of the Department's staff resources to perform the following services:� administrative and prosecutorial work associated with charges laid under provisions of the Provincial Offences Act and Highway
Traffic Act by municipalities and enforcement agencies in Barrie and Orillia Court Service Areas � management of approximately 22,000 matters before the courts
Insurance Services
Insurance Services requires approximately 6% of the Department's staff resources to perform the following services:� processing and management of over 250 insurance claims annually� provision of input into insurance coverage requirements for City initiatives and events� risk management for City owned facilities and services
Key Departmental Objectives� timely and cost effective acquisition of property for City purposes and Council priorities
136136

� high quality and timely legal advice provided in a cost effective manner � accurate and timely real estate advice � successful prosecution of charges laid under the Provincial Offences and Highway Traffic Act� respond and appropriately manage insurance claims received. � timely preparation and registration of development agreements
Strategic Plan & Other Program Deliverables� improved comprehensive oversight of legal services leading to better financial management of legal expenses and more effective legal
representation for the City � support of City priorities through the acquisition of property in a timely and cost effective manner � adherence to the Memorandum of Understanding with the Province of Ontario as it relates to prosecutions
Major Initiatives/Issues� implement chargebacks, cost recovery or external billing of legal, real estate and prosecution services as appropriate and consistent
with corporate policy. � provide a high level of support to corporate strategic priorities, e.g. Invest Barrie, First Responders Campus and University readiness
projects.� Detailed processes for land development under the Memorandum of Understanding. � develop expertise and provide internal support to (i) expropriation process and (ii) handling of liability and cost issues on remediation
and sale of environmentally contaminated property (PS3260 policy)� provide prosecutorial support to Barrie and Orillia court service areas and to contracted enforcement agencies, utilizing industry best
practices including: (i) electronic disclosure under CAMS and (ii) XRP pilot project to encourage continuity in process and procedure, and enhanced prosecutorial success on behalf of clients
� collaborate with affected departments on an approach to risk identification and mitigation of claim exposure including: (i) provision of information on claims history, (ii) regular reviews of information with affected departments and (iii) development of remedial strategies
� Design and implement a lease registry to track pertinent information for all City leases
Key Performance IndicatorsTimely and cost effective completion of property agreements
Indicator 2014 Actual 2015 Plan 2015 Projected 2016 Plan# of property transactions completed (acquisition, disposition, expropriation, release of easement, lease and encroachment)
N/A 21 21 21
% of properties acquired by negotiation vs expropriation
N/A 80 90 90
Accurate, timely and cost effective legal advice
Indicator 2014 Actual 2015 Plan 2015 Projected 2016 PlanExternal Legal Costs 349,679 450,000 841,258 450,000
Effective prosecution of Provincial Offences and Highway Traffic Act charges
Indicator 2014 Actual 2015 Plan 2015 Projected 2016 Plan% of prosecutorial success 65 65 65 65
% of trial requests resolved by XRP (2015 pilot project Nottawasaga OPP)
N/A 70 25 30
Accurate, timely and cost effective managing/processing of insurance claims/incidents
Indicator 2014 Actual 2015 Plan 2015 Projected 2016 Plan% of insurance claims/incidents handled in-house 85 80 80 80
Ratio of closed to opened files N/A .95:1 .95:1 .95 : 1
137137

COMMUNITY AND CORPORATE SERVICESLEGAL SERVICES
2014 2015 2015 2016 2017 2018ACTUAL BUDGET FORECAST BUDGET FORECAST FORECAST
EXPENSESSalaries 1,386,011 1,520,819 1,415,011 1,563,781 1,587,976 1,612,534 Fringe Benefits 348,102 363,501 371,059 377,715 383,530 389,432 Total Salaries and Benefits 1,734,113 1,884,320 1,786,070 1,941,496 1,971,506 2,001,966 OPERATING EXPENSESGeneral Operations 467,375 590,344 981,475 592,067 593,689 595,353 Minor Capital - - - - - - Hydro, Water, Sewer, Gas - - - - - - Transfers to other Boards, Municipalities, Agencies - - - - - - Total Operating Expenses before Debenture Costs and Transfers 467,375 590,344 981,475 592,067 593,689 595,353 DEBENTURE COSTS AND TRANSFERSLease Equipment/Property - - - - - - Financial Expenses - - - - - - Transfer to/from User Rate Reserve Funds - - - - - - Transfer to Reserves - - - - - - Transfer to Capital Fund - - - - - - Total Debenture Costs and Transfers - - - - - - Gross Expenditures 2,201,488 2,474,664 2,767,545 2,533,563 2,565,195 2,597,319 Revenues Other Government Funding (28,760) (15,000) (17,159) (15,000) (15,000) (15,000) Contribution from Reserves/Reserve Funds - - - - - - Licences, Permits, Application Fees (13,269) (8,488) (15,464) (8,518) (8,518) (8,518) Fines (82,179) (78,875) (159,478) (81,025) (81,025) (81,025) Fees, Charges, Service Rentals (152,838) (24,483) (44,114) (24,483) (24,483) (24,483) Other Revenue (791,143) (820,332) (841,716) (830,282) (843,428) (859,790) Total Revenues (1,068,189) (947,178) (1,077,931) (959,308) (972,454) (988,816) Net Operating Expense/(Revenue) 1,133,299 1,527,486 1,689,614 1,574,255 1,592,741 1,608,503
CITY OF BARRIE2016 OPERATING BUDGET
EXPENDITURES
138138

2014 2015 2015 2016 Service 2016Actual Approved Forecasted Base Level Requested
Expenditures Budget Expenditure Budget Change(s) Budget$ $ $ $ $ $ $ % $ % Comments
EXPENSESSalaries 1,386,011 1,520,819 1,415,011 1,563,781 - 1,563,781 42,962 3% 42,962 3% Step Increases, Job reevaluations and Cost
of Living Increases.Fringe Benefits 348,102 363,501 371,059 377,715 - 377,715 14,214 4% 14,214 4% Same as above.Total Salaries and Benefits 1,734,113 1,884,320 1,786,070 1,941,496 - 1,941,496 57,176 3% 57,176 3%OPERATING EXPENSESGeneral Operations 467,375 590,344 981,475 592,067 - 592,067 1,723 0% 1,723 0%Minor Capital - - - - - - - 0% - 0%Hydro, Water, Sewer, Gas - - - - - - - 0% - 0%Transfers to other Boards, Municipalities, Agencies - - - - - - - 0% - 0%Total Operating Expenses before Debenture Costs and Transfers 467,375 590,344 981,475 592,067 - 592,067 1,723 0% 1,723 0%
DEBENTURE COSTS AND TRANSFERSLease Equipment/Property - - - - - - - 0% - 0%Financial Expenses - - - - - - - 0% - 0%Transfer to/from User Rate Reserve Funds - - - - - - - 0% - 0%Transfer to Reserves - - - - - - - 0% - 0%Transfer to Capital Fund - - - - - - - 0% - 0%Total Debenture Costs and Transfers - - - - - - - 0% - 0%Gross Expenditures 2,201,488 2,474,664 2,767,545 2,533,563 - 2,533,563 58,899 2% 58,899 2% Revenues Other Government Funding (28,760) (15,000) (17,159) (15,000) - (15,000) - 0% - 0% Contribution from Reserves/Reserve Funds - - - - - - - 0% - 0% Licences, Permits, Application Fees (13,269) (8,488) (15,464) (8,518) - (8,518) (30) 0% (30) 0% Fines (82,179) (78,875) (159,478) (81,025) - (81,025) (2,150) 3% (2,150) 3% Anticipating a small increase in the number
of development agreements registered.
Fees, Charges, Service Rentals (152,838) (24,483) (44,114) (24,483) - (24,483) - 0% - 0% Other Revenue (791,143) (820,332) (841,716) (830,282) - (830,282) (9,950) 1% (9,950) 1% Total Revenues (1,068,189) (947,178) (1,077,931) (959,308) - (959,308) (12,130) 1% (12,130) 1% Net Operating Expense/(Revenue) 1,133,299 1,527,486 1,689,614 1,574,255 - 1,574,255 46,769 3% 46,769 3%
Change in 2016 Change in 2016Base Budget Requested Budget
to 2015 Approved Budget to 2015 Approved Budget
COMMUNITY AND CORPORATE SERVICES DIVISIONLegal Services Department
2016 Base Budget Change Report
139139

Director of Legislative and CourtServices
Dawn McAlpine
Deputy City ClerkWendy Cook
Committee and PrintServices Supervisor
Lisa Pearson
Manager of Court ServicesRodger Bates
Supervisor of VitalStatistics, Corporate Mail
and Print ServicesVacant
Records and InformationSupervisor
Heather Cassis
Court Services SupervisorClaudia Conti
Court Services SupervisorWanda Renton-Calvert
Supervisor ofAdministrative Support
ServicesVacant
Information Clerk (PPT)(2)
Community and Corporate Services DivisionLegislative and Court Services Department
140140

Performance Plan 2016
Department:
Departmental Overview
Legislative and Court Services
The Legislative and Court Services Department is comprised of two branches; Legislative Services (which includes Council Secretariat, Corporate Mail and Print Services, Vital Statistics and Access and Privacy Services) and Court Services (which is responsible for the administration of justice within two court service areas in compliance with the Provincial Offences Act, the Memorandum of Understanding and Inter-municipal Service Agreements).
In addition to overseeing these services, key responsibilities include executing the statutory duties of a Municipal Clerk, acting as "Head" under MFIPPA (FOI) legislation, and for conducting municipal elections/by-elections. The City Clerk is the Corporate Secretary appointed statutorily as the persona designate in discharging the duties of corporate office. The actions of the City Clerk in the execution of his/her duties bind the Corporation.
Legislative Services Branch
The Legislative Branch requires approximately 35% of the Department's staff resources to perform the following services:
� Plan, administer and distribute material for 140 meetings of Council, General Committee, Reference Committees and Advisory Committees of Council involving the recording of approximately 450 motions/resolutions and over 150 by-laws.
� Coordinate and deliver Municipal Elections every 4 years and by-elections as required.� Provide corporate records, access and privacy management services for the Corporation and the
general public.� Deliver "front line" information services for the general public including responses to Cityinfo
inquiries, and providing tours of City Hall.� Process over 350,000 pieces of outgoing mail annually.� Process over 1.5 million print/photocopy requests for City departments and associated agencies� Register over 850 deaths and issue over 840 marriage licences. � Respond to approximately 40 Municipal Freedom of Information and Protection of Privacy Act
requests.� Process administrative records including local improvement petitions, Court of Revision, and the
commissioning/certification of documents.
Court Services Branch
The Court Services Branch requires approximately 65% of the Department's staff resources to perform the following services:
� Provincial Offences court administration on behalf of the Barrie and Orillia Court Service Area Partners
� Process 78,000 charging documents� Process over 45,000 walk in clients, representing 73,300 individual matters� Receive and process $11 million in payments� Schedule 697 trial courts� Prepare 248 transcripts (or DVDs of court recordings) and 1,427 dockets (court plus Fail to
Respond)� Process 43,500 charges in trial courts and 10,000 matters in intake courts� Respond to 33,000 phone inquiries� Transfer 375 appeal matters to the appeal courts
141141

� Suspend drivers (as required) and manage multiple collection agencies to enforce court orders and collect past due unpaid fines.
Key Departmental Objectives� Ensure accurate and timely reporting of Council and Committee decisions and recommendations.� Deliver Provincial Offence Administration services to members of the public, enforcement
stakeholders, judicial and court service partners in accordance with established service level standards
� Timely and courteous administrative services to the public, elected officials, City departments, and other stakeholders.
� Enhance opportunities for community involvement and improve customer interactions.� Timely processing of Corporate mail and print requests.
Strategic Plan & Other Program Deliverables� Comply with Municipal Act, 2001 provisions related to governance, accountability and transparency.� Comply with the Municipal Elections Act, 1996 provisions related to conduct of Municipal Elections
and by-elections.� Provide information, advice and training for staff concerning communicating with Council/Committees.� Comply with the Provincial Offences Act, the Memorandum of Understanding and Inter-municipal
Service Agreements for Court Services Operations.� Increase the rate of electronic payment for court fines. � Enhance collection of overdue, unpaid court fines.
Major Initiatives/Issues� Planning, preparations and delivery of the Ward Seven By-election in accordance with the Municipal
Elections Act, 1996.� Complete next steps in the implementation of electronic agenda process. � Provide information, documentation and ongoing training for staff about Council processes and staff
report writing.� Assist with the implementation of the Customer Service Plan.� Implement the policy for unpaid, overdue POA fines deemed uncollectible.� Determine the feasibility of implementation of video conferencing for interpreters.� Determine the feasibility of full implementation of the expedited resolution process with the assistance
of Prosecution Services.� Increase corporate awareness of the Municipal Freedom of Information and Protection of Privacy Act
provisions, Corporate records management and access and privacy requirements.� Assist with Barrie Hydro/PowerStream/MergeCo related matters,
Key Performance IndicatorsTo provide timely & efficient service related to the Provincial Offences Act Administration for members of the public, enforcement stakeholders, judicial and court service partners in accordance with established service level standards
Indicator 2014 Actual 2015 Plan 2015 Projected 2016 Plan# of customers served at counter – Barrie 39,297 39,000 39,700 40,000
Average customer processing time 3:52 min/staff
3:50 min/staff
3:50 min/staff 3:50 min/staff
To provide open and transparent communication to the public and staff on the decision making process associated with Council and Committee Meetings
Indicator 2014 Actual 2015 Plan 2015 Projected 2016 PlanNumber of meetings supported 108 180 130 140
% of minutes published within 4 days after the meeting
95% 100% 95% 100%
To provide for a defendant’s right to have a trial in a reasonable time frameIndicator 2014 Actual 2015 Plan 2015 Projected 2016 Plan
# of trial requests processed - Barrie 19,508 19,000 21,443 20,000
142142

Average time to trial - Part I charges 5 mo. 6 mo. max 5 mo. 5 mo.
To provide timely and courteous administrative services to the public, elected officials, City departments and other stakeholders
Indicator 2014 Actual 2015 Plan 2015 Projected 2016 Plan# of marriage licences issued 871 870 820 810
# of deaths registered 891 900 840 840
# of formal MFIPPA requests received 38 35 42 40
% of MFIPPA requests responded to within legislative framework
90% 98% 92% 95%
143143

COMMUNITY AND CORPORATE SERVICESLEGISLATIVE & COURT SERVICES
2014 2015 2015 2016 2017 2018ACTUAL BUDGET FORECAST BUDGET FORECAST FORECAST
EXPENSESSalaries 2,794,669 2,645,253 2,515,081 2,679,028 2,716,543 3,052,292 Fringe Benefits 682,968 649,104 656,321 676,580 686,728 697,029 Total Salaries and Benefits 3,477,637 3,294,357 3,171,402 3,355,608 3,403,271 3,749,321 OPERATING EXPENSESGeneral Operations 1,667,412 1,373,912 1,442,161 1,610,413 1,608,193 1,866,270 Minor Capital 17,141 52,603 45,263 29,423 19,123 19,123 Hydro, Water, Sewer, Gas 8,462 9,811 9,170 9,400 9,600 9,800 Transfers to other Boards, Municipalities, Agencies 2,281,988 2,200,435 2,223,486 1,949,036 1,898,164 1,845,066 Total Operating Expenses before Debenture Costs and Transfers 3,975,003 3,636,761 3,720,080 3,598,272 3,535,080 3,740,259 DEBENTURE COSTS AND TRANSFERSLease Equipment/Property 523,738 596,572 562,990 578,309 585,284 617,796 Financial Expenses 85,482 88,124 76,249 80,470 80,650 80,830 Transfer to/from User Rate Reserve Funds - - - - - - Transfer to Reserves 28,711 129,793 131,189 127,367 126,668 25,940 Transfer to Capital Fund - - - - - - Total Debenture Costs and Transfers 637,931 814,489 770,428 786,146 792,602 724,566 Gross Expenditures 8,090,571 7,745,607 7,661,910 7,740,026 7,730,953 8,214,146 Revenues Other Government Funding - - - - - - Contribution from Reserves/Reserve Funds (481,436) (47,603) (40,263) (24,423) (19,123) (519,123) Licences, Permits, Application Fees (141,703) (130,128) (140,188) (130,746) (96,135) (96,135) Fines (7,840,353) (7,950,761) (8,052,334) (7,952,334) (7,952,334) (7,952,334) Fees, Charges, Service Rentals (8,879) (9,271) (10,270) (8,691) (4,771) (5,171) Other Revenue 1,014,967 1,073,140 1,071,402 1,094,928 1,124,633 1,153,564 Total Revenues (7,457,404) (7,064,623) (7,171,653) (7,021,266) (6,947,730) (7,419,199) Net Operating Expense/(Revenue) 633,167 680,984 490,257 718,760 783,223 794,947
CITY OF BARRIE2016 OPERATING BUDGET
EXPENDITURES
144144

2014 2015 2015 2016 Service 2016Actual Approved Forecasted Base Level Requested
Expenditures Budget Expenditure Budget Change(s) Budget$ $ $ $ $ $ $ % $ % Comments
EXPENSESSalaries 2,794,669 2,645,253 2,515,081 2,679,028 - 2,679,028 33,775 1% 33,775 1% Increase is due to vacancies in 2015 that
were not filled as quickly as planned as well as unanticipated vacancies (staff will be returning in 2016) and cost of living adjustments.
Fringe Benefits 682,968 649,104 656,321 676,580 - 676,580 27,476 4% 27,476 4% Increase is due to vacancies in 2015 that were not filled as quickly as planned as well as unanticipated vacancies (staff will be returning in 2016) and cost of living adjustments.
Total Salaries and Benefits 3,477,637 3,294,357 3,171,402 3,355,608 - 3,355,608 61,251 2% 61,251 2%OPERATING EXPENSESGeneral Operations 1,667,412 1,373,912 1,442,161 1,610,413 - 1,610,413 236,501 17% 236,501 17% $124K of the increase is due to 50%+ MAG
fee increase imposed by Province (for both Barrie and Orillia Court Service Areas. Other increases include witness fees ($14K) based on increased witness requirements anticipated in 2016 and Corporate postage ($12.5K) due to an increase in postage rates and general growth in volume until several new applications are introduced.
Minor Capital 17,141 52,603 45,263 29,423 - 29,423 (23,180) -44% (23,180) -44% Significant replacement of court equipment was undertaken in prior years, reducing 2016 requirements.
Hydro, Water, Sewer, Gas 8,462 9,811 9,170 9,400 - 9,400 (411) -4% (411) -4% Decrease in budget attributed to conservation efforts.
Transfers to other Boards, Municipalities, Agencies 2,281,988 2,200,435 2,223,486 1,949,036 - 1,949,036 (251,399) -11% (251,399) -11% Reduced transfers to other BCSA and OCSA municipalities based on anticipated charge volumes and increased operating costs (primarily MAG increase).
Total Operating Expenses before Debenture Costs and Transfers 3,975,003 3,636,761 3,720,080 3,598,272 - 3,598,272 (38,489) -1% (38,489) -1%
DEBENTURE COSTS AND TRANSFERSLease Equipment/Property 523,738 596,572 562,990 578,309 - 578,309 (18,263) -3% (18,263) -3% Change to lease of print shop equipment
versus purchase (offset by lower contracted service costs for print shop).
Financial Expenses 85,482 88,124 76,249 80,470 - 80,470 (7,654) -9% (7,654) -9%Transfer to/from User Rate Reserve Funds - - - - - - - 0% - 0%Transfer to Reserves 28,711 129,793 131,189 127,367 - 127,367 (2,426) -2% (2,426) -2%Transfer to Capital Fund - - - - - - - 0% - 0%Total Debenture Costs and Transfers 637,931 814,489 770,428 786,146 - 786,146 (28,343) -3% (28,343) -3%Gross Expenditures 8,090,571 7,745,607 7,661,910 7,740,026 - 7,740,026 (5,581) 0% (5,581) 0% Revenues Other Government Funding - - - - - - - 0% - 0% Contribution from Reserves/Reserve Funds (481,436) (47,603) (40,263) (24,423) - (24,423) 23,180 -49% 23,180 -49% decrease in minor capital directly offset by
contribution from reserves in Court Services $15.8K.
Licences, Permits, Application Fees (141,703) (130,128) (140,188) (130,746) - (130,746) (618) 0% (618) 0% Fines (7,840,353) (7,950,761) (8,052,334) (7,952,334) - (7,952,334) (1,573) 0% (1,573) 0% reduced charge volume and resulting fine
revenue in Barrie court service area. Fees, Charges, Service Rentals (8,879) (9,271) (10,270) (8,691) - (8,691) 580 -6% 580 -6% Other Revenue 1,014,967 1,073,140 1,071,402 1,094,928 - 1,094,928 21,788 2% 21,788 2% BHHI transfer to offset salary not included in
2015. Total Revenues (7,457,404) (7,064,623) (7,171,653) (7,021,266) - (7,021,266) 43,357 -1% 43,357 -1% Net Operating Expense/(Revenue) 633,167 680,984 490,257 718,760 - 718,760 37,776 6% 37,776 6%
to 2015 Approved Budget to 2015 Approved BudgetBase Budget Requested Budget
COMMUNITY AND CORPORATE SERVICES DIVISIONLegislative and Court Services Department
2016 Base Budget Change Report
Change in 2016 Change in 2016
145145

Director of Recreation ServicesBarb Roth
Office Coordinator ICheryl Swan
Manager of RecreationSteve Lee-Young
Manager of RecreationFacilitiesRob Bell
AllocationAdministrator
(3)
Secretary (PPT)
Recreation Supervisor(Allandale)
Alex Malmsten
Recreation Supervisor(Holly)
Tammy Haines
Supervisor of RecreationFacilities
(Barrie Molson Centre)Paul Girard
Supervisor of RecreationFacilities
(Allandale)Gord Bashford
Supervisor of RecreationFacilities
(East Bayfield)Paul McCarron
Supervisor of RecreationFacilities
(Holly)Kevin Datema
Manager of Business ServicesTyrell Turner (Interim)
Recreation Supervisor(East Bayfield)
Kate Ellis
Community and Corporate Services DivisionRecreation Services Department
146146

Recreation Supervisor(East Bayfield)
Kate Ellis
Manager of RecreationSteve Lee-Young
Recreation Supervisor(Allandale)
Alex Malmsten
Recreation Supervisor(Holly)
Tammy Haines
Recreation Programmer(3)
AquaticInstructor-Lifeguard
Recreation Programmer- Aquatics
Recreation Programmer(2)
Recreation Programmer- Aquatics
Recreation Programmer(2)
Recreation Programmer- Inclusion
Recreation Programmer- Aquatics
Community and Corporate Services DivisionRecreation Services DepartmentRecreation Branch
147147

Manager of RecreationFacilitiesRob Bell
Supervisor of RecreationFacilities
(Holly)Kevin Datema
Facility Operator 1(3)
Facility OperationsCoordinator
Facility Operator 2(2)
Supervisor of RecreationFacilities
(East Bayfield)Paul McCarron
Facility Operator 1(3)
Facility OperationsCoordinator
Facility Operator 2(3)
Supervisor of RecreationFacilities
(Allandale)Gord Bashford
Facility Operator 1(3)
Facility OperationsCoordinator
Facility Operator 2(2)
Supervisor of RecreationFacilities
(Barrie Molson Centre)Paul Girard
Facility OperationsCoordinator
Facility Operator 2(1)
Facility Operator 3(2)
Facility Operator 3(2)
Facility Operator 3(2)
Facility Operator 3(2)
Outdoor FacilityCoordinator
Community and Corporate Services DivisionRecreation Services DepartmentRecreation Facilities Branch
148148

Manager of Business ServicesTyrell Turner (Interim)
Recreation Analyst
RegistrationAdministrator and Data
Analyst
Community and Corporate Services DivisionRecreation Services DepartmentBusiness Services Branch
149149

Performance Plan 2016
Department:
Departmental Overview
Recreation
Recreation Services builds vibrant, healthy, active and connected communities by providing facilities and programs that give all Barrie residents an opportunity to participate in recreational activities. Key responsibilities include identifying community recreation needs and interests, developing and delivering recreation opportunities which meet these needs and interests, maintaining and operating recreational facilities to provide a setting for these activities, and managing the provision of space to external community recreation providers and groups.
Recreation Programs
The Recreation Programs branch is responsible for assessing community recreation needs and interests, and for providing an engaging portfolio of recreation opportunities which will meet these needs and interests. The Branch is organized into three Neighbourhood Teams, which are based out of one of Barrie’s three major community recreation facilities and focus on developing and delivering programs and events which will best serve the unique needs of the surrounding community.
The branch provides diverse and accessible recreation activities for all abilities and skill levels, with a focus on promoting healthy and safe lifestyles, developing physical skills, encouraging social interaction, and fostering community engagement. This includes registered programs that are provided directly by Departmental staff, or in partnership with community groups, drop-in activities such as public swimming, skating, and gymnasium sports, community-based events and celebrations, and full-day summer camp programs.
Recreation Facilities
Recreation Facilities Branch is responsible for ensuring that the City of Barrie’s Recreation facilities and sport fields provide a high-quality setting for recreational opportunities and activities. This portfolio includes:
� Allandale Recreation Centre � Barrie Community Sports Complex � Barrie Molson Centre � Barrie Sports Dome (through an operational partner) � Barrie Sports Complex � Circle at the Centre � Dorian Parker Centre � East Bayfield Community Centre � Eastview Arena � Holly Community Centre � Lampman Lane Community Centre � Parkview Seniors Centre � Southshore Community Centre � 99 sport fields, including 43 baseball diamonds and 56 soccer Pitches
The Branch ensures that all recreation facilities and sport fields are operated and maintained in a safe and cost-efficient manner, in full compliance with all relevant codes, regulations and legislation. These activities involve the development, ongoing implementation, monitoring, and review of the following plans
150150

and programs:
� Preventative, predictive, planned and responsive maintenance programs. � Departmental service level standards, and related quality assurance programs � Facility lifecycle plans, identifying future maintenance and renewal requirements � Environmental, sustainability, and energy management plans.
The Recreation Facilities branch is also responsible for the rental of facility spaces and sport fields to external community groups, including administration of related allocation processes to manage the competing needs of these groups.
Administration & Business Services
The Administration & Business Services branch is responsible for the financial processes, strategic planning efforts, and technological initiatives which support both the day-to-day operation and long-term planning processes of the Recreation Services Department. The goal of the branch is to collect, analyze and interpret the information and data required for sound decision-making and planning.
The branch is also responsible for the implementation of pricing and program-alignment strategies, and for maintaining the electronic registration system required to accurately track all participation and revenues. The branch leads efforts to extract and analyze data from internal registration systems and external databases in order to identify trends and opportunities, and to better anticipate community needs and interests.
The branch leads the development of the Department’s annual business plan and operating budget, and coordinates departmental workplans to ensure departmental resources are effectively directly towards achieving corporate, divisional, and departmental priorities. The branch also leads and coordinates the department’s long-term planning efforts, ensuring Recreation Services is responsibly planning for the future through strategic plans, master plans, growth studies, service reviews, business analysis preparation, and related reports to City Council.
Key Departmental ObjectivesRecreation Services builds vibrant, healthy, active and connected communities by providing all Barrie residents an opportunity to participate in recreational activities. Recreation services strives to be the recreation experience provider of choice in the City of Barrie, and to achieve this objective the department has identified the following key objectives:
Maximizing Community EngagementIncrease and maximize community engagement by:
� Assessing community needs and developing programs, activities and special events which meet these needs and reflect the latest in recreation trends.
� Providing excellent customer service to all participants, spectators, members, and other visitors to City of Barrie recreation facilities
� Building strong relationships with community recreation partners, and helping community groups maximize participation through the partnered delivery of activities.
� Operating high-quality facilities and sports fields to act as venues for the community recreation partner leagues, competitions, practices, meetings, competitions, and other events.
Increasing Social and Health Benefits of RecreationImprove the quality of life for all Barrie residents through:
� Providing opportunities for all Barrie residents to access recreation by identifying and seeking to eliminate barriers to participation including financial limitations, physical and mental abilities, and other social and cultural barriers.
� Developing programs and community partnerships which will maximize the health benefits of recreation and increase the awareness of recreation opportunities and the associated benefits, amongst community members.
Responsible Financial ManagementResponsibly manage the user fee and tax revenues received from Barrie residents, by:
� Monitoring and managing programs and facilities so as to minimize expenses while maximizing
151151

utilization of recreation facilities and programs � Identifying and implementing innovative new ways to deliver services in programs in ways which will
reduce cost and increase revenue � Pursuing energy conservation initiatives for electricity, natural gas, and water.
Strategic Plan & Other Program Deliverables� Recreation Services supports City Council’s priority of an inclusive community through its
neighbourhood strategies to offer services that are valuable to residents in each community. The department has a wide selection of fitness, aquatics, community and general interest programs, as well as programs directly geared towards seniors and youth. Recreation also works with several partners and community groups to enhance and expand additional recreation opportunities. We also provide inclusion services and offer a RecACCESS subsidy program to ensure all residents of Barrie have the opportunity to participate and maintain a healthy and active lifestyle.
� Recreation Services supports Council’s strategic priority of responsible spending through its constant efforts to identify and implement efficiencies and improvements which will reduce the cost of providing recreation to the City of Barrie. The Department will continue to focus on standardization and simplicity to build brand awareness of our product offerings to ultimately increase utilization and revenues for the City. Lastly, Recreation will undergo a market analysis to better understand its position in the marketplace and develop a strategic plan to ensure the products and services we provide are valuable to our community and residents.
Major Initiatives/Issues� Continuous improvement of our upgraded recreation registration system to expand capability of
providing services online to our community and leveraging the system to enhance processes and controls and perform data analysis to guide operational decisions
� Supporting the corporate wide implementation of the Enterprise Resource Planning (ERP) system including piloting Activity Based Costing and a significant focus on payroll, procurement, and budgeting.
� Developing strategies which will identify the program, facility, and service priorities for each of the Recreation Services three neighbourhood teams. These strategies will identify both short and long term priorities for each neighbourhood area, which will guide the effective planning and efficient delivery of service improvements in the coming years.
� Collaborate with the Corporate Facilities and Energy Management branches to continue implementation of the Facility Information Management System (Archibus/FM) and Energy Management initiatives which will help Recreation Services to more efficiently manage the operation of recreation facilities.
� Working with community groups to identify and implement ways to better support community recreation partners including strategies to increase participation, identification of potential service delivery partnerships, and a review of the ice allocation policy and associated fees.
Key Performance IndicatorsMaximizing Community Engagement
Indicator 2014 Actual 2015 Plan 2015 Projected 2016 PlanCommunity Group Usage of Recreation Facilities (Total Hours)
35,321 23,000 39,000 40,000
Participant Visits to Recreation Facilities 2,123,000 1,998,000 2,144,000 2,150,000
Active RecPASS Members - - 12,000 13,200
Increasing Social and Health Benefits of RecreationIndicator 2014 Actual 2015 Plan 2015 Projected 2016 Plan
Total RecACCESS Participation 1,292 NotForecast
2,000 NotForecast
152152

Responsible Financial ManagementIndicator 2014 Actual 2015 Plan 2015 Projected 2016 Plan
Utilization Rate for Directly Provided Registered Programs
69.4% 80.0% 79.5% 80.0%
Recreation Services Operating Cost Recovery Rate
54.4% 57.7% 56.3% 55.0%
153153

COMMUNITY AND CORPORATE SERVICESRECREATION
2014 2015 2015 2016 2017 2018ACTUAL BUDGET FORECAST BUDGET FORECAST FORECAST
EXPENSESSalaries 7,876,995 8,186,503 8,186,775 8,219,837 8,286,381 8,374,676 Fringe Benefits 1,549,866 1,527,508 1,535,110 1,632,185 1,656,292 1,680,752 Total Salaries and Benefits 9,426,861 9,714,011 9,721,885 9,852,022 9,942,673 10,055,428 OPERATING EXPENSESGeneral Operations 2,933,781 2,792,858 2,826,850 2,702,423 2,687,779 2,687,779 Minor Capital 192,349 184,000 185,110 184,000 184,000 184,000 Hydro, Water, Sewer, Gas 2,641,841 2,736,732 2,638,906 2,786,744 2,918,363 3,058,227 Transfers to other Boards, Municipalities, Agencies - - - - - - Total Operating Expenses before Debenture Costs and Transfers 5,767,971 5,713,590 5,650,866 5,673,167 5,790,142 5,930,006 DEBENTURE COSTS AND TRANSFERSLease Equipment/Property 110,757 74,801 81,376 87,622 87,622 87,622 Financial Expenses 150,702 150,000 161,162 213,500 213,500 213,500 Transfer to/from User Rate Reserve Funds - - - - - - Transfer to Reserves - - - - - - Transfer to Capital Fund - - - - - - Total Debenture Costs and Transfers 261,459 224,801 242,538 301,122 301,122 301,122 Gross Expenditures 15,456,291 15,652,402 15,615,289 15,826,311 16,033,937 16,286,556 Revenues Other Government Funding (144,969) (145,393) (142,423) (142,465) (144,565) (146,765) Contribution from Reserves/Reserve Funds (9,057) - (1,042) - - - Licences, Permits, Application Fees (1,013,249) (1,249,372) (1,069,108) (1,140,899) (1,140,899) (1,140,899) Fines - - - - - - Fees, Charges, Service Rentals (7,157,199) (7,616,109) (7,308,124) (7,328,870) (7,302,870) (7,277,870) Other Revenue (82,075) (78,339) (86,481) (75,850) (75,850) (75,850) Total Revenues (8,406,549) (9,089,213) (8,607,178) (8,688,084) (8,664,184) (8,641,384) Net Operating Expense/(Revenue) 7,049,742 6,563,189 7,008,111 7,138,227 7,369,753 7,645,172
CITY OF BARRIE2016 OPERATING BUDGET
EXPENDITURES
154154

2014 2015 2015 2016 Service 2016Actual Approved Forecasted Base Level Requested
Expenditures Budget Expenditure Budget Change(s) Budget$ $ $ $ $ $ $ % $ % Comments
EXPENSESSalaries 7,876,995 8,186,503 8,186,775 8,219,837 2,977 8,222,814 33,334 0% 36,311 0% Increases are a result of CUPE JE, step
increases, and budgeted Standby Pay. This is offset by decreases in part-time / casual salaries and reductions in overtime.
Fringe Benefits 1,549,866 1,527,508 1,535,110 1,632,185 108 1,632,293 104,677 7% 104,785 7% Benefit increases are driven by additional salaries as identified above, change in budgeting assumptions for temporary staff, and provider and government rate increases.
Total Salaries and Benefits 9,426,861 9,714,011 9,721,885 9,852,022 3,085 9,855,107 138,011 1% 141,096 1%OPERATING EXPENSESGeneral Operations 2,933,781 2,792,858 2,826,850 2,702,423 - 2,702,423 (90,435) -3% (90,435) -3% Reduced consulting budget, facility capital,
and supplies for Recreation Programs.
Minor Capital 192,349 184,000 185,110 184,000 - 184,000 - 0% - 0% Minor capital budget has been maintained from 2015 to 2016.
Hydro, Water, Sewer, Gas 2,641,841 2,736,732 2,638,906 2,786,744 - 2,786,744 50,012 2% 50,012 2% Budget increase is a result of utility rate increases (+$151K) and budget adjustments (+$25K) offset by decreases in consumption driven by energy conservation which accounted for -$126K in cost avoidance. Electricity rates are estimated to increase 8.5%, natural gas rates are estimated to increase 0.8% and water rates are estimated to increase 2.2%.
Transfers to other Boards, Municipalities, Agencies - - - - - - - 0% - 0%Total Operating Expenses before Debenture Costs and Transfers 5,767,971 5,713,590 5,650,866 5,673,167 - 5,673,167 (40,423) -1% (40,423) -1%
DEBENTURE COSTS AND TRANSFERSLease Equipment/Property 110,757 74,801 81,376 87,622 - 87,622 12,821 17% 12,821 17%Financial Expenses 150,702 150,000 161,162 213,500 - 213,500 63,500 42% 63,500 42% Increased processing fees through new
ActiveNet registration system offset by reduced licensing fees from Class.
Transfer to/from User Rate Reserve Funds - - - - - - - 0% - 0%Transfer to Reserves - - - - - - - 0% - 0%Transfer to Capital Fund - - - - - - - 0% - 0%Total Debenture Costs and Transfers 261,459 224,801 242,538 301,122 - 301,122 76,321 34% 76,321 34%Gross Expenditures 15,456,291 15,652,402 15,615,289 15,826,311 3,085 15,829,396 173,909 1% 176,994 1% Revenues Other Government Funding (144,969) (145,393) (142,423) (142,465) - (142,465) 2,928 -2% 2,928 -2% Contribution from Reserves/Reserve Funds (9,057) - (1,042) - - - - 0% - 0% Licences, Permits, Application Fees (1,013,249) (1,249,372) (1,069,108) (1,140,899) (3,085) (1,143,984) 108,473 -9% 105,388 -8% Realignment of facility rental fees based on
current trending. Fines - - - - - - - 0% - 0% Fees, Charges, Service Rentals (7,157,199) (7,616,109) (7,308,124) (7,328,870) - (7,328,870) 287,239 -4% 287,239 -4% Realignment of facility rental fees based on
current trending. Other Revenue (82,075) (78,339) (86,481) (75,850) - (75,850) 2,489 -3% 2,489 -3% Centrally collected revenues have been
distributed to the three major recreation facilities.
Total Revenues (8,406,549) (9,089,213) (8,607,178) (8,688,084) (3,085) (8,691,169) 401,129 -4% 398,044 -4% Net Operating Expense/(Revenue) 7,049,742 6,563,189 7,008,111 7,138,227 - 7,138,227 575,038 9% 575,038 9%
Base Budget Requested Budgetto 2015 Approved Budget to 2015 Approved Budget
2016 Base Budget Change Report
Change in 2016 Change in 2016
COMMUNITY AND CORPORATE SERVICES DIVISIONRecreation Department
155155

General Manager of Infrastructureand Growth Management
Richard Forward
Director of EngineeringJacqueline Weston
Director of Roads, Parks andFleet
Dave Friary
Director of Planning ServicesStephen Naylor
Executive Assistant to theGeneral Manager
Tracie Howell
Director of EnvironmentalServices
John Thompson
Director of Facilities andTransit
Kevin Bradley
Infrastructure and Growth Management Division
156

P D
K
Performanc
Division Goal
To operate animprovement
To provide foplanning polic
To maintain, To guide the To strategica
gap. To better und To execute th To extend the To enhance,
Key Division S
Manage the i Continue with Continue with Manage and
Station. Update the C Continue imp Reduce energ Initiate the de Finalize a 5 y Complete Ph Provide vehic
ce Plan 2016
s
nd maintain munis and operating e
or the balanced grcies and principleprotect, and enhastrategic planninglly manage the C
derstand the impahe delivery of the e life of the landfilthrough transpor
Service Deliv
mplementation ofh the implementath the preparation promote the new
Corporate Asset Mplementation of sugy usage at all faevelopment of a cyear transit busineases 3 & 4 of thecle and equipmen
6 - INFRAST
icipal infrastructuefficiencies for allrowth and develoes, and servicing sance neighbourhog and growth of t
City’s corporate as
act of climate chaCapital Plan to a
ll through enhanctation planning, a
ery Initiatives
f the growth planstion of Affordableof a new Official
w multi-hub transit
Management Straustainable waste acilities and other climate change stess plan.
e Class EA for roant training and com
TRUCTURE
re, meet service service functionspment of the Citystrategies. oods through the he transit systemssets, to minimize
nge on our assetachieve best valueced waste diversioan inter-connected
s
s and Memorande Housing StrategPlan.
t route model incl
tegy & Capital Plmanagement strainfrastructure inc
trategy.
ads in the Annexemmunicate numb
AND GROW
levels and ensures. y through clear, co
application of zom. e replacement co
ts and the environe for the communon programs. d community thro
um of Understangies.
uding the further
an. ategy including recluding streetlight
ed lands. ber of incidents w
WTH MANAG
e regulatory comp
omprehensive, a
oning and land de
sts over the long-
nment. nity.
ough access to an
ding (MOU) for th
expansion of a m
esidential multi-unt/traffic systems.
ith staff.
GEMENT DI
pliance while striv
nd sound implem
evelopment stand
-term and to clos
nd across the Hig
he annexed lands
multi-modal hub a
nit waste diversio
IVISION
ving for service
mentation of land
ards.
se the infrastructu
ghway 400.
s.
at Allandale Wate
on.
use
ure deficit
erfront Go
157

E C Aa
External Fact
Regulatory an Population gr Economic de Increased inv
Corporate Sco
All Departments ma corporate score
Depar
Environmental
Roads, Parks, a
Facilities and T
Engineering
Planning
ors Influencin
nd legislative charowth and relatedvelopment within
ventory of City as
orecard Indic
measure performecard:
rtment
Services
and Fleet
Transit
ng Activities &
anges. d increased servic the City and relasets both above a
cators
ance using a Bal
Solid waste res
Cost per Mega
Cost per Mega
Accidents/incid
Traffic Collision
Transit - reven
Passenger trip
Facility Energy(ekWh/m2/yr)
Change OrderNumber of WaApplications Number of Newdevelopment pof affordable h
& Outcomes
ce requirements.ated increased seand below ground
anced Scorecard
Indicato
sidential diversion
a Litre (ML) of trea
a Litre (ML) of trea
dents per year inv
ns per Lane KM
nue to cost ratio (T
ps per in-service v
y Consumption pe
s as a % of Totalard Meetings Held
w Housing Units proposals that meousing
ervice requiremend.
d. Infrastructure a
or
n rate (%)
ated sewage
ated water
volving City equip
TRNT315)
vehicle hour (TRN
er square footage
Tender Value d for Developmen
included in approeet the City’s defin
nts.
nd Growth Mana
2015Plan48.5
$967
$1,41
pment 35
2.75
37.6%
NT340) 16.7
e 35.46
7.0%nt 13
oved nition
N/A
agement contribut
5 n
2015 Forecast
5 50
7 $980
2 $1,324
33
5 2.75
% 34.3%
7 15.5
6 35.46
% 7.0%
13
N/A
tes the following i
t 2016 Plan
50
$1,018
$1,372
20
2.70
33.8%
16.6
35.17
7.0%
15
100
indicators to
158

B T
U
Budget Summ
Tax Rate
Department
Office of the GeEngineering Environmental SFacilities and TrPlanning Roads, Parks anTotal
User Rate
Department
Water OperationWastewater OpeParking Total
mary
neral Manager
Services ransit
nd Fleet
ns erations
2016 NeRequeste
Budget$ 342
$1,704$ 5,598
$ 13,240$ 1,165
$ 25,413$47,465
2016 NeRequeste
Budget($ 5,844
($ 13,452$ 690
($18,659
t ed
BaComp
2,895 34,267 68,556 20,544 35,544 13,247 105,053 25
t ed Ba
Comp4,925) 62,723) 30,688
9,498) 1
201ase lement
Se
3 61 28 39 7
04 52
201ase
plement Se
65 34 3 02
6 Staffing ervice Level Changes
0 4 0 2 0 1 7
16 Staffing ervice Level Changes
0 0 0 0
Total Requested
3 65 28 41 17 105 259
Total Requested
65 34 3
102
159

2014 2015 2015 2016 Service 2016Actual Approved Forecasted Base Level Requested
Expenditures Budget Expenditure Budget Change(s) Budget$ $ $ $ $ $ $ %
EXPENSESSalaries 25,918,379 27,955,557 26,265,935 29,312,958 137,668 29,450,626 1,495,069 5%Fringe Benefits 6,017,609 6,007,596 6,016,156 6,645,951 52,041 6,697,992 690,396 11%Total Salaries and Benefits 31,935,988 33,963,153 32,282,091 35,958,909 189,709 36,148,618 2,185,465 6%OPERATING EXPENSESGeneral Operations 54,806,423 55,564,056 54,803,997 57,763,481 203,000 57,966,481 2,402,425 4%Minor Capital 1,164,703 1,593,600 1,551,603 1,734,640 - 1,734,640 141,040 9%Hydro, Water, Sewer, Gas 7,093,760 7,977,074 7,077,249 7,335,274 - 7,335,274 (641,800) -8%Transfers to other Boards, Municipalities, Agencies - - - - - - - 0%
Total Operating Expenses before Debenture Costs and Transfers
63,064,886 65,134,730 63,432,849 66,833,395 203,000 67,036,395 1,901,665 3%
DEBENTURE COSTS AND TRANSFERSLease Equipment/Property 29,036,586 31,882,129 31,585,035 32,226,828 - 32,226,828 344,699 1%Financial Expenses 70,170 59,160 75,257 27,767 - 27,767 (31,393) -53%Transfer to/from User Rate Reserve Funds 8,712,649 18,188,472 19,848,173 19,503,919 - 19,503,919 1,315,447 7%Transfer to Reserves 591,832 880,380 961,773 973,864 - 973,864 93,484 11%Transfer to Capital Fund - - - - (880) (880) (880) 0%Total Debenture Costs and Transfers 38,411,237 51,010,141 52,470,238 52,732,378 (880) 52,731,498 1,721,357 3%Gross Expenditures 133,412,111 150,108,024 148,185,178 155,524,682 391,829 155,916,511 5,808,487 4% Revenues Other Government Funding (1,499,459) (1,233,323) (1,083,860) (1,420,809) - (1,420,809) (187,486) 15% Contribution from Reserves/Reserve Funds (11,532,291) (22,760,653) (20,639,117) (22,619,113) (150,000) (22,769,113) (8,460) 0% Licences, Permits, Application Fees (1,133,893) (1,081,871) (936,625) (1,330,777) (12,210) (1,342,987) (261,116) 24% Fines - - - - - - - 0% Fees, Charges, Service Rentals (62,009,587) (66,635,412) (66,666,932) (69,403,622) - (69,403,622) (2,768,210) 4% Other Revenue (12,848,409) (13,162,408) (13,375,546) (13,285,306) (93,977) (13,379,283) (216,875) 2% Total Revenues (89,023,639) (104,873,667) (102,702,080) (108,059,627) (256,187) (108,315,814) (3,442,147) 3% Net Operating Expense/(Revenue) 44,388,472 45,234,357 45,483,098 47,465,055 135,642 47,600,697 2,366,340 5%
to 2015 Approved BudgetRequested Budget
INFRASTRUCTURE AND GROWTH MANAGEMENT DIVISIONDIVISION SUMMARY
2016 Base Budget Change Report
Change in 2016
160

INFRASTRUCTURE & GROWTH MANAGEMENTGENERAL MANAGER'S OFFICE
2014 2015 2015 2016 2017 2018ACTUAL BUDGET FORECAST BUDGET FORECAST FORECAST
EXPENSESSalaries 404,546 339,383 349,662 276,190 280,270 284,411 Fringe Benefits 67,910 69,455 64,965 58,105 58,977 59,862 Total Salaries and Benefits 472,456 408,838 414,627 334,295 339,247 344,273 OPERATING EXPENSESGeneral Operations 516,782 12,125 39,048 8,600 6,900 6,950 Minor Capital - - 1,279 - - - Hydro, Water, Sewer, Gas - - - - - - Transfers to other Boards, Municipalities, Agencies - - - - - - Total Operating Expenses before Debenture Costs and Transfers 516,782 12,125 40,327 8,600 6,900 6,950 DEBENTURE COSTS AND TRANSFERSLease Equipment/Property - - - - - - Financial Expenses - - - - - - Transfer to/from User Rate Reserve Funds - - - - - - Transfer to Reserves - - - - - - Transfer to Capital Fund - - - - - - Total Debenture Costs and Transfers - - - - - - Gross Expenditures 989,238 420,963 454,954 342,895 346,147 351,223 Revenues Other Government Funding - - - - - - Contribution from Reserves/Reserve Funds (657,117) (102,933) (68,074) - - - Licences, Permits, Application Fees - - - - - - Fines - - - - - - Fees, Charges, Service Rentals - - - - - - Other Revenue (8,046) - (6,764) - - - Total Revenues (665,163) (102,933) (74,838) - - - Net Operating Expense/(Revenue) 324,075 318,030 380,116 342,895 346,147 351,223
CITY OF BARRIE2016 OPERATING BUDGET
EXPENDITURES
161

2014 2015 2015 2016 Service 2016Actual Approved Forecasted Base Level Requested
Expenditures Budget Expenditure Budget Change(s) Budget$ $ $ $ $ $ $ % $ % Comments
EXPENSESSalaries 404,546 339,383 349,662 276,190 - 276,190 (63,193) -19% (63,193) -19% Decrease relates to moving one FTE to
planning offset by revised merit and step increases.
Fringe Benefits 67,910 69,455 64,965 58,105 - 58,105 (11,350) -16% (11,350) -16% Decrease relates to moving one FTE to planning offset by revised merit and step increases.
Total Salaries and Benefits 472,456 408,838 414,627 334,295 - 334,295 (74,543) -18% (74,543) -18%OPERATING EXPENSESGeneral Operations 516,782 12,125 39,048 8,600 - 8,600 (3,525) -29% (3,525) -29%Minor Capital - - 1,279 - - - - 0% - 0%Hydro, Water, Sewer, Gas - - - - - - - 0% - 0%Transfers to other Boards, Municipalities, Agencies - - - - - - - 0% - 0%Total Operating Expenses before Debenture Costs and Transfers 516,782 12,125 40,327 8,600 - 8,600 (3,525) -29% (3,525) -29%
DEBENTURE COSTS AND TRANSFERSLease Equipment/Property - - - - - - - 0% - 0%Financial Expenses - - - - - - - 0% - 0%Transfer to/from User Rate Reserve Funds - - - - - - - 0% - 0%Transfer to Reserves - - - - - - - 0% - 0%Transfer to Capital Fund - - - - - - - 0% - 0%Total Debenture Costs and Transfers - - - - - - - 0% - 0%Gross Expenditures 989,238 420,963 454,954 342,895 - 342,895 (78,068) -19% (78,068) -19% Revenues Other Government Funding - - - - - - - 0% - 0% Contribution from Reserves/Reserve Funds (657,117) (102,933) (68,074) - - - 102,933 -100% 102,933 -100% Funding moved to planning along with one
FTE. Licences, Permits, Application Fees - - - - - - - 0% - 0% Fines - - - - - - - 0% - 0% Fees, Charges, Service Rentals - - - - - - - 0% - 0% Other Revenue (8,046) - (6,764) - - - - 0% - 0% Total Revenues (665,163) (102,933) (74,838) - - - 102,933 -100% 102,933 -100% Net Operating Expense/(Revenue) 324,075 318,030 380,116 342,895 - 342,895 24,865 8% 24,865 8%
Change in 2016 Change in 2016Base Budget Requested Budget
to 2015 Approved Budget to 2015 Approved Budget
INFRASTRUCTURE AND GROWTH MANAGEMENT DIVISIONGeneral Manager of Infrastructure and Growth Management
2016 Base Budget Change Report
162

Director of EngineeringJacqueline Weston
Manager of Design andConstruction
Stew Patterson
Manager of InfrastructurePlanning
Sherry Diemert
Senior Project EngineerLeonard Borgdorff
Senior Project ManagerRuss Madore
Senior InfrastructurePlanning Engineer
Ralph Scheunemann
Senior Project EngineerDave James
Office Coordinator IBev Nugent
Technical Clerk
Office ServicesAssistant
(3)
Senior Project Engineer –Environmental
Jessica Peters-Palfi (Interim)
Manager of DevelopmentServices
Frank Palka
Manager of Corporate AssetManagementKelly Oakley
Infrastructure ProgramEngineer
Vacant
Supervisor of Policy andStandardsHolly Hayes
Senior ConstructionEngineer
Vacant
Supervisor of ConstructionInspection
Mike Nugent
Supervisor of ParksPlanning and Development
Walter Fisher
Risk Management OfficialKatie Thompson
Infrastructure and Growth Management DivisionEngineering Department
163163

Manager of Design andConstruction
Stew Patterson
Senior Project EngineerLeonard Borgdorff
Senior ProjectTechnologist
(3)
Project Technologist
Senior Project EngineerDave James
Senior Project Engineer -Environmental
Jessica Peters-Palfi (Interim)
Senior ConstructionEngineer
Vacant
EngineeringInspector
(5)
Survey Party Chief(3)
Project Technologist(Construction)
Project EngineerJeff Capling
Construction EngineerJeff Parent
Senior Project ManagerRuss Madore
Senior ProjectAdministrationTechnologist
Project Engineer -Environmental
(2)Wesley Reid/Vacant
Engineering ServicesCoordinator
ROWA TechnicianProject Technologist
Senior ProjectTechnologist
(2)
Project Technician
Supervisor of ConstructionInspection
Mike Nugent
Engineering RecordsCoordinator
Infrastructure and Growth Management DivisionEngineering DepartmentDesign and Construction Branch
Project Manager -Environmental
VacantTemporary 2 Years
Indicates temporaryposition
164164

Manager of Infrastructure PlanningSherry Diemert
Senior WaterTechnologist
Infrastructure PlanningEngineer
Brett Gratrix
Senior InfrastructurePlanning Technologist
Senior InfrastructurePlanning Engineer
Ralph Scheunemann
Supervisor of ParksPlanning & Development
Walter Fischer
LandscapeArchitectural Planner
(3)
Indicates temporarypositions
Risk Management OfficialKatie Thompson
Risk ManagementInspector
Infrastructure and Growth Management DivisionEngineering DepartmentInfrastructure Planning Branch
165165

Manager of Development ServicesFrank Palka
Senior DevelopmentServices Technologist
(3)
Development ServicesField Coordinator
(2)
IntermediateDevelopment Services
Technologist(1)
Infrastructure and Growth Management DivisionEngineering DepartmentDevelopment Services Branch
166166

Manager of Corporate AssetManagementKelly Oakley
Infrastructure ProgramEngineer
Vacant
InfrastructureTechnologist
(2)
Senior InfrastructureProgram Technologist
Supervisor of Policy andStandardsHolly Hayes
Policy and StandardsTechnologist
(2)
Infrastructure and Growth Management DivisionEngineering DepartmentCorporate Asset Management Branch
167167

Performance Plan 2016
Department:
Departmental Overview
Engineering
Our vision is: "Effectively delivering sustainable infrastructure for the community."
Our mission is: "The Engineering Department will:- manage the planning, construction and rehabilitation of the City’s infrastructure assets (including
transportation systems, drainage systems, drinking water systems, wastewater systems, and parks and trail systems)
- manage and preserve the City’s natural assets (including urban forests, flora and fauna habitats, wetlands, surface water and groundwater) in an environmentally responsible, energy efficient, cost effective and sustainable fashion to serve the needs and expectations of the Community."
The Engineering Department is comprised of four branches, Corporate Asset Management, Design & Construction, Infrastructure Planning and Development Services. Services provided by these branches are listed below. In addition to these services, staff participate on a number of corporate projects and committees, and are involved in a number of inter-governmental matters.
Corporate Asset Management Branch
The Corporate Asset Management Branch provides the following services:� Develop and implement the City's Asset Management Strategy & Plans � Planning of lifecycle investment requirements for the City's assets� Infrastructure condition assessments � Development of annual, multi-year capital plan � Develop and update policies and standards for the City's infrastructure assets � Apply for funding and grant applications
Design & Construction Branch
The Design and Construction Branch provides the following services:� Project management for City infrastructure projects � Project design (roads, water, wastewater, and stormwater) � Engineering surveys � Contract administration and construction quality assurance � Engineering support for other City branches and departments � Right of Way Activity Permits (ROWAP) � Anti-graffiti Program
Development Services Branch
The Development Services Branch provides the following services:� Engineering review, analysis and comments on all development applications, including Official Plan
amendments, Zoning by-law amendments, Site Plans, Plans of Subdivision and Condominiums, applications for Committee of Adjustment including severances and minor variances
� Management of IGM Division comments and conditions associated with "pre-consultation" for rezoning, subdivision and site plan applications
� Preparation of engineering conditions for Site Plan and Subdivision Agreements. � Technical support in developing strategic policy and standards related to land development.
168168

� Technical review, direction and sign off on development agreements � Review and recommendation regarding security holdbacks and periodic reduction and release of
letter of credits for all development agreements � Subdivision and site plan assumption process
Infrastructure Planning Branch
The Infrastructure Planning Branch provides the following services: � Long-term planning of the City’s infrastructure (roads, water, wastewater, stormwater, parks)� Municipal Class Environmental Assessments � Infrastructure modelling and studies� Design and construction of parks and trails and development review for parks and open space � Drinking Water Source Protection
Key Departmental Objectives� Strategic management of the City's corporate assets to minimize costs over the long-term� Delivery of environmentally responsible, energy efficient, cost effective and sustainable infrastructure
on time and on budget� Timely review and approval of land development applications� Master planning for infrastructure and parks
Strategic Plan & Other Program Deliverables� Responsible Spending: Demonstrate value for money� Inclusive Community: Provide great public spaces� Well Planned Transportation: Improve road network, improve options to get around, improve road
safetyMajor Initiatives/Issues
� Cundles/Duckworth/Highway 400 Interchange Improvements� Memorial Square Redevelopment� Phase 3 & 4 of the Class EA process for roads in the Annexed Area (Infrastructure Implementation
Plan)� Design of trunk watermains and wastewater mains in the Annexed Area (Infrastructure
Implementation Plan) � City-wide Stormwater Model � Major Site Plan Development � Water Quality Improvement in Kempenfelt Bay � Drinking Water Source Protection Plan Implementation� Climate Change Strategy� Corporate Asset Management Plan Update
Key Performance IndicatorsCorporate Asset Management Branch
Indicator 2014 Actual 2015 Plan 2015 Projected 2016 PlanMC Permit - Initial Review within 5 days n/a 95% 70% 100%
MC Permit - Approval within 15 days 93% 95% 93% 95%
Product Approval - % Receipt n/a 90% 90% 100%
Product Approvals - % Review within 30 days
n/a 90% 0% 90%
Product Approvals - % New Product n/a 70% 70% 70%
Design & Construction BranchIndicator 2014 Actual 2015 Plan 2015 Projected 2016 Plan
Percent of capital project designs complete by year end
n/a 100% 70% 100%
Percent of capital projects tendered on 53% 100% 80% 100%
169169

schedule
Change Orders as a % of total tender value 8% 7% 7% 7%
Capital expenditures as a % of forecasted expenditures
56% 100% 75% 100%
ROWAP inspection fees % spent vs collected
n/a 90% 90% 90%
Percent satisfaction based on construction customer survey
n/a 75% 75% 80%
Development Services BranchIndicator 2014 Actual 2015 Plan 2015 Projected 2016 Plan
Average Pre-consultation review time 1st submission (days)
24 days 20 days 24 days 20 days
Average Site Plan review time 1st submission (days)
25 days 25 days 23 days 25 days
Average Subdivision review time (days) 40 days 30 days 38 days 30 days
Infrastructure Planning BranchIndicator 2014 Actual 2015 Plan 2015 Projected 2016 Plan
Number of properties where drinking water source threats have been verified
n/a 225 >225 30
Percent of parks and trails capital projects completed on schedule
n/a 100% 100% 100%
Percent of Class Environmental studies completed on schedule
n/a 80% 90% 80%
Percent of Risk Management Plans established through inspection and negotiation with business owners
n/a n/a n/a 15%
170170

INFRASTRUCTURE & GROWTH MANAGEMENTENGINEERING
2014 2015 2015 2016 2017 2018ACTUAL BUDGET FORECAST BUDGET FORECAST FORECAST
EXPENSESSalaries 3,286,978 3,390,806 3,092,679 3,367,596 3,418,638 3,472,216 Fringe Benefits 841,602 795,660 812,184 785,573 797,358 809,318 Total Salaries and Benefits 4,128,580 4,186,466 3,904,863 4,153,169 4,215,996 4,281,534 OPERATING EXPENSESGeneral Operations 623,251 1,466,155 905,233 1,107,065 661,560 663,140 Minor Capital 84,374 53,000 84,979 81,190 87,190 90,190 Hydro, Water, Sewer, Gas - - - - - - Transfers to other Boards, Municipalities, Agencies - - - - - - Total Operating Expenses before Debenture Costs and Transfers 707,625 1,519,155 990,212 1,188,255 748,750 753,330 DEBENTURE COSTS AND TRANSFERSLease Equipment/Property - - 105 24,636 25,352 26,167 Financial Expenses - - 383 - - - Transfer to/from User Rate Reserve Funds - - - - - - Transfer to Reserves - - - - - - Transfer to Capital Fund - - - - - - Total Debenture Costs and Transfers - - 488 24,636 25,352 26,167 Gross Expenditures 4,836,205 5,705,621 4,895,563 5,366,060 4,990,098 5,061,031 Revenues Other Government Funding - - - (34,000) - - Contribution from Reserves/Reserve Funds (126,530) (700,000) (161,762) (250,000) - - Licences, Permits, Application Fees (258,476) (262,500) (272,970) (559,249) (556,414) (554,494) Fines - - - - - - Fees, Charges, Service Rentals (600,191) (597,083) (935,167) (694,167) (710,780) (727,409) Other Revenue (2,047,719) (2,022,346) (1,735,262) (2,124,376) (1,953,231) (1,978,609) Total Revenues (3,032,916) (3,581,929) (3,105,161) (3,661,792) (3,220,425) (3,260,512) Net Operating Expense/(Revenue) 1,803,289 2,123,692 1,790,402 1,704,268 1,769,673 1,800,519
CITY OF BARRIE2016 OPERATING BUDGET
EXPENDITURES
171171

2014 2015 2015 2016 Service 2016Actual Approved Forecasted Base Level Requested
Expenditures Budget Expenditure Budget Change(s) Budget$ $ $ $ $ $ $ % $ % Comments
EXPENSESSalaries 3,286,978 3,390,806 3,092,679 3,367,596 (1,918) 3,365,678 (23,210) -1% (25,128) -1%Fringe Benefits 841,602 795,660 812,184 785,573 19,195 804,768 (10,087) -1% 9,108 1%Total Salaries and Benefits 4,128,580 4,186,466 3,904,863 4,153,169 17,277 4,170,446 (33,297) -1% (16,020) 0%OPERATING EXPENSESGeneral Operations 623,251 1,466,155 905,233 1,107,065 250,000 1,357,065 (359,090) -24% (109,090) -7% 0.21
Minor Capital 84,374 53,000 84,979 81,190 - 81,190 28,190 53% 28,190 53% Minor capital expenses budget has increased due to the addition of $10,000 for motorized vehicle control barricades to protect the City’s trail system, and $25,000 for adding fencing on the City’s Environmentally Protected (EP) lands in cases where encroachment from private property owners is occurring. An increase in the parks morality lighting budget by $6,000 from $24,000 to $30,000 is also included in the proposed 2016 budget. Reductions in the 2016 budget include removal of the bicycle lock post and lockers previously budgeted at $5,000 and the parkland barrier free parking stalls previously budgeted at $8,000.
Hydro, Water, Sewer, Gas - - - - - - - 0% - 0%Transfers to other Boards, Municipalities, Agencies - - - - - - - 0% - 0%Total Operating Expenses before Debenture Costs and Transfers 707,625 1,519,155 990,212 1,188,255 250,000 1,438,255 (330,900) -22% (80,900) -5%
DEBENTURE COSTS AND TRANSFERSLease Equipment/Property - - 105 24,636 - 24,636 24,636 #DIV/0! 24,636 0%Financial Expenses - - 383 - - - - 0% - 0%Transfer to/from User Rate Reserve Funds - - - - - - - 0% - 0%Transfer to Reserves - - - - - - - 0% - 0%Transfer to Capital Fund - - - - (880) (880) - 0% (880) 0%Total Debenture Costs and Transfers - - 488 24,636 (880) 23,756 24,636 #DIV/0! 23,756 0%Gross Expenditures 4,836,205 5,705,621 4,895,563 5,366,060 266,397 5,632,457 (339,561) -6% (73,164) -1% Revenues Other Government Funding - - - (34,000) - (34,000) (34,000) #DIV/0! (34,000) 0% Contribution from Reserves/Reserve Funds (126,530) (700,000) (161,762) (250,000) (150,000) (400,000) 450,000 -64% 300,000 -43% Licences, Permits, Application Fees (258,476) (262,500) (272,970) (559,249) (12,210) (571,459) (296,749) 113% (308,959) 118% Fines - - - - - - - 0% - 0% Fees, Charges, Service Rentals (600,191) (597,083) (935,167) (694,167) - (694,167) (97,084) 16% (97,084) 16% Other Revenue (2,047,719) (2,022,346) (1,735,262) (2,124,376) (73,347) (2,197,723) (102,030) 5% (175,377) 9% Total Revenues (3,032,916) (3,581,929) (3,105,161) (3,661,792) (235,557) (3,897,349) (79,863) 2% (315,420) 9% Net Operating Expense/(Revenue) 1,803,289 2,123,692 1,790,402 1,704,268 30,840 1,735,108 (419,424) -20% (388,584) -18%
Base Budget Requested Budgetto 2015 Approved Budget to 2015 Approved Budget
INFRASTRUCTURE AND GROWTH MANAGEMENT DIVISIONEngineering Department
2016 Base Budget Change Report
Change in 2016 Change in 2016
172172

Director of Environmental ServicesJohn Thompson
Manager of WastewaterOperations
Sandy Coulter
Manager of EnvironmentalOperations
Sandra Brunet
Supervisor of WastewaterOperations and
MaintenanceCarl Darby
Supervisor of TechnicalServices
Martin Shaw
Supervisor ofEnvironmental Compliance
Lenita Hywarren
Senior WastewaterOptimization Engineer
Zbigniew Bukala
Office Coordinator IKim Nicholson
Office ServicesAssistant
(2)
Operations SupportAdministrator (Water)
(3)
Supervisor of SurfaceWater SupplyJamey Adams
Manager of Water OperationsEdgar Tovilla
Supervisor of GroundWater SupplyDavid Truax
Supervisor of WaterCustomer Services
Chris Marchant
Supervisor of Complianceand Technical Support
Diane Moreau
Supervisor of WaterDistribution Services
Chris Harper
Landfill OperationsSupervisor
Katherine Sirens (Interim)
Infrastructure and Growth Management DivisionEnvironmental Services Department
173173

Manager of WastewaterOperations
Sandy Coulter
Supervisor of WastewaterOperations and
MaintenanceCarl Darby
Senior WastewaterOptimization Engineer
Zbigniew Bukala
Utility SCADASpecialist
Kevin Quigley
Electrical andMechanical Lead Hand
MaintenanceOperator III –
Mechanical – WwTF
Supervisor of TechnicalServices
Martin Shaw
MaintenanceOperator III –
Electrical – WwTF(2)
Maintenance OperatorClass II – WwTF
(7)
Operations Lead Hand
Operator III – WwTF(4)
Operator II – WwTF(7)
Laboratory Technician(Wastewater)
(2)
WastewaterOptimization Analyst
Chemical and MaterialCoordinator
IMS Coordinator
Operations ProjectCoordinator(Wastewater)
Infrastructure and Growth Management DivisionEnvironmental Services DepartmentWastewater Operations Branch
174174

Manager of EnvironmentalOperations
Sandra Brunet
Supervisor ofEnvironmental Compliance
Lenita Hywarren
Landfill OperationsSupervisor
Katherine Siren (Interim)
Senior EnvironmentalOfficer
(3)
Environmental Officer(2)
Operator 1 –Heavy Equipment
(Landfill)(4)
Landfill Attendant(2)
Landfill OperationsAttendant
(2)
Waste ReductionCoordinator
(2)
EnvironmentalOutreach Programmer
Landfill Attendant (PPT)
Labourer (PPT)
Infrastructure and Growth Management DivisionEnvironmental Services DepartmentEnvironmental Operations Branch
175175

Manager of Water OperationsEdgar Tovilla
Supervisor of WaterCustomer Services
Chris Marchant
Water DistributionOperator Class II
(9)
Supervisor of WaterDistribution Services
Chris Harper
Supervisor of Ground WaterSupply
David Truax
Water CustomerServices Lead Hand
Water DistributionOperator Class II
(5)
Water Works Operator
Senior Water WorksOperator
(7)
Water Supply andTreatment Operator
Class IV
Backflow PreventionProgram Coordinator
Water DistributionServices Lead Hand
Supervisor of SurfaceWater SupplyJamey Adams
Utilities InstrumentTechnician
Water Supply andTreatment Lead Hand
Water Supply andTreatment Lead Hand
Operations ProjectCoordinator (Water)
(5)
Water Supply andTreatment Operator
Class IV(5)
Laboratory Technician(Water)
Water QualityDistribution Operator II
(2)
Water Works Operator
Water Services FieldCoordinator
Utilities Technician(3)
Utilities InstrumentTechnician
Water UtilitiesProgram Clerk
(Work Order Management)(2)
Water DistributionServices Project
Operator(2)
Supervisor of Complianceand Technical Services
Diane Moreau
Water UtilitiesProgram Clerk
(Backflow Prevention)
Water OperationsTechnical Advisor
Allan Miller
Water Works Operator(2)
Water Works Operator(2)
Infrastructure and Growth Management DivisionEnvironmental Services DepartmentWater Operations Branch
Water UtilitiesProgram Clerk
(AMI)
176176

Performance Plan 2016
Department:
Departmental Overview
Environmental Services
The Environmental Services Department is comprised of three Branches, including the Environmental Operations Branch, the Wastewater Operations Branch and the Water Operations Branch.
Key responsibilities include the operation and maintenance of the City’s environmental infrastructure and systems including water supply, treatment and distribution systems; wastewater collection, treatment and disposal facilities; solid waste collection, diversion and disposal, and environmental investigation and response.
All three Branches strived in 2015 to implement the recommendations of the respective Service Area Reviews undertaken for each of the Branches in 2011 with a focus on improving efficiencies/economies and enhancing service delivery.
Departmental administration accounts for 1% of the Department's financial resources and 2% of the Department's staff resources.
Environmental Operations Branch (EOB)
The Environmental Operations Branch requires approximately 18% of the Department's financial resources and 17% of the Department's staff resources to perform the following services: landfill operations, non-hazardous solid waste disposal, household hazardous waste receiving and disposal; leaf and yard waste disposal and composting; solid waste collection and disposal; municipal waste diversion/recycling programs including delivery of recycling containers and retailing back yard composters; environmental investigation, emergency response, monitoring and compliance; environmental education programs & promotion all in accordance with the Environmental Protection Act (EPA).
The Landfill Re-Engineering Project continues to proceed on time and on budget with an anticipated completion in 2016. The Branch is working towards implementing various elements of the Sustainable Waste Management Plan which has received approval in principle and emphasized increased diversion opportunities.
Wastewater Operations Branch (WWOB)
The Wastewater Operations Branch requires approximately 40% of the Department's financial resources and 27% of the Department's staff resources to perform the following services: collection and treatment of wastewater; operation and maintenance of the Wastewater Treatment Facility (WwTF); 14 Remote Wastewater Pumping Stations; the Oro Biosolids Storage Facility plus 3 additional pumping stations at the Barrie Sports Complex; and the operation and maintenance of the Lake Simcoe Regional Airport (LSRA) sewage system. All works are performed in accordance with the EPA, Ontario Water Resources Act (OWRA), Lake Simcoe Protection Act (LSPA), Nutrient Management Act (NMA), etc.
Barrie has a recent Environmental Compliance Approval (ECA) from the Ministry which applies to considerably more restrictive effluent criteria, in particular, impacting the allowed discharge concentration of phosphorus by June 2015. Considerable process improvements are required in order to competently achieve the new limits on an on-going basis. Related improvements / additions include potential construction of new works with an expected cost ranging from $40 million to $100 million. In the interim, an Optimization Section has been tasked with ensuring ongoing effluent compliance.
177177

Water Operations Branch (WOB)The Water Operations Branch requires approximately 41% of the Department's financial resources and 54% of the Department's staff resources to perform the following services: ensuring the delivery of a safe and adequate supply of potable water through the management of the Municipal Drinking Water System within (applicable) regulatory requirements (OWRA & Safe Drinking Water Act (SDWA), etc.). This includes the repair and maintenance of drinking water treatment systems, water mains, valves, hydrants, residential main shut off valves, repair and replacement and water meters for service billing; the inspection of water mains and services; the installation of Industrial / Commercial / Institutional water services and meters, new home meters and hydrant metered gate valves; the Backflow Prevention Program; the resolution of water quality or water pressure issues/complaints; the maintenance of City standard drawing details for water specifications; and the prevention of infrastructure damage through the locating services for all of the City of Barrie's buried infrastructure.
Increased resources were recently identified to address infrastructure requirements for frozen services experienced in the 2014 and 2015 winters due to extreme weather conditions. Distribution system improvements will continue to be implemented in coming years. In complying with the June 2014 provincial legislative obligations, the Water Operations Branch provides locate services for all Barrie owned infrastructure to ensure compliance with the new "One Call" requirements.
Key Departmental ObjectivesProvision of the City of Barrie's operation and maintenance of municipal infrastructure for:
� Waste management and environmental protection; � Collection, treatment and disposal of wastewater while protecting Lake Simcoe; and� The delivery of a safe and adequate supply of potable and fire fighting water.
Strategic Plan & Other Program Deliverables� Meet level of service standards (LOS) prescribed by City Council and continue to strive for service
improvements and operating efficiencies.� Comply with legislation; OWRA, SDWA, EPA, Environmental Assessment Act (EAA), Ontario
Building Code Act (OBCA), Occupational Health and Safety Act (OHSA), Municipal Act (MA), etc.� Fully and competently satisfy regulatory compliance with applicable Provincial/Federal legislation at
all times.
Major Initiatives/Issues� Promote worker safety practices; including communicating safety improvements with staff and
seeking prevention.� Develop/promote effective Public Communications Programs. � Validate and monitor customer satisfaction. � Adjust expenditures/ revenues to maintain targets. � Ongoing review of processes to improve efficiencies. � Track details of non-compliance incidents, implement corrective measures.� Develop a framework for Standard Operating Procedures / Standard Operating Guidelines
(SOP/SOG) development and training. This framework to train staff on SOP/SOGs. � Improve percentage of preventative maintenance (employ/optimize Computerized Maintenance
Management System (CMMS) / City Works functionality).
Key Performance Indicators
Indicator 2014 Actual 2015 Plan 2015 Projected 2016 PlanSolid Waste management and environmental protection:
� Residential Diversion Rate� Service Complaints - Curbside
Collections / 1,000 serviced units
46.65.0
48.5%10
5010
5010
Collection, treatment and disposal of wastewater:
� Cost per Mega Litre (ML) of treated $926.73 $967.03 $980.00 $1,018.02
178178

sewagePercent time treatment effluent limits met
100% 100% 100% 100%
The delivery of safe and adequate supply of potable and fire fighting water:
� Cost per Mega Litre (ML) of treated water
� Number of customer complaints per 1,000 customers.
$1,187.00
1.84
$1,412.17
3.0
$1,324.55
3.85
$1,371.69
1.3
179179

INFRASTRUCTURE & GROWTH MANAGEMENTENVIRONMENTAL SERVICES - TAX RATE BASED ONLY
2014 2015 2015 2016 2017 2018ACTUAL BUDGET FORECAST BUDGET FORECAST FORECAST
EXPENSESSalaries 1,767,813 1,878,564 1,717,129 2,017,034 2,041,742 2,071,697 Fringe Benefits 396,577 386,365 390,146 451,265 458,033 464,904 Total Salaries and Benefits 2,164,390 2,264,929 2,107,275 2,468,299 2,499,775 2,536,601 OPERATING EXPENSESGeneral Operations 5,921,802 5,748,900 5,870,774 6,175,901 5,962,705 6,186,500 Minor Capital 50,650 32,500 32,781 32,550 42,600 2,655 Hydro, Water, Sewer, Gas - - - - - - Transfers to other Boards, Municipalities, Agencies - - - - - - Total Operating Expenses before Debenture Costs and Transfers 5,972,452 5,781,400 5,903,555 6,208,451 6,005,305 6,189,155 DEBENTURE COSTS AND TRANSFERSLease Equipment/Property 307,423 349,886 340,929 373,128 442,254 404,161 Financial Expenses 6,217 5,800 7,998 5,800 5,900 6,000 Transfer to/from User Rate Reserve Funds - - - - - - Transfer to Reserves 311,868 343,055 343,055 377,360 415,096 456,606 Transfer to Capital Fund - - - - - - Total Debenture Costs and Transfers 625,508 698,741 691,982 756,288 863,250 866,767 Gross Expenditures 8,762,350 8,745,070 8,702,812 9,433,038 9,368,330 9,592,523 Revenues Other Government Funding (1,334,848) (997,000) (903,363) (1,185,600) (1,120,000) (1,120,000) Contribution from Reserves/Reserve Funds - (125,000) (10,000) (115,000) - - Licences, Permits, Application Fees - - - - - - Fines - - - - - - Fees, Charges, Service Rentals (1,423,763) (1,350,900) (1,288,599) (1,290,425) (1,291,500) (1,293,000) Other Revenue (1,138,065) (1,172,286) (1,101,412) (1,243,457) (1,207,712) (1,221,903) Total Revenues (3,896,676) (3,645,186) (3,303,374) (3,834,482) (3,619,212) (3,634,903) Net Operating Expense/(Revenue) 4,865,674 5,099,884 5,399,438 5,598,556 5,749,118 5,957,620
CITY OF BARRIE2016 OPERATING BUDGET
EXPENDITURES
180180

2014 2015 2015 2016 Service 2016Actual Approved Forecasted Base Level Requested
Expenditures Budget Expenditure Budget Change(s) Budget$ $ $ $ $ $ $ % $ % Comments
EXPENSESSalaries 1,767,813 1,878,564 1,717,129 2,017,034 - 2,017,034 138,470 7% 138,470 7% Employee compensation costs provide for
modest cost of living provisions and merit increases for full time CUPE and non-union employees.
Fringe Benefits 396,577 386,365 390,146 451,265 - 451,265 64,900 17% 64,900 17%Total Salary and Benefits 2,164,390 2,264,929 2,107,275 2,468,299 - 2,468,299 203,370 9% 203,370 9%OPERATING EXPENSESGeneral Operations 5,921,802 5,748,900 5,870,774 6,175,901 35,000 6,210,901 427,001 7% 462,001 8% Removed Historic Waste Site Monitoring,
savings of $60K. Increase of $70K for a Consultant to operate and maintain the Gas Plant upon the completion of the Landfill Reengineering project. The Residential Curbside Collection increase of $308K in 2016 is a result of the annual inflation based on CPI as well as a change in material volumes collected at the curb since the implementation of garbage collection every other week.
Minor Capital 50,650 32,500 32,781 32,550 - 32,550 50 0% 50 0%Hydro, Water, Sewer, Gas - - - - - - - 0% - 0%Transfers to other Boards, Municipalities, Agencies - - - - - - - 0% - 0%Total Operating Expenses before Debenture Costs and Transfers 5,972,452 5,781,400 5,903,555 6,208,451 35,000 6,243,451 427,051 7% 462,051 8%
DEBENTURE COSTS AND TRANSFERSLease Equipment/Property 307,423 349,886 340,929 373,128 - 373,128 23,242 7% 23,242 7%Financial Expenses 6,217 5,800 7,998 5,800 - 5,800 - 0% - 0%Transfer to/from User Rate Reserve Funds - - - - - - - 0% - 0%Transfer to Reserves 311,868 343,055 343,055 377,360 - 377,360 34,305 10% 34,305 10% Landfill post closure costs - PSAB, annual
amount increase of 10% each year as per Council motion.
Transfer to Capital Fund - - - - - - - 0% - 0%Total Debenture Costs and Transfers 625,508 698,741 691,982 756,288 - 756,288 57,547 8% 57,547 8%Gross Expenditures 8,762,350 8,745,070 8,702,812 9,433,038 35,000 9,468,038 687,968 8% 722,968 8% Revenues Other Government Funding (1,334,848) (997,000) (903,363) (1,185,600) - (1,185,600) (188,600) 19% (188,600) 19% Increase in Waste Diversion Ontario
Blue/Gray Box Reimbursements based on 2015 payments.
Contribution from Reserves/Reserve Funds - (125,000) (10,000) (115,000) - (115,000) 10,000 -8% 10,000 -8% Licences, Permits, Application Fees - - - - - - - 0% - 0% Fines - - - - - - - 0% - 0% Fees, Charges, Service Rentals (1,423,763) (1,350,900) (1,288,599) (1,290,425) (40,000) (1,330,425) 60,475 -4% 20,475 -2% Estimated revenues from the sale of
blue/gray box recyclables are expected to be lower in 2016 based on 2015 market forecast.
Other Revenue (1,138,065) (1,172,286) (1,101,412) (1,243,457) - (1,243,457) (71,171) 6% (71,171) 6% Total Revenues (3,896,676) (3,645,186) (3,303,374) (3,834,482) (40,000) (3,874,482) (189,296) 5% (229,296) 6% Net Operating Expense/(Revenue) 4,865,674 5,099,884 5,399,438 5,598,556 (5,000) 5,593,556 498,672 10% 493,672 10%
Change in 2016 Change in 2016Base Budget Requested Budget
to 2015 Approved Budget to 2015 Approved Budget
INFRASTRUCTURE AND GROWTH MANAGEMENT DIVISIONEnvironmental Services Department2016 Base Budget Change Report
Tax Rate Based Only
181181

Director of Facilities and TransitKevin Bradley
Manager of Facility Planningand Development
Lindsay Worton (Interim)
Manager of TransitDan Burton (Interim)
Office Coordinator IISharon McFadden
Office ServicesAssistant
Facilities Capital ProjectSupervisor
Gus Diamantopoulos
Facilities Capital ProjectSupervisor
Ryan Jones (Interim)
Supervisor of TransitBusiness Services
Brent Forsyth
Manager of EnergyManagement
Barry Thompson
Manager of CorporateFacilities
Wayne Collins
Facility Supervisor(Corporate)
Wade Leblanc
Facility Supervisor(Environmental)Eugene Zenger
Facility Supervisor(Marina)
Brad McConnell
Infrastructure and Growth Management DivisionFacilities and Transit Department
Indicates temporaryposition
182182

Manager of Facility Planning andDevelopment
Lindsay Worton (Interim)
Facilities Capital ProjectSupervisor
Ryan Jones (Interim)
Facilities Technologist(0)
Facilities Capital ProjectSupervisor
Gus Diamantopoulos
Infrastructure and Growth Management DivisionFacilities and Transit DepartmentFacility Planning and Development Branch
Indicates temporaryposition
183183

Manager of Corporate FacilitiesWayne Collins
Facility Supervisor(Corporate)
Wade Leblanc
Facility Supervisor(Marina)
Brad McConnell
Facility ServicesGeneralist
(9)
Facility ServicesGeneralist (PPT)
Facility ServicesTechnician
(2)
Facility ServicesCoordinator
(2)
Facility Supervisor(Environmental)Eugene Zenger
Facility ServicesCoordinator
Facility ServicesTechnician
(3)
Facility ServicesGeneralist
(3)
FIMS Coordinator
Infrastructure and Growth Management DivisionFacilities and Transit DepartmentCorporate Facilities Branch
Facility ServicesElectrician
184184

Manager of TransitDan Burton (Interim)
Transit Coordinator(Planning and ITS)
Transit Support Clerk
Supervisor of TransitBusiness Services
Brent Forsyth
Transit Coordinator(Specialized Transit and
Policy Development)
Infrastructure and Growth Management DivisionFacilities and Transit DepartmentTransit Branch
185185

Manager of Energy ManagementBarry Thomspon
Energy ManagementCoordinator
Indicates temporaryposition
Infrastructure and Growth Management DivisionFacilities and Transit DepartmentEnergy Management Branch
186186

Performance Plan 2016
Department:
Departmental Overview
Facilities & Transit
Facilities and Transit provides the City of Barrie with expertise in five key service areas: facility planning/design and construction, property management, facility asset management, energy management, and transit. As a Centre of Excellence for a large and complex inventory of physical assets, the department comprises all the necessary functions and lines of business to ensure the full life-cycle management of the City of Barrie's facility, property, and transit portfolios.
The department is organized into four branches: Facility Planning and Development, Corporate Facility Services, Energy Management, and Transit.
Facility Planning and Development
Functions
The Facility Planning and Development Branch is comprised of a multi-disciplinary staff team with architectural, engineering, technologist, and project management designations. The lines of business and services provided include:
Facility planning including facility master planning, needs assessments, master accommodation planning, and facility capital planning Facility Design and Construction Project Management Services Interior design, space planning, and interior renovations Facility Environmental Review and Remediation ServicesFacility Asset Condition Assessment and Planning
Corporate Facility Services
Functions
The Corporate Facility Services Branch provides program support and facility management services to the City's departments and service partners through the coordination of the physical workplace with the people and the services of the organization. The Branch maintains and operates corporate facilities comprising over 1.2 million square feet related to 40 City facilities including the Barrie Marina with a current replacement value of approximately $1 billion. The services are provided by a team of facility professionals with expertise and credentials in business administration, preventative and predictive maintenance, facility management, intelligent building systems, and service contract management. The lines of business and services provided include:
Facility Maintenance and OperationsFacility Security AdministrationLease ManagementFacility Emergency PreparednessFacility Information and Business Systems
Service Drivers
Growth Pressures - maintenance, operation and repair of a corporate facility portfolio that has
187187

grown by 800% over the last (10) years to support the public, and City services and programs.Cost Pressures - escalating cost for materials, supplies, contracted services, and skilled trades is expected to continue into 2015. Workforce Planning - the average age of skilled facility maintainers/operators is approximately (50) years old presenting a serious issue for facility organizations that requires a strategic approach to plan for succession, attrition, employee attraction/retention, and knowledge transfer.
Energy Management
Functions
The Energy Management Branch formed in 2013 provides leadership and operational support across the organization to manage the City's energy portfolio in a fiscally responsible and sustainable manner. The Branch works with City departments to set energy budgets, establish energy efficiency standards and procedures, and ensures the City remains current with the latest innovations in energy efficient technology. The lines of business and services provided include:
Energy Procurementperforms energy procurement services for the Cityadministers energy contracts with utility suppliersresearches alternative energy solutions and procurement strategies to mitigate fluctuations in energy prices and minimize the financial risk
Energy ServicesUtilizes energy management software to track, monitor, and report energy consumption through City facilitiesUses data to identify opportunities to reduce energy use through operational optimization and retrofit programsBuilds and monitors consumption/demand profiles to respond to unexpected changes in energy use that require immediate investigationConducts energy audits for facilities and processesEstablishes conservation, operator and occupant education programsReports to the Province on City conservation programs, targets, and verified reductions in energy use
Advisory ServicesBranch works with Facility Planning and other City departments to provide them with current information about energy efficiency practices and technologies, renewable energy technology, and leading energy and environmental standards that can be applied to new facility construction, retrofits to existing facilities, and to processes/operations.
Utility ManagementProvides bill validation and verification services maintaining a complete database of all City energy accounts that contain historical and current energy bill informationPrepares energy budgets for the corporation and administers and approves payments for all utility bills
Research and DevelopmentContinuous investigation of new technologies and processes leading to innovative ways to reduce energy costs and build a sustainable City
Project Management Leads integrated design process for facility construction Manages retrofit, existing building commissioning, energy audit, and energy master planning programsResearches and manages energy project incentive applications for capital works related to energy conservation
Service Drivers
188188

Escalating Energy Costs especially in electrical rates, which makes up 90% of energy costs where increases are expected to be above the rate of inflation.Leadership in Sustainability and as part of the corporations response to climate change.Growth; as we develop annexed lands new facilities will be required, more people will be using existing infrastructure which drives up energy use.Regulatory requirements:
O.Reg 397/11 requires collection and reporting on energy use in all facilities and water supply and treatment infrastructure, development of energy management plan including targets for reduction over five year period and implementation plan to reach them,Lake Simcoe ACT places stringent requirements on phosphorus levels at WwTF which impacts treatment options which impacts energy use.
Transit
Functions
The Transit Branch strives to provide customer focused, efficient, reliable and affordable public transportation service that links people, workplaces and the community through an integrated, easy to use public transit system that promotes economic development and improves the quality of life in Barrie.
Barrie Conventional Transit – City owns a fleet of 44 buses with the daily operation and maintenance service provided through a private contractor. The City is responsible for the administration, planning, scheduling, revenue generation and fleet purchases for this service. Transit service is provided 7 days a week.
Barrie Specialized Transit – City owns a fleet of 12 buses to provide specialized transit service to the physically disabled with the daily operation, scheduling, and maintenance provided through a private contractor. The City is responsible for the administration, service planning, eligibility standards and fleet purchases for this service. Specialized transit is a scheduled service and operates 7 days a week.
Service Drivers
Transit Continuous Improvement - Improved service levels and frequencies for riders; grow reliability of the service in order to ensure increased ridership levels moving forward; establishing planning principles to guide future planning and service expansion. Implementation of recommendations from the 5yr transit business plan. Active transportation - Enhancing and increasing the overall percent modal share through promoting active transportation and its integration with public transit systems; creating mobility hub destinations in close proximity to residential and business areas to allow for ease of access by active transportation users.Modal Shift - Increasing modal share by offering higher frequency of service to our customers to bring us from a current 1.7% modal share to a future planning state of 7% reducing our reliance and need for large linear infrastructure to support vehicular traffic and congestion.Growth - Establishing service level standards and planning principles to guide the growth and expansion of the Transit service in alignment with the annexation works. Ensure the system design remains intact to enable service expansion as well as foster future service partnerships with neighboring municipalities such as Essa and Base Borden to promote a more regional focused system. System integration - Continue to grow partnerships with our transit service partners such as Metrolinx and Inter City Carriers to create a seamless integration with inter City carriers at multiple service locations such as Allandale and South GO station to help foster growth and economic development in the area. By having a seamless integration with these service partners, we will act as an economic driver for City development and growth by offering multiple transportation options to residents, businesses, students, and employees.
Key Departmental Objectives
To provide strategic leadership, services and programs that contribute to the building and support of a
189189

prosperous and sustainable community. The delivery of the department's services are organized using the following performance goals:
Responsible management of all real property and transit assetsExceptional value-added services and consulting expertise Service/operational excellence Continuous improvement Fiscal responsibility and transparency
Specific Department Objectives:
Provide excellent customer service to our clients, partners, and stakeholders, while demonstrating effectiveness in the daily operation and preservation of City facilities and properties. The department will ensure the effective delivery of total facility management for our valuable portfolio of facility and property assets, and provide professional advice to Council, Executive Management, clients and service partners Comprehensive review, plan and implementation of facility asset management and maintenance strategies and effective facility/property management solutions to meet the City's short and long-term objectives to contain costs while preserving our assets and maintaining service excellence Lead the organization in sustainability programs and measures to protect our environment, monitor and control energy use, conserve the City's heritage assets and employ sustainable design, construction and operations of City facilities and services As a partner and service provider to all departments, provide a full range of professional technical services from master planning to completion related to facilities, feasibility studies, capital planning, design, renovation or construction, operations and security As a partner in creating a barrier free City, continue to collaborate with the Accessibility Advisory Committee to ensure City facilities and transit systems incorporate barrier-free principles, design and standards To provide commuters a conventional fixed route transportation service that is a viable alternative to private vehicles. A viable transportation service should eliminate the distance barrier for citizens with no other means of transportation and deliver a value proposition that encourages citizens with choices to opt for public transit.
Key Branch Objectives:
Facility Planning and Development Branch
Develop capital and life cycle programs for the preservation of all the City's building assets including sustaining an accurate major facility tangible capital asset inventory Complete the Facility Condition Assessment program for all facility assets to establish the baseline for all future planningCollaborate and engage, in coordination with Corporate Facility Operations and Energy Management, with our partners to ensure their total facility service needs are addressedCollaborate and engage with Recreation Facility Operations, in coordination with Energy Management, to ensure their total facility service needs are addressedProvide effective Project Management services with emphasis on Communication, Business Continuity, Cost control, Schedule awareness and process adherence
Transit
Provide a public transportation system that is a viable alternative to the automobile in the City of Barrie.Meet travel demands generated by various target markets in the employment, academic, commercial, medical and service industries and recognize that transit is an integral component of urban growth.Increase ridership and service reliability through the execution and monitoring of the performance based service contract enhancing the customer experience.
Energy Management
Develop and implement capital and low and no cost programs in facilities and energy using
190190

infrastructure to aid in developing a cost avoidance in regards to energy rate increases,Ensure all utility, Provincial or other incentives available for energy efficiency projects are applied for,Change the culture of the corporation to make energy use a priority for all staff and increase the understanding of how each individual impacts energy use,Provide facilities with attributes which show leadership in energy and environmental design and make the public aware of such features,Ensure design of new facilities and renewal of existing facilities follows integrated design process and makes energy efficient design a priority,Develop processes to ensure compliance with Reg. 397/11 and ensure integration of all facility groups into the Energy Management Plan.
Corporate Facility Services
Develop and implement an effective and sustainable maintenance and operations strategy using Archibus/FM as its foundationShift the facilities maintenance staff, processes and decision-making to a culture based on reliability-centred maintenance and the criticality of equipment/assetsEngage our clients, partners, and the public through the use of FM specific Customer Service Surveys with consideration of using QR codes in public facilities to collect instant customer feedback.Explore the use of Ping Street for Public access.Continue with our workforce planning and training initiatives to ensure we retain knowledgeable and skilled facilities staff in key roles for the facilities team Implement new training initiative with expanded Skillset Matrix for all FM positions. Establish in collaboration with our clients and partners SLAs and SLGs to identify realistic land sustainable levels of service for all facility services incorporating the concept of mission critical facility assetsProcedure and job role standardization to assist deliver consistent service delivery
Strategic Plan & Other Program DeliverablesCorporate Facility Services
Commence implementation of a reliability group pending approval of in-sourcing electrical work, and leading into Predictive Maintenance, and Root Cause Analysis.Continue the expansion of self-performed electrical tasks using the new Facility Services Electrician position to increase cost savings and improved service response times.Commence implementation of the Corporate Waterfront Master Plan with a focus on the strategy to leverage the City Marina to assist in creating a vibrant city center.
TransitLead the corporate team for the Transit Garage 3P project into the implementation phase with the completion of the Design Build portion for the Operations and Maintenance Facility and transition of service provider on July 1, 2015. Partner with Metrolinx for the Mobility Hub study which would look at the use of the Allandale Waterfront GO and its integration and relocation of both Barrie Transit services as well as Inter City Services such as Greyhound, and Ontario Northland. Collaborate with other City departments regarding the community improvement planning, land use planning, and development of the surrounding area to support and integrate a Mobility Hub. Primary lead for the City for the Metrolinx Regional Transportation (RTP) legislated review and the GO Regional Express Rail (RER) service expansion review to support GO station integration/access through a review of current and future City parking, transit, and active transportation infrastructure align with the demands of increased regional service to the City in the future.
Energy ManagementImplements the Energy Management PlanWorks towards achieving best in class benchmark energy use in facilitiesContinues to expand Energy Awareness Plan for all city staff
Facility Planning and DevelopmentIdentify Facilities asset renewal and rehabilitation requirements for Corporate, Recreational,
191191

Environmental and Marina FacilitiesPrepare and submit Business Cases to Corporate Assessment Management to promote proper budgeting, costings, timing for work, and alternative solutions, plan and develop, in collaboration with partner groups, new facilities and renovations to ensure adherence to Corporate guidelines and standards, while meeting the specific functional requirements and balancing cost and schedule. Project manage projects using standard Project Management approaches, tools and techniques to ensure the completion of projects as per schedule and budget. If there are changes then Change Management processes will be implemented.
Major Initiatives/IssuesCorporate Facility Services
Implement a certifiable best practice service delivery model (i.e. FM Journey to Excellence) with measurable outcomes and performance Finalize the implementation of the Facility Information Management System - Archibus/FM to the Environmental and Recreation portfolios. Review plans for a pilot early in the year utilizing the latest Archibus version (21.3).Finalize the Healthy Workplace Strategy including Service Level Guidelines, standard operating procedures, job hazard evaluations, and a succession/training plan Increase direct engagement through Customer Satisfaction Surveys with our key clients and partners Complete 40 plus rehabilitation projects throughout corporate facilities
TransitBegin the implementation of approved recommendations from the 5yr Transit Business Plan to guide the strategic planning and growth of the system to be adopted by council. Develop planning standards and guiding principles for future transit growth to be adopted by CouncilCollaborate with Access Barrie in the development and promotion of effective public communications and marketing strategies for transit including monitoring customer satisfaction and preferencesContinuous process review to improve the service, customer experience and efficiencies Develop and implement a framework for SOP/SOG training Continue to explore Transit Service Agreements with neighbouring municipalities where appropriate and work in partnership with the County of Simcoe to develop inter-municipal connectivity.
Energy Management
Continue to conduct Run it Right investigations and develop implementation plans for all the facilities completed Expand existing building commissioning program to recreation and develop implementation plans and budgets for all facilities Continue to expand Save Adam Energy Awareness program to raise the profile of the Energy Management branch and change the culture of staff within the corporation. Implementation of approved Capital Plan; including LED streetlight project, facility LED projects, BMC and EBCC building automation system (BAS) upgrades, installation of a permanent Energy Management System to replace existing pilot system Ensure integrated design process is followed for design of new emergency services campus
Facility Planning and Development (FPD)
Facility Planning:Undertake the following feasibility studies:
Hewitts/Allandale Recreation Centres; Hewitt's Branch Library, City Hall Intensification, Spirit Catcher Commercial Complex, Waterfront Centre (sea Cadets), and City Hall Site Upgrades
Facility Development (Design & Construction):Implement all of the approved Capital Plan projects being led by FPD with an emphasis on:
Completion of Phase 2 of the innovative City Hall HVAC System Modernization Completing the design of the Fire Station 3 Apparatus Bay Expansion and Renovation to provide space for a new emergency vehicle and to renovate to provide for female quarters Completing the design and construction of the Marina Bayfield Basin Upgrade, including removal of government dock and install of new docking system increasing the capacity of the
192192

basin for transient boatersComplete the reconstruction of the Allandale Recreation Centre Parking Lot and the Eastview Arena parking Lot;Complete the construction of the Lions Pavilion Complete the design of the Collier Centre Fit-up with the anticipation that the building proceedsComplete the re-construction of the Queen’s Park WashroomMove forward with First Responder Campus, specifically:
Complete the Campus Development PlanFinalize land acquisition for the First Responder Campus Complete the due diligence to complete land acquisitionIssue Detail Design RFP
Complete the Allandale Historic Train Station including Detail Design, Construction and obtaining a Licensee Service Provider Complete the Facility Condition Assessment program (Phase 3) that includes water and wastewater stations and other supporting structures Finalize the 5th Floor to accommodate GIS staff and IT Project Managers
For Project Management Services we will continue to: Promote an awareness of Health, Safety, Training and Work Life Balance Develop with FPD staff standards for project management in keeping with corporate governance and project management industry standards and best practices Improve customer service through post-occupancy evaluations and client post-project close-out surveys Provide effective and timely project communication to our partners
Key Performance IndicatorsCorporate Facility Services
Indicator 2014 Actual 2015 Plan 2015 Projected 2016 PlanCustomer satisfaction: Various FM Deliverables based on survey
NA NA 65% 75%
Maintenance efficiency: Total facility maintenance / facility replacement value (Optimal Level is 2 - 4%, IFMA industry standard is 1.55%)
NA NA FCA In-Progress
10%
Maintenance effectiveness: # preventative maintenance work orders as a percentage of total maintenance work orders (world class is 80%)
NA 45% 53% 65%
Facility Maintenance - $ per Sq.Ft N/A N/A $8.66 $8.00
Service Level Agreement Response & Ratification Times% KPI ComplaintRoutine/Urgent/Emergency
N/A N/A 90/99/100 93/100/100
Transit ServicesIndicator 2014 Actual 2015 Plan 2015 Projected 2016 Plan
Transit - revenue to cost ratio (TRNT315) 34% 37.6% 34.3% 33.8%
Passenger trips per in-service vehicle hour (TRNT340)
14.4 16.7 15.5 16.6
Operating Cost for conventional transit per regular service passenger trip (TRNT901M)
$6.20 $5.97 $6.23 $6.50
193193

Project Management EffectivenessIndicator 2014 Actual 2015 Plan 2015 Projected 2016 Plan
Percentage of project phases Substantially Performed at the end of year vs those committed for that year
NA 95 90 95
Percentage of projects completed within +/-10% of Project Budget
* in aggregate, 2015 total spend vs plan for completed projects is 94%
NA 95 *50% 75%
End of project satisfaction rating with client NA 85 75 85
Energy Management Indicator 2014 Actual 2015 Plan 2015 Projected 2016 Plan
Facility Energy Consumption per Square footage (ekWh/ft2)
36.27 35.46 35.17
Wastewater Energy Consumption per Megalitre (ekWh/mL)
571 498 498
Water Energy Consumption per Megalitre (ekWh/mL)
1302 1272 1247
Water Consumption per Square Foot - Tax base (m^3/ft2) to add a water consumption metric
NA NA 0.0965 0.1025
194194

INFRASTRUCTURE & GROWTH MANAGEMENTFACILITIES & TRANSIT
2014 2015 2015 2016 2017 2018ACTUAL BUDGET FORECAST BUDGET FORECAST FORECAST
EXPENSESSalaries 2,893,604 3,191,399 3,071,913 3,334,935 3,381,761 3,433,417 Fringe Benefits 706,066 648,250 709,673 743,688 754,846 766,240 Total Salaries and Benefits 3,599,670 3,839,649 3,781,586 4,078,623 4,136,607 4,199,657 OPERATING EXPENSESGeneral Operations 20,804,898 22,746,040 22,007,163 23,606,638 24,519,622 24,961,854 Minor Capital 146,753 423,000 467,903 494,000 492,820 507,377 Hydro, Water, Sewer, Gas 1,967,875 2,145,353 1,988,480 2,282,374 2,390,980 2,506,773 Transfers to other Boards, Municipalities, Agencies - - - - - - Total Operating Expenses before Debenture Costs and Transfers 22,919,526 25,314,393 24,463,546 26,383,012 27,403,422 27,976,004
DEBENTURE COSTS AND TRANSFERSLease Equipment/Property 1,474,787 1,334,332 1,327,164 1,340,036 1,350,554 1,359,274 Financial Expenses 54,268 45,000 53,439 13,147 13,410 13,678 Transfer to/from User Rate Reserve Funds - - - - - - Transfer to Reserves 136,274 161,794 243,187 183,504 251,776 275,999 Transfer to Capital Fund - - - - - - Total Debenture Costs and Transfers 1,665,329 1,541,126 1,623,790 1,536,687 1,615,740 1,648,951 Gross Expenditures 28,184,525 30,695,168 29,868,922 31,998,322 33,155,769 33,824,612 Revenues Other Government Funding (144,611) (206,323) (159,466) (171,209) (171,599) (171,997) Contribution from Reserves/Reserve Funds (2,374,755) (2,653,200) (2,564,246) (2,629,200) (2,049,250) (2,219,290) Licences, Permits, Application Fees (248,869) (254,533) (174,679) (175,206) (177,241) (179,286) Fines - - - - - - Fees, Charges, Service Rentals (6,159,237) (7,043,580) (6,283,635) (7,060,626) (7,362,053) (7,599,038) Other Revenue (8,059,382) (8,650,903) (8,476,622) (8,721,536) (8,936,154) (9,097,105) Total Revenues (16,986,854) (18,808,539) (17,658,648) (18,757,777) (18,696,297) (19,266,716) Net Operating Expense/(Revenue) 11,197,671 11,886,629 12,210,274 13,240,545 14,459,472 14,557,896
CITY OF BARRIE2016 OPERATING BUDGET
EXPENDITURES
195195

2014 2015 2015 2016 Service 2016Actual Approved Forecasted Base Level Requested
Expenditures Budget Expenditure Budget Change(s) Budget$ $ $ $ $ $ $ % $ % Comments
EXPENSESSalaries 2,893,604 3,191,399 3,071,913 3,334,935 139,586 3,474,521 143,536 4% 283,122 9% Largely a result of annualization of 2015
approved service level changes for $220K, remainder due to annual merit and salary increases.
Fringe Benefits 706,066 648,250 709,673 743,688 32,846 776,534 95,438 15% 128,284 20% Mostly a result of annualization of 2015 approved service Level changes and annual increases.
Total Salaries and Benefits 3,599,670 3,839,649 3,781,586 4,078,623 172,432 4,251,055 238,974 6% 411,406 11%OPERATING EXPENSESGeneral Operations 20,804,898 22,746,040 22,007,163 23,606,638 (47,000) 23,559,638 860,598 4% 813,598 4% Mostly annualization and inflation of new
transit P3 contract ($630K and $325Krespectivley), offset by a reduction to facility operations maintenance & contracted services as well as removal of one-time operating projects from 2015
Minor Capital 146,753 423,000 467,903 494,000 - 494,000 71,000 17% 71,000 17% Increase based on historical spending over the last three years for minor space accommodation projects across the corporation and for the replacement of specialized furniture.
Hydro, Water, Sewer, Gas 1,967,875 2,145,353 1,988,480 2,282,374 - 2,282,374 137,021 6% 137,021 6% Budget increase is a result of utility rate increases (+$110K) and adjustments (+$112K) to account for new facilities (i.e.. Transit Garage +$176K) or changes in facility usage (i.e.. Police Auxiliary Building -$75K, Ops. Centre washbay +$15K). Decreases in consumption, driven by energy conservation, account for a cost avoidance of -$85K. Electricity rates are estimated to increase 8.5%, natural gas rates are estimated to increase 0.8% and water rates are estimated to increase 2.2%.
Transfers to other Boards, Municipalities, Agencies - - - - - - - 0% - 0%Total Operating Expenses before Debenture Costs and Transfers 22,919,526 25,314,393 24,463,546 26,383,012 (47,000) 26,336,012 1,068,619 4% 1,021,619 4%
DEBENTURE COSTS AND TRANSFERSLease Equipment/Property 1,474,787 1,334,332 1,327,164 1,340,036 - 1,340,036 5,704 0% 5,704 0%Financial Expenses 54,268 45,000 53,439 13,147 - 13,147 (31,853) -71% (31,853) -71% Mostly due to annulaization impact of the
2015 service level change to internalize tickets sales; no longer required to pay commissions to third party for ticket sales
Transfer to/from User Rate Reserve Funds - - - - - - - 0% - 0%Transfer to Reserves 136,274 161,794 243,187 183,504 - 183,504 21,710 13% 21,710 13% increase in transfers to marina reserve as a
result of 5% increased feesTransfer to Capital Fund - - - - - - - 0% - 0%Total Debenture Costs and Transfers 1,665,329 1,541,126 1,623,790 1,536,687 - 1,536,687 (4,439) 0% (4,439) 0%Gross Expenditures 28,184,525 30,695,168 29,868,922 31,998,322 125,432 32,123,754 1,303,154 4% 1,428,586 5% Revenues Other Government Funding (144,611) (206,323) (159,466) (171,209) - (171,209) 35,114 -17% 35,114 -17% A result of a reduction in Essa Borden
revenue as a result of planned decrease in cost with new contract. The Essa Borden Service has a net zero impact to the City of Barrie.
Contribution from Reserves/Reserve Funds (2,374,755) (2,653,200) (2,564,246) (2,629,200) - (2,629,200) 24,000 -1% 24,000 -1% Licences, Permits, Application Fees (248,869) (254,533) (174,679) (175,206) - (175,206) 79,327 -31% 79,327 -31% Largely due to lost rental revenue at transit
terminal Fines - - - - - - - 0% - 0% Fees, Charges, Service Rentals (6,159,237) (7,043,580) (6,283,635) (7,060,626) - (7,060,626) (17,046) 0% (17,046) 0% Other Revenue (8,059,382) (8,650,903) (8,476,622) (8,721,536) (20,630) (8,742,166) (70,633) 1% (91,263) 1% Total Revenues (16,986,854) (18,808,539) (17,658,648) (18,757,777) (20,630) (18,778,407) 50,762 0% 30,132 0% Net Operating Expense/(Revenue) 11,197,671 11,886,629 12,210,274 13,240,545 104,802 13,345,347 1,353,916 11% 1,458,718 12%
INFRASTRUCTURE AND GROWTH MANAGEMENT DIVISIONFacilities and Transit Department2016 Base Budget Change Report
Change in 2016 Change in 2016Base Budget Requested Budget
to 2015 Approved Budget to 2015 Approved Budget
196196

Director of Planning ServicesStephen Naylor
Manager of DevelopmentTami Kitay
Manager of Policy PlanningMerwan Kalyaniwalla
Office Coordinator IISharon Starr
Office ServicesAssistant
(2)
Infrastructure and Growth Management DivisionPlanning Services Department
Supervisor of GrowthManagementEric Hodgins
197197

Performance Plan 2016
Department:
Departmental Overview
Planning
The Planning Services Department is comprised of three technical branches: Development; Policy; and Growth Management. The Department's mission is to guide the growth and development of Barrie towards a vibrant, livable and resilient community through development of a strong policy framework for land use decision making and development review services. The three Branches work together to implement provincial policies, initiate addressing corporate strategic objectives and apply best practices in land use planning, guiding development and growth with full support from professional and technical staff, zoning administration, agreements officer and administrative and office support staff. Feedback and interaction with a variety of other Departments within the organization and gained through public consultation are key to realizing Council and corporate directions, many of which are initiated and commenced through the planning process.
Development Branch
The Development Branch comprises approximately 50% of the Department's resources to perform the following main functions and services:
� Review, analyze and report on Development Applications including Official Plan and Zoning By-law Amendments, Plans of Subdivision and Condominium, and Site Plan Approval.
� Co-ordinates Ward (Neighborhood) Meetings. � Co-ordinate the City's review of development and site plan pre-consultation applications. � Manage the Site Plan review process, including processing of all Site Plan Applications,
coordinating Departmental and Agency comments, preparation of conditions and review of Site Plan Agreements.
� Provide administration support, including Secretary-Treasurer function, to the Committee of Adjustment.
� Provide planning and zoning comments on all Development Applications, including consents and minor variances to the Committee of Adjustment.
� Provide Zoning By-law review, approvals and interpretation for development applications, Zoning Certificates, Compliance Letters, Secondary Suites and Liquor Licenses.
� Record, monitor and report on development activity throughout the City of Barrie. � Administers on-going survey on Development Review process within the City, and undertakes
enhancements to improve process as a result of survey indicators. � Provide expert testimony before the Ontario Municipal Board on a broad range of planning issues. � Leads public consultation meetings for development applications. � Supports Customer Service enquiries.
Policy Planning Branch
The Policy Planning Branch comprises approximately 35% of the Department's resources to perform the following main services:
� Coordinate and prepare master planning documents such as the City's Official Plan and Zoning By-law.
� Prepare special studies and reviews related to specific planning issues such as Affordable Housing, Intensification, Natural Heritage, Brownfields and Employment Land Conversion.
� Monitor and up-date policy documents. � Liaise with senior levels of government and service partners to ensure conformity with upper tier
198198

documents and to co-ordinate policy development. � Prepare, review and analyze population and demographic information related to long range
planning, economic development, finance and strategic planning. � Provide expert testimony before the Ontario Municipal Board on policy documents. � Develop and maintain policies that support Council's strategic priorities and ensure the orderly and
planned development of the City. � Technical services (non - GIS) and statistical information to support the functions of the Planning
Department and other City Departments. � Electronic recording and circulation of Site Plan Applications. � Prepare exhibits and gather data for Ontario Municipal Board Hearings. � Maintain internal and external website for the Planning Services Department. � Make presentations to Council, special interest groups and the public on specific policy initiatives. � Administers street naming function for the Municipality.
Growth Management Branch
The Growth Management Branch comprises 15% of the Department's resources to perform the following main services:
� Ensure that growth is managed in accordance with Provincial Policy and the City's planning documents.
� Oversee the implementation of a comprehensive approach to land use, infrastructure and financial planning as identified in the Memorandum of Understanding (MOU) with landowners in the Annexed Lands.
� Coordinate the implementation of the plans for the Annexed Lands including amendments thereto. � Coordinates the growth management process for the annexed lands in relation to the City's
Financial and Infrastructure Master Plans. � Review and approve preliminary proposals for the Annexed Lands prior to formal submission to
ensure consistency with the City's framework for growth including related plans and strategies. � Liaise with Council, Senior Management and City Staff regarding growth management and the
implementation of plans for the Annexed Lands. � Coordinates the analysis of data related to growth and reporting on same. � Oversees the preparation, monitoring and updating of planning instruments for the Annexed Lands
including zoning and Urban Design guidelines. � Conduct and/or directs growth management related research. � Provide expert testimony, or arrange for same, before the Ontario Municipal Board with respect to
appeals involving the Annexed Lands. � Liaise with landowners, developers, consultants and the City's public sector partners regarding the
implementation of the plans for the Annexed Lands.
Key Departmental ObjectivesProviding for the balanced growth and development of the City of Barrie through clear, comprehensive, and sound implementation of land use planning policies and principles by:
� Completing timely reviews and well thought out recommendations on private development applications that are consistent with the City's long range plans and urban design objectives.
� Accommodating population growth and making wise use of existing infrastructure and amenities while creating complete neighbourhoods and reducing reliance on the automobile.
� Protecting and enhancing the City's Natural Heritage features and reducing climatic and environmental impacts while improving the "greening" of the City.
� Creation of new policies, and review of existing policies, to address emerging issues and identifying trends that affect the livability of the City including affordable housing, safety, job creation, fiscal responsibility and access to services and amenities.
� Ensure that the public is engaged in the creation of new strategic initiatives and local development projects.
Strategic Plan & Other Program Deliverables� Continue to deliver on the core business throughout 2016 in the context of senior government policy
initiatives and The Planning Act.� Continue to support growth management initiatives such as the completion of the Urban Design
Guidelines and Zoning By-law and processing and review of the initial draft plans of subdivision for
199199

the annexed lands. � Focus on initiatives that contribute to creating a vibrant and healthy City Centre through timely
processing of development application approvals and new policy development. � Promote appropriate intensification projects to address density targets.
Major Initiatives/Issues� Preparation of a new Official Plan � Continued implementation of the Affordable Housing Strategies � Initiation of the Essa Road Intensification Review � Begin the receipt and processing of the first development applications within the Annexation Area � Initiate the comprehensive reporting of development progression, timing of infrastructure construction
and financing related to development within the City, including the Annexation Area � Recommend a new structure for Community Improvement Plans to offer incentives to key objectives
like affordable housing, brownfields and intensification. � Implement enhancements as determined necessary to the development review and public
consultation process, including ward meeting system. � Encourage the development community to continue to strive for the highest quality developments for
the City.Key Performance Indicators
Well considered and timely approvals and recommendations on private development applications.Indicator 2014 Actual 2015 Plan 2015 Projected 2016 Plan
Average number or working days for issuance of draft site plan approval conditions (days)
N/A 60 70 50
Percentage of Planning Applications meeting Planning Act timeframes (OPA, ZBA, Subdivision/Condominium)
N/A 95 80 90
Accommodating population growth and making wise use of existing infrastructure and amenities while creating complete neighbourhoods and reducing reliance on the automobile.
Indicator 2014 Actual 2015 Plan 2015 Projected 2016 PlanNumber of development applications approved that incorporate denser residential and/or mixed use development in the Intensification Areas
N/A 6 3 5
Percent of site plan applications approved that incorporate improved streetscape, including street oriented buildings and boulevard amenities such as gardens, patios, benches and bicycle racks.
N/A 80 75 90
Protecting and enhancing the City's Natural Heritage features and reducing climatic and environmental impacts while improving the "greening" of the City.
Indicator 2014 Actual 2015 Plan 2015 Projected 2016 PlanAmount of Environmental Protection and Open Space land designated and/or dedicated to the City through development applications (ha)
N/A N/A N/A 4
Creation of new policies and review of existing policies to address emerging issues and identifying trends that affect the livability of the City including, affordable housing, safety, job creation, fiscal responsibility and access to services and amenities.
Indicator 2014 Actual 2015 Plan 2015 Projected 2016 PlanNumber of new policies, amendments to N/A 4 7 5
200200

Planning documents and/or special studies approved by Council.
Ensure that the public is engaged in the creation of new strategic initiatives and local development projects.Indicator 2014 Actual 2015 Plan 2015 Projected 2016 Plan
Number of Open Houses/Ward Meetings Held for Policy Planning Projects
N/A 2 6 10
Number of Ward Meetings Held for Development Applications
2 13 13 15
Number of Land Owners and/or Residents Attending Policy Open Houses/ Ward Meetings and/or Development Application Ward Meetings
N/A 300 450 600
Number of Special Interest Group Presentations (i.e. BILD)
N/A 2 4 6
Provision of a wider diversity of housing types and increased "affordability".Indicator 2014 Actual 2015 Plan 2015 Projected 2016 Plan
Number of New Housing Units Included in Approved Development Proposals that Meet City's Definition of Affordable (Rental and Ownership)
N/A N/A N/A 100
Number of Second Suite Zoning Certificates Issued by the Planning Services Department
N/A N/A 60 100
Percentage of Low, Medium and High Density Housing Units Approved through Development Proposals
N/A N/A N/A 60/30/10
Percentage of Ownership and Rental Units Approved through Development Proposals
N/A N/A N/A 75/25
201201

INFRASTRUCTURE & GROWTH MANAGEMENTPLANNING
2014 2015 2015 2016 2017 2018ACTUAL BUDGET FORECAST BUDGET FORECAST FORECAST
EXPENSESSalaries 1,313,619 1,357,101 1,128,513 1,460,618 1,482,802 1,505,312 Fringe Benefits 315,840 305,541 305,542 357,617 362,981 368,426 Total Salaries and Benefits 1,629,459 1,662,642 1,434,055 1,818,235 1,845,783 1,873,738 OPERATING EXPENSESGeneral Operations 173,335 329,620 412,510 169,442 66,050 67,700 Minor Capital 687 1,000 - 500 500 500 Hydro, Water, Sewer, Gas - - - - - - Transfers to other Boards, Municipalities, Agencies - - - - - - Total Operating Expenses before Debenture Costs and Transfers 174,022 330,620 412,510 169,942 66,550 68,200 DEBENTURE COSTS AND TRANSFERSLease Equipment/Property 280 300 420 420 450 450 Financial Expenses 241 500 247 250 300 350 Transfer to/from User Rate Reserve Funds - - - - - - Transfer to Reserves 143,690 375,531 375,531 413,000 413,000 413,000 Transfer to Capital Fund - - - - - - Total Debenture Costs and Transfers 144,211 376,331 376,198 413,670 413,750 413,800 Gross Expenditures 1,947,692 2,369,593 2,222,763 2,401,847 2,326,083 2,355,738 Revenues Other Government Funding - - - - - - Contribution from Reserves/Reserve Funds - (168,750) (16,875) (175,244) (109,040) (110,355) Licences, Permits, Application Fees (117,746) (150,766) (104,530) (126,000) (126,500) (127,000) Fines - - - - - - Fees, Charges, Service Rentals (427,398) (798,208) (405,719) (932,559) (946,239) (958,039) Other Revenue (53,725) (8,900) (2,781) (2,500) (2,600) (2,700) Total Revenues (598,869) (1,126,624) (529,905) (1,236,303) (1,184,379) (1,198,094) Net Operating Expense/(Revenue) 1,348,823 1,242,969 1,692,858 1,165,544 1,141,704 1,157,644
CITY OF BARRIE2016 OPERATING BUDGET
EXPENDITURES
202202

2014 2015 2015 2016 Service 2016Actual Approved Forecasted Base Level Requested
Expenditures Budget Expenditure Budget Change(s) Budget$ $ $ $ $ $ $ % $ % Comments
EXPENSESSalaries 1,313,619 1,357,101 1,128,513 1,460,618 - 1,460,618 103,517 8% 103,517 8% The increase is as a result of the transfer of
one FTE from the office of the General Manager of Infrastructure and Growth Management to Planning to build capacity for when the annexation lands begin to come on stream.
Fringe Benefits 315,840 305,541 305,542 357,617 - 357,617 52,076 17% 52,076 17%Total Salaries and Benefits 1,629,459 1,662,642 1,434,055 1,818,235 - 1,818,235 155,593 9% 155,593 9%OPERATING EXPENSESGeneral Operations 173,335 329,620 412,510 169,442 - 169,442 (160,178) -49% (160,178) -49% Monies budgeted in 2015 for the new
Official Plan are not required again in 2016.
Minor Capital 687 1,000 - 500 - 500 (500) -50% (500) -50%Hydro, Water, Sewer, Gas - - - - - - - 0% - 0%Transfers to other Boards, Municipalities, Agencies - - - - - - - 0% - 0%Total Operating Expenses before Debenture Costs and Transfers 174,022 330,620 412,510 169,942 - 169,942 (160,678) -49% (160,678) -49%
DEBENTURE COSTS AND TRANSFERSLease Equipment/Property 280 300 420 420 - 420 120 40% 120 40%Financial Expenses 241 500 247 250 - 250 (250) -50% (250) -50%Transfer to/from User Rate Reserve Funds - - - - - - - 0% - 0%Transfer to Reserves 143,690 375,531 375,531 413,000 - 413,000 37,469 10% 37,469 10%Transfer to Capital Fund - - - - - - - 0% - 0%Total Debenture Costs and Transfers 144,211 376,331 376,198 413,670 - 413,670 37,339 10% 37,339 10%Gross Expenditures 1,947,692 2,369,593 2,222,763 2,401,847 - 2,401,847 32,254 1% 32,254 1% Revenues Other Government Funding - - - - - - - 0% - 0% Contribution from Reserves/Reserve Funds - (168,750) (16,875) (175,244) - (175,244) (6,494) 4% (6,494) 4% Licences, Permits, Application Fees (117,746) (150,766) (104,530) (126,000) - (126,000) 24,766 -16% 24,766 -16% Committee of Adjustment revenues are
anticipated to be lower in 2016 based upon trending.
Fines - - - - - - - 0% - 0% Fees, Charges, Service Rentals (427,398) (798,208) (405,719) (932,559) - (932,559) (134,351) 17% (134,351) 17% Fees are based upon 5 year average in built
boundary plus anticipated applications in annexation lands in 2016.
Other Revenue (53,725) (8,900) (2,781) (2,500) - (2,500) 6,400 -72% 6,400 -72% Total Revenues (598,869) (1,126,624) (529,905) (1,236,303) - (1,236,303) (109,679) 10% (109,679) 10% Net Operating Expense/(Revenue) 1,348,823 1,242,969 1,692,858 1,165,544 - 1,165,544 (77,425) -6% (77,425) -6%
INFRASTRUCTURE AND GROWTH MANAGEMENT DIVISIONPlanning Services Department
2016 Base Budget Change Report
to 2015 Approved Budget to 2015 Approved Budget
Change in 2016 Change in 2016Base Budget Requested Budget
203203

Director of Roads, Parks and FleetDave Friary
Manager of Roads and ParksOperationsCraig Morton
Manager of Fleet ServicesBrian Pirie
Roads OperationsSupervisor
Wayne Watson
Supervisor of ParksOperations
Kevin Rankin (Interim)
Fleet Services ForepersonDaryl Watson
Technical OperationsSupervisor
Geoff Mitchinson
Coordinator of Vehicleand Equipment
TrainingDon Nelson
Office Coordinator IKerry Buckley
Office ServicesAssistant
(2)
Operations SupportAdministrator (Fleet)
Forestry SupervisorKevin Rankin
Manager of Traffic and ParkingServices
Steve Rose
Supervisor of TrafficServices
Tom Hanrahan
Infrastructure and Growth Management DivisionRoads, Parks and Fleet Department
204204
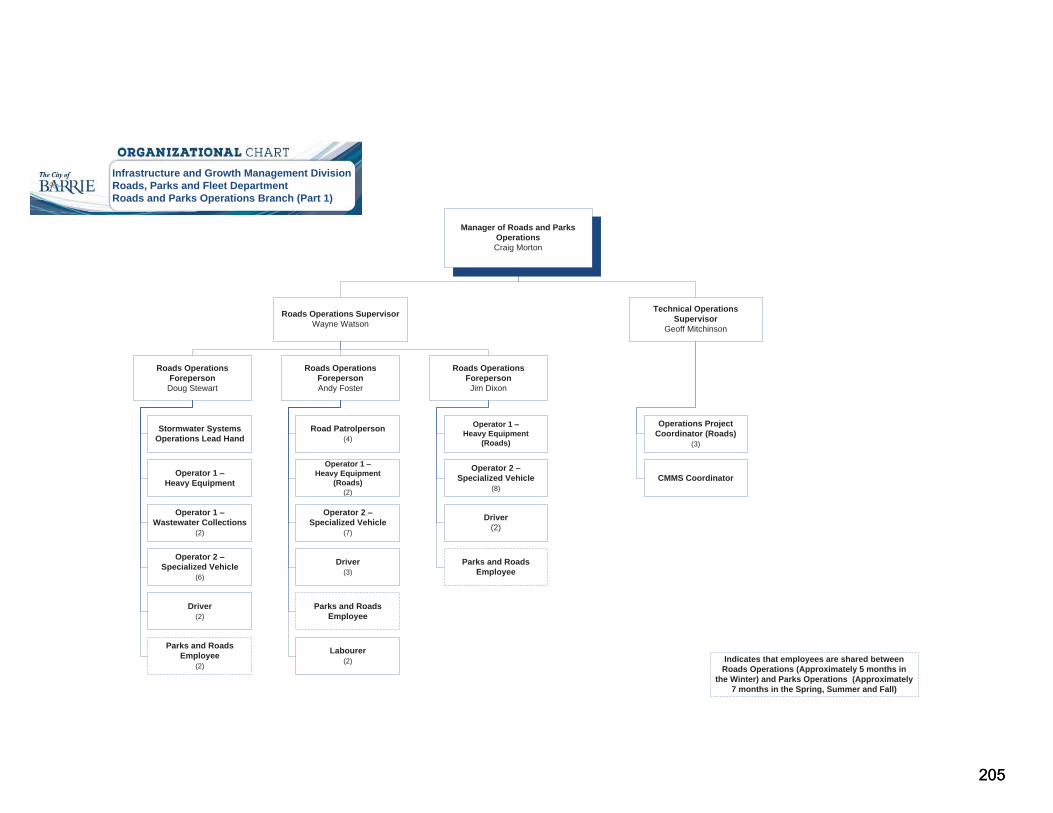
Manager of Roads and ParksOperationsCraig Morton
Roads Operations SupervisorWayne Watson
Roads OperationsForeperson
Doug Stewart
Technical OperationsSupervisor
Geoff Mitchinson
Operations ProjectCoordinator (Roads)
(3)
CMMS Coordinator
Stormwater SystemsOperations Lead Hand
Roads OperationsForepersonAndy Foster
Roads OperationsForeperson
Jim Dixon
Operator 1 –Heavy Equipment
Operator 1 –Wastewater Collections
(2)
Operator 2 –Specialized Vehicle
(6)
Driver(2)
Road Patrolperson(4)
Operator 1 –Heavy Equipment
(Roads)(2)
Operator 2 –Specialized Vehicle
(7)
Driver(3)
Parks and RoadsEmployee
Labourer(2)
Operator 1 –Heavy Equipment
(Roads)
Operator 2 –Specialized Vehicle
(8)
Driver(2)
Indicates that employees are shared betweenRoads Operations (Approximately 5 months in
the Winter) and Parks Operations (Approximately7 months in the Spring, Summer and Fall)
Infrastructure and Growth Management DivisionRoads, Parks and Fleet DepartmentRoads and Parks Operations Branch (Part 1)
Parks and RoadsEmployee
Parks and RoadsEmployee
(2)
205205

Manager of Roads and ParksOperationsCraig Morton
Supervisor of ParksOperations
Kevin Rankin (Interim)
Forestry SupervisorKevin Rankin
Parks HorticultureCoordinator
Parks ForepersonBrent Mosley
Forestry ForepersonJamie Rodgers
Gardener
Grower
Parks MaintenanceCoordinator
General MaintenanceEmployee 1
(3)
General MaintenanceEmployee 2
Parks and RoadsEmployee
(2)
Parks and ForestryTechnician
ForestryJourneyperson 1
(2)
ForestryJourneyperson 2
(2)
Indicates that employees are shared betweenRoads Operations (Approximately 5 months in
the Winter) and Parks Operations (Approximately7 months in the Spring, Summer and Fall)
Infrastructure and Growth Management DivisionRoads, Parks and Fleet DepartmentRoads and Parks Operations Branch (Part 2)
Parks and RoadsEmployee
(2)
206206

Manager of Fleet ServicesBrian Pirie
Fleet Services ForepersonDaryl Watson
Fleet ServicesTechnician
(8)
Technician’s Assistant(2)
Coordinator of Vehicleand Equipment
TrainingDon Nelson
Fleet Services DutyTechnician
Infrastructure and Growth Management DivisionRoads, Parks and Fleet DepartmentFleet Services Branch
207207

Manager of Traffic and ParkingServices
Steve Rose
Supervisor of TrafficServices
Tom Hanrahan
Traffic SystemsOperator
(5)
Traffic Tradesperson
Traffic ServicesCoordinator
Parking and TransitControl Coordinator
(2)
Parking and TransitControl Technician
Senior TransportationTechnologist
(2)
TransportationTechnologist
TransportationTechnician
Infrastructure and Growth Management DivisionRoads, Parks and Fleet DepartmentTraffic and Parking Services Branch
208208

Performance Plan 2016
Department:
Departmental Overview
Roads, Parks and Fleet
In 2011 the Operations Department was divided into two harmonious Departments: Environmental Services Department and Roads Parks and Fleet Department by implementing the Council's approved Business Plan.
The Roads, Parks and Fleet Department is comprised of two Branches, including the Roads and Parks Operations Branch and the Fleet Services Branch.
Key responsibilities include the operation and maintenance of the City’s public works infrastructure and systems including roadways; storm drainage systems; winter control; parks and green spaces; and the corporation’s fleet of vehicles and equipment.
Roads and Parks Operations
The Roads and Parks Operations Branch requires approximately 67% of the Department's financial resources and 68% of the Department's staff resources to perform the following services: road surface maintenance including winter control; roads and sidewalk repairs; catch basin cleaning and repairs; watercourses maintenance, including channel and structure repairs and storm water management facility maintenance; sanitary sewer repairs; flushing and inspections; parks and green space maintenance, including sports fields, playground equipment, inspection and maintenance; horticultural services such as floral displays, greenhouse/gardens and Community in Blooms program; Forestry – Urban Forestry/planning, inspection, removal, and maintenance of trees on City property.
Fleet Services
The Fleet Services Branch requires approximately 15% of the Department's financial resources and 15% of the Department's staff resources to perform the following services: purchase and disposal of all City of Barrie motorized equipment; maintenance and repair to all City vehicles and equipment; provide vehicle and equipment operator training programs; to ensure all City equipment is safe and compliant with all government regulations (CVOR, Drive Clean, Highway Traffic Act, etc.).
Traffic & Parking Services
The Traffic & Parking Services branch requires approximately 17% of the Departments financial resources and 15% of the Departments staff resources to perform the following services;Traffic Operations Planning and Review – Traffic administration, streetlighting, roadway traffic signage, project signing, traffic control signals, pavement markings and guide rails, railway crossing maintenance, – Parking planning administration, maintenance and collection and transit fare collection and maintenance. Parking lots, parking lot snow clearing and paid parking operations (Meters)
Administration
The Administration branch consists of the Director or Roads, Parks and Fleet and the Office Coordinator I, requiring approximately 1% of the Departments financial resources and 2% of the Departments staff resources.
Key Departmental Objectives Provide the City of Barrie's operating and maintenance of municipal infrastructure for:
� Deliver quality operation and maintenance activities for roads, sidewalks, wastewater collection, storm water, traffic controls, street lighting, parking, ROWA ,urban forestry, parks and open spaces;
209209

� Maintain and manage City of Barrie's corporate fleet and equipment.� Timely review of land development applications.
Strategic Plan & Other Program DeliverablesMeet service level standards (LOS) prescribed by City Council.
� Comply with legislation; Occupational Health and Safety Act, OWRA, SDWA, EPA, EAA, OBCA, OHTSA, Municipal Act.
� Meet or exceed regulatory compliance with Provincial/Federal legislation.Major Initiatives/IssuesDevelop/promote effective Public Communications Programs.
� Validate and monitor customer satisfaction. � Adjust expenditures/ revenues to maintain targets. � Ongoing review of processes to improve efficiencies. � Track details of non-compliance incidents. � Provide vehicle and equipment training; including communicating number of incidents with staff. � Develop a framework for SOP/SOG training. Use this framework to train staff on SOP/SOGs. � Improve percentage of preventative maintenance (employ CMMS/OPUS/City Works functionality).� Transportation/Traffic Management including traffic signal optimizations and traffic calming initiatives
Key Performance Indicators
Indicator 2014 Actual 2015 Plan 2015 Projected 2016 PlanMaintain and manage City of Barrie's Corporate fleet and equipment:
� Accidents/incidents per year involving City equipment
35 35 33 20
Traffic Signal Timing Review 44 45 50 45Traffic Collisions per Population 37 40 42Traffic Collisions per Lane KM 2.89 2.75 2.7Well Planned Transportation - Safer Roads
Winter Control Service Level Compliance (to Municipal Act regulations)
96% 95% 98% 95%
210210

INFRASTRUCTURE & GROWTH MANAGEMENTROADS, PARKS, AND FLEET - TAX RATE BASED ONLY
2014 2015 2015 2016 2017 2018ACTUAL BUDGET FORECAST BUDGET FORECAST FORECAST
EXPENSESSalaries 7,996,118 8,646,695 8,280,041 9,167,950 9,304,450 9,442,739 Fringe Benefits 1,775,642 1,743,299 1,654,070 2,043,542 2,074,195 2,105,308 Total Salaries and Benefits 9,771,760 10,389,994 9,934,111 11,211,492 11,378,645 11,548,047 OPERATING EXPENSESGeneral Operations 14,905,288 13,947,481 14,293,126 14,981,244 15,206,120 15,317,279 Minor Capital 344,780 670,100 575,516 725,100 739,100 740,100 Hydro, Water, Sewer, Gas 1,590,000 1,881,965 1,530,219 1,184,137 1,235,664 1,290,574 Transfers to other Boards, Municipalities, Agencies - - - - - - Total Operating Expenses before Debenture Costs and Transfers 16,840,068 16,499,546 16,398,861 16,890,481 17,180,884 17,347,953 DEBENTURE COSTS AND TRANSFERSLease Equipment/Property 902,791 1,040,538 1,063,890 1,047,979 1,071,603 1,094,424 Financial Expenses 1,603 1,440 1,405 1,440 1,500 1,550 Transfer to/from User Rate Reserve Funds - - - - - - Transfer to Reserves - - - - - - Transfer to Capital Fund - - - - - - Total Debenture Costs and Transfers 904,394 1,041,978 1,065,295 1,049,419 1,073,103 1,095,974 Gross Expenditures 27,516,222 27,931,518 27,398,267 29,151,392 29,632,632 29,991,974 Revenues Other Government Funding (20,000) (30,000) (21,031) (30,000) (30,000) (30,000) Contribution from Reserves/Reserve Funds (1,239,940) (2,325,000) (2,350,914) (2,775,000) (2,760,000) (2,760,000) Licences, Permits, Application Fees (133,859) (88,072) (33,791) (88,072) (88,072) (88,072) Fines - - - - - - Fees, Charges, Service Rentals (2,336) (4,300) (9,944) (4,300) (4,800) (5,800) Other Revenue (1,271,149) (920,993) (972,575) (840,773) (838,141) (843,268) Total Revenues (2,667,284) (3,368,365) (3,388,255) (3,738,145) (3,721,013) (3,727,140) Net Operating Expense/(Revenue) 24,848,938 24,563,153 24,010,012 25,413,247 25,911,619 26,264,834
CITY OF BARRIE2016 OPERATING BUDGET
EXPENDITURES
211211

2014 2015 2015 2016 Service 2016Actual Approved Forecasted Base Level Requested
Expenditures Budget Expenditure Budget Change(s) Budget$ $ $ $ $ $ $ % $ % Comments
EXPENSESSalaries 7,996,118 8,646,695 8,280,041 9,167,950 50,440 9,218,390 521,255 6% 571,695 7% Employee compensation costs provide for
modest cost of living provisions and merit increases for full time CUPE and non-union employees. Right Sizing Operations intake form 2015, annualization of $452K.
Fringe Benefits 1,775,642 1,743,299 1,654,070 2,043,542 11,915 2,055,457 300,243 17% 312,158 18%Total Salary and Benefits 9,771,760 10,389,994 9,934,111 11,211,492 62,355 11,273,847 821,498 8% 883,853 9%OPERATING EXPENSESGeneral Operations 14,905,288 13,947,481 14,293,126 14,981,244 1,100 14,982,344 1,033,763 7% 1,034,863 7% Contractual increases for services and
supplies related to Winter Control, Traffic System Maintenance and Storm System Maintenance. Street lighting contracted services reduction of $228K due to the installation of LED Streetlights. Increase of $482K for Rail Operations due to escalating costs for the operator and decreasing revenue. Increase of $500K to the Roads Lifecycle Maintenance Program.
Minor Capital 344,780 670,100 575,516 725,100 - 725,100 55,000 8% 55,000 8% Increase in Emerald Ash Borer Management Program (removal and replacement of trees) for 2016 of $87K for Year 2 Phase 2.
Hydro, Water, Sewer, Gas 1,590,000 1,881,965 1,530,219 1,184,137 - 1,184,137 (697,828) -37% (697,828) -37% Decrease in budget is a result of consumption reduction realized from LED Street Lighting retrofit project which generated a cost avoidance of $721K. Electricity rates are estimated to increase 8.5%, natural gas rates are estimated to increase 0.8% and water rates are estimated to increase 2.2%.
Transfers to other Boards, Municipalities, Agencies - - - - - - - 0% - 0%Total Operating Expenses before Debenture Costs and Transfers 16,840,068 16,499,546 16,398,861 16,890,481 1,100 16,891,581 390,935 2% 392,035 2%
DEBENTURE COSTS AND TRANSFERSLease Equipment/Property 902,791 1,040,538 1,063,890 1,047,979 - 1,047,979 7,441 1% 7,441 1%Financial Expenses 1,603 1,440 1,405 1,440 - 1,440 - 0% - 0%Transfer to/from User Rate Reserve Funds - - - - - - - 0% - 0%Transfer to Reserves - - - - - - - 0% - 0%Transfer to Capital Fund - - - - - - - 0% - 0%Total Debenture Costs and Transfers 904,394 1,041,978 1,065,295 1,049,419 - 1,049,419 7,441 1% 7,441 1%Gross Expenditures 27,516,222 27,931,518 27,398,267 29,151,392 63,455 29,214,847 1,219,874 4% 1,283,329 5% Revenues Other Government Funding (20,000) (30,000) (21,031) (30,000) - (30,000) - 0% - 0% Contribution from Reserves/Reserve Funds (1,239,940) (2,325,000) (2,350,914) (2,775,000) - (2,775,000) (450,000) 19% (450,000) 19% Reduction in funding to align with the
reduction in the contracted cost of Tree Maintenance. Federal Gas Tax Reserve allocation increased $500K for the Roads Lifecycle Maintenance Program.
Licences, Permits, Application Fees (133,859) (88,072) (33,791) (88,072) - (88,072) - 0% - 0% Fines - - - - - - - 0% - 0% Fees, Charges, Service Rentals (2,336) (4,300) (9,944) (4,300) - (4,300) - 0% - 0% Other Revenue (1,271,149) (920,993) (972,575) (840,773) - (840,773) 80,220 -9% 80,220 -9% Elimination of $126K of funding from
Parking to Roads Operations for winter snow lifts. Increase of $75K related to internal recovery from Water Branch for Pavement Degradation fees. Reduced internal transfer of $80K to Fleet Maintenance from rate operations due to vehicle replacements.
Total Revenues (2,667,284) (3,368,365) (3,388,255) (3,738,145) - (3,738,145) (369,780) 11% (369,780) 11% Net Operating Expense/(Revenue) 24,848,938 24,563,153 24,010,012 25,413,247 63,455 25,476,702 850,094 3% 913,549 4%
to 2015 Approved Budget to 2015 Approved Budget
2016 Base Budget Change ReportTax Rate Based Only
INFRASTRUCTURE AND GROWTH MANAGEMENT DIVISIONRoads, Parks and Fleet Department
Change in 2016 Change in 2016Base Budget Requested Budget
212212

GENERAL GOVERNMENTOTHER EXPENSES
2014 2015 2015 2016 2017 2018ACTUAL BUDGET FORECAST BUDGET FORECAST FORECAST
EXPENSESSalaries 145,275 (1,282,000) (12,111) (800,000) (800,000) (800,000) Fringe Benefits 513,506 - 95,318 - - - Total Salaries and Benefits 658,781 (1,282,000) 83,207 (800,000) (800,000) (800,000) OPERATING EXPENSESGeneral Operations 4,014,026 4,440,492 4,159,026 3,905,255 3,822,996 3,840,914 Minor Capital - - - - - - Hydro, Water, Sewer, Gas - - - - - - Transfers to other Boards, Municipalities, Agencies - - - - - - Total Operating Expenses before Debenture Costs and Transfers 4,014,026 4,440,492 4,159,026 3,905,255 3,822,996 3,840,914 DEBENTURE COSTS AND TRANSFERSLease Equipment/Property 1,393,101 1,345,680 1,319,226 1,371,484 1,406,106 1,441,744 Financial Expenses 24,776,252 25,528,467 23,913,262 26,686,755 28,627,883 28,622,065 Transfer to/from User Rate Reserve Funds - - - - - - Transfer to Reserves 19,188,622 24,755,082 24,755,082 28,058,540 31,456,540 34,854,540 Transfer to Capital Fund - - - - - - Total Debenture Costs and Transfers 45,357,975 51,629,229 49,987,570 56,116,779 61,490,529 64,918,349 Gross Expenditures 50,030,782 54,787,721 54,229,803 59,222,034 64,513,525 67,959,263 Revenues Other Government Funding - - - - - - Contribution from Reserves/Reserve Funds (453,263) (1,721,542) (1,678,824) (1,514,938) (1,782,339) (1,781,466) Licences, Permits, Application Fees - - - - - - Fines - - - - - - Fees, Charges, Service Rentals - - - - - - Other Revenue (17,004,088) (17,566,810) (17,960,694) (17,649,002) (18,013,352) (18,011,032) Total Revenues (17,457,351) (19,288,352) (19,639,518) (19,163,940) (19,795,691) (19,792,498) Net Operating Expense/(Revenue) 32,573,431 35,499,369 34,590,285 40,058,094 44,717,834 48,166,765
CITY OF BARRIE2016 OPERATING BUDGET
EXPENDITURES
213

2014 2015 2015 2016 Service 2016Actual Approved Forecasted Base Level Requested
Expenditures Budget Expenditure Budget Change(s) Budget$ $ $ $ $ $ $ % $ % Comments
EXPENSESSalaries 145,275 (1,282,000) (12,111) (800,000) - (800,000) 482,000 -38% 482,000 -38% Difference between budgeted salary
gapping that is held corporately with expected actuals to occur in other areas. Reduced to reflect historical trend.
Fringe Benefits 513,506 - 95,318 - - - - 0% - 0%Total Salaries and Benefits 658,781 (1,282,000) 83,207 (800,000) - (800,000) 482,000 -38% 482,000 -38%OPERATING EXPENSESGeneral Operations 4,014,026 4,440,492 4,159,026 3,905,255 - 3,905,255 (535,237) -12% (535,237) -12% Significant reduction in Consultants due to
the completion of the CUPE Job Evaluation and budget decreases for Citywide Stormwater Models/Sophia Creek MDP.
Minor Capital - - - - - - - 0% - 0%Hydro, Water, Sewer, Gas - - - - - - - 0% - 0%Transfers to other Boards, Municipalities, Agencies - - - - - - - 0% - 0%Total Operating Expenses before Debenture Costs and Transfers 4,014,026 4,440,492 4,159,026 3,905,255 - 3,905,255 (535,237) -12% (535,237) -12%
DEBENTURE COSTS AND TRANSFERSLease Equipment/Property 1,393,101 1,345,680 1,319,226 1,371,484 - 1,371,484 25,804 2% 25,804 2% Slight increase due to Facility Management
at City Hall.Financial Expenses 24,776,252 25,528,467 23,913,262 26,686,755 - 26,686,755 1,158,288 5% 1,158,288 5% Difference between budgeted debt principle
and interest charges in 2015 compared to 2016 budgeted debt charges.
Transfer to/from User Rate Reserve Funds - - - - - - - 0% - 0%Transfer to Reserves 19,188,622 24,755,082 24,755,082 28,058,540 - 28,058,540 3,303,458 13% 3,303,458 13% Increased transfer to Tax Capital Reserve.Transfer to Capital Fund - - - - - - - 0% - 0%Total Debenture Costs and Transfers 45,357,975 51,629,229 49,987,570 56,116,779 - 56,116,779 4,487,550 9% 4,487,550 9%Gross Expenditures 50,030,782 54,787,721 54,229,803 59,222,034 - 59,222,034 4,434,313 8% 4,434,313 8% Revenues Other Government Funding - - - - - - - 0% - 0% Contribution from Reserves/Reserve Funds (453,263) (1,721,542) (1,678,824) (1,514,938) - (1,514,938) 206,604 -12% 206,604 -12% Decrease in budgeted usage based on
lowered reliance on Tax Rate Stabilization offset by increased use of DC Reserves.
Licences, Permits, Application Fees - - - - - - - 0% - 0% Fines - - - - - - - 0% - 0% Fees, Charges, Service Rentals - - - - - - - 0% - 0% Other Revenue (17,004,088) (17,566,810) (17,960,694) (17,649,002) - (17,649,002) (82,192) 0% (82,192) 0% Slight increase due to difference between
Debt Charges principle and interest allocation to the User Rates.
Total Revenues (17,457,351) (19,288,352) (19,639,518) (19,163,940) - (19,163,940) 124,412 -1% 124,412 -1% Net Operating Expense/(Revenue) 32,573,431 35,499,369 34,590,285 40,058,094 - 40,058,094 4,558,725 13% 4,558,725 13%
Base Budget Requested Budgetto 2015 Approved Budget to 2015 Approved Budget
GENERAL GOVERNMENTOther Expenses
2016 Base Budget Change Report
Change in 2016 Change in 2016
214

GENERAL GOVERNMENTCITY COUNCIL
2014 2015 2015 2016 2017 2018ACTUAL BUDGET FORECAST BUDGET FORECAST FORECAST
EXPENSESSalaries 412,822 419,807 418,719 418,807 426,100 431,100 Fringe Benefits 30,145 32,629 27,204 32,629 33,182 33,680 Total Salaries and Benefits 442,967 452,436 445,923 451,436 459,282 464,780 OPERATING EXPENSESGeneral Operations 148,752 180,055 152,199 184,031 195,869 244,524 Minor Capital - - - - - - Hydro, Water, Sewer, Gas - - - - - - Transfers to other Boards, Municipalities, Agencies - - - - - - Total Operating Expenses before Debenture Costs and Transfers 148,752 180,055 152,199 184,031 195,869 244,524 DEBENTURE COSTS AND TRANSFERSLease Equipment/Property - - - - - - Financial Expenses - - - - - - Transfer to/from User Rate Reserve Funds - - - - - - Transfer to Reserves - - - - - - Transfer to Capital Fund - - - - - - Total Debenture Costs and Transfers - - - - - - Gross Expenditures 591,719 632,491 598,122 635,467 655,151 709,304 Revenues Other Government Funding - - - - - - Contribution from Reserves/Reserve Funds - - - - - - Licences, Permits, Application Fees - - - - - - Fines - - - - - - Fees, Charges, Service Rentals - - - - - - Other Revenue 2,000 - (3,357) - - - Total Revenues 2,000 - (3,357) - - - Net Operating Expense/(Revenue) 593,719 632,491 594,765 635,467 655,151 709,304
CITY OF BARRIE2016 OPERATING BUDGET
EXPENDITURES
215

2014 2015 2015 2016 Service 2016Actual Approved Forecasted Base Level Requested
Expenditures Budget Expenditure Budget Change(s) Budget$ $ $ $ $ $ $ % $ % Comments
EXPENSESSalaries 412,822 419,807 418,719 418,807 - 418,807 (1,000) 0% (1,000) 0%Fringe Benefits 30,145 32,629 27,204 32,629 - 32,629 - 0% - 0%Total Salaries and Benefits 442,967 452,436 445,923 451,436 - 451,436 (1,000) 0% (1,000) 0%OPERATING EXPENSESGeneral Operations 148,752 180,055 152,199 184,031 - 184,031 3,976 2% 3,976 2% A 2015 subscription was paid in 2014
reducing 2015 expenditures by 19K. The remainder of the increase is primarily due to anticipated underspending in 2015 of expense accounts by members of Council and underspending of various Committee budgets.
Minor Capital - - - - - - - 0% - 0%Hydro, Water, Sewer, Gas - - - - - - - 0% - 0%Transfers to other Boards, Municipalities, Agencies - - - - - - - 0% - 0%Total Operating Expenses before Debenture Costs and Transfers 148,752 180,055 152,199 184,031 - 184,031 3,976 2% 3,976 2%
DEBENTURE COSTS AND TRANSFERSLease Equipment/Property - - - - - - - 0% - 0%Financial Expenses - - - - - - - 0% - 0%Transfer to/from User Rate Reserve Funds - - - - - - - 0% - 0%Transfer to Reserves - - - - - - - 0% - 0%Transfer to Capital Fund - - - - - - - 0% - 0%Total Debenture Costs and Transfers - - - - - - - 0% - 0%Gross Expenditures 591,719 632,491 598,122 635,467 - 635,467 2,976 0% 2,976 0% Revenues Other Government Funding - - - - - - - 0% - 0% Contribution from Reserves/Reserve Funds - - - - - - - 0% - 0% Licences, Permits, Application Fees - - - - - - - 0% - 0% Fines - - - - - - - 0% - 0% Fees, Charges, Service Rentals - - - - - - - 0% - 0% Other Revenue 2,000 - (3,357) - - - - 0% - 0% Reflects year end transfer from Heritage
Barrie account for portrait (1 time). Total Revenues 2,000 - (3,357) - - - - 0% - 0% Net Operating Expense/(Revenue) 593,719 632,491 594,765 635,467 - 635,467 2,976 0% 2,976 0%
to 2015 Approved Budget to 2015 Approved Budget
Change in 2016 Change in 2016Base Budget Requested Budget
City Council 2016 Base Budget Change Report
216