510(k) substantial equivalence determination …® respiratory pathogens flex nucleic acid test (rp...
TRANSCRIPT

1
510(k) SUBSTANTIAL EQUIVALENCE DETERMINATION DECISION SUMMARY
A. 510(k) Number: K143653
B. Purpose for Submission: New device
C. Measurand:
Adenovirus, Human Metapneumovirus, Influenza A, Influenza A subtype H1, Influenza A subtype H3, Influenza B, Parainfluenza virus 1, Parainfluenza virus 2, Parainfluenza virus 3, Parainfluenza virus 4, Rhinovirus, Respiratory Syncytial Virus A, Respiratory Syncytial Virus B, Bordetella pertussis, Bordetella holmesii, and Bordetella parapertussis/Bordetella bronchiseptica nucleic acid target sequences.
D. Type of Test:
A multiplexed nucleic acid test intended for use with the automated Verigene System for the qualitative in vitro detection and identification of multiple respiratory pathogen nucleic acids in nasopharyngeal swabs (NPS) collected in viral transport media and obtained from individuals suspected of respiratory tract infections.
E. Applicant:
Nanosphere, Inc.
F. Proprietary and Established Names: Verigene® Respiratory Pathogens Flex Nucleic Acid Test (RP Flex) Common Name: Verigene® RP Flex
G. Regulatory Information:
Product Code Classification Regulation Section Panel
OCC
Class II
21 CFR 866.3980 Respiratory Viral Panel Multiplex Nucleic Acid Assay
Microbiology (83)
OEM
Class II
21 CFR 866.3980 Respiratory Viral Panel Multiplex Nucleic Acid Assay
Microbiology (83)
OEP
Class II
21 CFR 866.3980 Respiratory Viral Panel Multiplex Nucleic Acid Assay
Microbiology (83)

2
OOU
Class II
21 CFR 866.3980 Respiratory Viral Panel Multiplex Nucleic Acid Assay
Microbiology (83)
OZE
Class II
21 CFR 866.3980 Respiratory Viral Panel Multiplex Nucleic Acid Assay
Microbiology (83)
OZZ
Class II
21 CFR 866.3980 Respiratory Viral Panel Multiplex Nucleic Acid Assay
Microbiology (83)
OOI
Class II
21 CFR 862.2570 Instrumentation for Clinical Multiplex Test Systems
Clinical Chemistry (75)
H. Intended Use:
1. Intended use:
The Verigene® Respiratory Pathogens Flex Nucleic Acid Test (RP Flex) is a multiplexed qualitative test intended for the simultaneous detection and identification of multiple viral and bacterial nucleic acids in nasopharyngeal swabs (NPS) obtained from individuals suspected of respiratory tract infection. The test is performed on the automated Verigene System utilizing reverse transcription (RT), polymerase chain reaction (PCR), and microarray hybridization to detect gene sequences of the following organism types and subtypes:
Viruses Bacteria
Adenovirus Bordetella parapertussis/bronchiseptica Human Metapneumovirus Bordetella holmesii Influenza A Bordetella pertussis Influenza A (Subtype H1) Influenza A (Subtype H3) Influenza B Parainfluenza 1 Parainfluenza 2 Parainfluenza 3 Parainfluenza 4 Respiratory Syncytial Virus A Respiratory Syncytial Virus B Rhinovirus
Detecting and identifying specific viral and bacterial nucleic acids from individuals exhibiting signs and symptoms of respiratory infection aids in the diagnosis of respiratory

3
infection, if used in conjunction with other clinical and laboratory findings. The results of this test should not be used as the sole basis for diagnosis, treatment, or patient management decisions.
Negative results in the presence of a respiratory illness do not preclude respiratory infection and may be due to infection with pathogens that are not detected by this test or lower respiratory tract infection that is not detected by an NPS specimen. Conversely, positive results do not rule-out infection or co-infection with organisms not detected by RP Flex. The agent(s) detected may not be the definite cause of disease. The use of additional laboratory testing and clinical presentation may be necessary to establish a final diagnosis of respiratory infection.
Clinical evaluation indicates a lower sensitivity specific to RP Flex for the detection of Rhinovirus. If infection with Rhinovirus is suspected, negative samples should be confirmed using an alternative method. Performance characteristics for Influenza A were established when Influenza A/H1 (2009 Pandemic) and A/H3 were the predominant Influenza A viruses in circulation. RP Flex may not detect novel Influenza A strains. If infection with a novel Influenza A virus is suspected based on current clinical and epidemiological screening criteria recommended by public health authorities, specimens should be collected with appropriate infection control precautions used specifically for novel virulent influenza viruses and sent to appropriate health authorities for testing. Viral culture should not be attempted in these cases unless a biosafety level (BSL) 3+ facility is available to receive and culture specimens.
2. Indication for use:
Same as Intended Use
3. Special conditions for use statement(s): For prescription use only
4. Special instrument requirements:
Verigene® System
I. Device Description:
The Verigene RP Flex is performed on the Verigene System. The Verigene System consists of a Verigene Reader and multiple Verigene Processor SP modules or units. Each Processor SP module processes one sample at a time under the control of the Verigene Reader. The RP Flex components required to perform the test include the following single-use, disposables:
• RP Flex Test Cartridge • RP Flex Extraction Tray (with Tip Holder Assembly) • RP Flex Amplification Tray • Verigene Sample Well Caps

4
Prior to initiating a test on the Verigene Processor SP, a 200 μL aliquot of NPS in Viral Transport Media (VTM) is pipetted into the Sample Loading Well within the Extraction Tray and a Sample Well Cap is used to cover the Sample Loading Well. The Extraction Tray, Tip Holder, and Amplification Tray are loaded into the Verigene Processor SP. Next, the barcode located on the RP Flex Test Cartridge is entered via the scanner attached to the Verigene Reader, and the associated sample information is entered either using the barcode-scanner or the Verigene Reader touch-screen interface. This links specific patient information to a specific Test Cartridge number. The RP Flex Test Cartridge is then inserted into the Processor SP. The Drawer Assembly is closed to initiate the test. The Processor SP identifies the Test Cartridge via an internal barcode scanner and communicates with the Verigene Reader to receive test instructions. Once the Processor SP module completes processing (about 2 hours), the RP Flex Test Cartridge is removed and inserted into the Verigene Reader for automated identification of the gene-specific nucleic acids.
The RP Flex detects a total of 17 nucleic acid targets as listed in Table 1 below. For each intended RP Flex target, four sequence components, referred to as oligonucleotides (Oligos), consisting of one or more Capture probe(s), Mediator probe(s), forward primer(s), and reverse primer(s), are required.
Table 1: A summary of the RP Flex Targets
Organism Target Gene(s)
Adenovirus Hexon
Human Metapneumovirus Polymerase/Large Protein (L) for Species
A Nucleoprotein (NP) for Species B
Influenza A Matrix Protein (M) Influenza A/H1 Hemagglutinin (HA) Influenza A/H3 Hemagglutinin (HA)
Influenza B Non-Structural Protein (NS) Parainfluenza 1 Fusion Protein (F) Parainfluenza 2 Polymerase/Large Protein (L) Parainfluenza 3 Nucleoprotein (NP) Parainfluenza 4 Phosphoprotein (P)
Rhinovirus 5’- UTR
RSV A Polymerase/Large Protein (L)
RSV B Fusion Protein (F)
Bordetella parapertussis/Bordetella bronchiseptica gidA
Bordetella holmesii fumC
Bordetella pertussis Toxin Promotor Region

5
Materials Provided with the Verigene RP Flex Kit:
Verigene RP Flex Test Kit (Catalog # 20-005-024) • 20 Verigene RP Flex Test Cartridges
Each Test Cartridge comes preloaded with all required reaction reagents, including wash solutions, oligonucleotide probe solution and signal amplification solutions required to generate a test result. The Test Cartridges are contained within a carrier labeled as “RP; 20-006-024”.
• 20 Verigene RP Flex Test Extraction Trays (with Tip Holder Assemblies)
Each Extraction Tray comes preloaded with all required reagents, including lysis/binding buffer, wash solutions, and buffer solutions necessary to extract nucleic acids and generate a test result. The Extraction Trays are contained within a carrier labeled as “RP; 20-009-024”.
• 20 Verigene Sample Well Caps
The Caps come packaged in strips of 5 Caps and are contained within a plastic bag. The bag is labeled as “40-001-001”.
Verigene RP Flex Amplification Kit (Catalog # 20-012-024) • 20 Verigene RP Flex Amplification Trays
Each Amplification Tray comes preloaded with all required reagents, including enzymes and buffers necessary to amplify nucleic acids and generate a test result as well as an amplification tube. The Amplification Trays are contained within a carrier labeled as “RP; 20-011-024”.
Materials Needed but Not Provided with the Verigene RP Flex Kit: Instruments and Equipment
• Verigene Reader (Catalog # 10-0000-02) • Verigene Processor SP (Catalog # 10-0000-07) • Barcode Scanner • 2-8°C Refrigerator • ≤ -20°C Freezer • ≤ -70°C Freezer (Optional) • Micro-pipettors & filtered tips • Vortex • Decontamination wipes/spray or comparable sanitizer • Biological Safety Cabinet (BSC) • Verigene Extraction Tray Holder (Catalog # 421-00019-01) (Optional) • Test Cartridge Cover Opener (Optional)
Interpretation of Results
Verigene RP Flex provides a qualitative result for the presence (Detected) or absence (Not Detected) of the Verigene RP Flex target genes. The image analysis of the Substrate provides

6
light signal intensities from the target-specific capture spots as well as the internal processing controls, negative control, background, and imaging control spots. The mean signal intensity of a target is compared to the assay’s signal detection threshold to make a determination. Table 2 below lists the possible test results generated by Verigene RP Flex representing identification of viral and bacterial nucleic acid sequences/targets.
Table 2: RP Flex Calls for Valid Tests
Test Result Reported as “Detected” Target Genes Viral Targets
Adenovirus Hexon
hMPV Polymerase/Large Protein (L) for Species A Nucleoprotein (NP) for Species B
Influenza A* Matrix Protein (M) Influenza A/H1** Hemagglutinin (HA) Influenza A/H3** Hemagglutinin (HA)
Influenza B Non-Structural Protein (NS) Parainfluenza 1 Fusion Protein (F) Parainfluenza 2 Polymerase/Large Protein (L) Parainfluenza 3 Nucleoprotein (NP) Parainfluenza 4 Phosphoprotein (P)
Rhinovirus 5’- UTR Respiratory Syncytial Virus A Polymerase/Large Protein (L) Respiratory Syncytial Virus B Fusion Protein (F)
Bacterial Targets Bordetella parapertussis/bronchiseptica*** gidA
Bordetella holmesii fumC Bordetella pertussis Toxin Promotor Region
Test Result Reported as “ Not Detected” All Analytes Not Detected
*Detection of Influenza A without an Influenza A/H1 or Influenza A/H3 subtype may occur at low titer of the virus in the specimen or may indicate a false positive due to contamination. The result could also indicate a novel Influenza A strain. In these cases, the sample should be retested. If an Influenza A detected result is obtained without detection of an Influenza A/H1 or A/H3 subtype upon retesting, contact local or state public health authorities for confirmatory testing. **Detection of Influenza A/H1 or Influenza A/H3 subtypes without an Influenza A “Detected” result may occur at low titer of the virus in the specimen or may indicate a false positive due to contamination. The result could also indicate potential genetic mutations in the Matrix protein gene among circulating seasonal Influenza A viruses. In these cases, the sample should be retested. If an Influenza A/H1 or A/H3 subtype detected result is obtained again without detection of Influenza A upon repeat testing, further investigations may be warranted. ***Since the RP Flex Bordetella parapertussis/bronchiseptica probes also detect Bordetella pertussis, if a Bordetella pertussis “Detected” result is obtained, the results for Bordetella parapertussis/bronchiseptica are not to be considered as they do not indicate the presence or absence of Bordetella parapertussis / Bordetella bronchiseptica. The result of Bordetella parapertussis/bronchiseptica is reported as “N/A” upon a “Detected” result for Bordetella pertussis.
Calls related to an invalid Verigene RP Flex test are listed in Table 3 below, together with the appropriate recourse which should be taken by the user.

7
Table 3: RP Flex Invalid Calls and Recourse Call Reason Recourse
No Call – INT CTL 1 Internal Control 1 not detected, indicating a target hybridization issue.
Repeat Verigene RP Flex.
No Call – INT CTL 2
Internal Control 2 not detected, indicating a lysis, extraction, amplification issue, or a target hybridization issue.
Repeat Verigene RP Flex.
No Call – INT CTL
Internal Control 1 and Control 2 not detected, indicating a lysis, extraction, amplification issue, and/or a target hybridization issue.
Repeat Verigene RP Flex.
No Call – NO GRID Reader unable to image Substrate.
Ensure Substrate is seated properly in the Substrate Holder. Repeat image analysis by selecting “Menu” and “Enter Barcode” and then scanning the Substrate Holder barcode. If the No Call persists, repeat Verigene RP Flex.
No Call – VARIATION Reader unable to obtain result because of high variability in the target-specific signals.
Repeat Verigene RP Flex. No Call – BKGD No Call – NEG CTL
Processing Error Pre-Analysis Error (PAE): Internal checks within the Processor SP detected an unexpected event.
Power cycle the Processor SP and repeat RP Flex.
J. Substantial Equivalence Information:
1. Predicate device name(s):
FilmArray® Respiratory Panel (RP) System (BioFire Diagnostics, Inc.)
2. Predicate K number(s):
K143080 K123620 K120267 K110764 K103175
3. Comparison with predicate(s):
Similarities
Element Verigene RP Flex FilmArray Respiratory Panel (RP) System
Intended Use The Verigene® Respiratory Pathogens Flex Nucleic Acid Test (RP Flex) is a multiplexed qualitative test intended for the
Same

8
simultaneous detection and identification of multiple viral and bacterial nucleic acids in nasopharyngeal swabs (NPS) obtained from individuals suspected of respiratory tract infection.
Organisms Detected
Adenovirus, Rhinovirus, Human Metapneumovirus, Influenza A, Influenza A (subtype H1), Influenza A (subtype H3), Influenza B, Parainfluenza 1, Parainfluenza 2, Parainfluenza 3, Parainfluenza 4, Respiratory Syncytial Virus A, Respiratory Syncytial Virus B, and Bordetella pertussis
Same (See below for differences)
Analyte RNA/DNA Same
Technological Principles Multiplex nucleic acid amplification Same
(See below for differences) Specimen
Types Nasopharyngeal swabs eluted in VTM Same
Test Interpretation
Automated test interpretation and report generation. User cannot access raw data. Same
Differences
Element Verigene RP Flex FilmArray Respiratory Panel (RP) System
Organisms Detected
• Cannot distinguish Influenza A subtype 2009 H1 from Influenza A subtype H1.
• Can distinguish Respiratory Syncytial Virus Type A from Respiratory Syncytial Virus Type B.
• Detects Rhinovirus, but not Enterovirus. • Detects and distinguishes Bordetella
parapertussis/bronchiseptica and Bordetella holmesii from Bordetella pertussis.
• Can distinguish Influenza A subtype 2009 H1 from Influenza A subtype H1.
• Cannot distinguish Respiratory Syncytial Virus Type A from Respiratory Syncytial Virus Type B.
• Cannot distinguish Rhinovirus from Enterovirus.
• Detects Coronavirus 229E, Coronavirus HKU1, Coronavirus NL63, Coronavirus OC43, Chlamydophila pneumoniae, Mycoplasma pneumoniae and Enterovirus.
Technological Principles
Multiplex RT-PCR followed by amplicons hybridization to target specific capture oligonucleotides in a microarray format and mediator and gold-nanoparticle probe hybridization to captured amplicons.
Nested multiplex RT-PCR followed by high resolution melting analysis to confirm identity of amplified product.
Detection Method
Gold nanoparticle with silver enhancement probe-based endpoint detection
Real-time fluorescence detection during the second stage of the nested RT-PCR followed by endpoint high resolution melting analysis to confirm identity of amplified product.
Optical Detection Light scattering Fluorescence
Instrumentation Verigene System FilmArray instrument
Time to result About 2 hours About 1 hour

9
Sample Preparation
Method
Sample Processing is automated in the Verigene System.
Sample Processing is automated in the FilmArray instrument.
Reagent Storage
Some reagents need to be stored at refrigerated or freezing temperatures. Reagents are stored at room temperature.
K. Standard/Guidance Documents Referenced (if applicable):
• CLSI EP5-A2; Evaluation of Precision Performance of Quantitative Measurement Methods; Approved Guideline - Second Edition
• CLSI EP12-A2; User Protocol for Evaluation of Qualitative Test Performance; Approved Guideline - Second Edition
• CLSI MM3-A2; Molecular Diagnostic Methods for Infectious Diseases; Approved Guideline - Second Edition
• CLSI EP15-A2 - User Verification of Performance for Precision and Trueness; Approved Guideline – second edition
• CLSI EP9-A2 - Method Comparison and Bias Estimation Using Patient Samples; Approved Guideline – second edition
• CLSI EP17-A2 - Protocols for Determination of Limits of Detection and Limits of Quantitation; Approved Guideline
• FDA guidance document issued on April 25, 2006, titled “Guidance on Informed Consent for In Vitro Diagnostic Device Studies Using Leftover Human Specimens that are Not Individually Identifiable”
• FDA guidance document issued on May 11, 2005, titled “Guidance for the Content of Premarket Submissions for Software Contained in Medical Devices”
• FDA guidance document issued on March 10, 2005, titled “Class II Special Controls Guidance Document: Instrumentation for Clinical Multiplex Test Systems”
• FDA guidance document issued on June 25, 2010, titled “In Vitro Diagnostic (IVD) Device Studies – Frequently Asked Questions”
• FDA guidance document issued on August 27, 2014, titled “Highly Multiplexed Microbiological/Medical Countermeasure In Vitro Nucleic Acid Based Diagnostic Devices”
• FDA guidance document issued on March 13, 2007, titled “Statistical Guidance on Reporting Results from Studies Evaluating Diagnostic Tests”
• FDA guidance document issued on October 9, 2009, titled “Class II Special Controls Guidance Document: Respiratory Viral Panel Multiplex Nucleic Acid Assay”
• FDA guidance document issued on July 15, 2011, titled “Establishing the Performance Characteristics of In Vitro Diagnostic Devices for the Detection or Detection and Differentiation of Influenza Viruses”
• FDA guidance document issued on October 9, 2009, titled “Class II Special Controls Guidance Document: Testing for Detection and Differentiation of Influenza A Virus Subtypes Using Multiplex Assays”
• FDA guidance document issued on October 9, 2009, titled “Testing for Human Metapneumovirus (hMPV) Using Nucleic Acid Assays”
L. Test Principle:

10
The Verigene RP Flex test is a multiplexed molecular assay with automated isolation, amplification, and detection of unique genomic sequences of target pathogens. Verigene RP Flex is performed using the Verigene System, which is a bench-top sample-to-result molecular diagnostics workstation consisting of two modules: the Verigene Processor SP and the Verigene Reader. The Verigene Processor SP automates the Verigene RP Flex sample analysis steps including: (1) Specimen Extraction—Magnetic bead-based RNA/DNA extraction from nasopharyngeal swab specimens obtained from symptomatic patients; (2) Target Amplification--Multiplex RT-PCR- and PCR-based amplification of the extracted nucleic acids to generate target-specific amplicons; (3) Hybridization—Amplicon hybridization to target specific capture DNA in a microarray format and mediator and gold-nanoparticle probe hybridization to captured amplicons. Silver enhancement of the gold nanoparticle probes bound at the capture sites results in gold-silver aggregates that are imaged optically with high efficiency by the Verigene Reader. The Verigene Reader also serves as the user interface and central control unit for the Verigene System, storing and tracking information throughout the assay process.
The Verigene Processor SP utilizes single-use consumables to perform Verigene RP Flex test, including an Extraction Tray, Amplification Tray and Test Cartridge. A separate Tip Holder Assembly contains two pipette tips that are used to transfer and mix reagents during the assay. The user tests a specimen by loading the single-use consumables into the Verigene Processor SP, pipetting the prepared specimen into the Extraction Tray, and initiating the protocol on the Verigene Reader by scanning or entering the Test Cartridge ID and specimen information. Following assay completion, the user inserts the Substrate Holder portion of the Test Cartridge into the Verigene Reader for optical analysis and generation of Verigene RP Flex test results. Extraction The isolation consists of an initial lysis of the viral or bacterial cells using proteases and chaotropic agents followed by the binding of the released nucleic acids to magnetic beads. The nucleic acid-bound magnetic beads are washed to eliminate cell debris, lysis buffers, and potential interferents, following which, the nucleic acids are eluted off the beads and made available for amplification.
Amplification The nucleic acid amplification consists of a first step reverse transcription (RT) to convert any viral genomic RNA to complimentary DNA (cDNA) amenable to subsequent multiplexed PCR amplification. The multiplexed RT-PCR step is conducted in a single closed tube that contains both the reverse transcriptase and the PCR polymerase enzymes along with the target-specific primers, dNTP nucleotides, and buffers.
Contamination Control The RP Flex test has multiple mitigations in place to handle potential contamination of PCR. First, each test is performed with a set of single-use consumables that inherently minimize contamination due to carryover and cross-contamination. Second, the RP Flex test includes a Uracil DNA Glycosylase (UDG) enzyme-based strategy to eliminate amplicon contamination.

11
Briefly, the dNTP formulation contains deoxyuridine triphosphate (dUTP) in place of the standard deoxythymidine triphosphate (dTTP), and during the multiplexed RT-PCR step dUTP is incorporated into the amplicons. Prior to the start of an amplification step, the UDG enzyme renders any dUTP-containing amplicons non-amplifiable by selectively hydrolyzing at the uracil base. The RP Flex test uses a thermolabile version of UDG enzyme which is inactivated by heat prior to the RT step and does not interfere with the newly-generated cDNA and/or the amplicon from the test. While the UDG-based strategy mitigates false positive risk due to lab-based carryover and cross-contamination, incomplete hydrolysis of uracil-containing amplicons may lead to amplification and detection of a contaminant. Additionally, this strategy does not address genomic contamination during the preparation of the samples. Strict adherence to the prescribed handling/preparation of samples and laboratory/system cleaning protocols and careful disposal of the used consumables can reduce the likelihood of contamination from user-based sources.
End-Point Detection and Analysis The target-specific amplicon is detected in an endpoint assay that utilizes a microarray format. For each of the bacterial or viral nucleic acid sequences/analytes detected by the RP Flex test, two types of oligonucleotides are required for the endpoint gold nanoparticle probe-based detection: (1) Capture oligonucleotides (or captures) and (2) Mediator oligonucleotides (or mediators). The Capture oligonucleotides are printed on the Test Substrate (the microarray) and are designed to specifically bind to one part of the analyte-specific target amplicon. The Mediator oligonucleotides bind to a different portion of the same amplicon and enable binding of gold nanoparticle probes. Notably, in a multiplexed detection system, numerous unique target-specific mediators can coexist and form unique hybridizations at the different captures on the microarray. Since all the mediators have a target specific region and a poly-A tail region, a single, universal gold nanoparticle poly-T probe is sufficient for target/mediator labeling. Silver enhancement of the bound gold nanoparticle probes at the capture sites results in gold-silver aggregates that scatter light with high efficiency. Light scatter from the capture spots is imaged by the Verigene Reader and intensities from the microarray spots are processed by a decision algorithm to make calls regarding the presence (Detected) or absence (Not Detected) of a nucleic acid sequence/analyte.
M. Performance Characteristics (if/when applicable):
1. Analytical performance:
a. Precision Study and Reproducibility Study : Precision Study
A study was conducted to evaluate the precision (repeatability) of the RP Flex. RP Flex performance was assessed across several sources of variability including operators, days, consumable lots, and Verigene instruments. The Precision Study used three lots of each of the consumables (cartridges, extraction trays and amplification trays). All precision testing was performed at a single laboratory site with one Verigene reader and 12 Verigene Processor SPs.

12
In this study, a representative test panel was tested daily in duplicate by two operators for 12 non-consecutive days for a total of 48 tests per sample. The test panel, representing all the RP Flex analytes except for B. parapertussis and B. bronchiseptica, consisted of two negative samples (one negative simulated NPS matrix and one Staphylococcus aureus spiked in negative simulated NPS matrix), as well as seven positive mixed samples at two different concentrations for a total of 16 unique samples. The composition and concentration of each sample is provided in Table 4 below. Samples were prepared by spiking previously characterized and quantified organism stocks into simulated NPS matrix at Moderate Positive (5x LoD) and Low Positive (2x LoD) concentrations. Each unique sample was divided into single-use aliquots of 300 µL each and frozen at ≤ -70 °C until ready for use.
Table 4: Precision/Reproducibility Test Panel for the Verigene RP Flex
Organism Organism/Strain ID Limit of Detection (LoD) Sample #1 Sample #2
Parainfluenza 1 ATCC VR-94 9.00E+01 TCID50/mL 2 x LoD 5 x LoD
RSV A ATCC VR-99 3.30E+00 TCID50/mL 2 x LoD 5 x LoD
Organism Organism/Strain ID Limit of Detection (LoD) Sample #3 Sample #4
Parainfluenza 2 ATCC VR-92 1.00E+01 TCID50/mL 2 x LoD 5 x LoD
Influenza A/H3 A/Wisconsin/67/05 3.30E+00 TCID50/mL 2 x LoD 5 x LoD
Organism Organism/Strain ID Limit of Detection (LoD) Sample #5 Sample #6
Influenza A/H1 Brisbane 59/2007 3.00E+01 TCID50/mL 2 x LoD 5 x LoD
RSV B Wash/ 18537/62 3.70E-01 TCID50/mL 2 x LoD 5 x LoD
Organism Organism/Strain ID Limit of Detection (LoD) Sample #7 Sample #8
Influenza B Florida/ 02/2006 3.00E+01 TCID50/mL 2 x LoD 5 x LoD
Rhinovirus ATCC VR-340 1.00E+01 TCID50/mL 2 x LoD 5 x LoD
Organism Organism/Strain ID Limit of Detection (LoD) Sample #9 Sample
#10
Parainfluenza 4 ATCC VR-1378 2.70E+02 TCID50/mL 2 x LoD 5 x LoD
hMPV 9A 3.00E+01 TCID50/mL 2 x LoD 5 x LoD
Organism Organism/Strain ID Limit of Detection (LoD) Sample #11 Sample
#12 Parainfluenza virus
3 0810016CF 3.30E+00 TCID50/mL 2 x LoD 5 x LoD
Adenovirus 0810070CF 4.00E-02 TCID50/mL 2 x LoD 5 x LoD
Organism Organism/Strain ID Limit of Detection (LoD) Sample #13 Sample
#14

13
B. pertussis ATCC 9797 8.10E+02 CFU/mL 2 x LoD 5 x LoD
B. holmesii ATCC 51541 2.43E+03 CFU/mL 2 x LoD 5 x LoD
Organism Organism/Strain ID Limit of Detection (LoD) Sample #15
None N/A N/A N/A
Organism Organism/Strain ID Limit of Detection (LoD) Sample #16
S. aureus ATCC 12600 N/A 1.00E+06 CFU/mL
The RP Flex results obtained during the Precision Study are presented for each RP Flex target evaluated in Table 5 below. The positive percent agreement for each analyte was determined for the low and moderate positive samples. The negative percent agreement for each analyte was assessed for the negative samples, as well as all samples that did not contain the particular target organism.
Table 5: Precision Study Results
RP Flex Target Positive Percent Agreement
(95% CI) Negative Percent
Agreement (95% CI) Low Positive Moderate Positive Negative
Parainfluenza 1 100% 48/48 (92.6-100)
100% 48/48 (92.6-100)
100% 671/671 (99.4-100)
Parainfluenza 2 100% 48/48 (92.6-100)
100% 48/48 (92.6-100)
100% 671/671 (99.4-100)
Parainfluenza 3 100% 48/48 (92.6-100)
95.8 46/48 (86.0-98.8)
100% 671/671 (99.4-100)
Parainfluenza 4 100% 48/48 (92.6-100)
100% 48/48 (92.6-100)
99.9% 670/671 (99.2-100)
RSV A 100% 48/48 (92.6-100)
100% 48/48 (92.6-100)
100% 671/671 (99.4-100)
RSV B 93.8% 45/48 (83.2-97.9)
100% 48/48 (92.6-100)
100% 671/671 (99.4-100)
Influenza A 100% 96/96 (96.2-100)
100% 96/96 (96.2-100)
100% 575/575 (99.3-100)
Influenza A/H1 100% 48/48 (92.6-100)
100% 48/48 (92.6-100)
100% 671/671 (99.4-100)
Influenza A/H3 100% 48/48 (92.6-100)
100% 48/48 (92.6-100)
100% 671/671 (99.4-100)
Influenza B 100% 48/48 (92.6-100)
100% 48/48 (92.6-100)
100% 671/671 (99.4-100)

14
Rhinovirus 97.9% 47/48 (89.1-99.6)
100% 48/48 (92.6-100)
99.9% 670/671 (99.2-100)
hMPV 100% 48/48 (92.6-100)
100% 48/48 (92.6-100)
100% 671/671 (99.4-100)
Adenovirus 100% 48/48 (92.6-100)
100% 48/48 (92.6-100)
99.7% 669/671 (98.9 -99.9)
Bordetella pertussis 97.9% 47/48 (89.1-99.6)
100% 47/47 (92.4-100)
100% 672/672 (99.4-100)
Bordetella holmesii 97.9% 47/48 (89.1-99.6)
100% 47/47 (92.4-100)
100% 672/672 (99.4-100)
Reproducibility Study
A reproducibility study was also conducted at three testing sites to evaluate the inter-laboratory reproducibility of the RP Flex. RP Flex performance was assessed across several sources of variability including locations, operators, days, sample replicates, consumable lots, and Verigene instruments. The RP Flex reproducibility study encompassed five cartridges lots, six extraction tray lots and four amplification tray lots. A total of three Verigene Readers and 39 Verigene Processor SP systems were utilized across the three testing sites (one internal and two external laboratory sites), with each site using one Verigene Reader with 12 to 14 Verigene Processor SPs. In this reproducibility study, the same representative test panel of samples as presented in Table 2 previously was tested daily, in triplicate, by two operators for five non-consecutive days at three sites for a total of 90 tests per sample (3 sites x 2 operators / site x 3 replicates / operator x 5 days = 90 tests per sample). The RP Flex results obtained during the Reproducibility Study are presented for each RP Flex target evaluated in Table 6 below. The positive percent agreement for each analyte was determined for the low and moderate positive samples. The negative percent agreement for each analyte was assessed for the negative samples, as well as all samples that did not contain the particular target organism.
Table 6: Reproducibility Study Results
RP Flex Target Positive Percent Agreement
(95% CI) Negative Percent
Agreement (95% CI) Low Positive Moderate Positive Negative
Parainfluenza 1 100% 90/90 (95.9-100)
100% 90/90 (95.9-100)
100% 1258/1258 (99.7 -100)
Parainfluenza 2 100% 89/89 (95.9-100)
100% 90/90 (95.9-100)
99.8% 1256/1259 (99.3 -99.9)
Parainfluenza 3 100% 90/90 (95.9-100)
100% 90/90 (95.9-100)
100% 1258/1258 (99.7 -100)

15
Parainfluenza 4 100% 90/90 (95.9-100)
100% 89/89 (95.9-100)
100% 1259/1259 (99.7 -100)
RSV A 98.9% 89/90 (94.0-99.8)
97.8% 88/90 (92.3-99.4)
100% 1258/1258 (99.7 -100)
RSV B 100% 90/90 (95.9-100)
100% 90/90 (95.9-100)
99.9% 1257/1258 (99.6-100)
Influenza A 100% 179/179 (97.9-100)
100% 180/180 (97.9-100)
100% 1079/1079 (99.6-100)
Influenza A/H1 100% 90/90 (95.9-100)
100% 90/90 (95.9-100)
99.8% 1256/1258 (99.4-100)
Influenza A/H3 98.9% 88/89 (93.9-99.8)
100% 90/90 (95.9-100)
99.6% 1254/1259 (99.1-99.8)
Influenza B 100% 90/90 (95.9-100)
100% 90/90 (95.9-100)
99.8% 1255/1258 (99.3 -99.9)
Rhinovirus 100% 90/90 (95.9-100)
100% 90/90 (95.9-100)
99.9% 1257/1258 (99.6-100)
hMPV 100% 90/90 (95.9-100)
100% 89/89 (95.9-100)
99.9% 1258/1259 (99.6-100)
Adenovirus 100% 90/90 (95.9-100)
100% 90/90 (95.9-100)
99.8% 1255/1258 (99.3 -99.9)
Bordetella pertussis 96.7% 87/90 (90.7-98.9)
100% 90/90 (95.9-100)
99.9% 1257/1258 (99.6-100)
Bordetella holmesii 100% 90/90 (95.9-100)
100% 90/90 (95.9-100)
99.9% 1257/1258 (99.6-100)
The RP Flex results obtained during the Reproducibility Study are presented for each RP Flex target evaluated stratified by testing sites in Table 7 below.
Table 7: Reproducibility Study Results Stratified by Testing Sites
RP Flex Target
Site Positive Percent Agreement (95% CI) Negative Percent
Agreement* (95% CI)
Low
Moderate Negative
Parainfluenza 1
Site 1 30/30
100% (88.6-100) 30/30
100% (88.6-100) 420/420
100% (99.1-100)
Site 2 30/30
100% (88.6-100) 30/30
100% (88.6-100) 419/419
100% (99.1-100)
Site 3 30/30
100% (88.6-100) 30/30
100% (88.6-100) 419/419
100% (99.1-100)

16
Parainfluenza 2
Site 1 30/30
100% (88.6-100) 30/30
100% (88.6-100) 419/420
99.8% (98.7-99.9)
Site 2 30/30
100% (88.6-100) 30/30
100% (88.6-100) 419/419
100% (99.1-100)
Site 3 29/29
100% (88.3-100) 30/30
100% (88.6-100) 418/420
99.5% (98.3-99.9)
Parainfluenza 3
Site 1 30/30
100% (88.6-100) 30/30
100% (88.6-100) 420/420
100% (99.1-100)
Site 2 30/30
100% (88.6-100) 30/30
100% (88.6-100) 419/419
100% (99.1-100)
Site 3 30/30
100% (88.6-100) 30/30
100% (88.6-100) 419/419
100% (99.1-100)
Parainfluenza 4
Site 1 30/30
100% (88.6-100) 30/30
100% (88.6-100) 420/420
100% (99.1-100)
Site 2 30/30
100% (88.6-100) 29/29
100% (88.3-100) 420/420
100% (99.1-100)
Site 3 30/30
100% (88.6-100) 30/30
100% (88.6-100) 419/419
100% (99.1-100)
RSV A
Site 1 29/30
96.7% (83.8-99.4) 29/30
96.7% (83.8-99.4) 420/420
100% (99.1-100)
Site 2 30/30
100% (88.6-100) 30/30
100% (88.6-100) 419/419
100% (99.1-100)
Site 3 30/30
100% (88.6-100) 29/30
96.7% (83.8-99.4) 419/419
100% (99.1-100)
RSV B
Site 1
30/30 100% (88.6-100)
30/30 100% (88.6-100)
420/420 100% (99.1-100)
Site 2 30/30 100% (88.6-100)
30/30 100% (88.6-100)
419/419 100% (99.1-100)
Site 3 30/30 100% (88.6-100)
30/30 100% (88.6-100)
418/419 99.8% (98.7-99.9)
Influenza A
Site 1 30/30 100% (88.6-100)
30/30 100% (88.6-100)
360/360 100% (98.9-100)
Site 2 30/30 100% (88.6-100)
30/30 100% (88.6-100)
359/359 100% (98.9-100)
Site 3 29/29 100% (88.3-100)
30/30 100% (88.6-100)
360/360 100% (98.9-100)

17
Influenza A/H1
Site 1 30/30 100% (88.6-100)
30/30 100% (88.6-100)
420/420 100% (99.1-100)
Site 2 30/30 100% (88.6-100)
30/30 100% (88.6-100)
419/419 100% (99.1-100)
Site 3 30/30 100% (88.6-100)
30/30 100% (88.6-100)
417/419 99.5% (98.3-99.9)
Influenza A/H3
Site 1 29/30 96.7% (83.8-99.4)
30/30 100% (88.6-100)
419/420 99.8% (98.7-99.9)
Site 2 30/30 100% (88.6-100)
30/30 100% (88.6-100)
415/419 99.0% (97.6-99.6)
Site 3 29/29 100% (88.3-100)
30/30 100% (88.6-100)
420/420 100% (99.1-100)
Influenza B
Site 1 30/30 100% (88.6-100)
30/30 100% (88.6-100)
418/420 99.5% (98.3-99.9)
Site 2 30/30 100% (88.6-100)
30/30 100% (88.6-100)
418/419 99.8% (98.7-99.9)
Site 3 30/30 100% (88.6-100)
30/30 100% (88.6-100)
419/419 100% (99.1-100)
Rhinovirus
Site 1 30/30 100% (88.6-100)
30/30 100% (88.6-100)
420/420 100% (99.1-100)
Site 2 30/30 100% (88.6-100)
30/30 100% (88.6-100)
418/419 99.8% (98.7-99.9)
Site 3 30/30 100% (88.6-100)
30/30 100% (88.6-100)
419/419 100% (99.1-100)
hMPV
Site 1 30/30 100% (88.6-100)
30/30 100% (88.6-100)
420/420 100% (99.1-100)
Site 2 30/30 100% (88.6-100)
29/29 100% (88.3-100)
420/420 100% (99.1-100)
Site 3 30/30 100% (88.6-100)
30/30 100% (88.6-100)
418/419 99.8% (98.7-99.9)
Adenovirus
Site 1 30/30 100% (88.6-100)
30/30 100% (88.6-100)
418/420 99.5% (98.3-99.9)
Site 2 30/30 100% (88.6-100)
30/30 100% (88.6-100)
419/419 100% (99.1-100)
Site 3 30/30 100% (88.6-100)
30/30 100% (88.6-100)
418/419 99.8% (98.7-99.9)

18
B. pertussis
Site 1 29/30 96.7% (83.8-99.4)
30/30 100% (88.6-100)
420/420 100% (99.1-100)
Site 2 30/30 100% (88.6-100)
30/30 100% (88.6-100)
419/419 100% (99.1-100)
Site 3 28/30 93.3% (78.7-98.2)
30/30 100% (88.6-100)
418/419 99.8% (98.7-99.9)
B. holmesii
Site 1 30/30 100% (88.6-100)
30/30 100% (88.6-100)
419/420 99.8% (98.7-99.9)
Site 2 30/30 100% (88.6-100)
30/30 100% (88.6-100)
419/419 100% (99.1-100)
Site 3 30/30 100% (88.6-100)
30/30 100% (88.6-100)
419/419 100% (99.1-100)
b. Linearity/assay reportable range:
Not applicable, qualitative assay
c. Traceability, Stability, Expected values (controls, calibrators, or methods):
Assay Controls
The RP Flex microarray contains two sets of oligonucleotide spots that are used as process controls to check for proper fluid control, extraction, amplification, hybridization and signal detection. The IC1 (hybridization control) internal processing control probes detect the presence (hybridization and signal enhancement) of a DNA oligonucleotide and mediator oligo contained within the Sample Buffer on the Extraction Tray. The IC2 (extraction control) control probes verify the presence of an amplicon for Bacteriophage MS2, which is added to the sample prior to the nucleic acid extraction step. Both internal processing controls IC1 and IC2 must be present for a valid respiratory pathogen Not Detected call for all targets to be reported. If IC1 or IC2 is Not Detected, a No Call – INT CTL 1 or a No Call – INT CTL 2 result, respectively, is generated. If both IC1 and IC2 are Not Detected, a No Call – INT CTL result is generated. The IC2 is not utilized for the detection of positive samples. The IC1 is required for the detection of positive samples.
A set of regions on microarray which do not contain capture oligonucleotides is used as a control for background signal levels. If the signal in these background regions is too high, a No Call - BKGD is generated. Additionally, negative control oligomer spots are included on the array to ensure the hybridization stringency was sufficient. If the negative control signal is too high a No Call – NEG CTL is generated.

19
Each capture probe has six separate oligonucleotide spots on the microarray in six different areas. Mathematical algorithms, called spot filters, compare the array spot signals for a particular target as a set. Any individual spot signal in the target set that is determined to be an outlier is discarded. After applying the spot filters, the probe set must include four or more capture spots for a Call decision to be made for a target. Additionally, the coefficient of variation of spot intensities in the set must be less than or equal to 70%. If these requirements are not met a No Call - VARIATION results. The spot signal comparison algorithms protect against some hybridization failures and also against fluidics failures such as the partial filling of the hybridization chamber.
External controls are not provided with the RP Flex. However, five external control mixes (see Table 8 below) were provided to the clinical study sites for daily testing during the prospective clinical study. External controls were tested on each day of testing, utilizing one external negative control and one of four external positive controls (tested on a rotating basis) representing all of the RP Flex targets.
Table 8: External Controls Utilized in the Clinical Evaluations
External Control Expected Calls
RPNC10 Negative (Not Detected) RPPC11 Influenza B, Parainfluenza 4, hMPV RPPC12 RSV A, Parainfluenza 1, Adenovirus, Rhinovirus RPPC13 Influenza A, Influenza A/H1, RSV B, Parainfluenza 2, B. holmesii,
RPPC14 Influenza A, Influenza A/H3, Parainfluenza 3, hMPV, Bordetella parapertussis/Bordetella bronchiseptica, B. pertussis
The sponsor is also recommending the following in the product package insert: “Good laboratory practice recommends running external positive and negative controls regularly. Viral transport medium may be used as the external Negative Control, and previously characterized positive samples or negative sample spiked with well characterized target organisms may be used as external Positive Controls. Regardless of the choice of quality control materials, external controls should be used in accordance with local, state, federal accrediting organizations, as applicable.”
Specimen Stability
An analytical study was performed to establish the recommended transport and storage conditions for nasopharyngeal swab (NPS) specimens eluted in VTM that will be tested using the RP Flex.
A total of 14 viral and bacterial strains in negative natural clinical NPS in VTM were evaluated. These strains are representative of all of the 16 RP Flex targets. Each strain was prepared at Low Positive (2x LoD) and Moderate Positive (5x LoD) concentrations in pooled negative natural clinical NPS in VTM. The negative natural clinical NPS (collected in VTM) used for this study consisted of nasopharyngeal swab in VTM specimens that were previously screened to be negative for any respiratory

20
organisms in the RP Flex panel. Each sample was tested once with the RP Flex test and generated negative results for all RP Flex panel analytes.
Initial testing was performed to establish the baseline time point (t = 0) for the study, and additional aliquots of the samples were stored at each of the following temperature conditions: (1) 20-25°C, (2) 2-8°C, and (3) Frozen (≤-70°C).
At the designated time points, shown in Table 9 below, one aliquot of each strain at each concentration was tested with the RP Flex test in replicates of three. The 2-8°C and 20-25°C samples were tested immediately, while the frozen aliquots were thawed at room temperature for 10-30 minutes prior to testing.
Table 9: Overview of Specimen Stability Storage Conditions and Time Points
Test Time Point
Storage Temperature 20-25°C 2-8°C <-70°C
Baseline (0) X X X 4 hours X
N/A
N/A 6 hours X 24 hours
N/A
X X 72 hours X
N/A 75 hours X 15 days
N/A
X 30 days X 35 days X
X indicates the testing time point for each target N/A indicates the time point/storage condition was not part of the testing protocol.
The results of this specimen stability study support the stability claim for RP Flex testing of clinical NPS specimens preserved in VTM at the following storage conditions: 4 hours at 20-25°C, 72 hours at 2-8°C, and 30 days at <-70°C.
Simulated Nasopharyngeal Swabs in VTM Sample Matrix (Simulated NPS)
The RP Flex test is intended for use with nasopharyngeal swabs specimens (NPS) collected in Viral Transport Media (VTM). However, the collection, and screening of negative clinical natural NPS collected in VTM is burdensome. Additionally, such clinical specimens are likely to contain low concentrations of RP Flex targeted organisms which could lead to unexpected positive test results. Consequently, a simulated nasopharyngeal swab (Simulated NPS) matrix was developed and used to contrive samples for the majority of the analytical studies.
The Simulated NPS matrix was formulated to resemble the content of a clinical NPS specimen collected in VTM as closely as possible, such that the matrix would not artificially alter the performance of the test. A matrix comprised of 2.00E+03 HeLa cells/mL in Universal Transport Media (UTM) was selected as the composition of Simulated NPS. Analytical study demonstrated that 2.00E+03 HeLa cells/mL in UTM had similar DNA content as observed in NPS specimens collected in VTM from human

21
donors. Accordingly, Simulated NPS matrix for the contrived samples used for analytical testing was UTM containing HeLa cells at a concentration of 2.00E+03 cells/mL.
Equivalence of Simulated and Natural Clinical NPS
This study was designed to demonstrate the equivalence of Simulated NPS used in analytical studies, with clinically-derived natural NPS. As described in the “Simulated NPS” section previously, the Simulated NPS tested in this study was UTM containing HeLa cells at a concentration of 2.00E+03 cells/mL. The negative natural clinical NPS (collected in VTM) used for this study consisted of nasopharyngeal swab in VTM specimens that were previously screened to be negative for any respiratory organisms in the RP Flex panel.
Sixteen (16) of the 28 strains described in the “Detection Limit” section representing all of the RP Flex targets, were evaluated for their LoD performance in negative natural clinical NPS (collected in VTM). Freshly prepared samples in negative natural clinical NPS were tested in replicates of 20 at the LoD established for fresh Simulated NPS as detailed in the “LoD Studies” section. If all 20 replicates of the negative natural clinical NPS sample were detected (100%), 3-fold lower concentrations were tested until a detection rate ≤ 95% was obtained. If the initial detection rate was less than 95%, 3-fold higher concentrations were tested until the detection rate of the intended analyte was ≥ 95%. The performance of the test with samples prepared in negative natural clinical NPS and in Simulated NPS was considered to be equivalent if the LoD for the two sample types are within one dilution (i.e. 3-fold).
Confirmation of the LoD for the 16 organisms contrived in the negative natural clinical NPS is summarized in Table 10 below. In all cases, the LoDs for strains contrived in negative natural clinical NPS were determined to be equivalent to the LoDs for the strains contrived in Simulated NPS; all LoDs were within one dilution (+/- 3-fold) of the fresh Simulated NPS samples, meeting the criterion for equivalency.
Table 10: Comparison of LoDs of Fresh Simulated NPS Samples vs. Negative Natural Clinical NPS Samples
Strain
Target Detected
LoD (TCID50 or CFU/mL)
Fresh in Simulated NPS
Fresh in Negative Natural NPS
Adenovirus 4 (E) Adenovirus 4.10E-02 TCID50/mL 4.10E-02 TCID50/mL
Rhinovirus 39 (A) Rhinovirus 1.00E+01 TCID50/mL 1.00E+01 TCID50/mL Metapneumovirus 9 (A1) Human Metapneumovirus 3.00E+01 TCID50/mL 3.00E+01 TCID50/mL Metapneumovirus 8 (B2) Human Metapneumovirus 3.33E+00 TCID50/mL 1.00E+01 TCID50/mL
Influenza A/Brisbane/59/2007 (H1N1) Influenza A 3.00E+01 TCID50/mL 3.00E+01 TCID50/mL
Influenza A H1N1 1.00E+01 TCID50/mL 1.00E+01 TCID50/mL
Influenza A/Wisconsin/67/05 (H3N2) Influenza A H3N2 3.33E+00 TCID50/mL 1.11E+00 TCID50/mL

22
Influenza B/Florida/02/2006 Influenza B 3.00E+01 TCID50/mL 3.00E+01 TCID50/mL Parainfluenza 1 Parainfluenza 1 9.00E+01 TCID50/mL 9.00E+01 TCID50/mL Parainfluenza 2 Parainfluenza 2 1.00E+01 TCID50/mL 3.00E+01 TCID50/mL Parainfluenza 3 Parainfluenza 3 3.33E+00 TCID50/mL 1.00E+01 TCID50/mL Parainfluenza 4a Parainfluenza 4 2.70E+02 TCID50/mL 2.70E+02 TCID50/mL
RSV A (A2) RSV A 3.33E+00 TCID50/mL 1.11E+00 TCID50/mL RSV B (Wash/18537/62) RSV B 3.67E-01 TCID50/mL 3.67E-01 TCID50/mL
Bordetella parapertussis B. parapertussis/B. bronchiseptica 2.43E+03 CFU/mL 2.43E+03 CFU/mL
Bordetella holmesii B. holmesii 2.43E+03 CFU/mL 2.43E+03 CFU/mL Bordetella pertussis B. pertussis 8.10E+02 CFU/mL 2.43E+03 CFU/mL
Fresh vs. Frozen Study
In order to utilize frozen banked clinical samples in the evaluation of RP Flex to supplement the prospective clinical study data, and to use frozen simulated samples in analytical studies, an analytical study was conducted to demonstrate that preservation of samples (by freezing at ≤-70°C) does not affect the accuracy of the test results compared to freshly collected or freshly prepared samples.
The study evaluated the analytical sensitivity (LoD) of frozen samples of organisms prepared in Simulated NPS in comparison to LoD results of fresh samples prepared in Simulated NPS as described in the “Equivalence of Simulated and Natural Clinical NPS” study above. A panel of 16 strains, representing all of the RP Flex targets, was prepared in Simulated NPS and frozen and stored at ≤ -70°C until used in testing.
Each of these samples was tested in replicates of 20 at the same LoD established for fresh Simulated NPS as described in the “Equivalence of Simulated and Natural Clinical NPS” study above. If all 20 replicates of the frozen sample were detected (100%), 3-fold lower concentrations were tested until a detection rate of ≤ 95% was obtained. If the initial detection rate was less than 95%, 3-fold higher concentrations were tested until the detection rate of the intended analyte was ≥ 95%. The frozen Simulated NPS samples were considered to be equivalent to the fresh Simulated NPS samples, if their LoDs were within one dilution (i.e. 3-fold) of each other.
Confirmation of the LoD for the 16 frozen viral and bacterial samples contrived in the Simulated NPS is summarized in Table 11 below. All LoDs for the frozen Simulated NPS samples were found to be within one dilution (+/- 3-fold) of the fresh Simulated NPS samples, meeting the criterion for equivalency.

23
Table 11: Comparison of LoDs of Fresh vs. Frozen Viral and Bacterial Samples Contrived in the Simulated NPS (in VTM)
Strain
Target Detected
LoD (TCID50 or CFU/mL) Fresh in Simulated
NPS Frozen in Simulated
NPS Adenovirus 4 (E) Adenovirus 4.10E-02 TCID50/mL 4.10E-02 TCID50/mL Rhinovirus 39 (A) Rhinovirus 1.00E+01 TCID50/mL 1.00E+01 TCID50/mL
Metapneumovirus 9 (A1) Human Metapneumovirus 3.00E+01 TCID50/mL 3.00E+01 TCID50/mL Metapneumovirus 8 (B2) Human Metapneumovirus 3.33E+00 TCID50/mL 3.33E+00 TCID50/mL
Influenza A/Brisbane/59/2007 (H1N1) Influenza A 3.00E+01 TCID50/mL 1.00E+01 TCID50/mL
Influenza A H1N1 1.00E+01 TCID50/mL 3.00E+01 TCID50/mL
Influenza A/Wisconsin/67/05 (H3N2) Influenza A H3N2 3.33E+00 TCID50/mL 3.33E+00 TCID50/mL
Influenza B/Florida/02/2006 Influenza B 3.00E+01 TCID50/mL 1.00E+01 TCID50/mL Parainfluenza 1 Parainfluenza 1 9.00E+01 TCID50/mL 3.00E+01 TCID50/mL Parainfluenza 2 Parainfluenza 2 1.00E+01 TCID50/mL 3.33E+00 TCID50/mL Parainfluenza 3 Parainfluenza 3 3.33E+00 TCID50/mL 1.00E+01 TCID50/mL Parainfluenza 4a Parainfluenza 4 2.70E+02 TCID50/mL 9.00E+01 TCID50/mL
RSV A (A2) RSV A 3.33E+00 TCID50/mL 1.11E+00 TCID50/mL RSV B (Wash/18537/62) RSV B 3.67E-01 TCID50/mL 1.10E+00 TCID50/mL
Bordetella parapertussis B. parapertussis/B .bronchiseptica 2.43E+03 CFU/mL 2.43E+03 CFU/mL
Bordetella holmesii B. holmesii 2.43E+03 CFU/mL 7.29E+03 CFU/mL Bordetella pertussis B. pertussis 8.10E+02 CFU/mL 2.43E+03 CFU/mL
This fresh vs. frozen study demonstrated that freezing and thawing of samples did not have a significant impact on the sensitivity of the RP Flex detection of the target organisms. This supports the use of the frozen NPS samples in the RP Flex analytical and clinical validation studies.
d. Detection limit:
Limit of detection (LoD) studies were carried out with freshly-prepared samples in Simulated NPS matrix designed to resemble a natural clinical NPS specimen, as described in the “Simulated Nasopharyngeal Swabs in VTM Sample Matrix (Simulated NPS)” section previously. An equivalence study was performed which confirmed that the simulated matrix was equivalent to the natural clinical NPS matrix and does not impact RP Flex test performance. Refer to the “Equivalence of Simulated and Natural Clinical NPS” section for details of the study. The LoDs of the RP Flex were established with the 28 representative strains of organisms listed in Table 12 below. Identities of all viral and bacterial strains used in LoD testing were confirmed by PCR and bi-directional sequencing (BDS) using validated PCR systems for each RP Flex target.

24
Table 12: Viral and Bacterial Strains for LoD Testing
Organism Strain
Adenovirus
C (AdV-1) B (AdV-3) E (AdV-4)
Rhinovirus
A (Rhinovirus 39) B (Rhinovirus 14)
C (Rhinovirus C41)
Human Metapneumovirus
Metapneumovirus 9 (A1) Metapneumovirus 27 (A2) Metapneumovirus 3 (B1) Metapneumovirus 8 (B2)
Influenza A
Brisbane/59/2007 (H1N1) California/04/2009pdm09 (H1N1)
Wisconsin/67/05 (H3N2) Port Chalmers/1/73 (H3N2) Victoria/361/2011 (H3N2)
Influenza B
Florida/02/2006 Brisbane/60/2008
Massachusetts/02/2012 Parainfluenza 1 ATCC VR-94 Parainfluenza 2 ATCC VR-92 Parainfluenza 3 Zeptometrix #0810016CF Parainfluenza 4a ATCC VR-1378
Respiratory Syncytial Virus RSV A (A2)
RSV B (Wash/18537/62) Bordetella parapertussis ATCC 15311
Bordetella bronchiseptica ATCC 786 Bordetella holmesii ATCC 51541 Bordetella pertussis ATCC 9797
To determine the LoDs, these previously characterized and quantitated bacterial and viral strains were used to prepare a three-fold dilution series in Simulated NPS, and each concentration was tested in replicates of four. The preliminary LoDs were assessed to be the lowest concentration in which expected analytes were detected in all four replicates. The preliminary LoD for a specific strain was then confirmed by preparing and testing 20 additional replicates at that preliminary LoD concentration and demonstrating that the intended analyte is detected >95% of the time. If the detection rate was 100% (20/20), a further 20 replicates were tested at the next lowest concentration. In the event that a detection rate below 95% was observed (<19/20) a 3-fold higher concentration was tested.
The RP Flex results for the preliminary (upper row for each organism) and confirmatory (lower row for each organism) LoD tests are summarized in Table 13 and Table 14 for

25
viruses and in Table 15 for bacteria. The preliminary LoD levels are presented in bold, and the final confirmed LoD concentrations are identified by the gray shaded cells.
Table 13: Preliminary and Confirmatory LoD Results for Viral Targets
Strain Target Detected
Concentration (TCID50/mL)
8.10E+02
2.70E+02
9.00E+01
3.00E+01
1.00E+01
3.33E+00
1.11E+00
3.70E-01
1.23E-01
4.10E-02
1.40E-02
4.00E-03
Adenovirus 1 (C) Adenovirus 4/4 4/4 4/4 4/4 4/4 4/4 4/4 4/4 4/4 4/4 4/4 4/4 20/20 16/20
Adenovirus 3 (B) Adenovirus 4/4 4/4 4/4 4/4 4/4 4/4 4/4 1/4 1/4 - - - 20/20 7/20
Adenovirus 4 (E) Adenovirus - - 4/4 4/4 4/4 4/4 4/4 4/4 4/4 4/4 3/4 - 20/20 19/20
Rhinovirus 39 (A) Rhinovirus - - - - 4/4 4/4 2/4 1/4 3/4 - - - 19/20 18/20
Rhinovirus 14 (B) Rhinovirus - 4/4 3/4 4/4 3/4 3/4 0/4 - - - - - 20/20 19/20
Metapneumovirus 9 (A1) hMPV - - 4/4 4/4 4/4 3/4 1/4 - - - - - 20/20 18/20
Metapneumovirus 27 (A2) hMPV - - 4/4 4/4 4/4 4/4 4/4 4/4 3/4 4/4 0/4 0/4 20/20 16/20 11/20 8/20
Metapneumovirus 3 (B1) hMPV - - 4/4 4/4 3/4 1/4 1/4 - - - - - 20/20 20/20 8/20
Metapneumovirus 8 (B2) hMPV - - 4/4 4/4 4/4 4/4 3/4 - - - - - 20/20 19/20 20/20 18/20
Influenza A/Brisbane/59/2007 (H1N1)
Influenza A - - 4/4 4/4 3/4 2/4 1/4 - - - - - 19/20 17/20 8/20
A/H1 - - 4/4 4/4 4/4 3/4 4/4 - - - - - 19/20 20/20 12/20
Influenza A/California/04/2009pdm09 (H1N1)
Influenza A - - 4/4 4/4 3/4 1/4 1/4 - - - - - 20/20 16/20 12/20
A/H1 - - 4/4 4/4 4/4 2/4 3/4 - - - - - 20/20 20/20 11/20
Influenza A/Port Chalmers/1/73 (H3N2)
Influenza A - - - - 4/4 4/4 2/4 1/4 1/4 - - - 19/20 11/20
A/H3 - - - - 4/4 4/4 3/4 1/4 1/4 - - - 20/20 12/20
Influenza A/Victoria/361/2011 (H3N2)
Influenza A - - 4/4 4/4 4/4 4/4 4/4 4/4 3/4 4/4 2/4 - 19/20 18/20
A/H3 - - 4/4 4/4 4/4 4/4 4/4 4/4 4/4 2/4 2/4 - 20/20 19/20
Influenza A/Wisconsin/67/05 (H3N2)
Influenza A - - 4/4 4/4 4/4 4/4 3/4 - - - - - 20/20 18/20
A/H3 - - 4/4 4/4 4/4 4/4 3/4 - - - - - 20/20 18/20
Influenza B/Brisbane/60/2008 Influenza B - - - - 4/4 4/4 4/4 4/4 4/4 4/4 2/4 0/4
20/20 14/20
Influenza B/Florida/02/2006 Influenza B - - - - 4/4 3/4 2/4 0/4 1/4 - - - 20/20 18/20
Influenza B/Massachusetts/02/2012 Influenza B - - - - 4/4 4/4 4/4 4/4 4/4 4/4 2/4 1/4
19/20 17/20
Parainfluenza 1 Parainfluenza 1
- - 4/4 4/4 4/4 3/4 0/4 - - - - - 20/20 18/20 17/20
Parainfluenza 2 Parainfluenza 2
- - 4/4 4/4 3/4 4/4 1/4 - - - - - 20/20 20/20 17/20
Parainfluenza 3 Parainfluenza 3
4/4 4/4 4/4 4/4 4/4 4/4 1/4 2/4 0/4 - - - 19/20
Parainfluenza 4a Parainfluenza 4
4/4 4/4 4/4 4/4 0/4 - - - - - - - 20/20 18/20 14/20

26
RSV A (A2) RSV A - - 4/4 4/4 4/4 4/4 4/4 3/4 2/4 0/4 1/4 - 20/20 18/20
RSV B (Wash/18537/62) RSV B - - - - 4/4 4/4 4/4 4/4 1/4 - - - 20/20 14/20
Table 14: Preliminary and Confirmatory LoD Results for Rhinovirus C41 (C)
Strain Target Detected
Concentration (PFU/mL)*
6.56E+04
2.19E+04
7.29E+03
2.43E+03
8.10E+02
2.70E+02
9.00E+01
Rhinovirus C41 (C) Rhinovirus 4/4 4/4 3/4 3/4 2/4 0/4 0/4 20/20 20/20 20/20 17/20
* As there is no susceptible cell line to grow Rhinovirus C, the strain was cloned into a plasmid vector and transfected into WisL cells (primary human lung fibroblasts). Identity of the clone was confirmed by sequencing. The titer was established by qPCR using serial dilutions of Rhinovirus 16 as a surrogate to provide actual PFU/mL values for the standard curve. Therefore, it has been assumed that Rhinovirus 16 has similar virulence rates to Rhinovirus C.
Table 15: Preliminary and Confirmatory LoD Results for Bacterial Analytes
Strain Target Detected
Concentration (CFU/mL) 1.97E+05
6.56E+04
2.19E+04
7.29E+03
2.43E+03
8.10E+02
2.70E+02
9.00E+01
3.00E+01
Bordetella parapertussis Bordetella
parapertussis/ bronchiseptica
4/4 4/4 4/4 4/4 3/4 3/4 2/4 0/4 0/4
20/20 19/20
Bordetella bronchiseptica
Bordetella parapertussis/ bronchiseptica
- - - - 4/4 4/4 3/4 0/4 1/4
20/20 17/20
Bordetella holmesii Bordetella holmesii
- - - - 4/4 2/4 2/4 1/4 1/4 20/20 20/20 20/20 17/20
Bordetella pertussis Bordetella pertussis
- - - - 4/4 4/4 2/4 4/4 0/4 19/20
The final confirmed LoDs of the RP Flex targets determined in the LoD study for a panel of 28 strains are summarized in Table 16 and Table 17 for viral and bacterial organisms respectively. The final confirmed LoD values for each RP Flex target are shown in Table 18. In cases where multiple strains were tested, the final RP Flex LoD for a given target was assessed to be the highest LoD of the various strains.
Table 16: Confirmed RP Flex LoD Results for Viral Strains
Strain Confirmed LoD Titer (TCID50/mL)
Adenovirus 1 (C) 1.23E-01 Adenovirus 3 (B) 1.11E+00 Adenovirus 4 (E) 4.10E-02 Rhinovirus 39 (A) 1.00E+01

27
Rhinovirus 14 (B) 9.00E+01 Rhinovirus C14 (C) 2.43E+03*
Metapneumovirus 9 (A1) 3.00E+01 Metapneumovirus 27 (A2) 1.11E+00 Metapneumovirus 3 (B1) 1.00E+01 Metapneumovirus 8 (B2) 3.33E+00
Influenza A 3.00E+01 Influenza A/Brisbane/59/2007 (H1N1) 1.00E+01
Influenza A/California/04/2009pdm09 (H1N1) 1.00E+01 Influenza A/Port Chalmers/1/73 (H3N2) 3.33E+00 Influenza A/Victoria/361/2011 (H3N2) 1.23E-01 Influenza A/Wisconsin/67/05 (H3N2) 3.33E+00
Influenza B/Brisbane/60/2008 1.23E-01 Influenza B/Florida/02/2006 3.00E+01
Influenza B/Massachusetts/02/2012 1.23E-01 Parainfluenza 1 9.00E+01 Parainfluenza 2 1.00E+01 Parainfluenza 3 3.33E+00 Parainfluenza 4a 2.70E+02
RSV A (A2) 3.33E+00 RSV B (Wash/18537/62) 3.70E-01
* PFU/mL Table 17: Confirmed RP Flex LoD Results for Bacterial Strains
Strain Confirmed LoD Titer (CFU/mL) Bordetella parapertussis 2.43E+03
Bordetella bronchiseptica 2.43E+03 Bordetella holmesii 2.43E+03 Bordetella pertussis 8.10E+02
Table 18: Confirmed RP Flex LoD Results for Each Analyte
Analyte Confirmed LoD Titer (TCID50/mL or CFU/mL)
Adenovirus 1.11E+00 Rhinovirus (A/B) 9.00E+01
Rhinovirus (C) 2.43E+03* Human Metapneumovirus 3.00E+01
Influenza A 3.00E+01 Influenza A/ H1N1 1.00E+01 Influenza A/ H3N2 3.33E+00
Influenza B 3.00E+01 Parainfluenza 1 9.00E+01 Parainfluenza 2 1.00E+01 Parainfluenza 3 3.33E+00 Parainfluenza 4 2.70E+02
RSV A 3.33E+00 RSV B 3.70E-01
Bordetella parapertussis/ bronchiseptica 2.43E+03

28
Bordetella holmesii 2.43E+03 Bordetella pertussis 8.10E+02
* PFU/mL
e. Analytical Reactivity: The analytical reactivity of the RP Flex test was demonstrated with a comprehensive panel of 108 strains (see Table 19 below) representing temporal, evolutionary, and geographic diversity for each of the RP Flex panel organisms. The selection of strains to test was based on those detected by previously cleared assays including the Nanosphere RV+ Nucleic Acid Test (K103209) and BioFire FilmArray Respiratory Panel (K123620, K120267, K110764, and K103175), and on FDA recommendations during the pre-submission review process. Together with the 28 strains evaluated as part of the Limit of Detection Study, a total of 136 strains were evaluated for analytical inclusivity to RP Flex through wet testing.
Table 19: Organisms/Strains Tested in the Analytical Reactivity Study and the LoD Study
Virus/Bacteria Species/Subtype No. of Strains Tested
Analytical Reactivity LoD
Adenovirus
A 1 0 B1 2 1 B2 4 0 C 3 1 D 2 0 E 0 1 F 2 0
Influenza A H1N1 9 2 H3N2 4 3 H3N2v 3 0 H2N2 1 0 H2N3 1 0 H5N1 3 0 H5N3 1 0 H7N2 1 0 H7N7 2 0 H7N9 1 0 H9N2 2 0 H10N7 1 0
Influenza B N/A 10 3
Human Metapneumovirus
A1 1 1 A2 1 1 B1 1 1 B2 2 1
Parainfluenza Virus
1 1 1 2 1 1 3 3 1 4a 1 1 4b 2 0
RSV A 2 1 B 3 1

29
Rhinovirus A 8 1 B 5 1 C 2 1
Bordetella holmesii 3 1 pertussis 8 1 parapertussis 5 1 bronchiseptica 6 1
Total Number 108 28 The organisms in the inclusivity panel were prepared in Simulated NPS. Thirteen (13) strains of Influenza A (subtypes H2N2, H2N3, H5N1, H5N3, H7N2, H7N7, H7N9, H9N2 & H10N7) were prepared and tested at a BSL 3 laboratory. Each sample was tested with the RP Flex in triplicate at an initial concentration 3-fold higher than the LoD determined for each analyte. In cases where the expected targets were not detected in one or more replicates, concentrations at a 3-fold higher level were evaluated.
RP Flex demonstrated analytical reactivity to all 108 strains tested, with some strains requiring higher titers for detection. The individual strains and concentrations at which positive test results were obtained for all three replicates are presented by target organism in Table 20 though Table 28 below.
Table 20: Adenovirus Inclusivity Results
Adenovirus
Species
Serotype
Strain #
Source
Concentration (TCID50/mL)
Multiples of
LoD A 31 0810073CF Zeptometrix 1.11E+00 1x
B1 7 VR-7 ATCC 3.33E+00 3x 21 VR-1099 ATCC 3.33E+00 3x
B2
11 VR-12 ATCC 3.33E+00 3x 14 0810108CF Zeptometrix 3.33E+00 3x 34 VR-716 ATCC 3.33E+00 3x 35 VR-718 ATCC 1.00E+01 9x
C 2 111010 TriCore 3.33E+00 3x 5* 0810020CF Zeptometrix 8.10E+02 729x 6* 0810111CF Zeptometrix 2.70E+02 243x
D
26 0810117CF Zeptometrix 1.11E+00 1x 37 0810119CF Zeptometrix 1.11E+00 1x
F
40 0810084CF Zeptometrix 1.11E+00 1x 41 0810085CF Zeptometrix 1.11E+00 1x
*Based on in silico analysis, the oligonucleotide identities of all the tested Adenovirus C subtypes have very similar ranges. Based on the investigation of viral stocks titers using a quantitative TaqMan real-time PCR developed at Nanosphere that is specific for all Adenovirus species (note: the primers for the TaqMan assay are not the same primers used in the RP Flex), it appears that the amplifiable genome equivalents available in these two adenovirus viral stocks are significantly reduced comparing to that of the other adenovirus stocks tested in the study.

30
Table 21: Influenza A Inclusivity Results
Influenza A
Subtype
Strain
Source
Influenza A A/H1 or A/H3
Concentration (TCID50/mL)
Multiple of
LoD
Concentration (TCID50/mL)
Multiples of
LoD
H1N1
A/California/07/2009pdm09 IRR 9.00E+01 3x 9.00E+01 9x A/New Caledonia/20/99 Zeptometrix 9.00E+01 3x 9.00E+01 9x
A/New Jersey/8/76 TriCore 2.70E+02 9x 3.00E+01 3x A/NWS/33 TriCore 3.00E+01 1x 3.00E+01 3x
A/PR/8/ 34 Charles River Labs 3.00E+01 1x 3.00E+01 3x
A1/Denver/1/57 TriCore 3.00E+01 1x 3.00E+01 3x A1/FM/1/47 TriCore 3.00E+01 1x 3.00E+01 3x
A/ Solomon Islands/3/2006 Zeptometrix 3.00E+01 1x 3.00E+01 3x A/Hawaii/15/2001 IRR 2.70E+02 9x 2.70E+02 27x
H3N2
A/ Aichi/ 68 Charles River Labs 1.00E+01 <1x 1.00E+01 3x
A/ Hong Kong/ 8/ 68 Charles River Labs 3.00E+01 1x 1.00E+01 3x
A/ Victoria/ 3/ 75* Charles River Labs 2.43E+03 81x 2.43E+03 729x
A/Ohio/02/2012 IRR 2.70E+02 9x 2.70E+02 81x
H3N2v A/Indiana/08/2011 IRR 1.00E+01 <1x 1.00E+01 3x
A/Minnesota/11/2010** IRR 2.43E+03 81x 9.00E+01 27x A/Indiana/10/2011 IRR 1.00E+01 <1x 3.00E+01 9x
H2N2 Japan/305/1957 MRI 9.00E+01 3x - - H2N3 Mallard/Albert79/03 MRI 9.00E+01 3x - -
H5N1
A/Duck/Hunan/795/02 MRI 9.00E+01 3x - - A/Chicken/Korea/IS/2006 MRI 9.00E+01 3x - - A/Scaly-breasted Munia/
HongKong/2006 MRI 9.00E+01 3x - -
H5N3 A/Duck/Singapore/645/1997 MRI 8.10E+02 27x - -
H7N2 A/New York/107/2003 MRI 9.00E+01 3x - -
H7N7 A/Netherlands/219/2003 MRI 2.70E+02 9x - -
Equine-1/Prague/1956 MRI 9.00E+01 3x - -
H7N9 Anhui/01/2013 MRI 9.00E+01 3x - -
H9N2 Hong Kong/1073/99 MRI 9.00E+01 3x - -
Chicken/Hong Kong/G9/97 MRI 9.00E+01 3x - -
H10N7 Chick/Germany/n/1949 MRI 9.00E+01 3x - -

31
*Based on in silico analysis, the oligonucleotide identities of all the tested Influenza A/H3N2 strains have very similar ranges. Based on the investigation of viral stocks titers using a quantitative TaqMan real-time PCR developed at Nanosphere that is specific for Influenza A/H3 strains (note: the primers for the TaqMan assay are not the same primers used in the RP Flex), it appears that the amplifiable genome equivalents available in this Influenza A/H3N2 viral stock are significantly reduced comparing to that of the other Influenza A/H3N2 stocks tested in the study. ** Based on in silico analysis, the oligonucleotide identities to this strain have slightly lower ranges than the other two H3N2v strains tested.
Table 22: Influenza B Inclusivity Results
Type
Strain
Source Concentration
(TCID50/mL) Multiples
of
Influenza B
B/ Allen/45 TriCore 9.00E+01 3x B/Florida/07/2004 TriCore 9.00E+01 3x
B/GL/1739/54 TriCore 9.00E+01 3x B/Hong Kong/5/72 ATCC 9.00E+01 3x
B/Malaysia/2506/2004 TriCore 9.00E+01 3x B/Maryland/1/59 TriCore 9.00E+01 3x B/Taiwan/2/62 TriCore 9.00E+01 3x
B/Wisconsin/01/2010 IRR 9.00E+01 3x B/ Lee/40 Charles River Lab 9.00E+01 3x
B/Florida/04/2006 Zeptometrix 9.00E+01 3x
Table 23: Human Metapneumovirus Inclusivity Results
Subtype
Strain
Source Concentration (TCID50/mL)
Multiples of LoD
hMPV A1 16 Zeptometrix 0810161CF 9.00E+01 3x hMPV A2 20 Zeptometrix 0810163CF 9.00E+01 3x hMPV B1 5 Zeptometrix 0810158CF 9.00E+01 3x
hMPV B2 4 Zeptometrix 0810157CF 9.00E+01 3x
18 Zeptometrix 0810162CF 9.00E+01 3x
Table 24: Parainfluenza 1-4 Inclusivity Results
Type Source/Strain Concentration (TCID50/mL)
Multiples of LoD
Parainfluenza 1 Zeptometrix 0810014CF 2.70E+02 3x
Parainfluenza 2 Zeptometrix 0810015CF 3.00E+01 3x
Parainfluenza 3 ATCC VR-93* 2.70E+02 81x BEI NR-3233 3.00E+01 9x
TriCore (ATCC VR-1782) 9.00E+01 27x
Parainfluenza 4
a Zeptometrix 0810060CF 8.10E+02 3x
b VR-1377 8.10E+02 3x
Zeptometrix 0810060BCF 8.10E+02 3x *For Parainfluenza 3, the extracted eluate from the three strains tested in the inclusivity study were each evaluated with PCR/bi-directional sequencing, and the sequence information were used to assess the homology to the RP Flex oligos. Based on the in silico analysis, the three strains have the identical homology to the RP Flex oligos, indicating that the apparent difference in sensitivity was not due to sequence diversity in the gene targeted by the RP Flex. The apparent variation in the sensitivity of the RP Flex test for these strains is likely attributable to inconsistencies in the quantification of the viral stocks.

32
Table 25: RSV Inclusivity Results
Subtype
Source/Strain
Concentration (TCID50/mL)
Multiples of LoD
Respiratory Syncytial Virus A ATCC VR-26 1.00E+01 3x
Zeptometrix 0810040ACF 1.00E+01 3x
Respiratory Syncytial Virus B
Zeptometrix 0810040CF 1.11E+00 3x ATCC VR-1400 1.11E+00 3x ATCC VR-955 3.33E+00 9x
Table 26: Rhinovirus A and B Inclusivity Results
Rhinovirus Species
Strain
Source
Concentration (TCID50/mL)
Multiples of LoD
Rhinovirus A
1 Zeptometrix 0810012CFN 2.70E+02 3x 2 ATCC VR-482 2.70E+02 3x 7 ATCC VR-1601 2.70E+02 3x
16 ATCC VR-283 2.70E+02 3x 34 ATCC VR-507 2.70E+02 3x 57 ATCC VR-1600 2.70E+02 3x 77 ATCC VR-1187 2.70E+02 3x 85 ATCC VR-1195 2.70E+02 3x
Rhinovirus B
3 ATCC VR-483 2.70E+02 3x 17 ATCC VR-1663 2.70E+02 3x 27 ATCC VR-1137 2.70E+02 3x 42 ATCC VR-338 2.70E+02 3x 83 ATCC VR-1193 2.70E+02 3x
Table 27: Rhinovirus C Inclusivity Results
Rhinovirus Species Strain Source Concentration (PFU/mL)*
Multiples of LoD
Rhinovirus C C2 UW-Madison 7.29E+03 3x
C15 UW-Madison 7.29E+03 3x *As there is no susceptible cell line to grow Rhinovirus C, the strains were cloned into a plasmid vector and transfected into WisL cells (primary human lung fibroblasts). All were sequenced to confirm identity. The titers were established by qPCR using serial dilutions of Rhinovirus 16 as a surrogate to provide actual PFU/mL values for the standard curve. Therefore, it has been assumed that Rhinovirus 16 has similar virulence rates to Rhinovirus C.
Table 28: Bordetella Species Inclusivity Results
Bordetella Species Source RP Flex Target
Concentration (CFU/mL)
Multiples of LoD
B. pertussis
ATCC 51445
B. pertussis
2.43E+03 3x ATCC 10380 2.43E+03 3x ATCC 9340 2.43E+03 3x
ATCC BAA-589 2.43E+03 3x ATCC BAA-1335 2.43E+03 3x
ATCC 53894 2.43E+03 3x ATCC 9306 2.43E+03 3x ATCC 8467 7.29E+03 9x

33
B. parapertussis
ATCC 15237
Bordetella Parapertussis/ bronchiseptica
7.29E+03 3x ATCC 9305 7.29E+03 3x
ATCC BAA-587 7.29E+03 3x ATCC 15989 7.29E+03 3x Zeptometrix
0801461
2.19E+04
9x
B. bronchiseptica
ATCC 4617
Bordetella
Parapertussis/ bronchiseptica
7.29E+03 3x ATCC 7773 7.29E+03 3x ATCC 785 7.29E+03 3x
ATCC 14064 7.29E+03 3x ATCC 10580 7.29E+03 3x ATCC 19395 7.29E+03 3x
B. holmesii
Zeptometrix 0801464
B. holmesii
2.19E+04
9x
ATCC 700053 2.43E+03 1x ATCC 700052 2.43E+03 1x
Supplemental Adenovirus Reactivity Information (in silico analyses):
In silico analysis predicts that the RP Flex will detect Adenovirus species G as the oligo sequence match to the target sequence for Adenovirus G is identical to that for Adenovirus A.
f. Analytical Specificity/Cross-reactivity Evaluation:
An analytical specificity study was carried out to assess the potential for false positive results due to cross-reactivity between RP Flex assays and in-panel or non-panel bacterial, viral, and fungal organisms known or expected to be present in the upper respiratory system and that may be present in NPS.
The RP Flex analytical specificity study assessed the performance of the RP Flex against organisms using contrived and clinical samples of strains that are:
1) Phylogenetically-related to RP Flex target organisms, 2) Clinically relevant (colonize the upper respiratory tract or cause respiratory
symptoms), 3) Common skin flora or laboratory contaminants, or 4) Microorganisms with which much of the human population may have been
infected (e.g. Herpes Simplex Virus), and 5) In-panel organisms (tested for cross-reactivity to other RP Flex targets).
The viral and bacterial samples were contrived in Simulated NPS at high concentrations (1.00E+05 TCID50/mL for viral targets and at 1.00E+06 CFU/mL for bacterial and fungal targets, except for Mumps virus which was tested at the highest available concentration of 1.60E+04 TCID50/mL). Four (4) organisms which were not available as

34
titered stocks were evaluated using genomic DNA at 1.00E+06 copies/mL. All samples were tested in triplicate with the RP Flex.
A total of 107 organisms were tested at high titer for analytical specificity (exclusivity), including 46 bacteria/fungi (Table 29), 26 viruses (Table 30), 22 in-panel organisms from the LoD Study, and 13 additional influenza A virus strains with other hemagglutinin (HA) types (Table 31).
Any RP Flex positive result with an exclusivity panel organism was tested additional six times to further assess any potential reactivity with the RP Flex probes. Additionally, it was anticipated based on feasibility studies that some Enterovirus strains may cross-react with Rhinovirus probes, and in cases of cross-reactivity lower concentrations were assessed.
Table 29: Bacterial and Fungal Organisms Tested for RP Flex Analytical Specificity
Genus
Species
Strain Number
Acinetobacter baumannii ATCC 19606 Bordetella avium ATCC 35086 Bordetella hinzii ATCC 51784 Bordetella petrii ATCC BAA-461 Bordetella trematum ATCC 700309 Candida albicans ATCC 18804 Candida glabrata ATCC 38326 Chlamydophila pneumoniae ATCC VR-1360 Chlamydia trachomatis Serovar D ATCC VR-885 Corynebacterium pseudodiphtheriticum ATCC 10700 Corynebacterium diphtheriae ATCC 14779 Corynebacterium striatum ATCC BAA-1293 Escherichia coli ATCC 25922 Haemophilus influenzae ATCC 49144 Haemophilus parainfluenzae ATCC 9796 Klebsiella pneumoniae subsp. pneumoniae ATCC 13883 Lactobacillus acidophilus Zeptometrix 0801540 Lactobacillus plantarum ATCC BAA-793 Legionella pneumophilia ATCC 33152 Legionella longbechiae ATCC 33462 Legionella micdadei ATCC 33204 Listeria innocua ATCC 51742 Listeria monocytogenes serotype 4b ATCC 19115 Moraxella (Branhamella) catarrhalis ATCC 43617 Mycobacterium tuberculosis ATCC BAA-2237D-2 a Mycoplasma genitalium ATCC 49123 a Mycoplasma hominis ATCC 27545-TTR Mycoplasma pneumoniae ATCC 15531-TTR Neisseria elongata subsp. elongata ATCC 25295 Neisseria gonorrhoeae ATCC 31426 Neisseria meningitidis ATCC 53415D-5 a Neisseria lactamica ATCC 23970 Neisseria mucosa ATCC 49233 Neisseria sicca ATCC 29256

35
Pneumocystis jirovecii Erasme-Belgium-Clinical Sample Proteus vulgaris ATCC 6380 Pseudomonas aeruginosa ATCC 27853 Serratia marcescens ATCC 29021 Staphylococcus aureus subsp. aureus ATCC 12600 Staphylococcus epidermidis ATCC 12228 Staphylococcus haemolyticus ATCC 29970 Streptococcus agalactiae ATCC 12386 Streptococcus pneumoniae ATCC 6303 Streptococcus pyogenes ATCC 14289 Streptococcus salivarius ATCC 13419 Ureaplasma urealyticum ATCC 27618 a
a Genomic DNA tested at 1.00E+06 copies/mL Table 30: Viral Organisms Tested for RP Flex Analytical Specificity
Virus Name Type Source/Strain Number Bocavirus - Clinical Sample Coronavirus 229E Zeptometrix 0810229CF Coronavirus NL63 Zeptometrix 0810228CF Coronavirus OC43 Zeptometrix 0810024CF Coronavirus HKU1 LIJ-Clinical Sample Cytomegalovirus - ATCC VR-977 Enterovirus A Type 71 Zeptometrix 0810047CF Enterovirus A Coxsackievirus A2 ATCC VR-1550 Enterovirus A Coxsackievirus A10 Zeptometrix 0810106CF Enterovirus B Coxsackievirus A9 Zeptometrix 0810017CF Enterovirus B Coxsackievirus B4 ATCC VR-184 Enterovirus B Coxsackievirus B5 ATCC VR-185 Enterovirus B Echovirus 6 Zeptometrix 0810076CF Enterovirus B Echovirus 9 Zeptometrix 0810077CF Enterovirus B Echovirus 11 Zeptometrix 0810023CF Enterovirus B Echovirus 30 Zeptometrix 0810078CF Enterovirus C Coxsackievirus A21 Zeptometrix 0810235CF Enterovirus C Coxsackievirus A24 ATCC VR-1662 Enterovirus C Poliovirus 2 (attenuated) ATCC VR-301 Enterovirus C Poliovirus 3 (attenuated) ATCC VR-193 Enterovirus D Type 68 ATCC VR-561 Epstein Barr Virus - Zeptometrix 0810008CF Herpes Simplex virus Type 1 Zeptometrix 0810005CF Measles - ATCC VR-24 Mumps virus - ATCC VR-106 Varicella-Zoster virus - Zeptometrix 0810026CF
Table 31: In-Panel RP Flex Organisms (Viruses and Bacteria) and Additional Influenza A Virus Strains with Other Hemagglutinin (HA) Types Tested for Analytical Specificity
Bacteria/Virus Name
Type
Source/Strain Number Adenovirus A Type 31 Zeptometrix ×810073CF Adenovirus D Type 26 Zeptometrix 0810117CF Adenovirus D Type 37 Zeptometrix 0810119CF Adenovirus F Type 40 Zeptometrix 0810084CF Adenovirus F Type 41 Zeptometrix 0810085CF

36
Adenovirus E Type 4 Zeptometrix 0810070CF Bordetella holmesii - ATCC 51541 Bordetella pertussis - ATCC 9797 Influenza A /Brisbane/59/2007 H1N1 TriCore Influenza A /Wisconsin/67/05 H3N2 Zeptometrix N/A Influenza A/California/04/2009pdm09
H1N1 - pandemic
TriCore
Influenza A/Victoria/361/2011 H3N2 Zeptometrix 0810240CF Influenza A H2N2 a Japan/305/1957 Influenza A H5N1 a A/Duck/Hunan/795/02 Influenza A H5N1 a A/Chicken/Korea/IS/2006
Influenza A H5N1 a
Scaly-breasted Munia/HongKong/2006
Influenza A H7N2 a New York/107/2003 Influenza A H7N7 a Netherlands/219/2003 Influenza A H7N9 a Anhui/01/2013 Influenza A H9N2 a Hong Kong/1073/99 Influenza A H2N3 a Mallard/Albert79/03 Influenza A H5N3 a Duck/Singapore/645/1997 Influenza A H7N7 a Equine-1/Prague/1956 Influenza A H9N2 a Chicken/Hong Kong/G9/97 Influenza A H10N7 a Chick/Germany/n/1949 Influenza B /Florida/02/2006 - TriCore Metapneumovirus 9 Type A1 TriCore Metapneumovirus 8 Type B2 TriCore Parainfluenza 1 - TriCore VR-94 Parainfluenza 2 - TriCore VR-92 Parainfluenza 3 - Zeptometrix 0810016CF Parainfluenza 4a - TriCore VR-1378 Respiratory Syncytial Virus Type A2 TriCore VR-1540 Respiratory Syncytial Virus Type B TriCore VR-1580 Rhinovirus 14 Type B TriCore
a Prepared and tested at a BSL 3 laboratory.
The 46 bacteria or fungi strains (as listed in Table 29 above) tested for analytical specificity on the RP Flex all returned “Not Detected” results at the concentrations tested, with the exception of Pneumocystis jirovecii (from a clinical sample), which gave “Rhinovirus detected” results in all three replicates.
In silico analysis determined that Pneumocystis jirovecii sequences have a maximum Oligo Identity to RP Flex targets of 67% and therefore Pneumocystis jirovecii was not predicted to be cross-reactive to RP Flex Rhinovirus probes. This suggests that the clinical sample may have been contaminated by Rhinovirus which is a common organism in clinical samples. Additional testing was performed using two other Pneumocystis jirovecii positive clinical samples obtained from the same source. Test results with these samples showed Rhinovirus in 1/3 and 3/3 replicates, respectively. To investigate the Pneumocystis jirovecii clinical samples for potential contamination, extracted nucleic acids from all seven Rhinovirus positive tests were evaluated with an analytically validated PCR/BDS Rhinovirus assay. PCR/ BDS test results confirmed the presence of Rhinovirus in all seven samples.

37
The RP Flex results for the representative serotypes from Enterovirus A, B, C and D (a total of 15 strains listed in Table 30 above) are shown in Table 32 below. All Enterovirus A and B serotypes tested were exclusive to all RP Flex targets, with no cross reactivity observed at the concentrations tested. However, for three of the four Enterovirus C serotypes (Coxsackievirus A24, Poliovirus 2, and Poliovirus 3) tested at high titer, there was reported false detection of Rhinovirus. To further characterize the cross-reactivity, additional tests with these strains were performed at a lower titer. The test results indicated that, Poliovirus 2, which was detected in 2 of 3 replicates at high titer (1.00E+05 TCID50/mL) was not detected at a 3x lower concentration (3.33E+04 TCID50/mL). With Coxsackievirus A24 and Poliovirus 3, cross-reactivity with Rhinovirus was detected in all three replicates at 9x (8.10E+02 TCID50/mL) or 27x (2.43E+03 TCID50/mL) the RP Flex Rhinovirus LoD (9.00E+01 TCID50/mL). RP Flex tests of Enterovirus 68 at high titer reported cross-reactivity with Rhinovirus in 2/3 tests. Additional testing at 3x lower titer of 3.33E+04 TCID50/mL, did not detect Rhinovirus in any of the three replicates.
Table 32: Analytical Specificity Testing for Enterovirus Strains
Organism
Strain # Tested
Concentration (TCID50/mL)
Rhinovirus
Detected
Enterovirus A Type 71 Zeptometrix 0810047CF 1.00E+05 0/3 Enterovirus A Coxsackievirus A2 ATCC VR-1550 1.00E+05 0/3 Enterovirus A Coxsackievirus A10 Zeptometrix 0810106CF 1.00E+05 0/3 Enterovirus B Coxsackievirus A9 Zeptometrix 0810017CF 1.00E+05 0/3 Enterovirus B Coxsackievirus B4 ATCC VR-184 1.00E+05 0/3 Enterovirus B Coxsackievirus B5 ATCC VR-185 1.00E+05 0/3 Enterovirus B Echovirus 6 Zeptometrix 0810076CF 1.00E+05 0/3 Enterovirus B Echovirus 9 Zeptometrix 0810077CF 1.00E+05 0/3 Enterovirus B Echovirus 11 Zeptometrix 0810023CF 1.00E+05 0/3 Enterovirus B Echovirus 30 Zeptometrix 0810078CF 1.00E+05 0/3 Enterovirus C Coxsackievirus A21 Zeptometrix 0810235CF 1.00E+05 0/3
Enterovirus C Coxsackievirus A24
ATCC VR-1662
1.00E+05 3/3 8.10E+02 3/3 2.70E+02 0/3
Enterovirus C Poliovirus 2 (attenuated)
ATCC VR-301 1.00E+05 2/3
3.33E+04 0/3
Enterovirus C Poliovirus 3 (attenuated)
ATCC VR-193 1.00E+05 3/3 2.43E+03 3/3 8.10E+02 1/3
Enterovirus D Type 68
ATCC VR-561 1.00E+05 2/3
3.33E+04 0/3
Based on in silico analyses, a number of Enterovirus strains have a relatively high homology to RP Flex Rhinovirus oligos, with percent identities to Rhinovirus RP Flex oligos of up to 84%. As a result, occasional cross- reactivity at high titer was expected.

38
The Enterovirus strains/subtypes which gave the highest homology to Rhinovirus probes (84%) are presented below in Table 33.
Table 33: Distribution of Enterovirus Sequences with Highest Percent Identity (84%) to RP Flex Rhinovirus Oligos
Enterovirus Strains/Subtypes Number of Sequences
Human poliovirus 1 142 Human poliovirus 2 123 Enterovirus C 49 Enterovirus 68 39 Coxsackievirus A24 35 Human poliovirus 3 12 Human enterovirus 70 8 Coxsackievirus A13 7 Coxsackievirus A11 4 Coxsackievirus A17 4 Coxsackievirus A18 4 Coxsackievirus A20 4 Enterovirus C96 4 Enterovirus A90 3 Coxsackievirus A15 2 Human enterovirus 94 2 Human enterovirus C99 2 Enterovirus A91 1 Enterovirus D 1 Human Enterovirus Hangzhou13-02 1 Human Enterovirus Ningbo3-02 1
The observed cross-reactivity of the RP Flex Rhinovirus oligos to select strains of Enterovirus and the potential cross-reactivity of the RP Flex Rhinovirus oligos to other strains of Enterovirus based on in silico analyses are indicated as a limitation in the product package insert: “Due to the genetic similarity between human Rhinovirus and Enterovirus, some strains of Enterovirus may be detected as Rhinovirus. Cross-reactivity with Human poliovirus 2, Human poliovirus 3, Enterovirus D68, and Coxsackievirus A24 was demonstrated through empirical testing.”
Eleven (11) additional viruses (listed in Table 30 above) were also tested at high titer for exclusivity to the RP Flex. All were negative for RP Flex targets. A summary of these test results are presented in Table 34 below.
Table 34: Analytical Specificity Testing for Other Non-Panel Viral Strains
Organism
Source and Strain Information Tested
Concentration (TCID50/mL)
RP Flex Target
Detected
Bocavirus Erasme-Belgium-Clinical Sample N/A 0/3 Coronavirus 229E Zeptometrix 0810229CF 1.00E+05 0/3 Coronavirus NL63 Zeptometrix 0810228CF 1.00E+05 0/3

39
Coronavirus OC43 Zeptometrix 0810024CF 1.00E+05 0/3 Coronavirus HKU1 LIJ-Clinical Sample N/A 0/3 Cytomegalovirus ATCC VR-977 1.00E+05 0/3 Epstein Barr Virus Zeptometrix 0810008CF 1.00E+06* 0/3 Herpes Simplex virus Type 1 Zeptometrix 0810005CF 1.00E+05 0/3 Measles ATCC VR-24 1.00E+05 0/3 Mumps virus ATCC VR-106 1.60E+04 0/3 Varicella-Zoster virus Zeptometrix 0810026CF 1.00E+05 0/3 *Titer in genome equivalents/mL
The 22 in-panel organisms from the LoD study and the 13 Influenza A HA subtypes other than A/H1 and A/H3 (listed in Table 31 above) were tested in triplicate at 1.00E+05 TCID50/mL for the viral targets and at 1.00E+06 CFU/mL for the bacterial and fungal targets. All strains listed in Table 31 generated the expected results for the high titer organisms in all replicates. Additionally, there were no false positive results generated at the concentrations tested.
g. Assay cut-off:
The presence or absence of each target analyte is determined by the mean intensity of target capture spots relative to the Signal Detection Threshold. The forward and reverse PCR primer oligonucleotides as well as the capture and mediator oligonucleotides in the RP Flex test are designed to eliminate sequence-related cross-reactivity, thereby ensuring that the non-specific target signal intensities at capture spots are similar to the microarray background signal. By contrast, target amplicon hybridization to complementary capture and mediator probes are expected to give signals that are well-separated from negative capture spots.
After completion of the RP Flex hybridization step, the microarray is placed into the Verigene Reader where a camera detects light scattered from the different analyte-specific capture oligo spots. Each target capture is represented by a total of six replicate spots on the RP Flex microarray and the average intensity from these spots is used in the analysis. Multiple images of each array are taken at increasing exposures times and the final target group mean intensity value for an analyte is assigned at the shortest exposure at which the intensity exceeds the Signal Detection Threshold. If none of the target signal exceeds the threshold for any exposure, the mean spot intensity is evaluated at the longest exposure taken. With this imaging and analysis design, a signal detection threshold of 30,000 was established to generate a Detected call for the 15 viral target spot groups, three bacterial target spot groups, as well as two assay controls within the RP Flex (see Table 35 below).
Table 35: Target Spot Groups on the RP Flex Reported Target Target Spot Group
Influenza A Influenza A Influenza A/H1 Influenza A/H1 Influenza A/H3 Influenza A/H3

40
Influenza B Influenza B RSV A RSV A RSV B RSV B
Adenovirus
Adenovirus B/E Adenovirus C
hMPV
Human Metapneumovirus A Human Metapneumovirus B
Parainfluenza 1 Parainfluenza 1 Parainfluenza 2 Parainfluenza 2 Parainfluenza 3 Parainfluenza 3 Parainfluenza 4 Parainfluenza 4 Rhinovirus Rhinovirus Bordetella parapertussis/bronchiseptica Bordetella
B. pertussis B. pertussis B. holmesii B. holmesii
Internal Controls
Hybridization Control Process Control
In order to demonstrate the appropriateness of the cut-off value of the RP Flex, a Cut-off Verification study utilizing image analysis data from the RP Flex LoD Study was conducted. Specifically the target mean intensity values from the final 20 confirmatory tests at the limit of detection for the 28 strains contrived in simulated NPS media and evaluated while fresh were used for this study. With replicates of 20 for each of the 28 samples and 20 unique target spot groups evaluated per test, a total of 11200 data points were assessed in this Cut-off Verification study. Of these, 1860 data points were expected to be positive. However, since the dataset is at the established strain LoD and some samples were detected in 19/20 replicates and these were expected to provide false negative results.
A logistic fit plot of Expected RP Flex Results by observed Target Mean Intensity is shown in Figure 1 for all of the target groups on the RP Flex panel. The signal detection threshold is represented by the vertical red line in the figure. It is evident that the positive signals are well separated from the negative target signals, and that the threshold value clearly distinguishes the “True Positives” (●) from the “True Negatives” (●). As presented in Table 36 below, with this threshold there were 1844 True Positives, 9340 True Negatives, no discrepant false-positive result and 16 false negative results.

41
Figure 1: Logistic Fit of Expected Result by Target Mean Group (The Signal Detection Threshold at 30,000 is shown as the vertical red line)
Table 36: Call Assessment for Signal Detection Threshold
Legend Description N
● True Positive 1844 ● True Negative 9340 ● False Positive 0 * False Negative 16
Thirteen (13) of the 16 False Negatives were expected given the LoD confirmatory testing results of 19/20 at the sample/target LoD. It is notable that the signal intensity in these cases is similar to the signals for the expected negative target spots (lower left corner of Figure 1). This suggests that the target organism at this low titer did not have significant amplification during the RT-PCR process.
Two (2) of the remaining three false negative results were for Adenovirus C capture targets with Adenovirus 4 (E) sample in which the Adenovirus B/E capture was detected. Both of these cases had relatively high signals (18643 and 27229), just below the threshold. These two results are readily observed in Figure 1. Note that for an

42
Adenovirus Detected call, detection at either target spot group is sufficient, thus a false negative call is not generated in these cases.
The final false negative result occurred with the Extraction Control target with Influenza B sample. Since the Influenza B target was detected, the extraction control result did not impact the expected target call.
It is apparent in Figure 1 that the provided Signal Detection Threshold of 30,000 should be appropriate to make a reliable ‘Detected’ or ‘Not Detected’ decision. The threshold is able to clearly identify the targets that have been amplified in the assay and is well separated from the background or negative target signals.
h. Interfering Substances:
An analytical study was performed to assess the potential inhibitory effects of exogenous and endogenous substances that may be commonly found in nasopharyngeal specimens (NPS). Three RP Flex target organisms − one DNA virus (Adenovirus), one RNA virus (Influenza A), and one gram-negative bacterium (Bordetella pertussis) − were individually challenged with various exogenous substances at medically-relevant “worst-case” concentrations. The selected organisms for testing in this study and the concentrations tested are listed in Table 37 below.
Table 37: Representative Organisms/Source and Concentrations for the Interference Study
Organism
Source/Strain Concentration
(3x LoD) Adenovirus 3 (B) Zeptometrix #0810062CF 3.33E+00 TCID50/mL
Influenza A (H1N1) TriCore Influenza A/Brisbane/59/2007 9.00E+01 TCID50/mL
Bordetella pertussis ATCC 9797 2.43E+03 CFU/mL
The full panel of exogenous and endogenous interferents tested in this study is shown in Table 38 below. In addition, the interference study evaluated materials that are used to collect (swabs) or store (viral transport medium) NPS specimens, as listed in Table 39.
Table 38: Potentially Interfering Substances
Interferents Active Ingredient Amount Wal-Four® Nasal Spray Phenylephrine 10% v/v
Anefrin Nasal Spray Oxymetazoline 10% v/v Saline Nasal Spray NaCl 10% v/v
Similasan Sinus Relief™ Luffa operculata 1.0% v/v Anbesol® (Anesthetic) Benzocaine 0.5% v/v of sample
Qvar® (Nasal corticosteroid) Beclomethasone dipropionate 1.60E+01 μg/mL Dexacort® (Nasal corticosteroid) Dexamethasone 5.00E+01 μg/mL AeroBid® (Nasal corticosteroid) Flunisolide 5.80E+01 μg/mL
Triamcinolone (Nasal corticosteroid) Triamcinolone acetonide 5.50E+00 μg/mL Pulmicort® (Nasal corticosteroid) Budesonide 2.50E+01 μg/mL
Elocon® (Nasal corticosteroid) Mometasone furoate 2.50E+00 μg/mL

43
Flonase® (Nasal corticosteroid) Fluticasone propinoate 5.00E+00 μg/mL Veramyst® Fluticasone furoate 10% v/v
Sulfur (Boiron®) Sulfur 4.50E+00 mg/mL Menthol Menthol 5.00E-01 mg/mL
Mupirocin Mupirocin 5.00E+00 μg/mL Antibacterial, systemic Tobramycin 1.50E-02 mg/mL
Mucin Mucin, bovine submaxillary Type I-S 1.00E-01 mg/mL Mucin Mucin, porcine stomach Type II 1.00E-01 mg/mL Mucin Mucin, porcine stomach Type III 1.00E-01 mg/mL
Tamiflu® (Anti-viral) Oseltamivir Phosphate 3.30E+01 μg/mL Galphimia Glauca (Boiron®) Galphimia Glauca 1.15E+02 μg/mL
Histaminum Hydrochloricum (Boiron®) Histaminum Hydrochloricum 1.15E+02 μg/mL Relenza™ (Anti-viral) Zanamivir 1.00E+01 mg/mL
FluMist® Influenza Vaccine Live, Intranasal
-
Single dose
Human Blood - 5% v/v
Human DNA
-
2.00E-01 ng/μL 2.00E+01 ng/μL 2.00E+01 ng/μL
Staphylococcus aureus - 1.00E+06 CFU/mL Neisseria meningitidis - 1.00E+06 copies/mL
Corynebacterium diphtheriae - 1.00E+06 CFU/mL Haemophilus influenzae - 1.00E+06 CFU/mL
Streptococcus pneumoniae - 1.00E+06 CFU/mL Mycoplasma pneumoniae - 1.00E+06 CCU/mL
Cytomegalovirus - 1.00E+05 PFU/mL Ethyl Alcohol, Absolute 200 Proof - 10% v/v
Acetonitrile - 10% v/v Table 39: Potentially Interfering Sample Collection and Storage Materials
Type Material Amount
Transport Media
Copan Universal Viral Transport Media (UTM) 100% Remel M4 ® 100%
Remel M4-RT® 100% Remel M5® 100% Remel M6™ 100%
Copan Liquid Amies (eSwab) 100% BD Regan Lowe Semi-Solid Transport Media 5% v/v
Swabs
Copan CLASSIQSwabs™ Rayon tipped swab - Aluminum applicator (Cat. No. 170KS01) 1 swab
Copan FLOQSwabs Nylon Flocked swab (Cat No. 519CS01) 1 swab
On the day of RP Flex testing, the three representative organisms were prepared to a concentration of 3x LoD in the interfering substance samples. A control containing no interfering substance was also prepared and tested for each target organism. Aliquots of each sample were tested in triplicate with the RP Flex. Additionally, all potential interferents were tested in triplicate without RP Flex target organisms as negative controls. No false positive was observed for the negative controls, except for the MedImmune FluMist® Influenza Vaccine Live, Intranasal Spray (2011-2012 Formula).

44
The FluMist® Influenza Vaccine Live was obtained from ATCC and further tested in a serial dilution range from 0.2% – 0.000002% in Simulated NPS. Positive results were obtained in at least one replicate for Influenza A, Influenza A/H1, and Influenza A/H3 down to 0.02% dilution. Similarly, Influenza B was detected down to a dilution of 0.002%.
The observed reactivity to the FluMist® Vaccine is indicated as a limitation in the product package insert which states: “Recent vaccination with the intranasal influenza vaccine may produce false positive results for Influenza A and/or Influenza B”.
None of the substances or microorganisms at the concentrations tested in this study showed any inhibitory effect on the detection of target respiratory pathogens using the RP Flex.
i. Competitive Interference Study:
In order to assess competitive inhibition in the RP Flex test, binary combinations of 14 organisms, representing the 16 RP Flex targets, were evaluated as presented in Table 40 below. The samples were prepared in Simulated NPS, with one panel member organism at a high titer and a second organism at a low titer representing all possible dual infections. High-positive titer strains were tested at 1.00E+05 TCID50/mL for viruses and 1.00E+06 CFU/mL for bacteria, while low-positive titer strains were tested at 3x LoD. A total of 182 unique combinations of high positive/low positive titer samples were prepared, and each was tested in triplicate in RP Flex.
Table 40: Viral and Bacterial Strains Used to Assess Competitive Interference
Organism High Titer Source/Strain
High Titer Concentration Low Titer Source/Strain
Low Titer Concentration
(3xLoD)
Influenza A H1N1 Zeptometrix A/Brisbane/59/2007
1.00E+05 TCID50/mL
Zeptometrix A/Brisbane/59/2007 9.00E+01 TCID50/mL
Influenza A H3N2 Zeptometrix A/Wisconsin/67/05a
1.00E+05 TCID50/mL
Zeptometrix 0810252CF 1.00E+01 TCID50/mL
Influenza B Zeptometrix B/Florida/02/2006
1.00E+05 TCID50/mL
Zeptometrix B/Florida/02/2006 9.00E+01 TCID50/mL
hMPV Zeptometrix 0810160CFa
1.00E+05 TCID50/mL TriCore 80410 9.00E+01 TCID50/mL
RSV A Zeptometrix 0810040ACFa
1.00E+05 TCID50/mL TriCore VR-540 1.00E+01 TCID50/mL
RSV B Zeptometrix 0810040CFa
1.00E+05 TCID50/mL TriCore VR-1580 1.10E+00 TCID50/mL
Parainfluenza 1 Zeptometrix 0810014CFa
1.00E+05 TCID50/mL TriCore VR-94 2.70E+02 TCID50/mL
Parainfluenza 2 Zeptometrix 0810015CFa
1.00E+05 TCID50/mL TriCore VR-92 3.00E+01 TCID50/mL
Parainfluenza 3 Zeptometrix 0810016CF
1.00E+05 TCID50/mL
Zeptometrix 0810016CF 1.00E+01 TCID50/mL
Parainfluenza 4 TriCore VR-1378 1.00E+05 TriCore VR-1378 8.10E+02 TCID50/mL

45
TCID50/mL
Adenovirus Zeptometrix 0810062CF
1.00E+05 TCID50/mL
Zeptometrix 0810062CF 3.33E+00 TCID50/mL
Rhinovirus Zeptometrix 0810012CFNa
1.00E+05 TCID50/mL TriCore VR-340 3.00E+01 TCID50/mL
Bordetella pertussis ATCC 9797 1.00E+06 CFU/mL ATCC 9797 2.43E+03 CFU/mL
Bordetella holmesii ATCC 51541 1.00E+06 CFU/mL ATCC 51541 2.43E+03 CFU/mL
The results of the Competitive Interference testing are summarized in Table 41 below. The expected targets of the organisms present at a high titer were detected in all of the 182 unique combinations (14 × 13) tested. For the low titer organisms, there were 10 cases in which a false negative result was obtained in one of the three replicates.
To further evaluate the cases in which the low titer organism was detected only in two of the three replicates, an additional six RP Flex tests per combination were performed. In all of the additional tests both the low and high titer analytes were accurately detected in all six replicate tests. Thus, the initial false negative results are likely reflective of the low titer (3x LoD) and not of systemic competitive inhibition in the RP Flex.
Table 41: Summary of Competitive Interference Testing Results Low Positive Titer Strains (3x LoD)
Influ
enza
A H
1 In
fluen
za A
H3
Influ
enza
B
hMPV
R
SV A
R
SV B
Pa
rain
fluen
za 1
Pa
rain
fluen
za 2
Pa
rain
fluen
za 3
Pa
rain
fluen
za 4
A
deno
viru
s R
hino
viru
s B
. per
tuss
is
B. h
olm
esii Binary
Combinations
H
igh
Posit
ive
Tite
r St
rain
s 3/3
8/9
3/3
3/3
3/3
3/3
3/3
3/3
3/3
8/9
3/3
3/3
8/9 Influenza A H1 -
3/3
3/3
3/3
3/3
8/9
3/3
3/3
3/3
3/3
3/3
8/9
3/3
3/3 Influenza A H3 -
3/3
3/3
3/3
3/3
3/3
3/3
3/3
3/3
3/3
8/9
3/3
3/3
3/3 Influenza B -
3/3
3/3
3/3
3/3
3/3
3/3
3/3
3/3
3/3
3/3
3/3
3/3
8/9 hMPV -
3/3
3/3
3/3
3/3
8/9
3/3
3/3
3/3
3/3
3/3
3/3
3/3
3/3 RSV A -
3/3
3/3
3/3
3/3
3/3
3/3
3/3
3/3
3/3
3/3
3/3
3/3
3/3 RSV B -
3/3
3/3
3/3
3/3
3/3
3/3
3/3
3/3
3/3
3/3
3/3
3/3
3/3 Parainfluenza 1 -
3/3
3/3
3/3
3/3
8/9
3/3
3/3
3/3
3/3
3/3
3/3
3/3
3/3 Parainfluenza 2 -
3/3
3/3
3/3
3/3
3/3
3/3
3/3
3/3
3/3
3/3
3/3
3/3
3/3 Parainfluenza 3 -
3/3
3/3
3/3
3/3
3/3
3/3
3/3
3/3
3/3
3/3
3/3
3/3
3/3 Parainfluenza 4 -

46
Adenovirus 3/3 3/3 3/3 3/3 3/3 3/3 3/3 3/3 3/3 3/3 - 3/3 3/3 3/3
3/3
3/3
3/3
3/3
3/3
3/3
3/3
3/3
3/3
3/3
3/3
3/3
8/9 Rhinovirus -
3/3
3/3 3/3 3/3
3/3
3/3
3/3
3/3
3/3
3/3
3/3
3/3
3/3 B. pertussis -
3/3
3/3
3/3
3/3
3/3
3/3
3/3
3/3
3/3
3/3 3/3
3/3
3/3 B. holmesii -
Total Detection Rate of Low Titer Strain
No.
39/39
39/39
44/45
39/39
44/45
49/51
39/39
39/39
39/39
39/39
49/51
44/45
39/39
54/57
% 100%
100%
98%
100%
98%
96%
100%
100%
100%
100%
96%
98%
100%
95%
j. Carry-Over Contamination:
The RP Flex is designed such that all of the sample contact components for the test are single-use consumables that minimize the risk for carryover or cross-contamination. An analytical study was performed to assess potential carryover or cross-contamination in the RP Flex by alternately testing high positive and negative samples on the Verigene System. The high positive samples consisted of three respiratory pathogens, representing the three major types of panel analytes: a DNA virus (Adenovirus), an RNA virus (Influenza A), and a gram negative bacterium (Bordetella pertussis). Each strain was prepared in Simulated NPS at a high positive titer, 1.00E+05 TCID50/mL for viral targets, and 1.00E+06 CFU/mL for bacterial targets. Specific strain information and the expected RP Flex results are shown in Table 42 below.
Table 42: Organisms Tested in the Carryover Contamination Study
Organism
Source / ID
Expected Results
Titer
Adenovirus 3 (B)
Zeptometrix #0810062CF
Adenovirus Detected
1.00E+05 TCID50/mL
Influenza A/Wisconsin/67/05
(H3N2)
Zeptometrix #0810252CF
Influenza A & Influenza A/H3 Detected
1.00E+05 TCID50/mL
Bordetella pertussis
ATCC 9797
Bordetella parapertussis/bronchiseptica. &
Bordetella pertussis Detected
1.00E+06 CFU/mL
The study was performed using six Verigene SP processors, with each processor SP tested five times with alternative high positive and negative specimens, as summarized in Table 43 below.
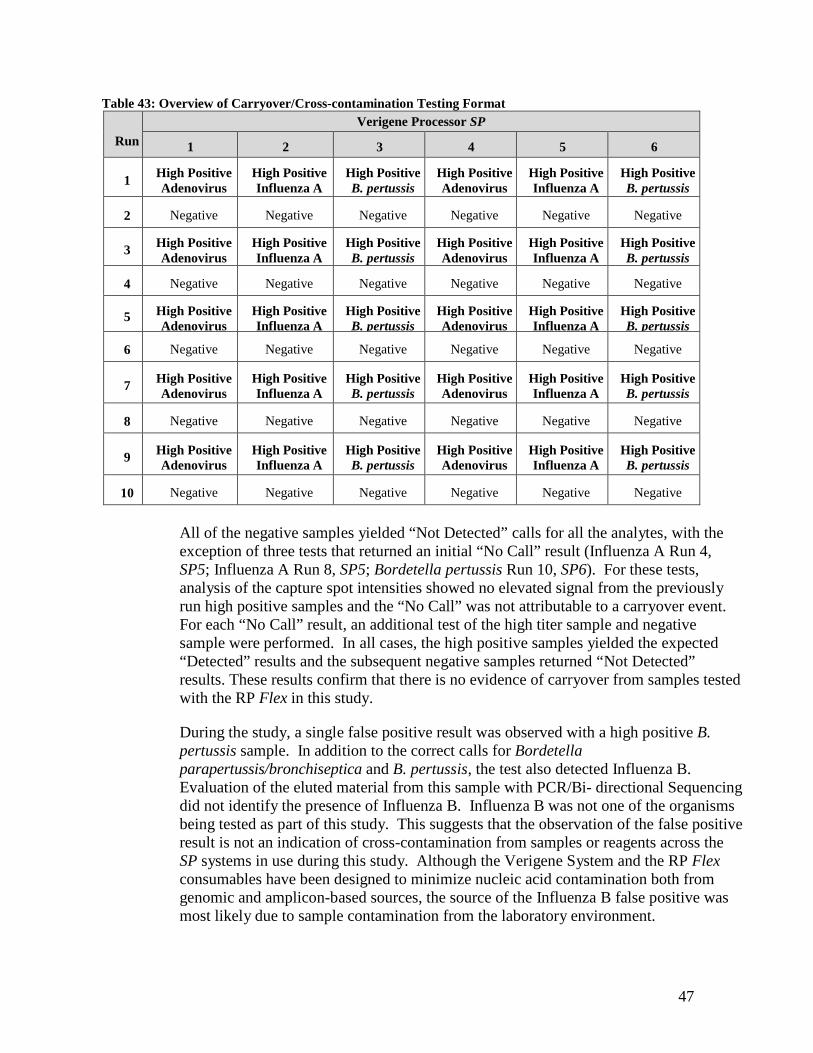
47
Table 43: Overview of Carryover/Cross-contamination Testing Format
Run
Verigene Processor SP
1 2 3 4 5 6 1
High Positive Adenovirus
High Positive Influenza A
High Positive B. pertussis
High Positive Adenovirus
High Positive Influenza A
High Positive B. pertussis
2 Negative Negative Negative Negative Negative Negative
3
High Positive Adenovirus
High Positive Influenza A
High Positive B. pertussis
High Positive Adenovirus
High Positive Influenza A
High Positive B. pertussis
4 Negative Negative Negative Negative Negative Negative
5
High Positive Adenovirus
High Positive Influenza A
High Positive B. pertussis
High Positive Adenovirus
High Positive Influenza A
High Positive B. pertussis
6 Negative Negative Negative Negative Negative Negative
7
High Positive Adenovirus
High Positive Influenza A
High Positive B. pertussis
High Positive Adenovirus
High Positive Influenza A
High Positive B. pertussis
8 Negative Negative Negative Negative Negative Negative
9
High Positive Adenovirus
High Positive Influenza A
High Positive B. pertussis
High Positive Adenovirus
High Positive Influenza A
High Positive B. pertussis
10 Negative Negative Negative Negative Negative Negative
All of the negative samples yielded “Not Detected” calls for all the analytes, with the exception of three tests that returned an initial “No Call” result (Influenza A Run 4, SP5; Influenza A Run 8, SP5; Bordetella pertussis Run 10, SP6). For these tests, analysis of the capture spot intensities showed no elevated signal from the previously run high positive samples and the “No Call” was not attributable to a carryover event. For each “No Call” result, an additional test of the high titer sample and negative sample were performed. In all cases, the high positive samples yielded the expected “Detected” results and the subsequent negative samples returned “Not Detected” results. These results confirm that there is no evidence of carryover from samples tested with the RP Flex in this study.
During the study, a single false positive result was observed with a high positive B. pertussis sample. In addition to the correct calls for Bordetella parapertussis/bronchiseptica and B. pertussis, the test also detected Influenza B. Evaluation of the eluted material from this sample with PCR/Bi- directional Sequencing did not identify the presence of Influenza B. Influenza B was not one of the organisms being tested as part of this study. This suggests that the observation of the false positive result is not an indication of cross-contamination from samples or reagents across the SP systems in use during this study. Although the Verigene System and the RP Flex consumables have been designed to minimize nucleic acid contamination both from genomic and amplicon-based sources, the source of the Influenza B false positive was most likely due to sample contamination from the laboratory environment.

48
k. Comparator Assays Analytical Validation Studies
In the prospective clinical study for the Verigene RP Flex, the RP Flex results were compared to the results of an FDA-cleared multiplexed respiratory pathogens panel performed by eight of the nine comparator testing sites for the majority of the RP Flex analytes (Adenovirus, Influenza A, Influenza B, Influenza A/H1 and A/H3 subtypes, Parainfluenza 1, 2, 3, and 4, Human Metapneumovirus, Respiratory Syncytial Virus, Rhinovirus, and Bordetella pertussis). The remaining RP Flex analytes (Bordetella holmesii and Bordetella parapertussis/bronchiseptica) required two analytically validated PCR followed by bi-directional sequencing (PCR/BDS) comparator assays which were tested using the residual nucleic acids samples extracted from the NPS specimens by the Verigene RP Flex at one dedicated PCR/Sequencing comparator testing site. Since the FDA-cleared multiplex respiratory pathogen panel comparator reports a general RSV result without distinguishing RSV A from RSV B, following a positive result for RSV on the FDA-cleared comparator, residual nucleic acid samples extracted from the NPS specimens by the Verigene RP Flex were sent for RSV subtyping by an analytically validated PCR/BDS assay. In addition, due to the fact that the FDA-cleared multiplexed respiratory pathogen panel comparator reports a Rhinovirus/Enterovirus result without disguising Rhinovirus from Enterovirus, following a positive result for Rhinovirus/Enterovirus on the FDA-cleared comparator, residual nucleic acid samples extracted from the NPS specimens by the Verigene RP Flex were sent for confirmation of Rhinovirus by two analytically validated PCR/BDS assays.
Table 44: PCR/BDS Comparators Testing Scheme
Organism/Virus Comparator PCR/BDS Assays Bordetella holmesii 2 PCR/BDS tests on extracted samples
Bordetella parapertussis/bronchiseptica 2 PCR/BDS tests on extracted samples RSV A and B 1 PCR/BDS test on extracted samples
Rhinovirus 2 PCR/BDS tests on extracted samples
These analytically validated PCR/BDS assays have different primer/probe sequences from those used in the RP Flex. In some cases, the PCR/BDS amplicon overlaps with the RP Flex assay amplicon due to design limitations (availability of conserved regions). However, none of the PCR/BDS primers are designed to overlap with any of the RP Flex assay primers/probes (Table 45 below). This eliminates the possibility that the PCR/BDS amplicon is derived from the RP Flex assay amplicon.
Table 45: Targets for PCR/BDS Comparators and RP Flex
Organism
RP Flex Target
PCR/BDS Assay 1 Target
PCR/BDS Assay 2 Target
Bordetella holmesii fumC fumC
rpoB
Bordetella parapertussis/bronchiseptica
gidA
Toxin Promoter Region
Toxin Promoter Region

49
RSV A Polymerase Large Subunit - L Polymerase Large
Subunit - L N/A RSV B Fusion Protein (F)
Rhinovirus 5'UTR 5'UTR 5'UTR
Validation studies included analytical sensitivity (LoD) study and analytical reactivity study. The results of these validation studies demonstrated that the analytical sensitivity and reactivity of the PCR/BDS comparators are either equivalent or better comparing to that of the RP Flex.
l. Specimen Stability Study
An analytical study was carried out to support the RP Flex stability claim for clinical specimens preserved in viral transport media (VTM), and to demonstrate the long-term stability of frozen banked clinical samples (retrospective samples) that were used to supplement the prospective clinical study data.
A total of fourteen viral and bacterial strains in pooled negative natural clinical NPS were evaluated in this study. These strains are representative of all of the sixteen RP Flex targets and were also part of the LoD study. Each strain was prepared at Low Positive (2xLoD) and Moderate Positive (5xLoD) concentrations in pooled negative natural clinical NPS collected in VTM.
Initial testing was performed to establish the baseline time point (t = 0) for the study, and additional aliquots of the samples were stored at each of the following temperature conditions: (1) 20-25°C, (2) 2-8°C, and (3) Frozen (≤-70°C).
At the designated time points, shown in Table 46 below, one aliquot of each strain at each concentration was tested with the RP Flex in replicates of three. The 2-8°C and 20-25°C samples were tested immediately, while the frozen aliquots were thawed at room temperature for 10-30 minutes prior to testing.
Table 46: Specimen Stability Storage Conditions and Time Points
Test Time Point
Storage Temperature 20-25°C 2-8°C <-70°C
Baseline (0) X X X 4 hours X
N/A
N/A 6 hours X 24 hours
N/A
X X 72 hours X
N/A 75 hours X 15 days
N/A
X 30 days X 35 days X

50
The results of this specimen stability study support the stability claim for RP Flex testing of clinical NPS specimens preserved in VTM at the following storage conditions: 4 hours at 20-25°C, 72 hours at 2-8°C, and 30 days at <-70°C.
2. Comparison studies:
a. Method comparison with predicate device:
Not applicable. Refer to the Clinical Studies Section of this document.
b. Matrix comparison:
Not applicable
3. Clinical studies:
Prospective Clinical Studies
The clinical performance of the RP Flex was evaluated during prospective studies at a total of five geographically separated U.S. testing sites. The study sites were located in the Midwest (Milwaukee, WI and Indianapolis, IN), the Mid-Atlantic (Baltimore, MD), the Northeast (Liverpool, NY), and the Southwest (Albuquerque, NM). Each study location was representative of the intended use setting (clinical laboratories) and testing was performed by trained clinical laboratory personnel. Fresh Prospective Specimens (All-comers) Fresh (never frozen) nasopharyngeal swab (NPS) specimens in viral transport media (VTM) that were prospectively collected at the respective clinical sites were tested at the five U.S. testing sites (Site 1, 2, 3, 4, and 5) during July 2014 thru November 2014. Additional fresh (never frozen) NP swab samples in VTM that were prospectively collected from two additional specimen collection sites (one in Mexico and the other one in the Midwest part of the U.S.) were also prospectively tested at two of the five testing sites (Site 2 and 5) during July 2014 thru November 2014. Prospective clinical studies testing fresh NPS specimens in viral transport media (VTM) were also conducted at two of the five testing sites (Site 1 and 4) during February 2015 thru March 2015. Most of the fresh prospective specimens tested in these studies were de-identified and enrolled from residual specimens collected from individuals presenting with signs and symptoms of respiratory infection at the testing sites. These clinical specimens were de-identified during enrollment by the testing sites and assigned a unique study identification number. In some cases, a third-party collection site labeled residual fresh prospective clinical specimens with an external unique de-identification number and shipped at 4°C overnight to testing sites, who then assigned a unique study identification number for enrollment.

51
Fresh specimens were residual, de-identified and consisting of ≥ 1.5 mL NPS specimen collected in VTM. Specimens were aliquoted in accordance with the study protocol. One aliquot was used for Verigene RP Flex testing at the test sites. If RP Flex testing was not performed immediately, the sample was stored at 2-8°C for up to 48 hours before testing. Another aliquot was immediately stored at ≤ -70°C and subsequently shipped overnight on dry ice, to a third-party reference laboratory for comparator testing using an FDA-cleared multiplexed respiratory pathogens panel.
Frozen Archived Prospective Specimens (All-comers) In addition, archived (previously frozen) NPS specimens in VTM that were prospectively collected and archived from September 2013 thru March 2014 at one U.S. clinical reference laboratory in the Midwest (Indianapolis, IN) were randomly distributed to, enrolled and tested at the same five U.S. testing sites (Site 1, 2, 3, 4, and 5) that tested the fresh prospective samples, from July 2014 thru December 2014.
Frozen specimens (all-comers) were collected at the collection site using an external unique de-identification number. Samples for this study included all positive and negative specimens submitted to the laboratory for routine respiratory pathogen testing. Frozen specimens were residual, de-identified and consisted of ≥ 1.0 mL NPS specimen collected in VTM. Specimens were stored at ≤ -70°C and shipped frozen to the sponsor. Prior to sending specimens to the testing sites, the sponsor thawed, de-identified, and aliquoted the specimens for study use by assigning another unique study identification number. Specimens were randomized and shipped to the testing sites in accordance with the site’s availability to receive and test specimens. One aliquot was immediately stored at ≤-70°C and subsequently shipped overnight on dry ice, to a third-party reference laboratory for comparator testing using an FDA-cleared multiplexed respiratory pathogens panel. Another aliquot was immediately stored at ≤ -70°C and shipped overnight on dry ice, to the testing sites for Verigene RP Flex testing. Verigene RP Flex Testing of All Prospective Specimens
Fresh prospective specimens were tested within 48 hours of collection while frozen prospective samples were tested within 48 hours of sample thaw at the test sites. If a specimen test yielded a result of a) No Call or b) Pre-Analysis Error (PAE), the specimen was re-tested using 200 μL from the remaining sample volume in accordance with study protocol. If a specimen could not be re-tested within 48 hours of collection, it was frozen until the repeat test could be performed. At the conclusion of each Verigene RP Flex test, the residual nucleic acids were collected from the Extraction Tray into a microcentrifuge tube and stored frozen at ≤-70°C. The tube was shipped overnight on dry ice to the sponsor and was sent to a third party laboratory for PCR/BDS testing. In the event that a sample residual nucleic acids in the Extraction Tray was less than 50 μL (insufficient volume for required PCR/BDS testing), repeat RP Flex testing was performed to generate additional volume of nucleic acids. However, the first RP Flex test was used as the test of record for all performance calculations.

52
Fresh and Frozen Prospective Specimens Comparator Method Testing
For all fresh and frozen prospective specimens, comparator testing was performed at one of the eight comparator testing sites that are different from the five RP Flex test sites. An FDA-cleared multiplexed respiratory pathogens panel was used as the primary comparator method for the majority of the targets on the RP Flex panel (i.e., Adenovirus, Influenza A, Influenza B, Influenza A/H1 and A/H3 subtypes, Parainfluenza 1, 2, 3, and 4, Human Metapneumovirus, Respiratory Syncytial Virus, Rhinovirus, and Bordetella pertussis). As the FDA-cleared multiplexed respiratory pathogens panel does not distinguish RSV types nor Rhinovirus and Enterovirus, the comparator method for RSV subtypes consisted of the FDA-cleared multiplexed respiratory pathogens panel followed by an analytically validated polymerase chain reaction (PCR) and bi-directional sequencing (BDS) assay, and the comparator method for Rhinovirus consisted of the FDA-cleared multiplexed respiratory pathogens panel followed by a composite of two analytically validated polymerase chain reaction (PCR) and bi-directional sequencing (BDS) assays. For the targets on the RP Flex panel but not detected by the FDA-cleared multiplexed respiratory pathogens panel (i.e., Bordetella parapertussis/bronchiseptica and Bordetella holmesii), a composite of two analytically validated PCR/BDS assays was used as the comparator method. The PCR/BDS testing for the prospective clinical studies was performed at an external third-party site. An overview of the composite algorithm to determine comparator results is listed in Table 47 below.
Table 47: RP Flex Prospective Clinical Studies Comparator Methods RP Flex Target Reference Method
Adenovirus An FDA-cleared multiplexed respiratory pathogens panel Influenza A and B An FDA-cleared multiplexed respiratory pathogens panel
Influenza A subtype: A/H1 and A/H3 An FDA-cleared multiplexed respiratory pathogens panel Parainfluenza 1, 2, 3, and 4 An FDA-cleared multiplexed respiratory pathogens panel Human Metapneumovirus An FDA-cleared multiplexed respiratory pathogens panel
RSV A and Ba An FDA-cleared multiplexed respiratory pathogens panel and one PCR/BDS assay to distinguish RSV subtype (A and/or B)
Rhinovirusb An FDA-cleared multiplexed respiratory pathogens panel and composite of two PCR/BDS assays to confirm Rhinovirus
Bordetella pertussis An FDA-cleared multiplexed respiratory pathogens panel
Bordetella holmesiic Composite of two analytically validated PCR/BDS assays
Bordetella parapertussis/bronchisepticac Composite of two analytically validated PCR/BDS assays
a The FDA-cleared multiplexed respiratory pathogens panel does not differentiate RSV A from RSV B b The FDA-cleared multiplexed respiratory pathogens panel does not differentiate Rhinovirus from Enterovirus c This target is not present on the FDA-cleared multiplexed respiratory pathogens panel

53
Following a detected result for RSV on the FDA-cleared multiplexed respiratory pathogens panel, samples (i.e., the residual nucleic acids collected from the Verigene Processor SP Extraction Tray) were sent for PCR/BDS for RSV subtype identification. Samples that were negative by PCR/BDS were considered negative. The composite algorithm used to determine the comparator result for RSV is summarized in Table 48 below.
Table 48: Composite Comparator Method for RSV
FDA-Cleared Respiratory Pathogens Panel RSV Result
PCR/BDS Result Final Composite Comparator Result
Positive RSV A RSV A Positive Positive RSV B RSV B Positive Positive Negative Nega
i Negative N/A Negai
Following a positive result for Rhinovirus/Enterovirus on the FDA-cleared multiplexed respiratory pathogens panel, samples (i.e., the residual nucleic acids collected from the Verigene Processor SP Extraction Tray) were sent for confirmation of Rhinovirus by a composite of two PCR/BDS assays. If the first PCR/BDS assay failed to provide a valid positive Rhinovirus or Enterovirus result, a second PCR/BDS assay targeting a different region of the viral genome was performed. The result of the second PCR/BDS assay was used as the final result. Samples were considered positive for Rhinovirus only upon a positive detection by a PCR/BDS assay. Samples were considered negative for Rhinovirus with 1) a negative Rhinovirus/Enterovirus result on the FDA-cleared multiplexed respiratory pathogens panel; 2) negative Rhinovirus results from both PCR/BDS assays; 3) a positive Enterovirus result from one PCR/BDS assay. The composite algorithm used to determine the comparator result for Rhinovirus is summarized in Table 49 below.
Table 49: Composite Comparator Method for Rhinovirus FDA-Cleared Respiratory
Pathogens Panel Rhinovirus/Enterovirus
Result
PCR/BDS 1 Result PCR/BDS 2 Result Final Composite Comparator Result
Positive Rhinovirus N/A Rhinovirus Positive
Positive Enterovirus N/A Rhinovirus Negative
Positive Negative Rhinovirus Rhinovirus Positive
Positive Negative Enterovirus Rhinovirus Negative
Positive Negative Negative Rhinovirus Negative
Negative N/A N/A Rhinovirus Negative
All samples were tested by two PCR/BDS assays for Bordetella parapertussis/bronchiseptica and Bordetella holmesii. Samples that were positive or negative by a first PCR/BDS assay were tested with a second PCR/BDS assay. With this

54
approach, samples were considered positive if an analyte was detected by at least one of the PCR/BDS assays. Samples were considered negative when both the PCR/BDS assays were negative. The composite algorithm used to determine the comparator result for Bordetella parapertussis/bronchiseptica and Bordetella holmesii is summarized in Table 50 below.
Table 50: Composite Comparator Method for Bordetella parapertussis/bronchiseptica and Bordetella holmesii
Target
PCR/BDS 1 Result
PCR /BDS 2 Result
Final Composite
Comparator Result
Bordetella parapertussis/bronchiseptica
Positive Positive Positive
Positive Negative or N/A Positive Negative Positive Positive Negative Negative Negative
Bordetella holmesii
Positive Positive Positive Positive Negative or N/A Positive Negative Positive Positive
Negative Negative Negative
Quality Control Testing
Quality Control testing was performed on each day of RP Flex testing, using a single-use aliquot of external positive and negative control samples provided by the sponsor. Control samples were shipped on dry ice to the study testing sites where they were stored frozen at ≤ -70°C until use. Controls were tested per the RP Flex IUO Package Insert instructions. If either control yielded a “PAE” or “No Call” test result, a new aliquot was tested per the study protocol.
Discrepant Result Investigation Testing
Samples for which false positive and/or false negative results (i.e., discrepant result) were obtained when comparing the Verigene RP Flex result to the comparator method result were further tested. The discrepant investigation testing was performed using analytically validated PCR assays followed by BDS to confirm the identity of the specific target in the discordant sample. The PCR/BDS methods were developed and validated for the identification and confirmation of the panel analytes on RP Flex with PCR primers that are different from the RP Flex primers. Patient Demographics A total of 2412 prospective specimens (fresh and frozen) were included in the prospective clinical studies for testing with the RP Flex. The following table (Table 51) provides a summary of demographic information for the 2412 prospectively collected specimens (fresh and frozen) that were enrolled in the prospective studies:

55
Table 51: Demographic Summary for RP Flex Prospective Clinical Studies
Number of Specimens (Prospective Fresh)
Number of Specimens (Prospective Frozen)
Number of Specimens (Prospective Combined)
Age No. of Specimens Percentage No. of Specimens Percentage No. of Specimens Percentage 0-1 151 14.0% 165 12.4% 316 13.1%
>1-5 176 16.3% 382 28.7% 558 23.1% >5-12 73 6.7% 98 7.4% 171 7.1%
>12-21 74 6.8% 67 5.0% 141 5.8% >21-65 426 39.4% 275 20.7% 701 29.1%
>65 163 15.1% 155 11.7% 318 13.2%
Not Provided 19 1.8% 188 14.1% 207 8.6%
Total 1082 100% 1330 100% 2412 100%
Prospective Specimens Accountability A total of 2412 prospective specimens (1082 fresh and 1330 frozen) were initially included in the prospective clinical studies for testing with the RP Flex. Of the 1082 fresh prospective specimens, two specimens were excluded from performance analyses due to the lack of comparator testing results for all analytes; five specimens generated a “No Call” result initially by the RP Flex but were not retested per the product instructions, and were therefore excluded from performance analyses; six specimens generated a “No Call” result initially and a “No Call” result again upon retesting by the RP Flex, and were therefore excluded from the performance analyses. A total of 1069 fresh prospective specimens were included in the performance analyses of the RP Flex. Of the 1330 frozen prospective specimens, five specimens were excluded from the performance analyses due to the lack of comparator testing results for all analytes; three specimens generated a “No Call” result initially by the RP Flex but were not retested per the product instructions, and were therefore excluded from performance analyses; one specimen was excluded from performance analyses due to uncertainty in determining the correct specimen ID; four specimens generated a “No Call” result initially and a “No Call” result again upon retesting by the RP Flex, and were therefore excluded from performance analyses. A total of 1317 frozen prospective specimens were included in the performance analyses of the RP Flex. Of the total of 2386 prospective clinical specimens that were included in the performance analyses of the RP Flex, 189 specimens were excluded from the RP Flex performance analysis for Adenovirus due to the lack of Adenovirus comparator results; 264 specimens were excluded from the RP Flex performance analysis for Rhinovirus due to the lack of Rhinovirus comparator results; 193 specimens were excluded from the

56
RP Flex performance analysis for Influenza A due to the lack of Influenza A comparator results; 196 specimens were excluded from the RP Flex performance analysis for Influenza A/H1 due to the lack of Influenza A/H1 comparator results; 196 specimens were excluded from the RP Flex performance analysis for Influenza A/H3 due to the lack of Influenza A/H3 comparator results; 189 specimens were excluded from the RP Flex performance analysis for Influenza B due to the lack of Influenza B comparator results; 189 specimens were excluded from the RP Flex performance analysis for Parainfluenza 1 due to the lack of Parainfluenza 1 comparator results; 189 specimens were excluded from the RP Flex performance analysis for Parainfluenza 2 due to the lack of Parainfluenza 2 comparator results; 189 specimens were excluded from the RP Flex performance analysis for Parainfluenza 3 due to the lack of Parainfluenza 3 comparator results; 189 specimens were excluded from the RP Flex performance analysis for Parainfluenza 4 due to the lack of Parainfluenza 4 comparator results; 216 specimens were excluded from the RP Flex performance analysis for RSV A due to the lack of RSV A comparator results; 216 specimens were excluded from the RP Flex performance analysis for RSV B due to the lack of RSV B comparator results; 189 specimens were excluded from the RP Flex performance analysis for hMPV due to the lack of hMPV comparator results; 189 specimens were excluded from the RP Flex performance analysis for B. pertussis due to the lack of B. pertussis comparator results; 90 specimens were excluded from the RP Flex performance analysis for B. parapertussis/bronchiseptica due to the lack of B. parapertussis/bronchiseptica comparator results; 80 specimens were excluded from the RP Flex performance analysis for B. holmesii due to the lack of B. holmesii comparator results. Prospective Clinical Studies Performance The RP Flex prospective performance data in positive percent and negative percent agreements against the comparator methods (all sites combined) are presented in the following Table 52 by analyte:
Table 52: RP Flex Prospective Clinical Performance
Organism Specimen Type PPA 95% CI NPA 95% CI Adenovirus Fresh Prospective 22/24a 91.7% 74.1% - 97.7% 1009/1028b 98.2% 97.1% - 98.8% Frozen Prospective 27/33c 81.8% 65.6% - 91.4% 1072/1112d 96.4% 95.1% - 97.3% All 49/57 86.0% 74.7% - 92.7% 2081/2140 97.2% 96.5% - 97.9% Rhinovirus Fresh Prospective 214/249e 85.9% 81.1% - 89.7% 719/751f 95.7% 94.1% - 97.0% Frozen Prospective 193/248g 77.8% 72.2% - 82.5% 859/874h 98.3% 97.2% - 99.0% All 407/497 81.9% 78.3% - 85.0% 1578/1625 97.1% 96.2% - 97.8 Influenza A Fresh Prospective 12/12 100% 75.7% - 100% 1030/1037i 99.4% 98.6% - 99.7% Frozen Prospective 46/47j 97.9% 88.9% - 99.6% 1091/1097k 99.4% 98.8% - 99.7% All 58/59 98.3% 91.0% - 99.7% 2121/2134 99.4% 99.0% - 99.6% Flu A/H1 Fresh Prospective 0/0 N/A N/A 1046/1048l 99.8% 99.3% - 99.9% Frozen Prospective 45/46m 97.8% 88.7% - 99.6% 1092/1096n 99.6% 99.1% - 99.9% All 45/46 97.8% 88.7% - 99.6% 2138/2144 99.7% 99.4% - 99.9% Flu A/H3 Fresh Prospective 12/12 100% 75.7% - 100% 1032/1036o 99.6% 99.0% - 99.8% Frozen Prospective 1/1 100% 20.6% - 100% 1141/1141 100% 99.7% - 100% All 13/13 100% 77.2% - 100% 2173/2177 99.8% 99.5% -99.9% Influenza B Fresh Prospective 49/50p 98.0% 89.5% - 99.6% 995/1002q 99.3% 98.6% - 99.7%
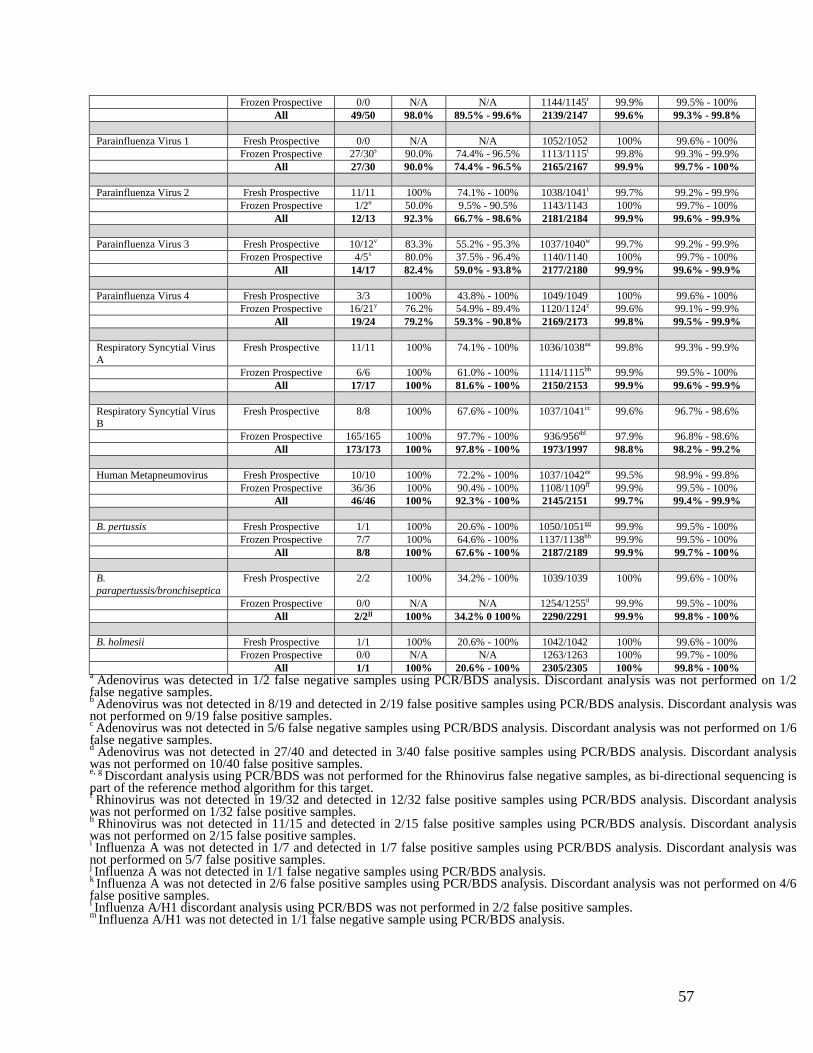
57
Frozen Prospective 0/0 N/A N/A 1144/1145r 99.9% 99.5% - 100% All 49/50 98.0% 89.5% - 99.6% 2139/2147 99.6% 99.3% - 99.8% Parainfluenza Virus 1 Fresh Prospective 0/0 N/A N/A 1052/1052 100% 99.6% - 100% Frozen Prospective 27/30s 90.0% 74.4% - 96.5% 1113/1115t 99.8% 99.3% - 99.9% All 27/30 90.0% 74.4% - 96.5% 2165/2167 99.9% 99.7% - 100% Parainfluenza Virus 2 Fresh Prospective 11/11 100% 74.1% - 100% 1038/1041t 99.7% 99.2% - 99.9% Frozen Prospective 1/2u 50.0% 9.5% - 90.5% 1143/1143 100% 99.7% - 100% All 12/13 92.3% 66.7% - 98.6% 2181/2184 99.9% 99.6% - 99.9% Parainfluenza Virus 3 Fresh Prospective 10/12v 83.3% 55.2% - 95.3% 1037/1040w 99.7% 99.2% - 99.9% Frozen Prospective 4/5x 80.0% 37.5% - 96.4% 1140/1140 100% 99.7% - 100% All 14/17 82.4% 59.0% - 93.8% 2177/2180 99.9% 99.6% - 99.9% Parainfluenza Virus 4 Fresh Prospective 3/3 100% 43.8% - 100% 1049/1049 100% 99.6% - 100% Frozen Prospective 16/21y 76.2% 54.9% - 89.4% 1120/1124z 99.6% 99.1% - 99.9% All 19/24 79.2% 59.3% - 90.8% 2169/2173 99.8% 99.5% - 99.9% Respiratory Syncytial Virus A
Fresh Prospective 11/11 100% 74.1% - 100% 1036/1038aa 99.8% 99.3% - 99.9%
Frozen Prospective 6/6 100% 61.0% - 100% 1114/1115bb 99.9% 99.5% - 100% All 17/17 100% 81.6% - 100% 2150/2153 99.9% 99.6% - 99.9% Respiratory Syncytial Virus B
Fresh Prospective 8/8 100% 67.6% - 100% 1037/1041cc 99.6% 96.7% - 98.6%
Frozen Prospective 165/165 100% 97.7% - 100% 936/956dd 97.9% 96.8% - 98.6% All 173/173 100% 97.8% - 100% 1973/1997 98.8% 98.2% - 99.2% Human Metapneumovirus Fresh Prospective 10/10 100% 72.2% - 100% 1037/1042ee 99.5% 98.9% - 99.8% Frozen Prospective 36/36 100% 90.4% - 100% 1108/1109ff 99.9% 99.5% - 100% All 46/46 100% 92.3% - 100% 2145/2151 99.7% 99.4% - 99.9% B. pertussis Fresh Prospective 1/1 100% 20.6% - 100% 1050/1051gg 99.9% 99.5% - 100% Frozen Prospective 7/7 100% 64.6% - 100% 1137/1138hh 99.9% 99.5% - 100% All 8/8 100% 67.6% - 100% 2187/2189 99.9% 99.7% - 100% B. parapertussis/bronchiseptica
Fresh Prospective 2/2 100% 34.2% - 100% 1039/1039 100% 99.6% - 100%
Frozen Prospective 0/0 N/A N/A 1254/1255ii 99.9% 99.5% - 100% All 2/2jj 100% 34.2% 0 100% 2290/2291 99.9% 99.8% - 100% B. holmesii Fresh Prospective 1/1 100% 20.6% - 100% 1042/1042 100% 99.6% - 100% Frozen Prospective 0/0 N/A N/A 1263/1263 100% 99.7% - 100% All 1/1 100% 20.6% - 100% 2305/2305 100% 99.8% - 100%
a Adenovirus was detected in 1/2 false negative samples using PCR/BDS analysis. Discordant analysis was not performed on 1/2 false negative samples. b Adenovirus was not detected in 8/19 and detected in 2/19 false positive samples using PCR/BDS analysis. Discordant analysis was not performed on 9/19 false positive samples. c Adenovirus was not detected in 5/6 false negative samples using PCR/BDS analysis. Discordant analysis was not performed on 1/6 false negative samples. d Adenovirus was not detected in 27/40 and detected in 3/40 false positive samples using PCR/BDS analysis. Discordant analysis was not performed on 10/40 false positive samples. e, g Discordant analysis using PCR/BDS was not performed for the Rhinovirus false negative samples, as bi-directional sequencing is part of the reference method algorithm for this target. f Rhinovirus was not detected in 19/32 and detected in 12/32 false positive samples using PCR/BDS analysis. Discordant analysis was not performed on 1/32 false positive samples. h Rhinovirus was not detected in 11/15 and detected in 2/15 false positive samples using PCR/BDS analysis. Discordant analysis was not performed on 2/15 false positive samples. i Influenza A was not detected in 1/7 and detected in 1/7 false positive samples using PCR/BDS analysis. Discordant analysis was not performed on 5/7 false positive samples. j Influenza A was not detected in 1/1 false negative samples using PCR/BDS analysis. k Influenza A was not detected in 2/6 false positive samples using PCR/BDS analysis. Discordant analysis was not performed on 4/6 false positive samples. l Influenza A/H1 discordant analysis using PCR/BDS was not performed in 2/2 false positive samples. m Influenza A/H1 was not detected in 1/1 false negative sample using PCR/BDS analysis.

58
n Influenza A/H1 was not detected in 2/4 and detected in 1/4 false positive samples using PCR/BDS analysis. Discordant analysis was not performed in ¼ false positive samples. o Influenza A/H3 was not detected in 3/4 and detected in 1/4 false positive samples using PCR/BDS analysis. p Influenza B was not detected in 1/1 false negative sample using PCR/BDS analysis. q Influenza B was not detected in 4/7 and detected in 2/7 false positive samples using PCR/BDS analysis. Discordant analysis was not performed in 1/7 samples. r Influenza B was not detected in 1/1 false positive sample using PCR/BDS analysis. s Parainfluenza 1 was not detected in 3/3 false negative samples using PCR/BDS analysis. t Parainfluenza 2 was not detected in 2/3 and detected in 1/3 false positive samples using PCR/BDS analysis. u Parainfluenza 2 was not detected in 1/1 false negative sample using PCR/BDS analysis. v Parainfluenza 3 was not detected in 2/2 false negative samples using PCR/BDS analysis. w Parainfluenza 3 was not detected in 3/3 false positive samples using PCR/BDS analysis. x Parainfluenza 3 was not detected in 1/1 false negative sample using PCR/BDS analysis. y Parainfluenza 4 was not detected in 2/5 and detected in 2/5 false negative samples using PCR/BDS analysis. Discordant analysis was not performed in 1/5 false negative samples. z Parainfluenza 4 was not detected in 3/4 and detected in 1/4 false positive samples using PCR/BDS analysis. aa RSV A was not detected in 1/2 and detected in 1/2 false positive samples using PCR/BDS analysis. bb RSV A was not detected in 1/1 false positive sample using PCR/BDS analysis. cc RSV B was detected in 2/4 and not detected in 2/4 false positive samples using PCR/BDS analysis. dd RSV B was not detected in 16/20 and detected in 2/20 false positive samples using PCR/BDS analysis. Discordant analysis was not performed in 2/20 false positive samples. ee hMPV was not detected in 3/5 and detected in 2/5 false positive samples using PCR/BDS analysis. ff hMPV was detected in 1/1 false positive samples using bi-directional sequencing analysis. gg,,hh Bordetella pertussis was not detected in 1/1 false positive sample using PCR/BDS analysis. ii Repeat PCR/BDS analysis was performed. B. parapertussis/bronchiseptica was not detected in 1/1 false positive sample. jj B. parapertussis was identified by PCR/BDS in 2/2 specimens.
Prospective Clinical Studies Mixed Infection Analysis
The RP Flex detected a total of 91 mixed infections in the prospective clinical evaluations. Eighty-six (86) (86/91; 94.5%) were double infections, four (4/91; 4.4%) were triple infections, and one (1/91; 1.1%) was quadruple infections. The single most common co-infection (27/91; 29.7%) was Rhinovirus with Adenovirus, followed by the second most common co-infection (22/91; 24.2%) of Rhinovirus with RSV B. Out of the 91 co-infections, 46 contained one or more analytes that had not been detected with the comparator method(s), i.e. discrepant co-infections.
Table 53: Distinct Co-infection Combinations Detected by the RP Flex in the Prospective Clinical Trial Distinct Co-infection Combinations
Detected by the RP Flex
Tot
al
Co-
infe
ctio
ns
Number of Discrepant
Co-infectionsa
Discrepant Analyte(s)a Analyte 1 Analyte 2
Analyte 3
Analyte 4
Adenovirus Rhinovirus 27 18 Adenovirus (16); Rhinovirus (3) Rhinovirus RSV B 22 7 Rhinovirus (4); RSV B (4) Adenovirus RSV B 5 1 Adenovirus (1); RSV B (1) Adenovirus Rhinovirus RSV B 3 3 Adenovirus (3); RSV B (1) Adenovirus hMPV 3 1 Adenovirus (1) Rhinovirus Parainfluenza 1 3 1 Rhinovirus (1) Rhinovirus Parainfluenza 4 3 1 Parainfluenza 4 (1) Rhinovirus RSV A 3 2 Rhinovirus (2) Rhinovirus Parainfluenza 3 2 1 Rhinovirus (1); Parainfluenza 3 (1) Rhinovirus hMPV 2 1 hMPV (1)
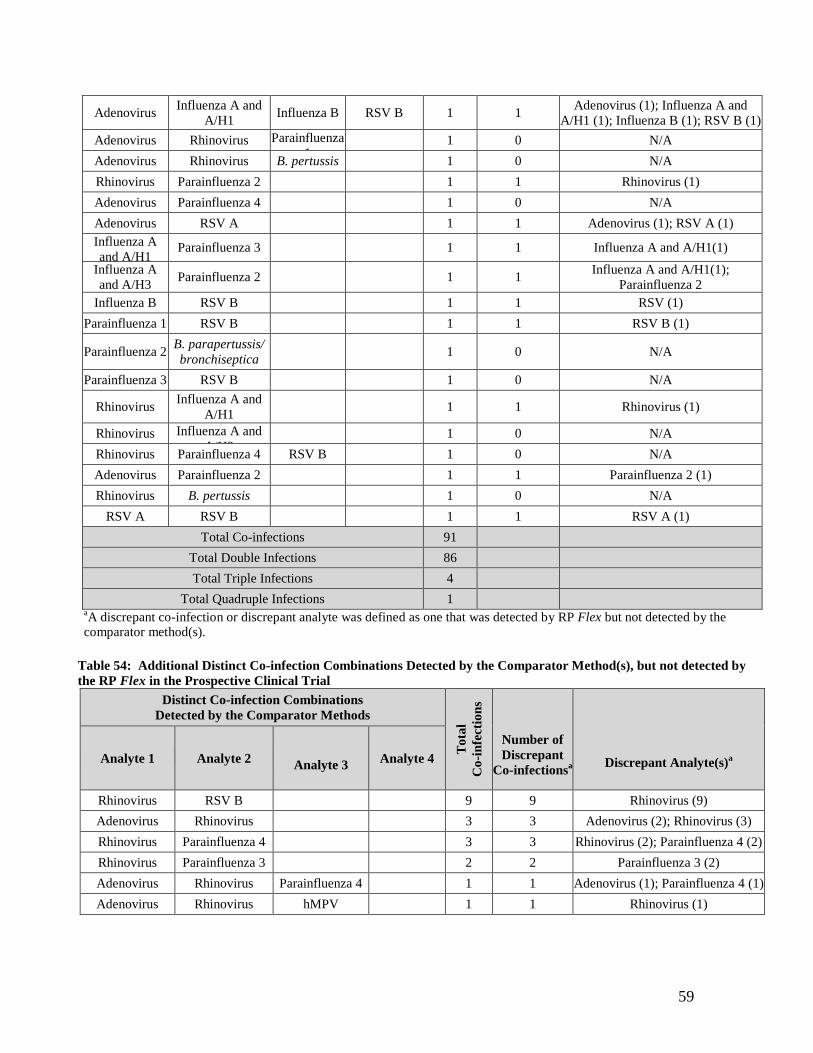
59
Adenovirus Influenza A and A/H1 Influenza B RSV B 1 1 Adenovirus (1); Influenza A and
A/H1 (1); Influenza B (1); RSV B (1) Adenovirus Rhinovirus Parainfluenza
1 1 0 N/A
Adenovirus Rhinovirus B. pertussis 1 0 N/A Rhinovirus Parainfluenza 2 1 1 Rhinovirus (1) Adenovirus Parainfluenza 4 1 0 N/A Adenovirus RSV A 1 1 Adenovirus (1); RSV A (1) Influenza A and A/H1
Parainfluenza 3 1 1 Influenza A and A/H1(1)
Influenza A and A/H3 Parainfluenza 2 1 1 Influenza A and A/H1(1);
Parainfluenza 2 Influenza B RSV B 1 1 RSV (1)
Parainfluenza 1 RSV B 1 1 RSV B (1)
Parainfluenza 2 B. parapertussis/ bronchiseptica 1 0 N/A
Parainfluenza 3 RSV B 1 0 N/A
Rhinovirus Influenza A and A/H1 1 1 Rhinovirus (1)
Rhinovirus Influenza A and A/H3
1 0 N/A Rhinovirus Parainfluenza 4 RSV B 1 0 N/A Adenovirus Parainfluenza 2 1 1 Parainfluenza 2 (1) Rhinovirus B. pertussis 1 0 N/A
RSV A RSV B 1 1 RSV A (1) Total Co-infections 91
Total Double Infections 86 Total Triple Infections 4
Total Quadruple Infections 1 aA discrepant co-infection or discrepant analyte was defined as one that was detected by RP Flex but not detected by the comparator method(s).
Table 54: Additional Distinct Co-infection Combinations Detected by the Comparator Method(s), but not detected by the RP Flex in the Prospective Clinical Trial
Distinct Co-infection Combinations Detected by the Comparator Methods
Tot
al
Co-
infe
ctio
ns
Number of Discrepant
Co-infectionsa
Discrepant Analyte(s)a Analyte 1 Analyte 2
Analyte 3
Analyte 4
Rhinovirus RSV B 9 9 Rhinovirus (9) Adenovirus Rhinovirus 3 3 Adenovirus (2); Rhinovirus (3) Rhinovirus Parainfluenza 4 3 3 Rhinovirus (2); Parainfluenza 4 (2) Rhinovirus Parainfluenza 3 2 2 Parainfluenza 3 (2) Adenovirus Rhinovirus Parainfluenza 4 1 1 Adenovirus (1); Parainfluenza 4 (1) Adenovirus Rhinovirus hMPV 1 1 Rhinovirus (1)

60
Adenovirus Parainfluenza 2 RSV B 1 1 Parainfluenza 2 (1)
Rhinovirus Influenza A and A/H1 1 1 Rhinovirus (1)
Parainfluenza 1 RSV B 1 1 Parainfluenza 1 (1) Parainfluenza 2 Parainfluenza 4 1 1 Parainfluenza 4 (1)
Total Co-infections 23 Total Double Infections 20 Total Triple Infections 3
Total Quadruple Infections 0 a This table includes only distinct co-infections that were detected by the comparator method(s) but not by RP Flex; the remaining co-infections detected by the comparator methods are already represented in Table 53 above.
Retrospective Clinical Study
A retrospective clinical evaluation of the RP Flex was also performed to supplement the prospective evaluation data. In this study, retrospective pre-selected archived specimens were further confirmed by the same comparator methods described in the “Prospective Clinical Studies” section previously. The retrospective pre-selected archived specimens were randomly distributed to a total of six testing sites in the U.S., the same five testing sites as described in the “Prospective Clinical Studies” section previously plus one additional testing site located in the Southeast, and tested with the RP Flex from July 2014 thru March 2015.
Frozen Archived Retrospective Specimens (Selected) Nanosphere worked with four laboratories in the U.S., one in the Southeast (Atlanta, GA), one in the Midwest (South Bend, IN), one in the Southwest (Albuquerque, NM), and one in the Mid-Atlantic (Chapel Hill, NC), to source selected frozen archived retrospective specimens for analytes with lower prevalence. Frozen specimens were residual, de-identified and consisting of ≥ 1.0 mL NPS specimens collected in VTM. Specimens were stored at ≤ -70°C and shipped frozen to the sponsor. Prior to sending specimens to the study testing sites, the sponsor thawed, split, and de-identified the specimens for study use by assigning a unique study identification number. Specimens were randomized and shipped to the testing sites in accordance with the site’s availability to receive and test specimens. One aliquot was immediately stored at ≤-70°C and subsequently shipped overnight on dry ice, to a third-party reference laboratory for comparator testing using an FDA-cleared multiplexed respiratory pathogens panel. Another aliquot was immediately stored at ≤ -70°C and shipped overnight on dry ice, to the testing sites for Verigene RP Flex testing. Upon receipt, study testing sites stored the samples at ≤ -70°C until ready to test.
Verigene RP Flex Testing of Retrospective Specimens
Frozen selected retrospective samples were tested within 48 hours of sample thaw at the test sites. If a specimen test yielded a result of a) No Call or b) Pre-Analysis Error

61
(PAE), the specimen was re-tested using 200 μL from the remaining sample volume in accordance with study protocol. If a specimen could not be re-tested within 48 hours of collection, it was frozen until the repeat test could be performed. At the conclusion of each Verigene RP Flex test, the residual nucleic acids were collected from the Extraction Tray into a microcentrifuge tube and stored frozen at ≤ -70°C. The tube was shipped overnight on dry ice to the sponsor and was sent to a third party laboratory for PCR/BDS testing. In the event that a sample residual nucleic acids in the Extraction Tray was less than 50 μL (insufficient volume for required PCR/BDS testing), repeat RP Flex testing was performed to generate additional volume of nucleic acids. However, the first RP Flex test was used as the test of record for all performance calculations.
Frozen Archived Retrospective Specimens (Selected) Comparator Methods Testing
The “Retrospective Selected” specimens consisted of positive specimens (as identified by the acquisition site) collected and frozen at ≤ -70°C. These specimens were tested using the same comparator methods described in the “Prospective Clinical Studies” section previously to confirm the results that were provided to Nanosphere by the original acquisition sites. The comparator method(s) results (an FDA-cleared multiplexed respiratory pathogens panel or PCR/BDS) were compared to the results provided to Nanosphere by the original acquisition sites. If the expected results agreed, the specimen was enrolled into the study for Verigene RP Flex testing. If the expected results did not agree, the specimen was not enrolled into this study. In the event that the specimen was positive by the FDA-cleared multiplexed respiratory pathogens panel for the expected result and additional target(s) were detected, the specimen was enrolled as positive for the additional targets as well.
Table 55 shows the number of specimens acquired for each target and the percent for which the comparator method(s) agreed with the expected results. Fifty three (53) enrolled specimens were positive for the expected target and at least one additional target.
Table 55: Comparator Method(s) Testing Results of the Initially Acquired Selected Retrospective Specimens Analytes Number of Specimens
Acquired Number of Specimens with Results Confirmed by Comparator Method(s)
Percent of Specimens with Results Confirmed by Comparator Method(s)
Adenovirus 45 38 84.4% hMPV 25 23 92.0% Influenza A* 7 N/A N/A Influenza A/H1 41 41 100% Influenza A/H3 85 83 97.6% Influenza B 26 26 100% Parainfluenza 1 57 50 87.7% Parainfluenza 2 40 25 62.5% Parainfluenza 3 33 32 97.0% Parainfluenza 4 51 41 80.3% Rhinovirus 8 8 100%

62
RSV* 5 N/A N/A RSV A 55 54 98.2% RSV B 25 25 100% B. pertussis 54 30 55.6% B. parapertussis/bronchiseptica 5 5 100%
B. holmesii 1 1 100% Negative 49 44 89.8% Total 612 526 85.9% * These specimens were DFA positive and thus not subtyped before testing by the reference method(s)
Quality Control Testing
Quality Control testing was performed on each day of RP Flex testing, using a single-use aliquot of external positive and negative control samples provided by the sponsor. Control samples were shipped on dry ice to the study testing sites where they were stored frozen at ≤ -70°C until use. Controls were tested per the RP Flex IUO Package Insert instructions. If either control yielded a “PAE” or “No Call” test result, a new aliquot was tested per the study protocol.
Patient Demographics A total of 526 selected retrospective specimens with confirmed comparator method(s) testing results were included in this retrospective clinical study. The following table (Table 56) provides a summary of demographic information for the 526 selected retrospective that were enrolled in the retrospective study:
Table 56: Demographic Summary for RP Flex Retrospective Clinical Study Retrospective Selected Specimens
Age No. of Specimens Percentage 0-1 96 18.3%
>1-5 19 3.6% >5-12 23 4.4% >12-18 11 2.1% >19-64 12 2.3%
≥65 5 1.0% Not Provided 360 68.4%
Total 526 100%
Retrospective Selected Specimens Accountability A total of 526 retrospective selected specimens with confirmed comparator method(s) testing results were initially included in the retrospective clinical study for testing with the RP Flex. Of the 526 retrospective selected specimens, two specimens generated a “No Call” result initially by the RP Flex but were not retested per the product instructions, and were

63
therefore excluded from performance analyses; four specimens generated a “No Call” result initially and a “No Call” result again upon retesting by the RP Flex, and were therefore excluded from performance analyses. A total of 520 retrospective selected specimens were included in the performance analyses of the RP Flex in this study. Of the total of 520 retrospective clinical specimens that were included in performance analyses of the RP Flex, four specimens were excluded from the RP Flex performance analysis for Adenovirus due to the lack of Adenovirus comparator results; 11 specimens were excluded from the RP Flex performance analysis for Rhinovirus due to the lack of Rhinovirus comparator results; seven specimens were excluded from the RP Flex performance analysis for Influenza A due to the lack of Influenza A comparator results; eight specimens were excluded from the RP Flex performance analysis for Influenza A/H1 due to the lack of Influenza A/H1 comparator results; eight specimens were excluded from the RP Flex performance analysis for Influenza A/H3 due to the lack of Influenza A/H3 comparator results; four specimens were excluded from the RP Flex performance analysis for Influenza B due to the lack of Influenza B comparator results; four specimens were excluded from the RP Flex performance analysis for Parainfluenza 1 due to the lack of Parainfluenza 1 comparator results; four specimens were excluded from the RP Flex performance analysis for Parainfluenza 2 due to the lack of Parainfluenza 2 comparator results; four specimens were excluded from the RP Flex performance analysis for Parainfluenza 3 due to the lack of Parainfluenza 3 comparator results; four specimens were excluded from the RP Flex performance analysis for Parainfluenza 4 due to the lack of Parainfluenza 4 comparator results; 22 specimens were excluded from the RP Flex performance analysis for RSV A due to the lack of RSV A comparator results; 22 specimens were excluded from the RP Flex performance analysis for RSV B due to the lack of RSV B comparator results; four specimens were excluded from the RP Flex performance analysis for hMPV due to the lack of hMPV comparator results; four specimens were excluded from the RP Flex performance analysis for B. pertussis due to the lack of B. pertussis comparator results; 29 specimens were excluded from the RP Flex performance analysis for B. parapertussis/bronchiseptica due to the lack of B. parapertussis/bronchiseptica comparator results, and 28 specimens were positive for B. pertussis by RP Flex and therefore were excluded from the RP Flex performance analysis for B. parapertussis/bronchiseptica per RP Flex product instructions; 30 specimens were excluded from the RP Flex performance analysis for B. holmesii due to the lack of B. holmesii comparator results. Retrospective Clinical Study Performance The RP Flex retrospective performance data in positive percent and negative percent agreements against the comparator methods (all sites combined) are presented in the following Table 57 by analyte:

64
Table 57: RP Flex Retrospective Clinical Performance Organism PPA 95% CI NPA 95% CI Adenovirus 38/39a 97.4% 86.8% - 99.5% 469/477b 98.3% 96.7% - 99.1% Rhinovirus 28/35c 80.0% 64.1% - 90.0% 466/474d 98.3% 96.7% - 99.1% Influenza A 122/123e 99.2% 95.5% - 99.9% 387/390f 99.5% 97.8% - 99.7% Flu A/H1 40/41g 97.6% 87.4% - 99.6% 469/471h 99.6% 98.5% - 99.9% Flu A/H3 82/82 100% 95.5% - 100% 428/430i 99.5% 98.3% - 99.9% Influenza B 26/26 100% 87.1% - 100% 488/490j 99.6% 98.5% - 99.9% Parainfluenza Virus 1 50/50 100% 92.9% - 100% 466/466 100% 99.2% - 100% Parainfluenza Virus 2 28/28 100% 87.9% - 100% 487/488k 99.8% 98.8% - 100% Parainfluenza Virus 3 31/31 100% 89.0% - 100% 485/485 100% 99.2% - 100% Parainfluenza Virus 4 41/41 100% 91.4% - 100% 473/475l 99.6% 98.5% - 99.9% Respiratory Syncytial Virus A 55/58m 94.8% 85.9% - 98.2% 437/440n 99.3% 98.0% - 99.8% Respiratory Syncytial Virus B 23/23 100% 85.7% - 100% 468/475o 98.5% 97.0% - 99.3% Human Metapneumovirus 25/27p 92.6% 76.6% - 97.9% 488/489q 99.8% 98.8% - 100% B. pertussis 28/29r 96.6% 82.8% - 99.4% 487/487 100% 99.2% - 100% B. parapertussis/bronchiseptica
5/7s 71.4% 35.9% - 91.8%
455/456t 99.8% 98.8% - 100%
B. holmesii 1/2u 50.0% 9.4% - 90.1% 488/488 100% 99.2% - 100%
a Discordant analysis was not performed on 1/1 false negative sample. b Adenovirus was not detected in 5/8 and detected in 2/8 false positive samples using PCR/BDS analysis. Discordant analysis was not performed on 1/8 false positive samples. c Discordant analysis using PCR/BDS was not performed for the Rhinovirus false negative samples, as PCR/BDS is part of the reference method algorithm for this target. d Rhinovirus was not detected in 5/8 and detected in 1/8 false positive samples using PCR/BDS analysis in. Discordant analysis was not performed on 2/8 false positive samples. e Influenza A was not detected in 1/1 false negative sample using PCR/BDS analysis. f Influenza A was not detected in 2/3 false positive samples using PCR/BDS analysis. Discordant analysis was not performed on 1/3 false positive samples. g Influenza A/H1 was not detected in 1/1 false negative sample using PCR/BDS analysis. h Influenza A/H3 was not detected in 2/2 false positive samples using PCR/BDS analysis. i Influenza B was not detected in 2/2 false positive samples using PCR/BDS analysis. j Parainfluenza 2 was not detected in 1/1 false negative sample using PCR/BDS analysis. k Parainfluenza 4 was not detected in 1/2 false positive samples using PCR/BDS analysis. Discordant analysis was not performed on 1/2 false positive samples. l Discordant analysis using PCR/BDS was not performed for the RSV A false negative samples, as PCR/BDS is part of the reference method algorithm for this target.

65
m RSV A was not detected in 1/3 and detected in 1/3 false positive samples using PCR/BDS analysis. Discordant analysis was not performed on 1/3 false positive samples. n RSV A was not detected in 1/3 and detected in 1/3 false positive samples using bi-directional sequencing analysis. Discordant analysis was not performed in 1/3 samples. o RSV B was not detected in 5/7 false positive samples using PCR/BDS analysis. Discordant analysis was not performed on 2/7 false positive samples. p hMPV was not detected in 1/2 false negative samples using PCR/BDS analysis. Discordant analysis was not performed on ½ false negative samples. q Discordant analysis was not performed on 1/1 false positive hMPV sample. r Bordetella pertussis was not detected in 1/1 false negative sample using PCR/BDS analysis. s Repeat PCR/BDS analysis was performed. B. parapertussis/bronchiseptica was not detected in 1/2 and B. parapertussis was detected in 1/2 false negative samples. No B. bronchiseptica was identified by PCR/BDS in all 7 comparator positive specimens. t Repeat PCR/BDS analysis was performed. B. parapertussis/bronchiseptica was not detected in 1/1 false positive sample. u Repeat PCR/BDS analysis was performed. B. holmesii was not detected in 1/2 false negative samples. Contamination from a strong positive contrived B. holmesii sample in a neighboring well during the original PCR/BDS analysis is highly suspected.
Mock Clinical Study
Frozen contrived NPS in VTM specimens for three bacteria with very low prevalence in the prospective clinical studies and for which retrospective natural NPS specimens in VTM are difficult to acquire were prepared by spiking bacterial strains of known origin and concentration into unique previously-screened, negative clinical NPS specimens in VTM. Organisms used in these preparations were obtained from the following sources: American Type Culture Collection (ATCC), BEI Resources, Nationwide Children’s Hospital (NCH), and Zeptometrix. A summary of contrived positive clinical specimens included in this study are provided in Tables 58 - 60. Contrived specimens were blinded and assigned Nanosphere identification numbers at Nanosphere, shipped to the three testing sites on dry ice and tested at the study testing sites. The testing sites stored the samples at ≤ -70°C until ready for Verigene RP Flex testing, at which point the samples were thawed and tested. To avoid bias, a total of 201 negative NPS specimens were blinded and randomized and included with the positive spiked samples to be tested by testing sites.
Table 58: Contrived Clinical Specimens Using Bordetella holmesii Stocks (n = 56)
Sample Source Strain Test Site Multiples of LoD
Final Concentration
(CFU/mL) 1
NCH 29573 Site 1
2 4.86E+03 2 2 4.86E+03 3 3 7.29E+03 4 3 7.29E+03 5 5 1.22E+04 6 10 2.43E+04 7 20 4.86E+04 8 20 4.86E+04 9 NCH 29628 2 4.86E+03
10 2 4.86E+03

66
11 3 7.29E+03 12 3 7.29E+03 13 5 1.22E+04 14 10 2.43E+04 15 20 4.86E+04 16 20 4.86E+04 17
NCH 29547
2 4.86E+03 18 2 4.86E+03 19 3 7.29E+03 20 3 7.29E+03 21 5 1.22E+04 22 10 2.43E+04 23 20 4.86E+04 24 20 4.86E+04 25
NCH 29546
2 4.86E+03 26 2 4.86E+03 27 3 7.29E+03 28 3 7.29E+03 29 5 1.22E+04 30 10 2.43E+04 31 20 4.86E+04 32 20 4.86E+04 33
NCH 29613 3 7.29E+03
34 2 4.86E+03 35 2 4.86E+03 36
NCH 29575
3 7.29E+03 37 3 7.29E+03 38 5 1.22E+04 39 10 2.43E+04 40 2 4.86E+03 41
NCH 29574
2 4.86E+03 42 2 4.86E+03 43 3 7.29E+03 44 3 7.29E+03 45 5 1.22E+04 46 10 2.43E+04 47 20 4.86E+04 48 20 4.86E+04 49
NCH 29572
2 4.86E+03 50 2 4.86E+03 51 3 7.29E+03 52 3 7.29E+03 53 5 1.22E+04 54 10 2.43E+04 55 20 4.86E+04 56 20 4.86E+04
Table 59: Contrived Clinical Specimens Using Bordetella bronchiseptica Stocks (n = 55) Sample Source Strain Test Site Multiples of
LoD Final Concentration
(CFU/mL) 1
ATCC 4617 Site 2 2 4.86E+03
2 2 4.86E+03 3 3 7.29E+03

67
4 3 7.29E+03 5 5 1.22E+04 6 10 2.43E+04 7 20 4.86E+04 8 20 4.86E+04 9
ATCC 7773
2 4.86E+03 10 2 4.86E+03 11 3 7.29E+03 12 3 7.29E+03 13 5 1.22E+04 14 10 2.43E+04 15 20 4.86E+04 16 20 4.86E+04 17
ATCC 785
2 4.86E+03 18 2 4.86E+03 19 3 7.29E+03 20 3 7.29E+03 21 5 1.22E+04 22 10 2.43E+04 23 20 4.86E+04 24 20 4.86E+04 25
ATCC 14064
2 4.86E+03 26 2 4.86E+03 27 3 7.29E+03 28 3 7.29E+03 29 5 1.22E+04 30 10 2.43E+04 31 20 4.86E+04 32 20 4.86E+04 33
ATCC 10580
2 4.86E+03 34 2 4.86E+03 35 3 7.29E+03 36 3 7.29E+03 37 5 1.22E+04 38 10 2.43E+04 39 20 4.86E+04 40 20 4.86E+04 41
ATCC 19395 Site 3
2 4.86E+03 42 2 4.86E+03 43 3 7.29E+03 44 3 7.29E+03 45 5 1.22E+04 46 20 4.86E+04 47 20 4.86E+04 48
ATCC 786 Site 2
2 4.86E+03 49 2 4.86E+03 50 3 7.29E+03 51 3 7.29E+03 52 5 1.22E+04 53 10 2.43E+04 54 20 4.86E+04 55 20 4.86E+04
Table 60: Contrived Clinical Specimens Using Bordetella parapertussis Stocks (n = 49) Sample Source Strain Test Site Multiples of
LoD Final Concentration
(CFU/mL) 1
ATCC 15237 Site 3
2 4.86E+03 2 2 4.86E+03 3 3 7.29E+03 4 3 7.29E+03 5 5 1.22E+04 6 10 2.43E+04 7 20 4.86E+04 8 20 4.86E+04

68
9
ATCC 9305
2 4.86E+03 10 2 4.86E+03 11 3 7.29E+03 12 3 7.29E+03 13 5 1.22E+04 14 10 2.43E+04 15 20 4.86E+04 16 20 4.86E+04 17
ATCC BAA-587
2 4.86E+03 18 2 4.86E+03 19 3 7.29E+03 20 3 7.29E+03 21 5 1.22E+04 22 10 2.43E+04 23 20 4.86E+04 24 20 4.86E+04 25
ATCC 15989
2 4.86E+03 26 2 4.86E+03 27 3 7.29E+03 28 3 7.29E+03 29 5 1.22E+04 30 10 2.43E+04 31 20 4.86E+04 32 20 4.86E+04 33
ATCC 15311
2 4.86E+03 34 2 4.86E+03 35 3 7.29E+03 36 3 7.29E+03 37 5 1.22E+04 38 10 2.43E+04 39 20 4.86E+04 40 20 4.86E+04 41
ATCC 29686
2 4.86E+03 42 2 4.86E+03 43 2 4.86E+03 44 3 7.29E+03 45 3 7.29E+03 46 5 1.22E+04 47 10 2.43E+04 48 20 4.86E+04 49 20 4.86E+04
The RP Flex mock clinical study (contrived samples) performance data in positive percent and negative percent agreements against the expected results (all sites combined) are presented in the following Table 61 by analyte. One negative contrived sample generated a “No Call” result initially and a “No Call” result again upon retesting per the product instructions by the RP Flex, and was therefore excluded from this performance analysis.
Table 61: RP Flex Mock Clinical Performance (Contrived Samples)
Organism PPA 95% CI NPA 95% CI Adenovirus N/A N/A N/A 358/360 99.4% 98.0% - 99.8% Rhinovirus N/A N/A N/A 359/360 99.7% 98.4% - 99.9% Influenza A N/A N/A N/A 360/360 100% 98.9% - 100% Flu A/H1 N/A N/A N/A 360/360 100% 98.9% - 100%

69
Flu A/H3 N/A N/A N/A 360/360 100% 98.9% - 100% Influenza B N/A N/A N/A 360/360 100% 98.9% - 100% Parainfluenza Virus 1 N/A N/A N/A 360/360 100% 98.9% - 100% Parainfluenza Virus 2 N/A N/A N/A 360/360 100% 98.9% - 100% Parainfluenza Virus 3 N/A N/A N/A 360/360 100% 98.9% - 100% Parainfluenza Virus 4 N/A N/A N/A 360/360 100% 98.9% - 100% Respiratory Syncytial Virus A N/A N/A N/A 360/360 100% 98.9% - 100% Respiratory Syncytial Virus B N/A N/A N/A 359/360 99.7% 98.4% - 99.9% Human Metapneumovirus N/A N/A N/A 358/360 99.4% 98.0% - 99.8% B. pertussis N/A N/A N/A 360/360 100% 98.9% - 100% B. parapertussis 49/49 100% 92.7% - 100% 311/311 100% 98.8% - 100% B. bronchiseptica 55/55 100% 93.5% - 100% 305/305 100% 98.8% - 100% B. holmesii 56/56 100% 93.6% - 100% 304/304 100% 98.6% - 100%
Initial No Call Results and Pre-Analysis Errors (PAE) During Clinical Testing
For the total of 3299 specimens tested with the RP Flex in the clinical trials (i.e., 1082 fresh prospective specimens, 1330 frozen prospective specimens, 526 frozen selected retrospective specimens, and 361 frozen contrived specimens), there were 152 specimens that had an initial “No Call” result. Therefore, the initial No Call rate was 4.6% (152/3299) (95% CI: 3.9% - 5.4%). Upon repeat testing per the product instructions, all of the specimens except 15 yielded a valid call, resulting in a final No Call rate of 0.5% (15/3299) (95% CI: 0.3% - 0.7%). For a total of 1082 fresh natural specimens, the initial No Call rate was 5.9% (64/1082) (95% CI: 4.7% - 7.5%), and the final No Call rate upon repeat testing per the product instructions was 0.6% (6/1082) (95% CI: 0.3% - 1.2%). For the total of 1856 frozen natural specimens, the initial No Call rate was 4.5% (84/1856) (95% CI: 3.7% - 5.6%), and the final No Call rate upon repeat testing per the product instructions was 0.4% (8/1856) (95% CI: 0.2% - 0.8%) There were a total of 17 PAEs observed during the clinical studies for a PAE failure rate of 0.5% (17/3299) (95% CI: 0.3% - 0.8%). Upon repeat testing per the product instructions, all of the specimens yielded a valid call.

70
The total initial No Call and PAE rate observed during the clinical studies was 5.1% (169/3299) (95% CI: 4.4% - 5.9%). Upon repeat testing per the product instructions, the final No Call and PAE rate was 0.5% (15/3299) (95% CI: 0.3% - 0.7%).
4. Clinical cut-off: Not applicable
5. Expected values/Reference range:
Table 62: Expected Value (As Determined by RP Flex) Summary by Collection Site for the RP Flex Prospective Clinical Evaluation (Fresh Prospective Specimens) (July 2014 – November 2014)
Overall (n=815) Site 1 (n=34) Mid-Atlantic
Site 2 (n=54) Northeast
Site 3 (n=248) Midwest
Site 4 (n=4) Midwest
Site 5 (n=437) Southwest
Site 6 (n=38) Mexico
No. Expected Value
No. Expected Value
No. Expected Value
No. Expected Value
No. Expected Value
No. Expected Value
No. Expected Value
Influenza A 10 1.2% 0 0.0% 0 0.0% 1 0.4% 0 0.0% 8 1.8% 1 2.6% Flu A/H1 2 0.2% 0 0.0% 0 0.0% 1 0.4% 0 0.0% 1 0.2% 0 0.0% Flu A/H3 7 0.9% 0 0.0% 0 0.0% 0 0.0% 0 0.0% 6 1.4% 1 2.6% Influenza B 12 1.5% 0 0.0% 1 1.8% 0 0.0% 0 0.0% 8 1.8% 3 7.9% RSV A 1 0.1% 0 0.0% 0 0.0% 1 0.4% 0 0.0% 0 0.0% 0 0.0 RSV B 3 0.4% 0 0.0% 0 0.0% 2 0.8% 0 0.0% 0 0.0% 1 2.6% Parainfluenza 1 0 0.0% 0 0.0% 0 0.0% 0 0.0% 0 0.0% 0 0.0% 0 0.0% Parainfluenza 2 13 1.6% 2 5.9% 1 1.8% 0 0.0% 0 0.0% 8 1.8% 0 0.0% Parainfluenza 3 8 1.0% 0 0.0% 2 3.6% 2 0.8% 0 0.0% 5 1.1% 0 0.0% Parainfluenza 4 1 0.1% 0 0.0% 0 0.0% 1 0.4% 0 0.0% 1 0.2% 0 0.0% Adenovirus 43 5.3% 0 0.0% 1 1.8% 0 0.0% 0 0.0% 26 5.9% 0 0.0% hMPV 4 0.5% 0 0.0% 0 0.0% 2 0.8% 1 25.0% 0 0.0% 1 2.6 Rhinovirus 231 28.3% 7 20.6% 16 29.1% 57 30.0% 1 25.0% 145 33.2% 5 13.2 B. parapertussis/ bronchiseptica
2 0.2% 1 2.9% 0 0.0% 1 0.4% 0 0.0% 0 0.0% 0 0.0%
B. pertussis 2 0.2% 0 0.0% 0 0.0% 1 0.4% 0 0.0% 1 0.2% 0 0.0% B. holmesii 1 0.1% 0 0.0% 1 1.8% 0 0.0 0 0.0% 0 0.0% 0 0.0%
Table 63: Expected Value (As Determined by RP Flex) Summary by Collection Site for the RP Flex Prospective Clinical Evaluation (Fresh Prospective Specimens) (February 2015 – March 2015)
Overall (n=254)
Site 2 (n=147) Northeast
Site 7 (n=107) Midwest
No. Expected Value
No. Expected Value
No. Expected Value
Influenza A 9 3.5% 9 6.2% 0 0.0% Flu A/H1 0 0.0% 0 0.0% 0 0.0% Flu A/H3 9 3.5% 9 6.2% 0 0.0% Influenza B 44 17.3% 31 21.2% 13 12.1% RSV A 12 4.7% 8 5.5% 4 3.7% RSV B 9 3.5% 6 3.8% 3 2.8% Parainfluenza 1 0 0.0% 0 0.0% 0 0.0% Parainfluenza 2 1 0.4% 1 0.7% 0 0.0% Parainfluenza 3 5 2.0% 1 0.7% 4 3.7% Parainfluenza 4 2 0.8% 2 1.4% 0 0.0% Adenovirus 4 1.6% 1 0.7% 3 2.8% hMPV 11 4.3% 7 4.8% 4 3.7% Rhinovirus 15 5.9% 8 5.5% 7 6.5% B. parapertussis/bronchiseptica 0 0.0% 0 0.0% 0 0.0% B. pertussis 0 0.0% 0 0.0% 0 0.0% B. holmesii 0 0.0% 0 0.0% 0 0.0%

71
Table 64: Expected Value (As Determined by RP Flex) Summary by Collection Site for the RP Flex Prospective Clinical Evaluation (Frozen Prospective Specimens) (October 2013 – March 2014) Site 3 (n=1317)
Midwest No. Expected Value
Influenza A 52 3.9% Flu A/H1 49 3.7% Flu A/H3 1 0.1% Influenza B 1 0.1% RSV A 7 0.5% RSV B 185 14.0% Parainfluenza 1 29 2.2% Parainfluenza 2 1 0.1% Parainfluenza 3 4 0.3% Parainfluenza 4 20 1.5% Adenovirus 68 5.2% hMPV 37 2.8% Rhinovirus 207 15.7% B. parapertussis/bronchiseptica 1 0.1% B. pertussis 8 0.6% B. holmesii 0 0.0%
N. Instrument Name: Verigene System
O. System Descriptions:
1. Modes of Operation:
The Verigene Respiratory Pathogens Flex Nucleic Acid Test (RP Flex) is conducted on the Verigene System, which is a “sample-to-result”, fully automated, bench-top molecular diagnostics workstation. The Verigene System consists of two components: the Verigene Reader and the Verigene Processor SP. A single Verigene Reader may be connected to up to 32 Processor SP units. Each Processor SP unit can be accessed independently through the Reader to run different tests. Each test utilizes single-use, disposable test consumables and a self-contained Verigene Test Cartridge to analyze nucleic acid samples. The RP Flex test is run on the Verigene System, which incorporates automated nucleic acid extraction, amplification, and target detection of specific viral and bacterial nucleic acid gene sequences.
2. Software:
FDA has reviewed applicant’s Hazard Analysis and software development processes for this line of product types:
Yes ____X____ or No ________
3. Specimen Identification:

72
User enters Patient ID/Sample ID by typing it in.
4. Specimen Sampling and Handling:
Not applicable
5. Calibration:
Not applicable
6. Quality Control: The RP Flex microarray contains two sets of oligonucleotide spots that are used as process controls to check for proper fluid control, extraction, amplification, hybridization and signal detection. The IC1 (hybridization control) internal processing control probes detect the presence (hybridization and signal enhancement) of a DNA oligonucleotide and mediator oligo contained within the Sample Buffer on the Extraction Tray. The IC2 (extraction control) control probes verify the presence of an amplicon for Bacteriophage MS2, which is added to the sample prior to the nucleic acid extraction step. Both the internal processing controls IC1 and IC2 must be present for a valid respiratory pathogen Not Detected call for all targets to be reported. If IC1 or IC2 is Not Detected, a No Call – INT CTL 1 or a No Call – INT CTL 2 result, respectively, is generated. If both IC1 and IC2 are Not Detected, a No Call – INT CTL result is generated. The IC2 is not utilized for the detection of positive samples. The IC1 is required for the detection of positive samples.
A set of regions on microarray which do not contain capture oligonucleotides is used as a control for background signal levels. If the signal in these background regions is too high, a No Call - BKGD is generated. Additionally, negative control oligomer spots are included on the array to ensure the hybridization stringency was sufficient. If the negative control signal is too high a No Call – NEG CTL is generated.
Each capture probe has six separate oligonucleotide spots on the microarray in six different areas. Mathematical algorithms, called spot filters, compare the array spot signals for a particular target as a set. Any individual spot signal in the target set that are determined to be outliers are discarded. After applying the spot filters, the probe set must include four or more capture spots for a Call decision to be made for a target. Additionally, the coefficient of variation of spot intensities in the set must be less than or equal to 70%. If these requirements are not met a No Call - VARIATION results. The spot signal comparison algorithms protect against some hybridization failures and also against fluidics failures such as the partial filling of the hybridization chamber. External controls are not provided with the RP Flex. However, the sponsor is making the following recommendations regarding running external controls in the product package insert:

73
“Good laboratory practice recommends running external positive and negative controls regularly. As an example, viral transport medium may be used as the external Negative Control, and previously characterized positive samples or negative sample spiked with well characterized target organisms may be used as external Positive Controls. External controls should be used in accordance with local, state, federal accrediting organizations, as applicable.”
P. Other Supportive Instrument Performance Characteristics Data Not Covered In the “Performance Characteristics” Section above:
Not applicable
Q. Proposed Labeling:
The labeling is sufficient and it satisfies the requirements of 21 CFR Part 809.10.
R. Conclusion:
The submitted information in this premarket notification is complete and supports a substantial equivalence decision