5101-31 - jet propulsion laboratory perf... · 5101-31 acknowledgment the authors wish to express...
TRANSCRIPT


5101-31
LOW-COST SILICON SOLAR ARRAY PROJECT
Thermal Performance Testing and Analysis
of
Photovoltaic Modules in Natural Sunlight
July 29 , 1977
J. W. Stultz L. C. Wen
Approved by:
R. G. Ross LSSA Engineering Manager
5101-31
ACKNOWLEDGMENT
The authors wish to express their thanks to the following individuals for their contributions to this effort. Joe Stump installed the modules and associated hardware, Don E. Lewis was responsible for the instrumentation, and Dick Grippi designed the support structure.
ii

Symbol
A b F f G h IC L M Q s T ~T V
cell
5101-31
DEFINITION OF SYMBOLS
· Description
Area Backside of the Module Radiation Configuration or Shape Factor Frontside of the Module Ground Convective Heat Transfer Coefficient Inter-cell Solar Irradiance Module Rate of Energy Sky Temperature Temperature Difference Average Wind Velocity Photovoltaic Cell
air Local Air E Hemispherical Emissivity ~ Solar Cell Conversion Efficiency
Solar Transmissivity Solar Absorptivity Stefan-Boltzman Constant Array/Module Tilt Angle
iii
Units (If Applicable)
2 m
w

5101-31
CONTENTS
I. INTRODUCTION------------------------------------------------ 1-1
II. STUDY APPROACH AND ORGANIZATION----------------------------- 2-1
III. TEST HARDWARE AND INSTRUMENTATION--------------------------- 3-1
A. MODULE PHYSICAL PROPERTIES---------------------------- 3-1
B. TEST SETUP---------------------------~---------------- 3-1
C. SOLAR MEASUREMENTS------------------------------------ 3-1
D. WIND MEASUREMENTS------------------------------------- 3-6
E. TEMPERATURE MEASUREMENTS------------------------------ 3-7
IV. MODULE THERMAL PERFORMANCE TESTS---------------------------- 4-1
A. OPERATING TEMPERATURE MEASUREMENTS-------------------- 4-1
B. CONVECTIVE HEAT TRANSFER MEASUREMENTS----------------- 4-4
V. MODULE THERMAL ANALYSES------------------------------------- 5-1
A. OPEN FRAME MOUNTING----------------------------------- 5-4
B. ROOF MOUNTING----------------------------------------- 5-4
VI. DEVELOPMENT OF A STANDARD THERMAL TEST PROCEDURE------------ 6-1
VII. CONCLUSIONS------------------------------------------------- 7-1
REFERENCES ------------------------------------------------------- 8-1
APPENDIXES
A. DETERMINATION OF NOMINAL OPERATING CELL TEMPERATURE --- A-1
V

5101-31
Figures
3-1. Typical Off-The-Shelf Photovoltaic Modules in 1976 --------------------------------------- 3-2
3-2. Spectrolab's Glass and Transparent Substrate Module-------------------------------------- 3-3
3-3. Cross-Sectional Views of the Modules------------------ 3-5
3-4. Front View of Test Frame for Spectrolab Module-------- 3-8
3-5. Rear View of Test Frame for Spectrolab Module--------- 3-9
3-6. Test Frame for Sensor Technology Module--------------- 3-9
3-7. Test Frame for Solarex Module------------------------- 3-10
3-8. Test Frame for Solar Power Module--------------------- 3-10
3-9. Test Frame for M-7 Module----------------------------- 3-11
3-10. Mark VI Pyranometer ----------------------------------- 3-11
3-11. Eppley Pyranometer ------------------------------------ 3-12
3-12. Correlation Between Measurements of Mark VI and Eppley Pyranometers ------------------------------- 3-12
3-13. Correlations Between Measurements of Mark VI Pyranometer and a Solar Cell Unit-------------------------------------------------- 3-13
3-14. Wind Transducer--------------------------------------- 3-14
3-15. Typical Wind Conditions at JPL Test Site-------------- 3-15
4-1. ~T vs Insolation of the Five Module Designs----------- 4-2
4-2. ~T vs Insolation of Reference Plate on the Solarex Array------------------------------------- 4-3
4-3. Temperature Response of Reference Plates at Different Locations-------------------------------- 4-5
4-4. Representative Insolation Profile and Average Wind Speed---------~-------------------------- 4-6
4-5. Temperature Profile of Spectrolab Module-------------- 4-7
4-6. Temperature Profile of Sensor Technology Module------- 4-7
4-7. Temperature Profile of Solarex Module----------------- 4-8
vi
5101-31
4-8. Temperature Profile of Solar Power Module------------- 4-8
4-9. Temperature Profile of M-7 Module--------------------- 4-9
4-10. Convective Film Coefficient of Smooth Glass, Based on Field Test Data by ASHRAE -------------------- 4-10
4-11. Module Design Thermal Effectiveness------------------- 4-12
4-12. Calculated Forced Convection Heat Transfer Coefficient for Fan-Induced Air Movement on Front Face of Reference Plate------------------------- 4-14
5-1. Thermal Model Network--------------------------------- 5-2
5-2. Direct View Factor Relationship as a Function of Array Tilt Angle ---------------------. ---- 5-3
5-3. Cell Temperatures for Design Variations of Spectrolab Module (Open Frame Mounting) --------------- 5-5
5-4. Cell Temperatures for Design Variations of Sensor Technology Module (Open Frame Mounting) -------------~- 5-6
5-5. Cell Temperatures for Design Variations of Solarex Module (Open Frame Mounting) --------------- 5-7
5-6. Cell Temperatures for Design Variations of Solar Power Module (Open Frame Mounting)-------------- 5-8
5-7. Cell Temperatures for Design Variations of M-7 Module (Open Frame Mounting)------------------- 5-9
5-8. Configuration of Roof Top Mounting-------------------- 5-10
5-9. Cell Temperatures for Design Variations of Spectrolab Module (Roof Mounting)------------------ 5-11
5-10. Cell Temperatures for Design Variations of Sensor Technology Module (Roof Mounting)-------------- 5-12
5-11. Cell Temperatures for Design Variations of Solarex Module (Roof Mounting)--------------------- 5-13
5-12. Cell Temperatures for Design Variations of Solar Power Module (Roof Mounting)----------------- 5-14
5-13. Cell Temperatures for Design Variations of M-7 Module (Roof Mounting)------------------------- 5-15
6-1. Module Annual Energy Output vs Insolation Level on Tilted Array--------------------------------- 6-2
vii

5101-31
6-2. Module Annual Energy Output vs Cell Temperature------------------------------------------- 6-3
6-3. Morning and Afternoon AT vs Insolation for the Solarex Module-------------------------------- 6-5
6-4. Morning and Afternoon AT vs Insolation for the Spectrolab Module----------------------------- 6-5
6-5. Variation of (Tce11-Ta1r> vs Insolation Level for a Typical Solar Cell Module----------------- 6-6
Tables
6-6. Correction Factor for (Tcell - Tair> ------------------ 6-8
6-7. Calculated Variation in (Teel! - Ta1r> and Correction Factors-------------------------------- 6-9
A-1. Typical Cell Temperature Data------------------------- A-3
A-2. NOCT Correction Factor-------------------------------- A-4
A-3. Test Description Page--------------------------------- A-9
3-1. Solar Cell Module Specifications---------------------- 3-4
3-2. Optical Properties of Module Components (Nominal Values)-------------------------------------- 3-6
3-3. Thermophysical Properties of Solar Module Material---- 3-7
6-1. Thermal Performance Test Summary -Second Phase------------------------------------------ 6-10
viii

5101-31
I. INTRODUCTION
The electrical power output of photovoltaic solar cell modules is dependent upon the operating temperature of the cells, and decreases at a rate of approximately 0.5%/°C with increasing cell temperature. Because of this temperature sensitivity, it is important to understand the thermal characteristics of modules so that modules and their supporting structures can be designed to reduce cell temperature to the extent that it is cost-effective. An understanding of module operating temperature characteristics is also necessary to allow accurate prediction of module power output under field operating conditions, and to allow accurate comparison of the field electrical performance of alternate module designs.
The activity described in this report was conducted throughout 1976 as a part of the Engineering Area of the JPL Low-cost Silicon Solar Array (LSSA) Project. At the start of the investigation, available data was limited on several key parameters necessary to design, predict, and compare the thermal-electrical performance of terrestrial flat-plate solar cell modules. In particular, the thermal performance of current commercially available modules was unknown and the thermal significance of the key environmental and module thermal parameters was not well understood. As a result, a combined study was undertaken to characterize the thermal properties and performance of currently available module types and, simultaneously, to develop a basic understanding of the important thermal properties (environmental and module-related) that could guide future module developments.
This report presents the results of this study and provides important data in several areas including:
(1) Thermal performance of current (1976) terrestrial photovoltaic modules
(2) Sensitivity of module temperature to various module physical parameters
(3) Heat transfer characteristics of the terrestrial environment
(4) Thermal testing methods
1-1
5101-31
II. STUDY APPROACH AND ORGANIZATION
The teat and analysis program reported here had the objectives of developing (1) understandings of module thermal performance that would allow the design of cooler-running modules; (2) analytical tools that would permit the prediction of module temperatures in working environments from measurable module and environmental characteristics; and (3) test methods for providing repeatable experimental evaluation of module performance.
The approach was to combine analytical modeling with an experimental program designed to define boundary conditions, especially in regard to environmental factors such as wind and the effects of tilt angle, which were poorly understood analytically. The study utilized six types of photovoltaic modules purchased by JPL as part of the Project's large-scale procurements. Of these, five represented the five manufacturers (M-7, Sensor Technology, Solar Power, Solarex, and Spectrolab) involved in the first block procurement (nominally totaling 46 kW of modules) and one, Spectrolab, was chosen from the second block procurement. The details of the modules are described in Section III of this report.
There were two distinct phases to the testing portion of the study. The first phase was exploratory and dealt with the five off-the-shelf modules from the first block procurement. This effort was directed at understanding the thermal performance characteristics of this set of designs, which represents the state of the art in 1976, and at acquiring data needed to analytically model the thermal characteristics of the natural environment. The data from this phase of testing are presented in Section IV.
In the analysis phase which followed, analytical models were constructed for the various module types and were iterated to insure agreement with the test results. The models were then used to evaluate changes in the module thermal performance from changes in module configuration. An estimate of the convective heat transfer coefficient was also made with these models as described in Section V.
The second test phase, which followed the analytical phase, utilized only one of the first phase modules {Solarex) together with the secondblock Spectrolab module. The purpose of this test phase was to develop_ a natural light test procedure for determining the nominal operating cell temperature. This activity is described in Section VI.
2-1

5101-31
III. TEST HARDWARE AND INSTRUMENTATION
A. MODULE PHYSICAL PROPERTIES
Figures 3-1 and 3-2 display the six flat plate solar cell modules considered in this study. The construction varies; generally, the solar cells are interconnected electrically and contained by an encapsulant between a cover and a substrate. Table 3-1 summarizes the materials and geometry of the six modules. Two of the confi~urations have aluminum substrates with a fin or fins~ The other four configurations utilize thermally low conductance substrates. Figure 3-3 shows representative cross-sectional views of the modules.
Since the active surface of a module consists of composite layers of cell ensembles, encapsulant and interconnectors, the optical radiative properties are represented by effective solar absorptances and emittances. The normal solar absorptancean, is based on spectral reflectance normal to the surface in the wavelength range between .28 to 2.5 µm and then inte~rated using an AM1 (air mass one) solar spectrum. Table 3-2 is a summary of measurements and integration calculations performed by the TRW Systems Group for the five modules of the first block (46kW) procurement. Other material properties utilized in the characterization of the modules are presented in Table 3-3.
B. TEST SETUP
The test setup is shown in Figures 3-4 through 3-9. Each module was mounted on a separate 1.2 m x 1.2 m (4' x 4') black aluminum frame. Each frame mounted at least one real module along with dummy module simulators. The simulators were made of 60-mil thick 6063 aluminum plates coated with Cat-a-lac black paint on all exposed surfaces. They filled the empty space in an array so that the module was situated in a local environment very similar to that of a full array. The simulators also served as a calibratable reference plate to indicate the local environmental condition of the array. Extended surfaces (fins) were implemented on the dummy simulators for the Spectrolab module design, which has similar fin arrangements.
During the first test phase, all five arrays were tilted at 34° (the local latitude) with the front surface facing south. They formed a row in the east-west direction. The sequence from east to west was Spectrolab, M-7, Solarex, Solar Power, and Sensor Technology.·
In the second test phase the setup was similar and employed the same frames. A different stand was used and the tests were made at different tilt angles.
C. SOLAR MEASUREMENTS
During the first test phase, a Mark VI pyranometer (Figure 3-10) was mounted on the same plane as the array along with two secondary instruments, an Eppley pyroheliometer (Figure 3-11) Model 50 #4305 (which is actually
3-1

w I
I\)
U SPECTROLAB
SOLAREX
ft M7 INTERNATIONAL
Figure 3-1. Typical Off-The-Shelf Photovoltaic Modules in 1976
\J1 -' 0 -'
I w -'

w I
w
. pectrolab' Figure 3-2 S Substrate M~d~t:ss and Transparent
Vl ..... 0 ..... I
w .....

Table 3-1. Solar Cell Module Specifications
Module Design Sensor Solar I.D. Spectrolab Technology Solarex Power
Component (46K) (46K) (46K) (46K)
Cell Diameter 2.125 2 3 3.4 Inches (cm) (5.3975) (5.08) (7.62) (8.636)
No. of Cells 20 25 18 22
Cell Area/ 57 53.7 69.75 68.28 Module Area %
Module Dimension 4.88x25.5 6.5x22.5 9.6x19 13x22.5 Inches (cm) (12.4x64.8) (16 . 5x5 7 . 2) (24.4x48.2) (33x57.15)
Cover Tempered Sylgard Sylgard Sylgard Glass
Encapsulant Sylgard Sylgard Sylgard Sylgard
Electrical Dextilos Insulator Paper Encapsulant Encapsulant Encapsulant
Aluminum Aluminum
Substrate Extrusion Extrusion GlO GlO with fin and Board Board
12 fins
M-7 (46K)
3 (7. 62)
12
41.3
12-5/8x16-1/4 (32x41.27)
Plexi-glas
Air Layer
Encapsulant
Plexi-glas
Spectrolab (130K)
2 (5.08)
120
54.6
15x46 (38. lxl21. 5)
Glass
Plastic
Encapsulant
Polyester Film
Lil ...... 0 ...... I w ......

5101-31
DEXTI LOS PAPER 0.005" 0 .13" N/1> CELL 0.062"
L~-----------4-----'---------r SPECTROLAB (46K)
0.032" ,~~~~~-__,......,,_
12 x FIN (LENGTHWISE)
SENSOR TECHNOLOGY
t ~i).i.foi.; ••• i ••• fo; ••• ~~• Ofl 0.01" f
+
SOLAR POWER
SPECTROLAB ( 130K}
SOLAREX
0.025"
+ M-7
Figure 3-3. Cross-Sectional Views of the Modules
3-5
2.68"

5101-31
·rable 3-2. Optical Properties of Module Components ( Nominal Values)
Module Design I.D. A B C D
aN(Encapsulant/Cell) 0.88 0.85 0.85 0.85
E
0.826
aN(Encapsulant/Inter-Cell) 0.662 0.44 0.55 0.66 -0.02
TN(Encapsulant/Inter-Cell) ~ ~ 0.32 0.21 0.679
P(Encapsulant/Inter-Cell) 0.34 0.56 0.45 -0.34 0.321
e (Front) 0.864 0.91 0.88 0.88 0.912
e(Back) 0.162 0.854 0.88 0.88 0.912
e(Cell) / / / / 0.523
a pyranometer), and a calibrated solar cell unit. The two secondary insolation references were provided to check the random measurement error involved. Figure 3-12 shows the spread of the calibration data between the Mark VI and the Eppley pyranometers, indicating an interval of about 10%. Figure 3-13 shows the correlation between the Mark VI and the solar cell unit, indicating a spread of approximately 5%.
Since the spreading is composed of contributions from two involved ins.truments, the random measurement error ( repeatability) for the Mark VI and the solar cell unit was approximately 3.5% each, and the Eppley unit showed about 9.35% random uncertainty. Since all three instruments have their own systematic errors from the absolute reference, the accuracy of any measurement is probably no better ·than 5%.
During the second test phase the solar cell and Eppley units were used. The Eppley was periodically caiibrated against the Mark VI pyranometer, a recognized standard instrument.
D. WIND MEASUREMENTS
A wind transducer (Figure 3-14) was used to monitor the wind speed and direction in terms of azimuth and elevation angles. At the test site the wind elevation angle generally remained within± 20° of the horizontal. The wind direction was predominantly in the front hemisphere of the
3-6

5101-31
Table 3-3. Thermophysical Properties of Solar Module Material
Material
Tempered Glass
Sylgard 184
Aluminum
Paper
Silicon Cell
GlO Glass Epoxy
Plexi-glas
Air
Specific Gravity
2. 72
1.05
2.7
0.49
2.33
1. 7
1.18
-3 1. 09xl0
Specific Heat
Btu lb-OF
0.2
0.34
0.208
0.51
0.2
0.35
0.35
0.24
Nominal k, Thermal Conductivity
arrays (E-S-W region). Figure 3-15 is representative of the wind direction and wind speed around noon, May 26, 1976.
E. TEMPERATURE MEASUREMENTS
Chromel-constantan thermocouples were used to monitor the temperatures of solar cell modules, dummy simulators, and the ambient air. Forty-gauge fine wire thermocouples were installed on solar cell modules to minimize errors introduced by thermocouple conductive heat loss. Twenty-eight gauge thermocouples were installed on dummy simulators. The recording accuracy was considered to be better than 6°c. Solar cell temperatures were monitored with thermocouples installed on the back surfaces of the silicon cells. The installation was done by precision drilling of a small hole through the substrate to the back of the cell. After the thermocouples were imbedded, the holes were filled with thermal grease. To ensure that the
3-7

5 101 - 31
thermocouple was remaining in contact with t he silicon surface, another thermocouple on a second silicon cell was monitored . The temperature difference between these two thermocouple measurements was observed to be less than 0 . 2°c throughout the test period .
The t emperature gr adient across the substrate was measur ed by thermocouples imbedded a t different depths and locations . Ambient t empe rature measurement was made in the array shadow by a thermocouple located inside a vented cup and s hielded against the rmal radiation interference by aluminum foil.
Figure 3- 4 . Front View of Tes t Frame for Spectrolab Module
3- 8

5101- 31
Figure 3- 5 . Rear Vi ew of Test Frame for Spec trol ab Module
Fi gure 3- 6. Test Frame for Sensor Technology Module
3-9

510 1- 31
Figure 3-7. Test Frame for Solarex Module
Figure 3-8 . Test Frame for Solar Power Module
3-10

5101-31
Fi gure 3- 9. Test Frame for M- 7 Module
Figure 3- 10 . Mark VI Pyranomet er
3-11

N
E ~ 3: E -
I-
z I.U
:E I.U
"' :::, V'1 <{ I.U
:E v z ~ a ~ ~ ...J <{ I-
0 I-
> ~
"' <{
:E
5101 - 31
Figure 3-1 1. Eppley Pyranometer
•• 100 ,.:
•
80
60
•• ·;,.' , .. ,:.
40 • ... ••
• •• • • • • 20
JI ,.~
0 ':---:':--------:!-:,---------:'-:,-- --'-::-----'-c----'----"'-----'--------'------''------' 0 10 20 30 40 50 60 70 80 90 100
EPPLY INSTRUMENT MEASUREMENT, mW/cm2
Figure 3- 12 . Correlation Between Measurements of Mark VI and Eppley Pyranometers
3- 12
110

N E ~ 3: E
.... , z w ~ w a:: ::::> VI <( w ~ w u z <(
0 <( a:: !!!; _, <( I-0 I-
> :ll a:: <(
~
100
80
60
40
20
5101-31
.• ... ' •
o~ _____ ......_ _____ ....__ _____ ....__ _____ ....__ _____ ....__ _____ _, 0 100 200 300 400 500
SOLAR CELL UNIT, SHORT CIRCUIT CURRENT MEASUREMENT, ma
Figure 3-13. Correlations Between Measurements of Mark VI Pyranometer and a Solar Cell Unit
3-13
600

5101-31
Fi gure 3-1 4. Wind Transducer
3-14

r w a::
t,-W z::r: 0~ ei::- s u.:E
w :c
w a:: w
w
a:::x:: N <~ ~~
w :c
L 12
00
7
6-
5 -
2 ..._
1 ....
0
1200
5101-31
WIND DIRECTION
1210 1220 1230 1240 1250 1300 TIME (HR)--+
I I I I I
WIND SPEED
-
--
I ~ ~ -
I I I I I 1210 1220 1230 1240 1250 1300
TIME (HR)
Figure 3-15. Typical Wind Conditions at JPL Test Site
3-15

5101-31
SECTION IV
MODULE THERMAL PERFORMANCE TESTS
The objective of the first phase of module testing was to acquire experimental data indicative of the actual operating temperature characteristics of the available module designs when mounted in representative arrays tilted to the south at an angle equal to the local latitude of 34°. An important part of this testing was the measurement of the convective heat transfer characteristics of the modules for both free and forced convection (wind). The data acquired were used to both characterize the thermal performance of the module designs and to provide empirical relationships for inclusion in the analytical models constructed in the second phase.
A. OPERATING TEMPERATURE MEASUREMENTS
Five arrays, including modules and dummy simulator plates, were arranged in a single row in the test field along the east-west direction so that they received approximately equal amounts of total solar flux. Temperatures and insolation were measured every ten minutes; the wind speed and direction (azimuth angle) were monitored continuously on a strip chart recorder. Figure 4-1 shows the test results expressed in terms of the level of cell temperature above the ambient temperature (Tce11-Tair) as a function of insolation level. From these figures it can be seen that the temperature difference CTce11-Tair> is essentially linearly proportional to insolation level. For approximate system analyses the cell temperature of an average module appears to be well approximated by the relationship Tcell = Tair + 0.3L, where temperature is in °c, and Lis the insolation level in mW/cm2. Figure 4-2 shows the same type of correlation (~T versus insolation) for a reference dummy plate situated in the center of the middle array.
Although these correlations contain a significant amount of data scatter, testing in Phase 2 has shown that a significant portion of the variation was due to the low thermal capacitance of the thermocouple used to measure the air temperature. The air temperature was measured by an appropriately shielded and vented thermocouple. However, it had a negligible thermal capacitance and responded instantly, whereas the corresponding cell temperature response was severely damped by the thermal inertia of the module. An average air temperature was desired, and with the addition of more thermal capacitance in the form of additional solder, less scatter and a more accurate fit of the data was obtained.
Analysis and tests indicate that Tce11-Tair decreases with increasing air temperature. The afternoon air temperature is warmer than the morning air temperatures for the same insolation intensity. Therefore, the morning data is consistently higher than the afternoon data and scattering will result when both are combined.
4-1

5101-31
80
.- M-7 MODULE
• SOLAR POWER MODULE • 70 x SOLAREX 40
• SENSOR TECHNOLOGY MODULE
• SPECTROLAB MODULE
60
LL. 30 0
a= 50 ,_<
oc _, _, w u ,_
40
20
30
• •
20 10
• •• • • • • 10
• • • •
0 0 10 20 30 40 50 60 70 80 90
TOTAL IRRADIANCE, mW/cm 2
Figure 4-1. AT vs lnsolation of the Five Module Designs
4-2

90
80
70
60
u. 50 0
S!: <( .. LU I-
:5 40 0.. I-
30
20
10
10
5101-31
20 30 40 50 60 70 80
TOTAL IRRADIANCE mW/crn2
Figure 4-2. dT vs Insolation for Reference Plate on the Solarex Array
4-3
50
40
• •
30
oc
20
10
90

5101-31
Depending upon the relative location of the array in the field and the wind direction, the local thermal environment of an array can be different from those of its neighbors. This is demonstrated by comparing the temperature profiles of individual reference plates (mounted in the middle of an array next to the modules) on different array frames. Since these reference plates were made to have identical thermal characteristics, their thermal response could be expected to be the same in the same thermal environment. The temperature profiles of four identical reference plates mounted at the same height on four separate arrays are shown in. Figure 4-3*. The corresponding profiles of average wind speed and solar flux level are shown in Figure 4-4. The results illustrate that the array temperature is affected by the direction of the wind relative to the array arrangement. For a moderate range of wind speed level (the 10-min average values range from .67 m/s to 1.88 m/s), the effect of wind direction on array temperature was on the order of 2°c to 4°c from the leading edge to the trailing edge (from the easternmost array to the westernmost array or vice versa).
Since the neighboring reference plates on the same array frame experienced approximately the same local environment, the reference plate temperature could be used as an indicator of the local thermal environment on the solar cell module placed next to the reference plate. Under a steady state environmental condition, the temperature difference between the solar cell and the local reference plate can be viewed as a quantitative index representing the thermal effectiveness of the solar module design. However, due to wind variations, a steady state environment never exists. The thermal inertia of a solar cell module is typically larger than that of a reference plate, and there is a time lag between the two measured profiles of cell temperatures and the local adjacent reference plate temperatures under the environmental conditions specified in Figure 4-4. Compared to the reference plate temperature fluctuation, the solar cell temperature responses are significantly damped .. Nevertheless, the thermal design characteristics of each module are indicated by the difference in cell temperature and the local reference plate temperature as illustrated in Figures 4-5 through 4-9.
B. CONVECTIVE HEAT TRANSFER MEASUREMENTS
Convective heat transfer correlations in the terrestrial environment are very complex. The complexity is due to turbulent wind conditions and the resulting interaction between free and· forced convection. An additional complication is the constant change in the local air temperature. Figure 3-15 illustrates typical wind conditions for one hour at the JPL Pasadena test site. Laminar flow conditions are felt to be sporadic and short-lived if existing at all. Therefore, only turbulent flow is considered to be the dominant mode.
*The finned Spectrolab plate was excluded.
4-4

u. 110 0 w a:: :::) I-
~ w Q.
~ 100 w I-
.s::-I
U'I 90
70
9 10 11 12
TIME (HR)
_.. REFERENCE PLATE TEMP ON EASTERNMOST ARRAY
• REFERENCE PLATE TEMP ON IN-BETWEEN ARRAY
• REFERENCE PLATE TEMP ON IN-BETWEEN ARRAY
X REFERENCE PLATE TEMP ON WESTERNMOST ARRAY
13 14
Figure 4-3. Temperature Response of Reference Plates at Different Locations
60
50
u 0 w a:: i2
40 ~ ~ ~ w ...
U'I -0 -I w
30
20
15

~ I
°'
90 t- 00 0 00 0
00
MEASURED ooo o
00° 80 t- TOTAL IRRADIANCE 00 Oo
ON ARRAY PLANE"" 00 OOo
oo
70 t- 0 0
N E
i°uO I- 00 E I 0
w u z ~50 0 0 0 0 ~
~INTEGRATED AVERAGE 2: _, WIND SPEED IN <( n 10-MINUTE DURATION 640 ....
r-,
::co~wu lr u y I .-- --i I I
I I I I
10 t-
9
I I I ~SEE~
FIG. 3-15
I I lil 11 13 14
TIME (HR)
Figure 4-4. Representative Insolation Profile and Average Wind Speed
-f9
-ta
0 0
0 0 ---f 7
0
0
---f 6
:c a.. :E
5 ; w w a.. Vl
0 U1 z -4 i 0 -r, I w -
I I -, 3
...., -u
I 1Jo 15

LL 0
0: ~ w ...
LL 0
' 0..
~ w ...
140
130
120
110
100
90
80
70
60
140
130
120
110
100
90
80
70
· 5101-31
~ ~ 60 s> ~ o,:roAq / \
g A 9 'd }!¢ \,o-,, pd tf ,~
9'dA. t> 50 I o I I ?Q,
I ~ 40 I
p.°'q I ~ I I ~ I
v6 --o-- LOCAL REFERENCE 30 I PLATE TEMP I
SOLAR CELL TEMP I \ I oo
20
9 10 11 12 13 14 15 TIME (HR)
Figure 4-5. Temperature Profile of Spectrolab Module
A ooq o. ~ d b,o 't>°'<Jp.q
~oQ, I 't1 tf , p,q Pe t1 M
od A I
d "p
9-1 I
f>o.q / I ~ ~
~ I I d I , I
~
9 10
--o-- LOCAL REFERENCE PLATE TEMP
11
SOLAR CELL TEMP
12
TIME (HR)
13 14 15
60
50
40
30
20
u 0
a..' ~ w ...
u 0
0: ~ w ...
Figure 4-6. Temperature Profile of Sensor Technology Module
4-7

140
130
120
110 u.
0
o...· ~ 100 w I-
90
80
70
60
140
130
120
u. 110 0
o...' ~ w I- 100
90
80
70
9 10 11
5101-31
--~-- REFERENCE PLATE TEMP
_ ___......__ 50 IA R CE LL TEMP
---6- -- AMBIENT AIR TEMP
12 TIME (HR)
13 14 15
_Figure 4-7. Temperature Profile of Solarex Module
9 10 11
_....,.....,__ SOLAR CELL TEMP
---o--- LOCAL REFERENCE PLATE TEMP
12
TIME (HR)
13 14 15
60
50
u 0
40 o...·
~
30
20
60
50
w ...
u 0
40 ~
30
20
w I-
Figure 4-8. Temperature Profile of Solar Power Module
4-8

5101-31
160 70
150
140 n A ~ ~ 60 p0C! 'C1 Q p. d I \
R A p 't1 a 'tJP 'boo.Q 130 / IP.d d
LL ,o u 0
po'\/~ 0
a..· 50 a..·
~ 120 ~ w I
w t- ....
I 110 ~~
I I SOLAR CELL TEMP 40
100 Poq I p ~ --o-- LOCAL REFERENCE I PLATE TEMP
90 d 30
9 10 11 12 13 14 15
TIME (HR)
Figure 4-9. Temperature Profile of M-7 Module
For an array that is open on the back there is always free convection on both the front and the back sides; and, depending upon the wind direction, forced convection is applied to one side or the other. If the wind direction is parallel to the module face, a forced convection coefficient on both sides appears appropriate. The loss by convection from the array is given by:
Q = hA L1T ( 1)
For back-of-the-envelope calculations L1T can be taken as the difference between the cell temperature and the local air temperature, and the sum of the film coefficients and areas for both the front and back utilized:
(2)
4-9

5101-31
An approximation for the turbulent free convective heat transfer coefficient for the front surface of an array tilted upward at an angle 1/1 is: (from Reference 1)
hf = 1.247 ( £\T cos 1/J) 1/3 , 1/J~ 70° (3)
A similar equation for the back side is:
hb = 1.079 (~T sin 1/J) 1 /3 (4)
In each of these equations AT is the temperature difference between the surface and the local air temperature.
Forced convection of wind over a flat plate array involves a large number of variables such as wind speed, wind direction, time dependent fluctuations, array configurations, interference with ground and other arrays in the field, etc. Since the modules have covers and substrates consisting of glass or materials having a similar roughness, the heat transfer coefficient should be similar to that determined by ASHRAE (Reference 2) which is based on tests performed outside on a .3m x .3m smooth glass sample. This data is shown in Figure 4-10 and can be approximated by the expression:
4
H :::::-: 4 • 26 + 3 • , av
V- m/t 4.470 6.705
(5)
8.94
28.335
22 .668
17.001 "'~ ~
11.334
OL.._ _______ SL---------1.L..0-------1.._5 ______ ~200
WIND SPEED (MPH l
Figure 4-10. Convective Film Coefficient of Smooth Glass, Based on Field Test Data by ASHRAE
4-10
..c.

5101-31
The preceding equation assumes that a constant free convection film coefficient of 4.26 W/m2-°K can be added to the forced convection coefficient of 3.18 V, or that free and forced convection can be superimposed. Based upon the experimental data of Figure 4-10, superimposing the two convective coefficients appears to be a reasonable assumption. To account for the effect of tilt angle, the free convective equations given previously should be utilized in place of the constant 4.26. Therefor.e, based upon a search of the literature and the previous assumption, the equations for convection become:
front side: h = 1.247 ~T cos f/1)1/3 ~ 3.18 V (6)
back side: h = 1.079 (6.T sin 1/J)1/3 + 3.18 V
The forced convection term (3.18 V) for the back side has arbitrarily been assumed to be the same as the front side.
To confirm the appropriateness of Equations (6) a second series of thermal tests was performed on a single 1.2 m x 1.2 m array made up entirely of module simulators. Since the optical/thermal properties of the reference plates (a= 0.96,f = 0.87) are known, their thermal response can be correlated to the environmental boundary conditions. Array temperature distribution was monitored on six of the reference plates, which were mounted on a common array frame with insulating washers. As shown in the previous section, a reference plate behaves very similarly to a module. Therefore, the results of these tests for an array of reference plates are applicable to an array of modules.
The temperature distribution on the array was observed to be a function of the plate location and the wind condition. Typically, the temperature level increases with the distance from the bottom edge. This is probably due to the free convection thermal boundary layer formation and because the back surface of the lower plates views a larger portion of the cooler shaded ground. The temperature difference was usually in the range of 2°c to 3°c from the bottom plate to the top plate. Temperatures of the plates at the same height within the array were typically within 1°c of each other under natural wind conditions.
In a forced wind condition, established with a fan, the plates closest to the fan were lower in temperature than those near the trailing edge. However, the temperature difference seldom exceeded 3°c at low wind speed (around 1 m/s) to 2°c at higher wind speed (around 3 mis). The temperatures of the two neighboring plates in the middle of the array near the top edge tracked each other usually within .5°c.
During the preceding tests, the array was exposed on the backside. Figure 4-11 compares the open array to an array closed on the backside with a 1/4" plywood board and to one with a plexiglas front cover and also closed on the backside. Although the wind conditions were slightly different for for these measurements, the results illustrate the effect of eliminating the backside convection by insulation, the greenhouse effect, and the effect of wind speed on heat transfer for a flat plate. At 80 mW/cm2, the array
4-11

5101-31
23.75 ...
-•- M-7 MODULE 20
-•- SOLAR POWER MODULE ... 10
-x- SOLAR MODULE 1 ...
15 -•- SENSOR TECHNOLOGY MODULE
-&- SPECTROLAB MODULE
10 5
• 5 •
• ~
• u.. I • 0 0 • Xx 0 0 ~ C w X i<- X a:: X
t-I xx X ::::-5 f w • u
t- • - • -5 -10 •
.. -15 .. • •
• ... -20
•
-25
-15
-30
0 10 20 30 40 50 60 70 80 90 97 .5
TOTAL IRRADIANCE, mW/cm 2
Figure 4-11. Module Design Thermal Effectiveness
4-12

5101-31
temperature is increased approximately 36°c and 14°c in the plexiglas configuration (greenhouse effect plus insulated backside) and insulated-only configuration, respectively.
To back out convective heat transfer coefficients from the test results, a lumped parameter computer model was constructed for the reference plate array closed on the backside described in the previous paragraphs. A transient analysis was performed on the array model using time-dependent values of the air temperature, solar intensity, reference plate temperatures, and wind velocity, and total convective heat transfer coefficient for the array was calculated. A forced convection heat transfer coefficient was determined by subtracting out the free convective heat transfer coefficient as calculated using Equations (3) and (4). The results of this analysis are presented in Figure 4-12, which shows the calculated forced convection coefficient for the front side of the plate located in the middle of the array as a function of the integrated wind speed averaged over each five-minute interval. During the test period, significant wind speed fluctuation was observed. This was mainly due to the fan-induced air movement being interfered with by natural wind conditions. The data scatters around a straight line given by h = 3.81 v.
The same type of modeling was done for each of the solar cell arrays. However, the fan was not used, and the average wind speed was about 1.3 m/s (fluctuating between .67 and 1.88 m/s) during the one-hour period around noon. The computed total forced convective coefficient (including both front and back) varied from 5.56 W/m2 - °K to 8.19 W/m2 -°K, but not necessarily in proportion to the 10-minute integrated wind speed. However, the average total forced convective coefficient over the entire hour was fairly consistent for all five modules. The values corresponding for array positions A through E were 6.93, 6.76, 6.57, 7.49, 7.15 W/m2 - °Kat 1.3 mis, or approximately htotal forced= 5.37 V in W/m2 - °Kand Vin m/s or= 1.65 Vin W/m2-°K and Vin mis.
If it is assumed that the front face convective coefficient is given by 3.81 V (based upon the reference plate measurements), then the backside coefficient would be approximately 1.56 V. Modeling with this lesser coefficient for the backside did not give good agreement with the test data for the finned modules. A higher forced heat transfer coefficient was indicated for both finned modules. Therefore the front and back forced convection coefficient was arbitrarily assumed to be the same, or one half of the measured total: 2.685 V. Using this value, the best · estimate for the convection coefficient for flat plate solar cell modules reduces to
where
[front side] h = 1.247 (~T cos I/J)1/3 + 2.685 V
[back side] h = 1.079 (6.T sin I/J)1/3 + 0.825 V
4-13

N .... 't
! la I
.c
5101-31
111/1 ('I t"·.894 I .7E:8 2 .682 J .576
3 r--------.---------"""'T"""-------...-----------r-----..17_031
• •
• .. . ~ . ~ ..
• <~ • 0 .JV OR h • 3 .BIV L ~ t
··~· ~ ..
p··
• 11.JS4
• ••
5.677
o._ __ __. ___ _..__ __ _._ ___ __._ ___ ..__ __ ___.._ __ ___. ___ _._ __ __,o .. 5 6 WIND SPEED (MPH)
:w: o,
N
~ J I
.c
Figure 4-12. Calculated Forced Convection Heat Transfer Coefficient for Fan-Induced Air Movement on Front Face of Reference Plate
h = Convective heat transfer coefficient (W/m2_0 c)
(/J = Array tilt angle from horizontal (degrees)
T = Cell temperature rise above air temperature (0 c)
AV= Wind velocity (mis)
4-14

5101-31
SECTION V
MODULE THERMAL ANALYSES
Following the first phase of thermal testing, analytical models were generated for each of the module designs to allow parameter sensitivity analyses to be performed.
Figure 5-1 illustrates the simplest and most complex lumped-parameter computer models used in this study. The larger model is configured for a thermal analyzer program like CINDA (Reference 3) and is very flexible for both transient and steady state analysis. The smaller five-node model neglects lateral conduction, which in many of the module designs is negligible. This small model is solvable with a steady state thermal analyzer program written for the Hewlett-Packard 9810A Model 10 Calculator.
The models were formulated using the measured module physical properties described in Section III together with the convective heat transfer relationships developed empirically in the previous section. At least three temperatures are used to characterize the environment: The local air temperature (Tair), the sky temperature (Tsky), and the ground temperature (Tground>· To simplify the analysis the sky and ground temperature are generally assumed to be linearly dependent on the air temperature. Based upon recent NASA measurements (Reference 4), the following relationship for Tsky was adopted for this study:
Tsky = 0.914 Tair
Ideally, the ground temperature should be represented by two temperatures: one for that portion in the shade and the other for that portion being heated by the sun. However, for this study the ground temperature is represented by a single temperature assumed to be Tair· This assumption is felt to be valid because the arrays are tilted and the backside of the array views a significant portion of shaded ground, whose temperature is approximately Tair· Also, because the total radiation loss (the sum of the front and back sides) to the sky is nearly double the total radiated to the ground, small errors in estimating Tground are of little importance. Thermal radiation between the array surfaces and the environment is characterized by the view factors. When the array separation distance is sufficiently large, the environment can be effectively represented by the sky and the ground. Figure 5-2 shows the view factors as a function of the tilt angle.
The ground (G) infrared absorptivity/emissivity is large (Ea> .8) and the sky (S) is considered black (Es= 1.0). Both the area of the ground and the area of the sky are much larger than the area of a module (M). Therefore, the equation for net infrared radiation exchange between the module and the environment simplifies to:
5-1

5101-31
SKY
(FRONT)
COVER
SUBSTRATE
(BACK)
SIMPLE (5 NODES) SKY
GROUND/AIR SKY
Figure 5-1 . Thermal Model Network
5-2

1.0
0.9
~ 0.8
"' z 0.7
... g 0.6
~ 0 z 0.5 c(
0
5 0.4 0 l?
I 0.J :..: u c(
.._m 0.2
5101-31
,Ji ( TILT ANGU l DEG
Figure 5-2. Direct View Factor Relationship as a Function of Array Tilt Angle
The view factors, FM•G and FM-S, are those presented in
0
0.1
0.2 >-~
0.3 :,,c u
u..~
0.4 Q_ 0 z
0.5 < 0 z :::>
0.6 ~ l? ....
0.7 z 0
u..'if 0.8
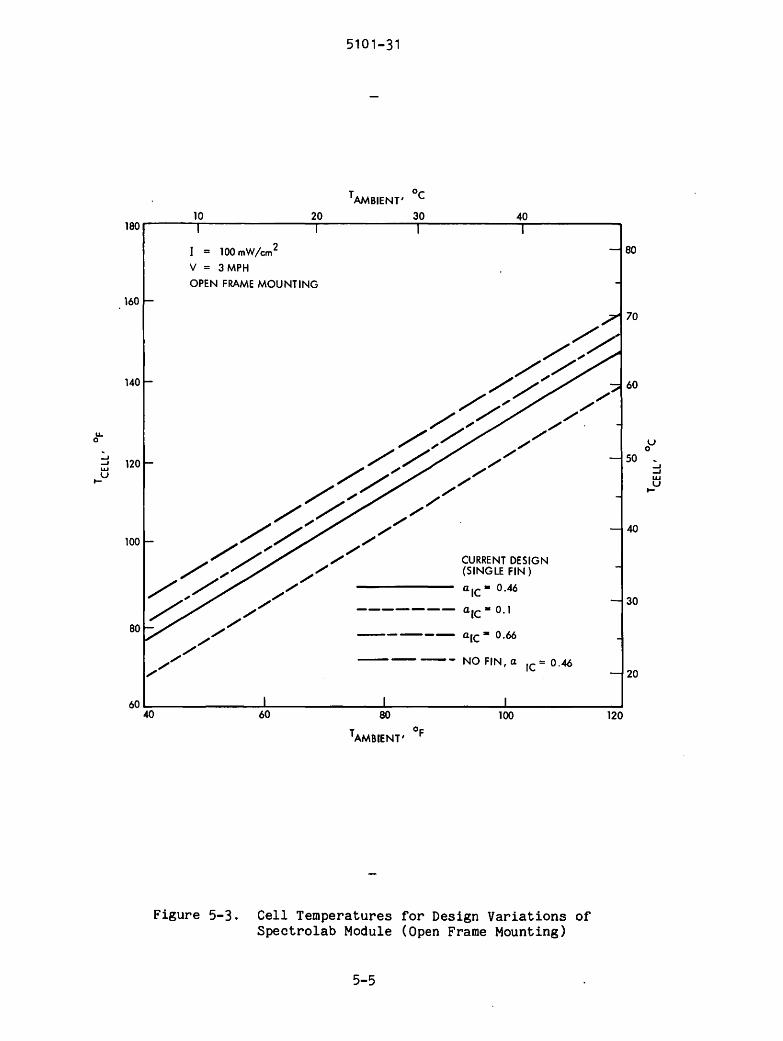
Figure 5-2. After each model was generated and checked out against the actual test data, steady state thermal performance analyses were performed on the various models of solar modules to demonstrate the effectiveness of various thermal design alternatives. The total irradiance was assumed constant at 100 mW/cm2 and the air temperature was varied. The wind condition was assumed constant at 1.34 m/s. Each design was altered to demonstrate for both open frame and roof mounting the thermal effect of the following parameters:
( 1 ) Fin effectiveness
(2) Substrate thermal conductivity
(3) Substrate solar absorptance
(4) Substrate thickness
( 5) Substrate solar transmittance
5-3

5101-31
A. OPEN FRAME MOUNTING
Figure 5-3 displays the effects of various alterations to the Spectrolab aluminum I-beam module with ~lass front surface. For example, the figure indicates that the cell temperature could be further lowered 5.5°e by decreasing the solar absorptance of the intercell area Care) and/or substrate from .46 to 0.1. The fin effectiveness is demonstrated for both of the finned modules in Figures 5-3 and 5-4. Figure 5-4 compares the current 12-finned Sensor Technology design with desi~ns that (1) replace the 12 short fins with a single long fin (such as the Spectrolab design), (2) remove the fins, and (3) replace the aluminum substrate with a 0.32 cm (1/811 ) thick glass plate having a solar absorptance of 0.05. With the less conductive clear glass substrate the intercell area is not as effectively utilized to reject the heat absorbed by the cell. Therefore, the cell temperature is about 5.s0 e warmer than an aluminum substrate (no fin) even though the aluminum substrate has almost 9 times the solar absorptance of the glass (0.44 vs 0.05).
Figures 5-5 and 5-6 demonstrate the effect on cell temperature of solar absorptance and thickness of non-conductive substrates (plastic). Decreasing the substrate solar absorptance by a factor of 10 had a negligible effect on the cell temperature. Increasing the thickness of a nonconductive substrate insulates the cell even more from the cooling air on the backside, and thus increases the cell temperature.
Figure 5-7 shows that by replacing the 0.254 c/m (0.1") Plexi~las substrate with a 0.254 cm (0.1") aluminum substrate having 0.44 solar absorptance the cell temperature is decreased about Boe. If the ~ir gap is also eliminated the cell temperature can be reduced an additional 11°e.
B. ROOF MOUNTING
For· residential applications, solar cell modules are expected to be mounted on roofs or a similar type of back surface supporting structure. The module back surface will not be directly exposed to ground or ambient air. The local thermal environment of the back surface is then governed by its interface with the roof. In the present analysis it is assumed that the solar arrays are supported on a frame 3" above the roof. The roof is insulated on the underside to minimize heat leakage into the house. To simplify the analysis, the following assumptions were made about the general configuration shown in Figure 5-8.
1) The underside of the roof is adiabatic.
2) All solar energy transmitted through a transparent module is completely absorbed by the roof.
3) Ambient air may move under the spacing between the module and the roof from the lower edge as well as from the separations between arrays.
4) The front side heat transfer coefficient assumes a constant 1.34 m/s wind.
5-4
180
160
140
u. 0
~ ...J 120 u.J u
t-
100
80
60 40
10
I = 100 mW/cm2
V = 3 MPH
20
OPEN FRAME MOUNTING
60
5101-31
T 0 c AMBIENT'
30 40
//
// /
/
/ /
/ /
/
CURRENT DESIGN (SINGLE FIN)
alC • 0.46
------- ale• 0.1
----- a 1c • o.66
------- NO FIN, a IC= 0.46
80 100
1AMB1ENT' OF
Figure 5-3. Cell Temperatures for Design Variations of Spectrolab Module (Open Frame Mounting)
5-5
80
70
60 /
u 0
50 ~ ...J w u
t-
40
30
20
120

u.. 0
::.. ..J w u
t-
5101-31
1AMB1ENT' oC 10 20 30 40
180
80 I = 100 mW/cm~ V = 3 MPH
OPEN FRAME MOUNTING / 160 /
// /" 70
/ /' // / /~ /
140 / //
60 / _,,,,/ / / / / / / //
/ / // u 0
120 / // //
/ / // 50 :j
/ . / ,/'" ~ /
/ .,,,,/ / / //
100 / //
~/ // //
// CURRENT DESIGN
// ( 12 SHORT FINS)
80 / ------- WITH SINGLE LONG FIN
------- NO FIN
----- 1/8" GlASS SUBSTRATE
60 L.40~~~~~~~6.L0~~~~~~~8.L.0~~~~~~~100.L:--~~~~~"':"::12~0
T AMBIENT' oF
40
30
20
Figure 5-4. Cell Temperatures for Design Variations of Sensor Technology Module (Open Frame Mounting)
5-6
w u
t-

~ 0
:., ...J w u
t-
5101-31
TAMBIENT' °C 10 20 30 40
180
I = lOOmW/cm 2 /'
V = 3 MPH //' ,e, OPEN FRAME MOUNTING
/ ~" 160 / ~~
/ ~,p / ~~
/ ~~
140 /'/ ,:,~ _,,,,. ~P
/ ~~ / ~~
//'# 120 / ~~
/ ?':.~ ,.~ "?"'' .,.,
100
CURRENT DESIGN (a:::: 0.55, 3/32 SUBSTRATE)
TRANSPARENT EPOXY 80 (SAME CONDUCTANCE) a:::: 0 .05
GlASS SUBSTRATE a = 0.05
9/32 11 G-10 BOARD (OPAQUE)
60L--------~---~---..____ _______________ .........1i........ _______________ ---1, __________________ ____.
40 60 80
TAMBIENT' °F
100
Figure 5-5. Cell Temperatures for Design Variations of Solarex Module (Open Frame Mounting)
5-7
120
80
70
60
u 0
50 :., ...J w u
t-
40
30
20

LL 0
:i -I w u
t-
5101-31
TAMBIENT' OC
10 20 30 40 200
I == 100 mW/cm 2
V = 3 MPH /__ OPEN FRAME MOUNTING
180 _,
.,,,.
/ 160 /
/ ,, / / /
/ 140 / /
/ / _, /
/ 120 /
CURRENT DESIGN 1/8 11 G-10
100 SAME THICKNESS --- --- TRANSPARENT a= 0.05
--- GLASS SUBSTRATE
---- 3/8 11 G-10 80
60 ....... ~~~~~~~i......~~~~~~...J-~~~~~~~....__~~~~~~---' 40 60 80
1AMBIENT' oF
100
Figure 5-6. Cell Temperatures for Design Variations of Solar Power Module (Open Frame Mounting)
5-8
120
90
80
70
60 u 0
:i -I U.I u
t-
50
40
30
20

200
180
160
140
~ 0
:., ..J u., u ....
120
/ /
100
80
60 40
5101-31
TAMBIENT' oC
10 20 30 40
I = 100 mW /cm2
V= 3 MPH
OPEN FRAME MOUNTING
/ /
/ /
/ /
/ /
/ /
/ / /
/ / / 'i /
/ // / /
/ /
//~ / /
/ /
/ /// CURRENT DESIGN
// /' 0.1" PLEXIGIAS SUB.·
0.1 11 ALUMINUM SUBSTRATE // ---- a= 0.44
----- 0.1 11 ALUMINUM SUBSTRATE NO AIR GAP
---- 0.1" ALUMINUM SUBSTRATE WITH LONG FIN
60 80 100
TAMBIENT' OF
Figure 5-7. Cell Temperatures for Design Variations of M-7 Module (Open Frame Mounting)
5-9
90
80
70
60 u
0
~ ..J LU u
I-
50
40
30
20
120

5101-31
Figure 5-8. Configuration of Roof Top
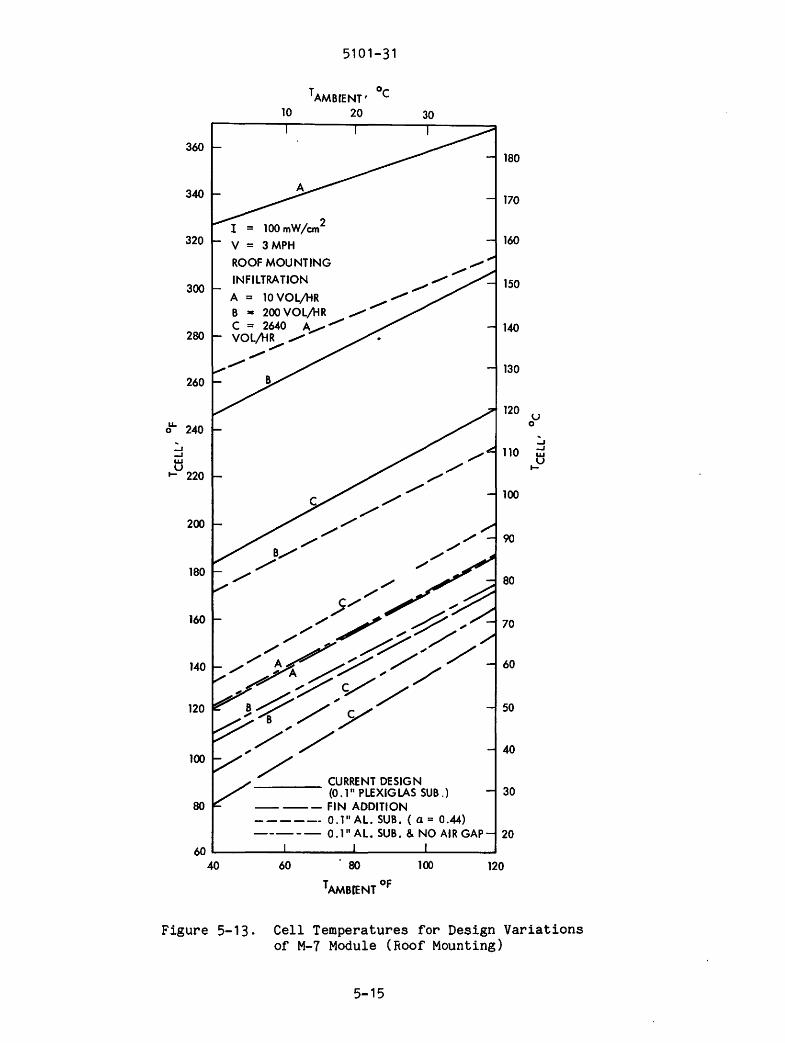
The air infiltration to each module back spacing is due to the chimney effect (natural drafting) of hot air. Although the amount of air movement is approximately the same under all modules, the air temperature increases continuously as it moves upwards. Under the module located at the lower roof edge, the air space is continuously replenished by cool ambient air, while at the top edge most of the entering air. has been heated. In order to characterize the local air condition,.an infiltration factor is defined as. the equivalent amount of ambient temperature air passing through the volume confined by the module area and the 7.62 cm (3 11 ) spacing. The· infiltration factor can range from v~ry low at the top edge to a reasonably high value at the bottom roof edge. Three levels of infiltration factors were considered in the present analysis: 10 volumes/hr, 200 volumes/hr and 2640· volumes/hr (2640 vol/hr corresponds to about .224 m/s speed for a .093 m2 (1 ft 2) module). The corresponding module thermal performances are shown in Figures 5-9 through 5-13. The types of design alternatives were the same as those described previously in the open frame analysis.
Figure 5-9 illustrates that adding a fin creates negligible effect for a low infiltration factor, but becomes more appreciable at high infiltration levels. The effect of substrate solar absorptance is more significant in roof mounting than in open frame mounting. For nonconductive substrates the substrate solar absorptance is not important, but the substrate transmittance is. A transparent substrate becomes a disadvantage in a roof mounting, because the intercell space creates a greenhouse effect. This is demonstrated in Figure 5-10, which shows the ce.11 temperatures for a glass substrate (a = 0 .44) at high and· low infiltration levels. ·A thick, opaque, non-conductive substrate (G10
5-10

u.. 0
_. _. ,_t'.:l
200
180
160
140
120
100
10
I• 100 mW/cm2
V,. 3MPH
ROOF MOUNTING
INFILTRATION
A = IOVOL/HR
B = 200 VOL/HR
C = 2640 VOL/HR
5101-31
T AMBIENT' oC 20 30 40
--NOFIN
RIC .. 0.66, -- - - WITH FIN
----- "1c"' o.1, WITH FIN
90
80
70
u 0
..., ,_t'.:l
60
50
40
30
20
60 _______ __._ ______ .__ _____ _..._ _____ ___.
40 60 80
TAMBIENT' of
100 120
Figure 5-9. Cell Temperatures for Design Variations of Spectrolab Module (Roof Mounting)
epoxy) is more desirable than a thinner transparent glass substrate, which has about three times more thermal conductivity than G10, particularly at a low infiltration level. This is illustrated in Figures 5-11 and 5-12. Figure 5-13 shows the extremely high cell temperatures that result from a double greenhouse effect. The advantages of using an opaque aluminum substrate and the effect of eliminating the air gap are again clearly demonstrated in Figure 5-13.
An actual infiltration factor is unknown and will depend upon the roof configuration. However, based upon an infiltration factor
5-11

5101-31
10 20 TAM81ENT' oC JO ,40 r----,:------___;=F-----~------;;:....---~ 110
220
200
180
160 0 ...
_, _, .... V ....
J.40
120
100
80
60 40
I• 100 mW/cm2
V • 3 MPH
ROOF MOUNllNG
INFILlRATION
A = IOVOL,/l-iR
8 = 200 VOL;'l-iR
C "' 2640 VOL,/l-iR
8 .,,,..
/ .,;
/ .,,,
60
100
90
/ .,,,.
/
70 V
0
_, _,
...u 60
50
CURRENl DESIGN ( 12 SHORT FINS l
_______ WllH SINGLE LONG FIN
---NOFIN
- - - 1/8" GLASS SUBSTRATE 30
20
80 100 120 1AMBIENT' of
Figure 5-10. Cell Temperatures for Design Variations of Sensor Technology Module (Roof Mounting)
of 200 vol/hr, reduction in power (compared to the open frame mounting for field installations) ranged from 7% to 34% for the bottommost arrays. The arrays near the top of the roof will be warmer and will be degraded an additional 6% (a total of 13% to 40% for the top arrays).
Natural drafting behind the modules is expected to create infiltrations on the order of 200 vol/hr. By comparison, an open home chimney is estimated to have a natural draft equivalent to 350 vol/hr. An infiltration of 2640 vol/hr is probably only possible with ideal wind conditions or with fan-induced flow.
5-12

u.. 0
~ ...J w u
I-
5101-31
T AMBIENT' °C 10 20 30 40
130
260
I = 100 mW/cm 2
V = 3 MPH
ROOF MOUNTING 120
INFILTRATION
240 A = 10 VOL/HR
B 200 VOL/HR
C 2640 VOL/HR 110
220
100
u 0
~ ...J
200 w u
I-
90
180
80
160 70
CURRENT DESIGN ( a = 0 .55, 3/32 SUBSTRATE)
140 TRANSPARENT EPOXY
60 -------- SAME CONDUCTANCE a = 0.05
GLASS SUBSTRATE ----- SAME THICKNESS a= O 05
---- 9/32" OPAQUE G-10 BOARD
120 50
40 ,oo..._ _______ ........ _____________________________________ ~ __ __. 40 60 80
T AMBIENT' oF 100
Figure 5-11. Cell Temperatures for Design Variations of Solarex Module (Roof Mounting)
5-13
120

u.. 0
....J
260
240
220
Li:! 200 u ....
180
160
140
120
I = 100 mW/cm2
V = 3 MPH
ROOF MOUNT
INFILTRATION A = 10 VOL/HR B = 200 VOL/HR C = 2640 VOL/HR
5101-31
T AMBIENT' °C
GLASS SUBSTRATE - - - (SAME THICKNESS)
a:::: 0.05
CLEAR EPOXY (a=- 0 .. 05) ------ - SAME THICKNESS
SAME CONDUCTANCE AS CURRENT
- - - - 3/8 11 OPAQUE G-10
100....._~~~~~----,..._~~~~~--~~~~~~_,_~~~~~-40 60 80 100
T AMBIENT' of
Figure 5-12. Cell Temperatures for Design Variations of Solar Power Module (Roof Mounting)
5-14
130
120
110
100
u 0
...J
90 i u ....
80
70
60
50
40
120
360
340
320
300
280
260
Ou.. 240
-' -' w
.... u 220
200
180
160
140
120
100
80
5101-31
TAMBIENT' °C
10 20 30
100mW/cm2
V = 3 MPH
ROOF MOUNTING /
INFILTRATION / / /
A = lOVOL/HR // B • 200 VOL/HR / C = 2640 A / VOL/HR /V
/ /
/
B/ /
/
/
/ /
/
/
/ /
/ /
/ /
,;/ // ./' ~,
/ """"" / ~ / ,,.,. ~ ~ , / ,,-"'y~y,,// ~ _o'Y .. c/ / JZ:/ y ,/ / _/ ____ CURRENT DESIGN
(0.1 11 PLEXIGLAS SUB.) --- FIN ADDITION ------ 0.1 11 AL. SUB. (a= 0.44) ----- 0.1 11 AL. SUB. & NO AIR GAP
180
170
160
150
140
130
120 u 0
-' 110 -' w u ....
100
90
80
70
60
50
40
30
20 60 _______ ........ ______ ........ ______ ........_ ______ __
40 60 80
TAMB(ENT Of
100 120
Figure 5-13. Cell Temperatures for Design Variations of M-7 Module (Roof Mounting)
5-15

5101-31
SECTION VI
DEVELOPMENT OF A STANDARD THERMAL TEST PROCEDURE
Among the many things illustrated in the first test phase was that in the field, modules of different designs do operate at significantly different cell temperatures (see Figure 4-10). Since module power decreases with increasing cell temperature at a rate of approximately 0.5%/0 c, it is desirable to purchase solar modules by rating power at a cell temperature indicative of expe~tod operating temperatures in the field. This approach has the advantage of providing greatly improved correlation between measured performance at rated conditions and expected performance in the field, provides for more accurate comparison of alternate module designs with different thermal properties and I-V/temperature characteristics, should cause module-cell performance optimization to be more closely aligned with actual field operating conditions, and is a necessary step toward eventual standardization of module electrical performance parameters and inter-manufacturer interchangeability.
The proposed approach to performance specification is based on first defining a Nominal Terrestrial Environment (NTE), which is representative of the average environmental conditions in the United States during times when solar arrays are producing power. The cell temperature for a module under NTE conditions is referred to as the Nominal Operating Cell Temperature (NOCT) and is determined experimentally. The improved electrical performance specifications can then simply make reference to the NOCT temperature instead of a fixed temperature such as 28°c. To determine an appropriate definition for the Nominal Terrestrial Environment, a study was conducted using computer analysis of weather tapes that describe the measured hour-by-hour variation in ambient temperature and insolation in nine representative geographic locations in the continental U.S. For each three-hour interval, the following parameters were calculated:
1) Insolation incident on a solar panel tilted to the local latitude and facing south.
2) Solar cell temperature based on (1), the local air temperature, and (2) the thermal properties of a typical solar cell module.
3) Maximum power output of a solar cell module with typical 1-V and temperature/intensity dependence characteristics.
Based on 10 years of weather at each site, the above parameters were organized to provide the average annual energy produced by a module at each combination of cell temperature and insolation level (on the tilted module). Figures 6-1 and 6-2 summarize these results and indicate that 50 percent of the energy from the assumed module is produced at insolation levels above and below about 80 mW/cm2, and at cell temperatures above and below about 44°c. Using these values together with the assumed module thermal properties allows the properties of a sort of median environment to be calculated as:
6-1

~
/\ z Q .... :s 0 VI z u. 0 I-::, 0.. I-::, 0 >-C) a:: w z w ..., <( ::, z z <( u. 0 .... z w u a:: w 0..
5101-31
100
90
80
70
60
50
40
30 KEY:
ABQ ALBUQUERQUE, N .M.
BIS BISMARCK, N.D.
20 BOX BOSTON , MASS.
BRO BROWNSVILLE, TEX
COL COLUMBIA, MO.
FRE FRESNO, CA.
MIA 1 MIAMI, FL. ('55-'64)
MJA2 MIAMI, FL. ('65-'74) 10
PHX PHOENIX, AZ.
SEA SEATTLE, WA . BRO
0-----------------"'----..L...---......L---.;;:mm.... ___ __, 0 20 40 60 80 100 120
SOLAR INSOLATION (I),MW/CM2
Figure 6-1. Module Annual Energy Output vs Isolation Level on Tilted Array
6-2
140

t-
I\ a.. ~ w I-_, _, w u I-< I-::, a.. I-::, 0 >-(.')
°' w z w
>-~ °' <( LL. 0 I-z w u °' w a..
90
80
70
60
50
40
30
20
10
KEY:
ABQ ALBUQUERQUE, N .M.
BIS BISMARCK, N. D.
BOS BOSTON, MASS.
BRO BROWNSVILLE, TEX.
COL COLUMBIA, MO.
FRE FRESNO, CA.
MIA 1 MIAMI, FL. (155- 164)
MIA2 MIAMI, FL. (165- 174)
PHX PHOENIX, AZ.
SEA SEATTLE, WA.
NOMINAL AIR TEMPERATURE T CELL-<' .3 (80) 44 - 24
20°c
5101-31
NOCT FOR
TCELL-TAIR = 0.35
oL __ ___.1_ ___ _1.._ ___ t_ __ _L __ .1_..l_ __ ..:::::!1~"'3~~ 0 10 20 30 40 50 60
CELL TEMPERATURE (T ), 0 c
Figure 6-2. Module Annual Energy Output vs Cell Temperature
6-3
70

5101-31
Insolation = Bo mW/cm2
Air Temperature= 20°c
Using this definition, 50% of the array energy output is produced at environmental conditions on either side of (less or more severe than) the median environment. This environment represents a logical point of specifying module electrical performance and hence has been adopted as the definition of the Nominal Terrestrial Environment (NTE).
The Nominal Operating Cell Temperature (NOCT) used for performance specification is the measured cell temperature under the NTE conditions, and will generally be different for each module type. For the typical module used in the calculation procedure the NOCT is 44°c.
The main thrust of the second test phase was to develop a test procedure for determining the NOCT. The effort concentrated on the results of the first test phase, which suggested that the temperature difference (Tcell - Tair> is largely independent of air temperature and is essentially linearly proportional to the insolation level. It was felt that this relationship, if verified, could be used to accurately interpolate the NOCT temperature from cell temperature data obtained under the wide variety of ambient conditions present at various geographic locations and times of year.
In an attempt to further understand the relationship between cell temperature and the environment a number of small tests and analyses were conducted. One potential problem in using measured cell temperature data was the data scatter observed in the first test phase. This scatter was determined to be caused by three contributing effects: wind gusts, rapid ambient air temperature changes, and the absolute magnitude of the average air temperature. As previously mentioned, the scatter in the data was reduced significantly by separating the morning data and afternoon data, and by adding solder to the thermocouple measuring the air temperature. This improvement is illustrated by Figure 6-3. Figure 6-3 should be compared to the Solarex data presented in Figure 4-1. Figure 6-4 presents data for the transparent Spectrolab module.
Another analysis was directed at determining the proper way to average, or draw a line through, the measured data. The results of a simple analysis - using a computer model approximating the Solarex configuration - are shown in Figure 6-5. This analysis illustrates that fitting the data with a straight line which passes through the origin is especially applicable for intensities greater than 40 mW/cm2.
Using the same computer model, the sensitivity of cell temperature to tilt angles between 10° and 60° was investigated. In modules whose front and back surfaces are approximately at the same temperature, the total (sum of the front and back surfaces) heat transfer by radiation does not vary with tilt angle. For the same tilt angle range and an average wind velocity of 1 mis, the total convective heat transfer coefficient varied by± 4% about the peak value, which occurred at a 45° tilt angle. However, the analysis indicates this is less than a± 1.5°c effect for the same heat input.
6-4

u.. 0
...J
60
50
~ 30 u I-
20
10
01-14-77 SOLAREX 46K tis= 55-DEG BLUE SKY, CLEAR 2-1/2 ~ Vmph, V < 7 mph 52F ~ TAIR ~ 67F (MORNING DATA)
5101-31
01-14-77 SOLAREX 46K 1./J = 55 DEG BLUE s KY I CLEAR 2-1/2 mph~ V, V< 7 mph 61 F < TA IR < 68F (AFTERNOON DATA)
0 _______ ....__ _ ___,j....__ _ ___,j....___,__. __ ----'-----L---..l...--......L.--.....L--.....l..___J
0
60
50
u.. 0
2: 40
.... <
...J -' 30 w u
t-
20
10
0 0
10 20 30 40 50 60 70 80 90
INTENSITY, mW/cm2
Figure 6-3. Morning and Afternoon AT vs Insolation for the Solarex Module
01-14-77 SPECTROLAB 130K 1/, = 55 DEG BLUE SKY, CLEAR 2-l/2mph ~ V, V< 7 mph 52F~ TAIR ~ 67F (MORNING DATA) 01-14-77
SPECTROLAB 130K t/1 = 55 DEG
100
BLUE SKY, CLEAR 2-1/2 mph ~ V, V ~ 7 mph 61F::,; TAIR~ 68F (AFTERNOON DATA)
10 20 30 40 50 60 70 80 90
INTENSITY, mW/cm2
Figure 6-4. Morning and Afternoon AT vs Insolation for the Spectrolab Module
6-5
100
35
30
25 u
0
20 0::
._< ...J ...J
15 w u t-
10
5
30
25
20
15
10
5

5101-31
60r-----.-----,...----r-----.----...----r----r---T"'""'"---.---~
50
~ 40 ;:;.:
._< ,, .., 5 30 ,_
20
10
TILT ANGLE 3rfJ
WIND VELOCITY 1 M/S
TAIR"' TGROUND"' 27°C
TsKY = ioc
ANALYTICALLY DERIVED
/ /
30
25
. 20 :;I ~
,_< I ..,
15 S ,_
10
; 5
oi-==---'---_.j'-----'------'----i'-----'---~---"-------~o o ro ~ ~ ~ ~ M ro ~ ~ ~
INTENSITY, mW/cm2
Figure 6-5. Variation of (T0e11-Ta1r) vs Isolation Level for a Typical Solar Cell Module
6-6

5101-31
The initial impression might be that this last result is questionable. However, an average module operating at the NOCT rejects almost twice as much heat by radiation as it does by convection. The two heat rejection paths are parallel. If the heat in is maintained the same, in changing the tilt angle, the heat rejected is the same and divided between the two parallel paths. Since radiation is a fourth power temperature function and because radiation is the predominant mode of heat rejection, a lesser. change in module temperature is necessary to maintain a constant heat output. The conclusion of this analysis is that neither radiation nor convection are strong functions of tilt angle.
From these analyses and tests it was determined that NOCT could be accurately interpolated from measurements made under widely varying test conditions. For standardization purposes the following test envelope is proposed:
Mounting:
Solar Insolation:
Wind Velocity:
~ind Gust:
Air Temperature:
Tilted, Open Back, Open Circuit
80 ± 40 mW/cm2
1 m/s .± .75 m/s
less than 4 m/s
The center of the test envelope is NTE.
The procedure for determining NOCT calls for plotting (Tce11-Tair> against the insolation level as shown in Figure 6-3 for a one- or two-day period when wind conditions are favorable. The NOCT value is then determined by adding Tair = 20°c to the value of CTce11-Tair> interpolated for the NTE insolation level of 80 mW/cm2. Fine adjustments are then made to account for off-wind conditions and extreme air temperatures using the correction factors presented in Figure 6-6. These particular correction factors are calculated for modules without cooling fins, with back side open to the air, and with good solar and infrared optical properties, as is typical of the current LSSA modules. If these correction factors were not applied, a± 3°c uncertainty in NOCT would exist as illustrated in Figure 6-7.
Table 6-1 summarizes the tests used to substantiate the validity of the test procedure. It is estimated that NOCT can be determined to within· ± 1.5°c. With improvements in measuring the effects of wind that are currently being pursued, a± 1°c accuracy is expected.
The test procedure to be followed in determining the NOCT of a module is presented in Appendix A. This was the procedure used for all the tests summarized in Table 6-1.
6-7

5101-31
1.75 ----------------.-----r-,-----~--.,---r-----, 4 .03
1.6
3.5
1.4
3.0
~ 1.2 o0 c E I
t> I
~ 2.5 0 0
..i::. ...J a. w 1.0 E > . t, I
I> :5 w > < 2.0 0 z -1°C i o.e
1.5
0.6
-2°C
1.0 0.4
-Joe
0.2 ~----.....L.-~-----'-----L-L~----'--..1....---.....r...----..... 0.57 5 10 15 20 25 30 35
50 60 70 80 90 OF
AVERAGE AIR TEMPERATURE .... TAIR
Figure 6-6. Correction Factor for (T 11
-T i) ce a r
6-8

u. 0
..I
..I w u
I-
5101-31
50
S = 80 mW/cm2
40
30~~~~~~:--~~~~-!-:-~~~~----:::~~~~~---+~~~~~....l..,_~~~~___J ~ ~ ~ ro 80 90 100
TAIR ...... oF
Figure 6-7. Calculated Variation in (T - T ) cell air and Correction Factors
6-9
30
u 0
25 ---~ ..... <
20
..I
..I w
..... u

°' I ..... 0
Test Number
1
2
3
4
5
6
7
8
9
10
Date
11-01-' 76
11-18-' 76
11-18-' 76
01-11-' 77
01-13-'77
01-13-' 77
01-14-' 77
01-14-' 77
01-17-'77
01-17-'77
Table 6-1. Thermal Performance Test Summary - Second Phase
Solarex 46 k -T . - T -Tilt Morning air V cell Corr.
Angle Afternoon (OF) (mph) Tair Factor NOCT (0) (M or A) (OC) (OC) (°C)
45 M 90 2 to 3 25.5 +2 47.5
55 M 77 1 to 2 27.8 0 47.8
55 A 80 1 to 2 26.1 0 46.1
55 M 63 2 to 3 28.8 0 48.8
55 M 56 3 to 4 28.8 0 48.8
55 A 64 3 to 4 26.4 +l 47.4
55 M 60 1~ to 2~ 28.5 -1 47.5
55 A 65 1~ to 2~ 26.5 0 46.5
55 M 70 1 to 2 27.9 0 47.9
55 A 80 1 to 2 26.5 0 46.5
Average NOCT 47.5
Spectrolab 130
T cell- Corr. T . Factor air (OC) (°C)
N/A N/A
21.9 0
20.2 0
22.0 0
22.1 0
20.3 +1
21.3 -1
20.5 0
21.2 0
20.3 0
k
NOCT (OC)
N/A
41.9
40.2
42.0
42.1
41.3
40.3
40.5
41.2
40.3
41.1
VI ..... 0 ..... I
w .....

5101-31
SECTION VII
CONCLUSIONS
The following is a summary of the significant thermal results:
1. Thin transparent material with a relatively high thermal conductivity should be selected for the front cover/encapsulant to minimize transmission losses and maximize heat conduction to the front surface.
2. An air gap within the module should be avoided.
3. Fins offer a slight advantage (less than s0 c temperature reduction) and should be limited to metal substrates. For roof mounting applications, the effectiveness of the fin depends strongly on the infiltration level.
4. Substrates with a high thermal conductivity are desired to conduct heat laterally into the spaces between the cells. If a low conductive material is used, the material thickness should be minimized.
5. The solar reflectance of the substrate should be as high as possible to minimize the heat absorbed in the spaces between cells.
6. Transparent substrates offer a negligible advantage in open frame mounting and can be a definite handicap for roof applications because of the greenhouse effect.
7. The heat loss by infrared radiation from a module is significant and should be maximized by using materials/coatings having a high emittance.
8. For system-type analyses the cell temperature of a typical module is well approximated by: Teel!= Tair + 0.3L where Lis the total irradiance incident on the active plane of the array in mW/cm2, and Tis in °c.
9. The total (both back and front sides) forced convective coefficient was determined to be: h = 5.37 V for a 1.2 m x 1.2 m array and with the wind predominantly on the active plane of the array. Similarly, for the front face a forced convective coefficient was determined to be 3.81 V. This implies a back side forced convective coefficient of 1.56 V. However, modeling with this assumption did not give agreement with the test data for fin type modules and a higher backside coefficient was indicated. Based upon analysis, tests, and a survey of the literature, the following equations are recommended for the convective heat transfer coefficient:
7-1
5101-31
hFront side= 0.385 (.6T cos~) 1/3 + 0.825V
haack side = 0.332 (AT sin~) 1/3 + 0.825V
and the heat loss by convection is given by:
Qconv = (h AAT)front side + (h A AT)back side
10. The heat loss from a module by infrared radiation is better understood and calculated by:
This equation is used for both the front and back surfaces. If the front surface emittance is the same as the backside emittance, and both surfaces are approximately at the same temperature, the equation simplifies to:
AM is the sum of front and back surface areas.
11. A natural sunlight procedure for determining the nominal operating cell temperature (NOCT) is presented in Appendix A. The NOCT is defined as the difference in temperature of the cell under thermal conditions defined by terrestrial environment (NTE). NTE is characterized by:
Solar Insolation: 80mW/cm2
Wind Average V·elocity: 1 m/s
Air Temperature: 20°c
Using the procedure in Appendix A, test data indicate the NOCT can be determined accurately to± 1.5°c. Improvements in determining the average wind velocity are expected to improve this accuracy to± 1°c.
12. A significant degradation of performance in roof mounting vs open frame mounting is indicated. In light of the certainty of residential demonstrations, this is an area urgently needing more analysis and/or testing.
7-2

1.
2.
3.
4.
5101-31
REFERENCES
Irvine, Jr., T. F. and Hartnett, P. P., Advances in Heat Transfer, Vol. II, Academic Press, New York, 1975.
ASHRAE Handbook of Fundamentals, American Society of Heating, Refrigerating and Air-Conditioning Engineers, Inc., New York, N. Y.
Chrysler Improved Numerical Differencing Analyzer, TM-AP-6615, Chrysler Corporation Space Division, New Orleans, La., April, 1966.
Ware, J. C., Clear Sky Temperature, presented at !SES meeting, Fort Collins, Co., Aug., 1974.
8-1

5101-31
APPENDIX A
DETERMINATION OF NOMINAL OPERATING CELL TEMPERATURE
This appendix provides the approved procedure for determination of solar cell module Nominal Operating Cell Temperature (NOCT) using natural sunlight testing.
A. PURPOSE
The purpose of this test is to acquire sufficient data to allow an accurate determination of the nominal operating temperatures of the solar cells of a terrestrial solar array _module.
By definition, the Nominal Operating Cell Temperature (NOCT) is the module cell temperature under operating conditions in the Nominal Terrestrial Environment (NTE) which is defined as:
Insolation = 80 mW/cm2
Air Temperature= 20°c
Wind Average Velocity= 1 m/s
Mounting= Tilted, Open Back, Open Circuit
The NOCT test procedure is based on gathering actual measured cell temperature data via thermocouples attached directly to the cells of interest, for a range of environmental conditions similar to the NTE. The data are then presented in a way that allows accurate and repeatable interpolation of the NOCT temperature.
B. DETERMINATION OF NOCT
The temperature of the solar cell (Teen> is prim~rily a function o·f the air temperature CTair), the average wind velocity (V), and the total solar insolation (L) impinging on the active side of the solar array module. The approach for determining NOCT is based on the fact that the temperature difference (T0 e11-Tair> is largely independent of air temperature and is essentially linearly proportional to the insolation level. Analyses indicate that the linear assumption is quite good for insolation levels greater than about 40 mW/cm2. The procedure calls for plotting (Tce11-Tair> against the insolation level for a period when wind conditions are favorable. The NOCT value is then determined by adding Tair = 20°c to the value of ~Tce11-Ta1r) interpolated for the NTE insolation level of 80 mW/cm, i.e., NOCT = (Tce11-Ta1r>INTE + 20°c.
The plot of (Tce11-Ta1r) vs L shall be determined by conducting a minimum of two field tests in which the module being characterized is tested under terrestrial environmental conditions approximating the NTE in accordance with the testing guidelines which follow. Each test shall consist of
A-1
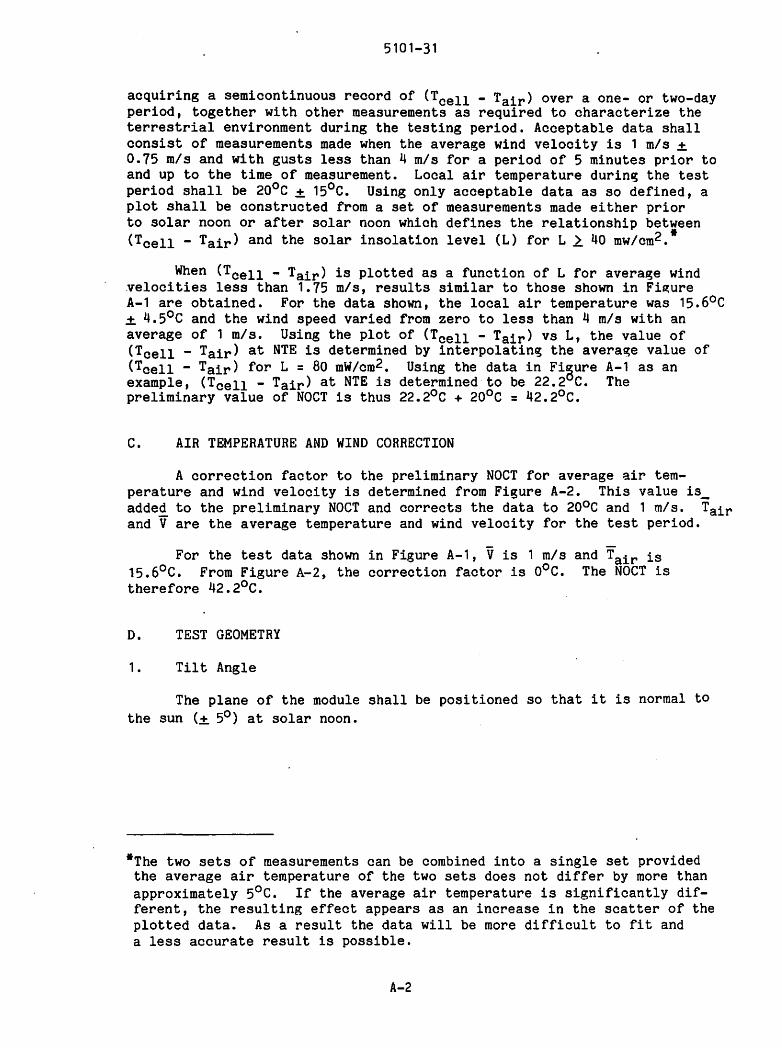
5101-31
acquiring a semicontinuous record of (Teel! - Tair> over a one- or two-day period, together with other measurements as required to characterize the terrestrial environment during the testing period. Acceptable data shall consist of measurements made when the average wind velocity is 1 m/s ± 0.75 m/s and with gusts less than 4 m/s for a period of 5 minutes prior to and up to the time of measurement. Local air temperature durin~ the test period shall be 20°c ± 15°C. Using only acceptable data as so defined, a plot shall be constructed from a set of measurements made either prior to solar noon or after solar noon which defines the relationship between (Tcell - Ta1r> and the solar insolation level (L) for L 2. 40 mw/cm2.*
When (Tcell - Tair> is plotted as a function of L for average wind velocities less than 1.75 mis, results similar to those shown in Fi~ure A-1 are obtained. For the data shown, the local air temperature was 15.6°c ± 4.5°C and the wind speed varied from zero to less than 4 m/s with an average of 1 m/s. Using the plot of (Tcell - Ta1r> vs L, the value of (Tcell - Tair> at NTE is determined by interpolatin~ the avera~e value of (Teel! - Tair> for L = 80 mW/cm2. Using the data in Fi§ure A-1 as an example, (Tcell - Ta1r> at NTE is determined to be 22.2 C. The preliminary value of NOCT is thus 22.2°c + 20°c = 42.2°c.
C. AIR TEMPERATURE AND WIND CORRECTION
A correction factor to the preliminary NOCT for average air temperature and wind velocity is determined from Figure A-2. This value is_ added to the preliminary NOCT and corrects the data to 20°c and 1 m/s. Tair and V are the average temperature and wind velocity for the test period.
For the test data shown in Figure A-1, Vis 1 m/s and Tair is 15.6°c. From Figure A-2, the correction factor is o0 c. The NOCT is therefore 42.2°c.
D. TEST GEOMETRY
1. Tilt Angle
The plane of the module shall be positioned so that it is normal to the sun C± 5°) at solar noon.
*The two sets of measurements can be combined into a single set provided the average air temperature of the two sets does not differ by more than approximately 5°c. If the average air temperature is significantly different, the resulting effect appears as an increase in the scatter of the plotted data. As a result the data will be more difficult to fit and a less accurate result is possible.
A-2

30
25
20
..: ,,_;;;,
I
~ 15 u ...
10
5101-31
TCELL -TAIR' NTE - -- -- ------ -- -- -- -- -- -- ----
o~ __ ....._ ___ ......_ __ ~ ___ ...,...._ __ __,,,,,__ __ ......,_ __ ___., ___ ........_ __ __. _____ ...,...,.__. o w w ~ ~ ~ ~ ro oo ~ ~
INTENSITY, fflW/c,n2
Figure A-1. Typical Cell Temperature Data
A-3
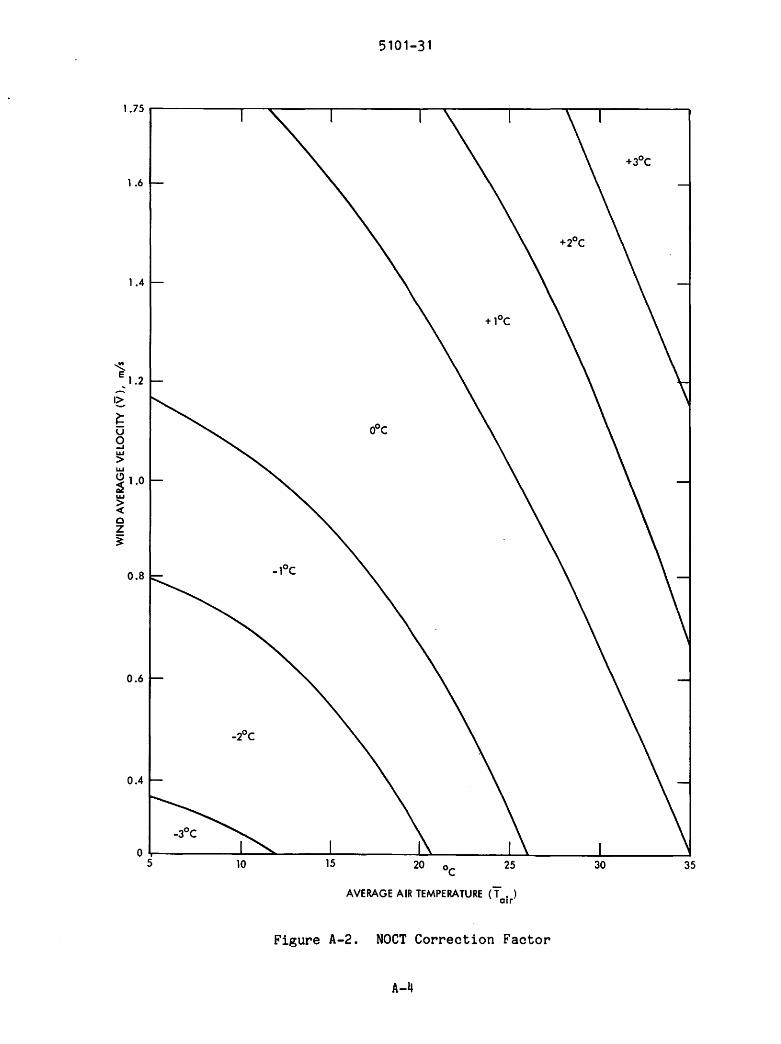
1.6
1.4
'?: ~ u 9 w > w
~ 1.0 w
~ C z i
0.8
0.6
0.4
10
5101-31
15 20 oc 25 30 35
AVERAGE AIR TEMPERATURE (f. ) air
Figure A-2. NOCT Correction Factor
A-4
5101-31
2. Height
The bottom edge of the module shall be 2 feet or more above the local horizontal plane or ground level.
3. Subarray Configuration
The module shall be located in the interior of a 1.2 m x 1.2 m (4' x 41 ) subarray. Black aluminum panels or other modules of the same design shall be used to fill in any remaining open area of the subarray structure. The back of the subarray shall be exposed.
4. Surrounding Area
There shall be no obstructions to prevent full irradiance of the module beginning a minimum of 4 hours before solar noon and up to 4 hours after solar noon. The ground surrounding the module shall not have a high soiar reflectance and shall be flat and/or sloping away from the test fixture. Grass and various types of ground covers, blacktop, and dirt are recommended for the local surrounding area. Buildings havin~ a lar~e solar reflective finish shall not be present 'in the immediate vicinity. Good engineering judgment shall be exercised to assure that the module, front and back sides, is receiving a minimum of reflected solar ener~y from the surrounding area.
5. Wind Direction
The wind shall not be predominantly from due east or from due west; flow parallel to the plane of the array is not acceptable and can result in a lower than typical operating cell temperature.
6. Module Electrical Load
Data shall be obtained for a module open-circuit condition corresponding to zero electrical power output.
E. TEST EQUIPMENT
1. Pyranometer
The total solar irradiance on the active side of the module shall be measured by a pyranometer mounted on the plane of the module and within .3 m (1 foot) of the array. The pyranometer used shall have a traceable annual calibration to a recognized standard instrument and shall be either (1) a temperature-compensated unit which has less than± 1% deviation in sensitivity over the range -20°c to +4o0 c, or (2) a unit which incorporates a temperature sensor and has a sensitivity-temperature correction supplied with its calibration.
A-5

5101-31
2. Wind Measurement
Both the wind direction and wind speed shall be measured at the approximate height of the module and as near to the module as feasible.
3. Air Temperature
The local air temperature shall be measured at the approximate height of the module. The measurement shall be made in the shadow of the module and shall be accurate to± 1°c. (Note: An average local air temperature is desired. This is obtained satisfactorily by increasing the thermal mass of the thermocouple by imbedding the thermocouple in a solder sphere of approximately 1/4-inch diameter.) The measurement must be appropriately shielded and vented.
4. Cell Temperature
The temperature of at least two representative interior solar cells shall be measured to.± 1°c. Thermocouples shall be 36 gauge, and shall be soft-soldered directly to the back of the cells.
5. Substrate Surface Temperature
The exterior temperature of the rear of the solar module shall be measured to.± 1°c beneath a representative cell and when practical beneath a representative space between cells. Thermocouples shall be 26 gauge, and shall be bonded down with 57-C epoxy or the equivalent.
F. DATA RECORDING
All data shall be printed out approximately every 2 minutes. In addition, solar intensity, wind speed, wind direction, and air temperature shall be continuously recorded.
G. CLEANING
The active side of the solar cell module and the pyranometer bulb shall be cleaned before the start of each test. Dirt shall not be allowed to build up. Cleaning with a mild soap solution followed by a rinse with distilled water has proven to be effective.
H. EQUIPMENT CALIBRATION
A calibration check shall be made of all the equipment prior to the start of the test.
A-6

5101-31
I. TEST DESCRIPTION PAGE
The test description page illustrated in Figure A-3 shall be completed before the start of the test.
J. AUTOMATION
Once initiated, the data may be collected automatically. However, the equipment shall be checked once every hour.
A-7

5101-31
TEST DESCRIPTION
Title: Natural Sunlight Thermal Performance Test
Article:
Location:
Latitude:
Elevation:
Date: Solar Noon Optical Air Mass------~------~
Cleaning Agent Used:
Tilt Angle: Desired~--------,------~
Equipment Calibration Complete--------------------------------------
Name: ----------------------- Ext.
Comments:
Figure A-3. Test Description Page
A-8 NASA-JPL-Coml., L.A., Cahl.

-jpk·