50 - genworthinvestor.genworth.com.au/formbuilder/_resource/... · consumer sentiment study. 1965...
TRANSCRIPT

50Genworth Annual Report
2015
Y E A R S
Genworth Mortgage Insurance Australia LimitedABN 72 154 890 730
genworth.com.au

This print advertisement was issued by Genworth’s predecessor business, HLIC.

Annual Report 2015 1
50Y E A R S
Celebrating 50 years at the heart of homeownership in Australia
ContentsGenworth overview 2
Chairman’s message 4
CEO’s report 6
Our strategy 8
Board of Directors 10
Senior Leadership Team 12
Annual Financial Report 15
Genworth is the leading provider of Lenders Mortgage Insurance (LMI) in Australia. LMI has been an important part of the
Australian residential mortgage lending market since Housing Loan Insurance
Corporation (HLIC) was founded by the Australian Government in 1965.

Genworth Mortgage Insurance Australia2
Gross written premium Residential mortgage market trends
Genworth overview
Snapshot
Genworth Australia policies written during 2015.
Value of Genworth Australia’s investment portfolio.
Genworth Australia’s market capitalisation.
92,228 $3.9bn $1.6bn
Portfolio of insured loans by State*
All data as at 31 December 2015 unless otherwise stated
$0m
$100m
$200m
$300m
$400m
$500m
$600m
$700m
2005 2006 2007 2008 2009 2010 2011 2012 2013 2014 2015
$508m
2008 2009 2010 2011 2012 2013 2014 2015
138.3
80.8
173.1
89.2
36.9%
$billions
34.0%
30.5%
33.3%
34.1% 33.5%
28.1%
24.3%
166.8
73.3
161.4
80.5
168.8
87.4
200.9
101.4
242.4
94.8
207.1
66.6
HLVR Loans (% of New Residential Loan Approvals)
Loans approved LVR <80%
Source: APRA
Loans approved LVR >80%
NSW29%
ACT3%
QLD23%
SA6%
WA12%
NT1%
NZ2%
VIC23%
*Total may not sum due to rounding.

Annual Report 2015 3
Dividends (cents per share)
Key dates
Downloads of Streets Ahead, our biannual consumer sentiment study.
1965HLIC commences business operations.
1997GE purchases HLIC from the Australian Government and begins GE Mortgage Insurance Co in Australia.
2014Genworth Mortgage Insurance Australia Limited (ASX: GMA) is admitted to the S&P/ASX 200 Index.
2004Genworth Financial Inc IPO on the NYSE.
2014Genworth Australia successfully lists on the ASX.
2015Genworth Australia celebrates 50 years of helping Australians purchase residential property.
Genworth Australia has almost 1.5 million policies in force.
Genworth Australia has commercial relationships with over 100 lenders across Australia.
10,000 1.5 million >100
0
4
8
12
16
20
50
55
60
65
70
2H151H152H141H14
Cen
ts p
er s
hare
Ord
inary payo
ut ratio
Ordinary Ordinary payout ratio (RHS)Special
2.8
0
13.112.5
14.0
11.5
18.5
5.3

Genworth Mortgage Insurance Australia4
Richard Grellman AM
Chairman Genworth Mortgage Insurance Australia Limited
Chairman’s message
Genworth Australia remains focused on its strategic priorities that we believe are delivering, and will continue to deliver, a sustainable return on equity for shareholders.
At Genworth Australia, our mission is to help Australians get into their home sooner and assist them to stay there. We do this by working with our lender customers, regulators and policy leaders to promote a stronger and more sustainable housing market in Australia. At Genworth, we believe that the provision of Lenders Mortgage Insurance (LMI) to our lender customers contributes significantly to supporting the Australian dream of homeownership. I am pleased to say that in 2015 alone we helped over 92,000 Australians purchase a residential property.
Leadership transition I am pleased to report that Ms Georgette Nicholas was appointed CEO in February 2016 following an extensive global search, after the retirement of Ms Ellie Comerford in October 2015. Ms Nicholas was previously the Acting CEO and, prior to that, the Chief Financial Officer of Genworth Australia. I believe that Ms Nicholas brings significant leadership capability and experience to the role. She has already taken action to focus the organisation on its strategy as well as simplifying business processes and strengthening important external and commercial relationships. My fellow Directors and I wish her every success in the role.

Annual Report 2015 5
Genworth Australia strategy Genworth Australia remains focused on its strategic priorities that we believe are delivering, and will continue to deliver, a sustainable return on equity for shareholders. Our strategy will remain consistent with our priorities being to:
• Strengthen and grow our customer relationships;
• Target appropriate risk-adjusted returns to enhance profitability;
• Optimise our capital structure;
• Maintain a strong risk management discipline; and
• Continue to work on LMI recognition.
Our focus must be on continuing to enhance the current business model and on innovating products and services to compete with any potential threat of disruption in the market.
We are working to strengthen our customer relationships by continuing to support borrowers looking to get into the housing market safely and by structuring products to meet the risk management needs of our lenders.
Given the challenging market, we will ensure we maintain our strong risk management discipline by pricing for appropriate risk-adjusted returns and continuing to invest in our analytic and modelling capabilities.
We continue to evaluate ways to optimise our capital position and we are working with regulators and other stakeholders on the public policy front to reinforce the role that Genworth and LMI plays is not only facilitating homeownership in Australia but also supporting the stability of the Australian financial system; All in support of enhancing returns to all shareholders.
Financial position The Company continues to be managed with a strong capital position and conservative balance sheet. At the end of 2015, we maintained a regulatory capital base of $2.6 billion and a coverage ratio of 1.59 times the Prescribed Capital Amount (PCA) on a Group (Level 2) basis. This is in excess of the Board’s targeted range of 1.32 – 1.44 times the PCA.
We also have a high quality investment portfolio. As at 31 December 2015, the cash and investment portfolio had a market value of $3.9 billion, with 96% of the investment portfolio invested in Australian dollar denominated cash, cash equivalents and fixed income securities and 96% of the portfolio rated A- or above by the major ratings agencies.
Dividends In light of our financial results and capital management last year, I am pleased that we were able to reward our shareholders with special dividends on top of the ordinary dividends. Total dividends declared for the full year 2015 were 50.3 cents per share, including special dividends of 23.8 cents per share. The ordinary dividends paid for the year represent 62.2% of the underlying Net Profit After Tax, which is just above the mid-point of our target dividend payout ratio range of between 50% and 70% for 2015.
Looking ahead I believe Genworth Australia’s business model is resilient and capable of performing well in a dynamic economic environment and mortgage market. Looking ahead, reduced high loan-to-value ratio (LVR) lending as a proportion of total mortgage originations suggests new insurance written in 2016 is likely to be less capital intensive and lower risk. With this in mind, we will continue to evaluate a range of capital management initiatives and continue our ongoing journey of right-sizing our capital base.
I would like to close by thanking our CEO, Georgette Nicholas, her Executive team and all those who work at Genworth Australia for what has been a successful year. I would also like to thank my fellow Directors for their ongoing commitment to the Company. Finally, I thank you, our shareholders, for your continued support.
Yours sincerely,
Genworth Mortgage Insurance Australia6
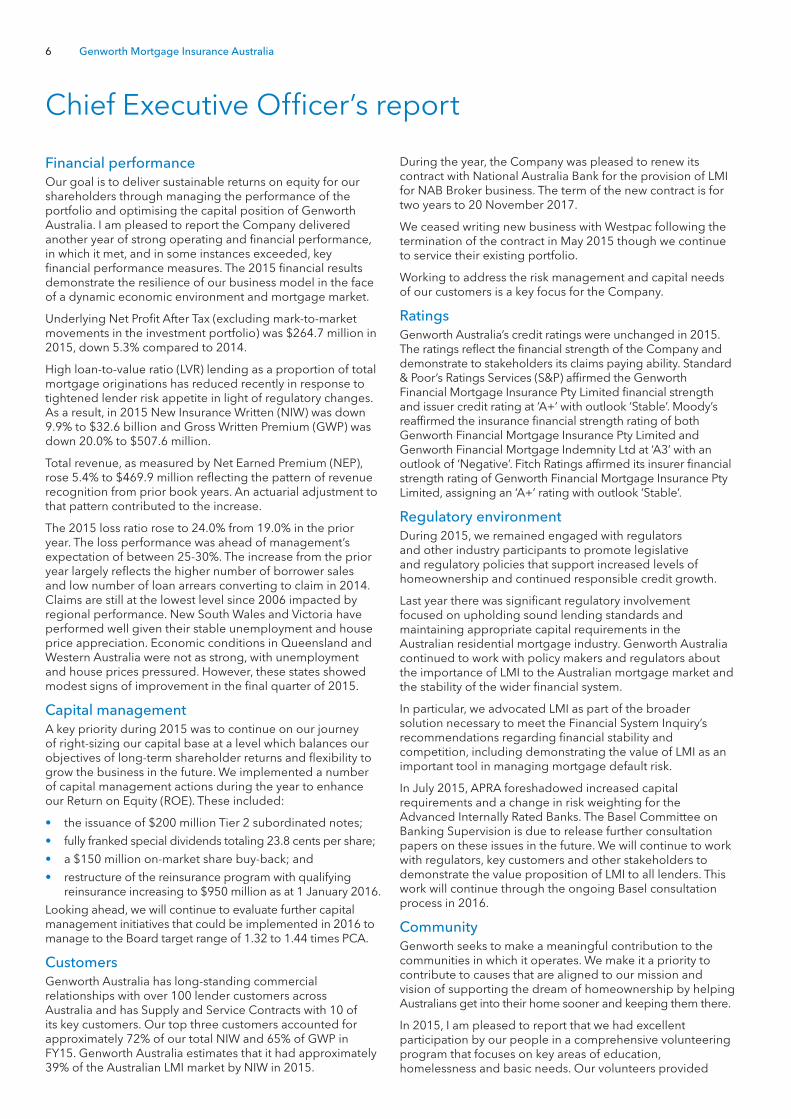
Financial performance Our goal is to deliver sustainable returns on equity for our shareholders through managing the performance of the portfolio and optimising the capital position of Genworth Australia. I am pleased to report the Company delivered another year of strong operating and financial performance, in which it met, and in some instances exceeded, key financial performance measures. The 2015 financial results demonstrate the resilience of our business model in the face of a dynamic economic environment and mortgage market.
Underlying Net Profit After Tax (excluding mark-to-market movements in the investment portfolio) was $264.7 million in 2015, down 5.3% compared to 2014.
High loan-to-value ratio (LVR) lending as a proportion of total mortgage originations has reduced recently in response to tightened lender risk appetite in light of regulatory changes. As a result, in 2015 New Insurance Written (NIW) was down 9.9% to $32.6 billion and Gross Written Premium (GWP) was down 20.0% to $507.6 million.
Total revenue, as measured by Net Earned Premium (NEP), rose 5.4% to $469.9 million reflecting the pattern of revenue recognition from prior book years. An actuarial adjustment to that pattern contributed to the increase.
The 2015 loss ratio rose to 24.0% from 19.0% in the prior year. The loss performance was ahead of management’s expectation of between 25-30%. The increase from the prior year largely reflects the higher number of borrower sales and low number of loan arrears converting to claim in 2014. Claims are still at the lowest level since 2006 impacted by regional performance. New South Wales and Victoria have performed well given their stable unemployment and house price appreciation. Economic conditions in Queensland and Western Australia were not as strong, with unemployment and house prices pressured. However, these states showed modest signs of improvement in the final quarter of 2015.
Capital management A key priority during 2015 was to continue on our journey of right-sizing our capital base at a level which balances our objectives of long-term shareholder returns and flexibility to grow the business in the future. We implemented a number of capital management actions during the year to enhance our Return on Equity (ROE). These included:
• the issuance of $200 million Tier 2 subordinated notes;
• fully franked special dividends totaling 23.8 cents per share;
• a $150 million on-market share buy-back; and
• restructure of the reinsurance program with qualifying reinsurance increasing to $950 million as at 1 January 2016.
Looking ahead, we will continue to evaluate further capital management initiatives that could be implemented in 2016 to manage to the Board target range of 1.32 to 1.44 times PCA.
CustomersGenworth Australia has long-standing commercial relationships with over 100 lender customers across Australia and has Supply and Service Contracts with 10 of its key customers. Our top three customers accounted for approximately 72% of our total NIW and 65% of GWP in FY15. Genworth Australia estimates that it had approximately 39% of the Australian LMI market by NIW in 2015.
During the year, the Company was pleased to renew its contract with National Australia Bank for the provision of LMI for NAB Broker business. The term of the new contract is for two years to 20 November 2017.
We ceased writing new business with Westpac following the termination of the contract in May 2015 though we continue to service their existing portfolio.
Working to address the risk management and capital needs of our customers is a key focus for the Company.
RatingsGenworth Australia’s credit ratings were unchanged in 2015. The ratings reflect the financial strength of the Company and demonstrate to stakeholders its claims paying ability. Standard & Poor’s Ratings Services (S&P) affirmed the Genworth Financial Mortgage Insurance Pty Limited financial strength and issuer credit rating at ‘A+’ with outlook ‘Stable’. Moody’s reaffirmed the insurance financial strength rating of both Genworth Financial Mortgage Insurance Pty Limited and Genworth Financial Mortgage Indemnity Ltd at ‘A3’ with an outlook of ‘Negative’. Fitch Ratings affirmed its insurer financial strength rating of Genworth Financial Mortgage Insurance Pty Limited, assigning an ‘A+’ rating with outlook ‘Stable’.
Regulatory environment During 2015, we remained engaged with regulators and other industry participants to promote legislative and regulatory policies that support increased levels of homeownership and continued responsible credit growth.
Last year there was significant regulatory involvement focused on upholding sound lending standards and maintaining appropriate capital requirements in the Australian residential mortgage industry. Genworth Australia continued to work with policy makers and regulators about the importance of LMI to the Australian mortgage market and the stability of the wider financial system.
In particular, we advocated LMI as part of the broader solution necessary to meet the Financial System Inquiry’s recommendations regarding financial stability and competition, including demonstrating the value of LMI as an important tool in managing mortgage default risk.
In July 2015, APRA foreshadowed increased capital requirements and a change in risk weighting for the Advanced Internally Rated Banks. The Basel Committee on Banking Supervision is due to release further consultation papers on these issues in the future. We will continue to work with regulators, key customers and other stakeholders to demonstrate the value proposition of LMI to all lenders. This work will continue through the ongoing Basel consultation process in 2016.
CommunityGenworth seeks to make a meaningful contribution to the communities in which it operates. We make it a priority to contribute to causes that are aligned to our mission and vision of supporting the dream of homeownership by helping Australians get into their home sooner and keeping them there.
In 2015, I am pleased to report that we had excellent participation by our people in a comprehensive volunteering program that focuses on key areas of education, homelessness and basic needs. Our volunteers provided
Chief Executive Officer’s report

Annual Report 2015 7
Georgette Nicholas
Chief Executive Officer
I am pleased to report the Company delivered another year of strong operating and financial performance, in which it met, and in some instances exceeded, key financial performance measures.
1,232 hours (164 days) to support our community partners. Genworth Australia’s volunteer participation rate of 57% is a significantly higher level of employee engagement compared to the sector benchmark of 10%. As an organisation, we will continue to focus on our ongoing social responsibility in the years ahead.
2016 Outlook Genworth Australia continues to focus on the strategic needs of our customers, especially during this period of heightened regulatory attention on the Australian mortgage market and lending standards.
The outlook for the Australian residential mortgage market remains strong, supported by sound fundamentals including low unemployment, record low interest rates and a continued focus by regulators on lending standards.
The high LVR market continues to be constrained in 2016 and we expect GWP to decline by approximately 20% due to these market conditions.
Genworth Australia expects 2016 NEP to decline by approximately 5% and for the full year loss ratio to be between 25 and 35%. The Board will target an ordinary dividend payout ratio range of 50 to 80%. The full year outlook is subject to market conditions and unforeseen circumstances or economic events.
Genworth Australia remains committed to playing a vital role in supporting the homeownership aspirations of Australian families. We do this by mitigating risk for our lender
customers and thereby helping creditworthy borrowers to purchase a property sooner and with a smaller deposit.
Thank you I would like to thank the Chairman and Board of Directors of Genworth Australia for their support and guidance to management during 2015. I also want to thank all our Genworth Australia people for their hard work, dedication and commitment. It provides a solid foundation for our business and underpins our resilience through the cycle. I look forward to working with all of you in 2016 as we strive to deliver on our strategic priorities.
To our customers and other key business partners, thank you for your ongoing support and I look forward to continued strong relationships in the future. Finally, I would like to thank our shareholders for their continued confidence in the business.
Yours sincerely,

Genworth Mortgage Insurance Australia8
Strengthening our customer relationships and product value proposition
• Leading market position
• Focussed on meeting the strategic needs of our customers.
Targeting appropriate, risk-adjusted returns and enhance profitability
• Pricing NIW to achieve low-to-mid teens ROE over the long-term
• Investment in loss mitigation processes
• Ongoing cost optimisation initiatives.
Optimising the capital structure
• Maintain strong balance sheet and stable credit ratings
• Preference to return excess capital to shareholders where appropriate.
Our strategy
Genworth’s primary business activity is the provision of LMI to its lender customers. The Group’s strategic objective is to deliver long-term returns to shareholders.
The strategy aims to deliver a sustainable Return on Equity above the cost of capital by executing on the following priorities:
1 2 3

Annual Report 2015 9
Maintaining strong risk management discipline
• Effective risk decision-making
• Invest in modelling and analytical capabilities.
Continuing to work on LMI recognition
• Continued engagement with regulators
• Public policy recommendations and submissions.
4 5
Genworth Australia provides insurance for $320 billion of home loans in the Australian and New Zealand mortgage markets
$320bn

Genworth Mortgage Insurance Australia10 Genworth Mortgage Insurance Australia10
Richard GrellmanChairman
Richard was appointed Chairman of the Board on 1 March 2012. He was previously at KPMG where he spent 32 years, with the last 10 years specifically focused on the provision of strategic advice and services to the financial services sector. His tenure at KPMG included being a partner from 1982 – 2000; a member of KPMG National Board from 1995 – 1997; and a member of KPMG National Executive from 1997 – 2000.
Since 2000, Richard has held a number of directorships across the financial services sector with publicly-listed companies. He has over 40 years of experience in total; 20 years of board experience and 23 years of financial services experience.
Richard was the independent financial expert for the AMP and Tower Life NZ demutualisations and was appointed member of the Order of Australia for service to the community in 2007. In addition to his position at Genworth Australia, Richard is currently Chairman of AMP Foundation, Chairman of IPH Limited, and a director of Bisalloy Steel Group Limited.
Tony GillDirector, Independent
Tony was appointed to the Board on 20 February 2012.
Tony has over 30 years of financial services experience having served on a number of boards over that period. Previously Tony was Group Head, Banking and Securitisation Group at Macquarie Group. He has held senior executive roles in Macquarie Group from 1991– 2008.
Prior to Macquarie, Tony was a Chartered Accountant then held various management roles in mortgage banking and treasury in Australia. He is currently Chairman of Australian Finance Group and a director of First American Title Insurance Company of Australia Ltd and First Mortgage Services Pty Ltd.
Tony was previously Chairman of Australian Securitisation Forum and National President of the Mortgage Finance Association of Australia.
Ian MacDonald Director, Independent
Ian was appointed to the Board on 19 March 2012.
Ian has over 40 years of financial services experience in Australia, the UK and Japan, specifically in banking, insurance, wealth management and technology. He previously held numerous positions with National Australia Bank including various senior executive roles from 1999 – 2006; Chief Operating Officer Yorkshire Bank from 1997 – 1999; and head of Retail Services Clydesdale Bank, Glasgow UK from 1994 – 1997.
Ian is a Senior Fellow and past President of the Financial Services Institute of Australasia and a member of the Australian Institute of Company Directors. Since 2006, Ian has held a number of directorships including publicly-listed companies, and is currently a director of Arab Bank Australia Ltd and Tasmanian Public Finance Corporation.
Gayle TollifsonDirector, Independent
Gayle was appointed to the Board on 20 February 2012.
Gayle has over 35 years of financial services experience and has been an Independent Director since 2006. Prior to this she worked with QBE Insurance Group in senior executive roles including Chief Risk Officer and Group Financial Controller from 1994 – 2006. Prior to QBE, Gayle held various roles in public accounting firms in Australia, Bermuda and Canada. She is a fellow of the Australian Institute of Company Directors and the Institute of Chartered Accountants in Australia and is currently Chairman of Munich Holdings of Australasia Pty Limited and subsidiaries and a director of RAC Insurance Pty Limited and Campus Living Funds Management Limited.
Board of Directors

Annual Report 2015 11Annual Report 2015 11
Stuart TakeDirector, Genworth Financial designee
Stuart has over 25 years’ experience, primarily at Genworth/General Electric. He joined GE Capital in 1987 and has since held a number of senior management positions in Genworth’s mortgage insurance platform both domestically and overseas, including President/CEO of Genworth’s Canadian mortgage insurance business, and Senior Vice President of Asia.
Stuart is currently President of the Board of Directors of Genworth Seguros de Credito a la Vivienda S.A. de C.V. (Mexico) and also serves as a Director of India Mortgage Guarantee Corporation (a Genworth joint venture with the International Finance Corporation, the Asian Development Bank and the National housing Bank of India). He was previously Head of Financial Institutions at Deutsche Bank, Asia ex-Japan.
Leon RodayDirector, Genworth Financial designee
Leon was appointed to the Board on 19 March 2012.
Leon was the Senior Vice President, General Counsel and Secretary, Genworth Financial to February 2015. Prior to this position, he held the same role for GE Financial since 1996.
Prior to Genworth/GE, Leon was previously a partner at LeBoeuf, Lamb, Greene & McRae for 14 years, and he is a member of the New York Bar Association.
Jerome UptonDirector, Genworth Financial designee
Jerome was appointed to the Board on 20 February 2012.
Jerome was appointed Senior Vice President and Chief Financial and Operations Officer, Global Mortgage Insurance, Genworth Financial in 2012. Previously he was the Senior Vice President and Chief Operating Officer, Genworth Financial International Mortgage Insurance from 2009. Prior to this Jerome has had a variety of roles at Genworth including the Senior Vice President and CFO, Genworth Financial International – Asia Pacific, Canada and Latin America from 2007 – 2009; the head of Global Financial Planning & Analysis from 2004 – 2007; International Finance Manager from 2002 – 2004; and Mortgage Insurance Global Controller from 1998 – 2002.
Prior to Genworth, Jerome served in a number of accounting positions at KPMG Peat Marwick, culminating in his role as Senior Manager – Insurance in Raleigh, North Carolina. He obtained the status of Certified Public Accountant whilst the Controller and Director of Financial Reporting for Century American Insurance Company in Durham, North Carolina.
Samuel MarsicoDirector, Genworth Financial designee
Sam was appointed to the Board on 19 March 2012.
Sam was the Chief Risk Officer, Global Mortgage Insurance division of Genworth Financial from 2008 – 2014. He worked for 23 years at Genworth/General Electric having held various positions across the organisation including a number of leadership positions at both GE Transportation Systems and GE Corporate Finance from 1991 – 1996. Sam became the CFO of GE mortgage insurance in 1997, and was then Senior Vice President and Chief Risk Officer for GE Mortgage Insurance from 2002 – 2005, and Chief Risk Officer for Genworth Financial from 2006 – 2008.
Prior to his roles at Genworth/GE Sam was a senior executive at Price Waterhouse in New York.

Genworth Mortgage Insurance Australia12 Genworth Mortgage Insurance Australia12
Luke OxenhamChief Financial Officer and Company Secretary
Luke joined Genworth Australia as Director Corporate Finance & Investor Relations in March 2012 and became Chief Financial Officer in February 2016 following four months as Acting Chief Financial Officer. Luke brings 20 years of financial services experience to his role as Chief Financial Officer, across the banking, finance and insurance industries.
Most recently Luke was directly responsible for a number of finance functions including the planning, development and management of Genworth Australia’s capital requirements, the reinsurance program, investment portfolio, product pricing and investor relations activities.
Before joining Genworth, Luke was the Chief Financial Officer of Intoll Group, which was formed from the demerger of Macquarie Infrastructure Group (MIG), where Luke was the Head of Investor Relations. Prior to Macquarie Group, Luke was General Manager, Corporate Affairs & Budgeting at Promina Group having joined prior to the Initial Public Offering in 2003 and being a key member of the management team that oversaw the takeover of Promina by Suncorp in 2007. In his earlier career, Luke spent almost 10 years with National Australia Bank in various roles both in Australia and the UK, as well as a number of years at Metway Bank in Brisbane.
Luke has a Bachelor of Commerce from Griffith University Brisbane and a Graduate Diploma in Advanced Finance and Investment from the Securities Institute, as well as a Graduate Diploma in Psychology from Monash University.
Andrew CormackChief Risk Officer
Andy joined Genworth Australia as Chief Risk Officer in October 2015. Andy brings more than 20 years of experience to his role as CRO having held senior financial as well as risk roles in the mortgage insurance industry. Andy is a seasoned leader, having had senior management responsibility for teams in commercial, product development and risk for multiple markets across Europe. He is passionate about delivering best in class risk and actuarial business models and building and developing high achieving teams engaged in delivering business objectives.
Before joining Genworth Australia, Andy worked with Genworth Financial Mortgage Insurance in Europe, where most recently he held the role of Chief Risk Officer with responsibility for the risk and actuarial teams. Prior to this he held various positions including Senior Vice President (SVP) Technical Director, SVP Commercial Leader, SVP Product Development & Marketing and Chief Financial Officer.
Earlier in his career, Andy spent three years with JP Morgan where he focused on emerging market fixed income derivatives and prior to this worked at Neville Russell Accountants (now Mazars) as an auditor responsible for Lloyds syndicates.
Andy has a Bachelor of Arts in Accounting and Finance from Lancaster University and is a qualified Chartered Accountant.
Georgette NicholasChief Executive Officer
Georgette became Chief Executive Officer in February 2016 after four months as Acting Chief Executive Officer following joining the business as Chief Financial Officer in February 2014. Georgette brings more than 30 years of financial and industry experience to the role including her extensive global experience in Lenders Mortgage Insurance.
In her prior role as Chief Financial Officer, Georgette effectively leveraged her financial acumen, industry experience and leadership skills across finance, audit, controllership, strategy, actuarial and investor relations. She has a deep understanding of the mortgage insurance business in international markets, including the United States having worked with Genworth for 10 years.
Previously, Georgette worked as Senior Vice President, Investor Relations, Public Relations and Rating Agencies with Genworth Financial Inc. Other senior roles she has held at Genworth include Chief Financial Officer, US Mortgage Insurance where she was a key member of the management team leading the business through the economic downturn in the US housing market and the GFC, and Global Controller for both US Mortgage Insurance and International Segments.
Georgette has a Bachelor of Science in Accounting from the University of Bridgeport CT and is a Certified Public Accountant and Chartered Global Management Accountant.
Senior Leadership Team

Annual Report 2015 13Annual Report 2015 13
Jo Ann RabitzChief Human Resources Officer
Jo Ann has been with Genworth since Genworth’s IPO from GE in 2004 and brings 29 years of HR experience to her role. She joined Genworth Australia as Chief Human Resources Officer in March 2012.
Jo Ann’s responsibilities include all aspects of human resources.
Before joining the Australian business in her current role, Jo Ann was the Senior Vice President, Human Resources for Genworth’s International segment based in the United States. Jo Ann held a variety of HR leadership roles with GE Capital from 1990 until GE’s IPO of Genworth in 2004. Earlier in her career, Jo Ann held various HR positions with divisions of Allied Signal, Occidental Petroleum and PepsiCo.
Jo Ann earned her Bachelor of Science degree in Industrial Relations from Saint Joseph’s University in Philadelphia, Pennsylvania.
Bridget SakrChief Commercial Officer
Bridget has been Chief Commercial Officer at Genworth since this role was created in mid 2010.
Bridget is responsible for Partnership and Distribution, Product Development, and Marketing, leveraging her significant commercial expertise. Prior to this appointment, and since 2003, Bridget held the role of Sales Leader at Genworth. Bridget’s primary focus is on strong customer relationships, building exclusive partnerships, and excellent customer service.
Bridget brings to Genworth 25 years of experience in the mortgage industry, having worked in sales, operation and business development.
Bridget has a Bachelor of Economics from the University of Sydney.
Tobin FonsecaChief Operations Officer
Tobin joined Genworth Australia as Chief Operations Officer in February 2012. Tobin brings more than 30 years of experience to his role as COO across a range of areas in the financial services industry.
In his current role Tobin is responsible for underwriting, loss mitigation, collections, the project management office and the Technology team.
Before joining Genworth, Tobin had worked at Advantedge Financial Services, a subsidiary of National Australia Bank, where he held the role of General Manager Advantedge Services overseeing the whole lending lifecycle. Prior to National Australia Bank, he was with the Challenger Group holding the Managing Director role with Synergy Capital Management in Hobart and the CEO role with Challenger Corporate Superannuation Services.
Earlier in his career, Tobin spent 20 years with Merrill Lynch in various leadership roles both in Australia and the US including Chief Administrative Officer/Project Director for Merrill Lynch HSBC Australia and Vice President /Program Manager International Private Client Group in Australia.

Genworth Mortgage Insurance Australia14
This print advertisement was issued by Genworth’s predecessor business, HLIC.

Annual Report 2015 15
Y E A R S
Annual Financial Report for the year ended 31 December 2015
ContentsCorporate Governance statement 16
Directors’ report 17
Remuneration report 31
Lead auditor’s independence declaration 57
Financial statements 58
Directors’ declaration 105
Independent auditor’s report 106
Shareholder information 108
Glossary 111
Corporate directory 113

Genworth Mortgage Insurance Australia16
Corporate Governance statement
The Corporate Governance statement is available on the Genworth website. Please visit http://investor.genworth.com.au/Investor-Centre/

Annual Report 2015 17
Directors’ report
The directors present their report together with the financial statements of the Group comprising the Company and its controlled entities for the year ended 31 December 2015 and the auditor’s report thereon.
DirectorsThe directors of the Company at any time during or since the end of the financial year are as follows:
Name and title Biography
Richard Grellman AM Chairman, Independent
• Previously was at KPMG where he spent 32 years, with the last 10 years specifically focused on the provision of strategic advice and services to the financial services sector:
– Partner from 1982 – 2000;
– Member of KPMG National Board from 1995 – 1997;
– Member of KPMG National Executive from 1997 – 2000.
• Since 2000, has held a number of directorships across the financial services sector with publicly-listed companies
• Over 40 years of experience in total; 20 years of board experience and 23 years of financial services experience
• Was the independent financial expert for the AMP and Tower Life NZ demutualisations
• Appointed a member of the Order of Australia for service to the community in 2007
• Currently Chairman of AMP Foundation and IPH Limited, and a director of Bisalloy Steel Group and StatePlus
• Appointed 1 March 2012
Anthony (Tony) Gill Director, Independent
• Chairman of the Capital & Investment Committee
• Over 30 years of financial services experience having served on a number of boards over that period
• Previously Group Head, Banking and Securitisation Group at Macquarie Group:
– Held senior executive roles in Macquarie Group from 1991 – 2008.
• Prior to Macquarie, was a Chartered Accountant then held various management roles in mortgage banking and treasury in Australia
• Currently Chairman of Australian Finance Group and a director of First American Title Insurance Company of Australia Ltd and First Mortgage Services Pty Ltd
• Previously Chairman of Australian Securitisation Forum and National President of the Mortgage Finance Association of Australia
• Appointed 20 February 2012
Ian MacDonald Director, Independent
• Chairman of the Remuneration & Nominations Committee
• Over 40 years of financial services experience in Australia, the UK and Japan, specifically in banking, insurance, wealth management and technology
• Previously held numerous positions with National Australia Bank:
– Various senior executive roles from 1999 – 2006;
– Chief Operating Officer Yorkshire Bank from 1997 – 1999;
– Head of Retail Services Clydesdale Bank, Glasgow UK from 1994 – 1997.
• Senior Fellow and past President of the Financial Services Institute of Australasia and a member of the Australian Institute of Company Directors
• Currently a director of Arab Bank Australia Ltd and Tasmanian Public Finance Corporation
• Since 2006 has held a number of directorships including publicly-listed companies
• Appointed 19 March 2012

Genworth Mortgage Insurance Australia18
Directors’ report (continued)
Name and title Biography
Gayle Tollifson Director, Independent
• Chairman of the Audit Committee and the Risk Committee
• Over 35 years of financial services experience and an Independent Director since 2006:
– Worked with QBE Insurance Group in senior executive roles including Chief Risk Officer and Group Financial Controller from 1994 – 2006;
– Prior to QBE, held various roles in public accounting firms in Australia, Bermuda and Canada.
• Fellow of the Australian Institute of Company Directors and the Institute of Chartered Accountants in Australia
• Currently Chairman of Munich Holdings of Australasia Pty Limited and subsidiaries and a director of RAC Insurance Pty Limited and Campus Living Funds Management Limited
• Appointed 20 February 2012
Samuel Marsico Director, Genworth Financial designee
• Director of Genworth MI Canada Inc.
• Chief Risk Officer, Global Mortgage Insurance, Genworth Financial from 2008 to 2014:
– 23 years at Genworth/General Electric;
– Chief Risk Officer for Genworth Financial from 2006 – 2008;
– Senior Vice President and Chief Risk Officer for GE Mortgage Insurance from 2002 – 2005;
– Joined GE Mortgage Insurance as CFO in 1997;
– Held a number of leadership positions at both GE Transportation Systems and GE Corporate Finance from 1991 – 1996.
• Previously a senior executive at Price Waterhouse in New York
• Appointed 19 March 2012
Leon Roday Director, Genworth Financial designee
• Director of Genworth MI Canada Inc.
• Executive Vice President, General Counsel and Secretary, Genworth Financial to 26 January 2015:
– Prior to this position, held the same role for GE Financial since 1996.
• Previously a partner at LeBoeuf, Lamb, Greene & McRae for 14 years
• Member of the New York Bar Association
• Appointed 19 March 2012
Stuart Take Director, Genworth Financial designee
• Senior Vice President, New Market Development, Genworth Global Mortgage Insurance, Genworth Financial
• Over 25 years’ experience, primarily at Genworth/General Electric:
– Joined GE Capital in 1987 and has since held a number of senior management positions in Genworth’s mortgage insurance platform both domestically and overseas, including President/CEO of Genworth’s Canadian mortgage insurance business, and Senior Vice President of Asia.
• Director of India Mortgage Guarantee Corporation (a Genworth Financial joint venture with the International Finance Corporation, the Asian Development Bank and the National Housing Bank of India)
• President, Board of Directors Genworth Seguros de Credito a la Vivienda S.A. de C.V. (Mexico)
• Previously Head of Financial Institutions at Deutsche Bank, Asia ex-Japan
• Appointed 20 February 2012
Directors (continued)
Annual Report 2015 19
Directors’ report (continued)
Name and title Biography
Jerome Upton Director, Genworth Financial designee
• Director of Genworth MI Canada Inc.
• Appointed Senior Vice President and Chief Financial and Operations Officer, Global Mortgage Insurance, Genworth Financial in 2012:
– 18 years at Genworth/General Electric;
– Previously Senior Vice President and Chief Operating Officer, Genworth Financial International Mortgage Insurance from 2009;
– Senior Vice President and CFO, Genworth Financial International – Asia Pacific, Canada and Latin America from 2007 – 2009;
– Global Financial Planning & Analysis from 2004 – 2007;
– International Finance Manager from 2002 – 2004;
– Mortgage Insurance Global Controller from 1998 – 2002.
• Prior to Genworth, served in a number of accounting positions at KPMG Peat Marwick, culminating in his role as Senior Manager – Insurance in Raleigh, North Carolina
• Obtained the status of Certified Public Accountant whilst the Controller and Director of Financial Reporting for Century American Insurance Company in Durham, North Carolina.
• Appointed 20 February 2012
Principal activityThe principal activity of the Group during the reporting period was the provision of lenders mortgage insurance under authorisation from APRA. In Australia, LMI facilitates residential mortgage lending by transferring risk from lenders to LMI providers, predominately for high loan to value ratio residential mortgage loans.
Operating and financial reviewOrganisation overview and business modelAbout Genworth AustraliaGenworth Australia is the leading LMI Provider in the Australian LMI Market. The Group estimates that it had approximately 39% of the Australian LMI Market by NIW for the 12 months ended 31 December 2015.
The Company was incorporated on 21 December 2011 with $1 share capital and had nil operating activity until 19 May 2014 when the Group was formed and the Company gained 100% control of all the Genworth Australia subsidiaries as part of the IPO restructure. The Company was listed on the ASX on 20 May 2014 under ticker code ‘GMA’ at an issue price of $2.65 per share, raising $583 million from the offer which represented 33.85% of the issued share capital of the Company with the remaining 66.15% of the share capital indirectly held by Genworth Financial. On 15 May 2015, Genworth Financial sold 92.3 million shares in GMA, reducing its ownership to approximately 52%. The Company commenced an on-market buyback program on 16 November 2015 as part of the Group’s capital management initiatives. As at 8 December 2015, 54.6 million shares in the amount of $150 million were successfully purchased from the market. Genworth Financial participated in the on-market sale transactions during the program to maintain the approximately 52% stake in the Group.

Genworth Mortgage Insurance Australia20
Directors’ report (continued)
Operating and financial review (continued)Organisation overview and business modelThe Group has the following corporate structure:
GMA’s Subsidiaries (please refer to Note 7.5 of Financial Statements
for controlled entities details)
Genworth Mortgage Insurance Australia Ltd (GMA)
ABN 72 154 890 730
Genworth Financial, Inc
286.1m ordinary shares
(52%)
Public
(48%)
309.3m ordinary shares
* Genworth Financial’s interest in the Company is held indirectly through the Genworth Financial Group.
Business ModelGenworth Australia’s business activitiesAs a LMI Provider, Genworth Australia’s profitability is driven primarily by its ability to earn premiums and generate financial income in excess of net claims and operating expenses (being underwriting and other costs). The diagram below illustrates how Genworth Australia creates value.
Products and Income
Premium Income from writing LMI
Claims DividendsFinancial Income
Underwriting and other
costs
Retained Earnings
Costs
Strategy, Risk and Capital Management
Distribution
Genworth Australia shareholder value chain
• LMI usage
• Customers
• NIW
• Premium rates
• GWP
• Revenue recognition
• Interest rates
• Capital levels
• Delinquencies
• Reserving
• Payment of claims
•
•
••
Underwriting
Marketing costsStaff and IT costs
feesAmortisation of customeracquisitionrelated costs
• Underlying net profit after tax
• Payout ratio

Annual Report 2015 21
Directors’ report (continued)
Products and IncomeThe Group continued to offer three LMI products in 2015 and they are Standard LMI, Homebuyer Plus and Business Select/Low Doc. In FY15, Standard LMI produced 99% of total gross written premium while the other two products generated the rest.
The Group underwrites LMI through flow and portfolio channels. In FY15, 98% of the business was generated from the flow channel and the remainder was from the portfolio channel.
During 2015, Genworth Australia continued to maintain commercial relationships with over 105 lender customers across Australia. Genworth Australia has Supply and Service Contracts with 10 of its key lender customers.
In 2015, Genworth Australia’s top three lender customers accounted for approximately 72% of Genworth Australia’s NIW and 66% of its GWP in FY15 and its largest lender customer accounted for approximately 34% of its NIW and 44% of its GWP in FY15, as illustrated below
Lender customer FY15 NIW FY15 GWP
Lender customer 1 34% 44%
Lender customer 2 28% 12%
Lender customer 3 10% 10%
Lender customers 4 – 10 23% 29%
All other lender customers 5% 5%
Strategy and Risk OpportunitiesStrategyThe Group’s strategic objective is to deliver long-term returns to shareholders, reflected in an attractive, sustainable ROE. In 2015 Genworth Australia continued to pursue the following strategies to deliver on that objective:
Strategic priority FY15 Achievements
#1
Strengthen market leadership position
• Renewed a key lender customer contract
• New agreement signed with existing customer for <80% LVR business
• Ongoing engagement with potential customers
• Stable credit ratings
#2
Enhance profitability
• Implemented cost optimisation initiatives to align the cost base with revenues
• Continued development of Loss Management mitigation techniques across the portfolio
• Detailed review of Group risk appetite
#3
Optimise capital position and enhance ROE
• Offering of $200 million of Tier 2 subordinated notes (issued 3 July 2015) and redemption of $90.3 million of existing $140 million non-compliant Tier 2 notes
• Fully franked ordinary and special dividends declared and paid
• Level of qualifying reinsurance increased to $950 million on 1 January 2016
• Successfully completed $150 million on market share buyback program
#4
Maintain strong risk management discipline
• Focus on maintaining lending standards (i.e. serviceability, investment loans)
• Detailed review of Group risk appetite
• Continued roll out of Risk Culture framework across the organisation
• Enhanced credit and geography risk analysis
#5
Continue to work with regulators, rating agencies and other industry participants
• Public policy recommendations included submissions to Treasury (Financial System Inquiry) and contributions to Insurance Council of Australia’s submissions to government inquiries.
• Continued engagement with regulators
• Ongoing campaigns to promote industry partnership (e.g. MFAA and Genworth’s Broker Day) and industry thought leadership (e.g. Streets Ahead and the launch of the first homebuyer magazine “It’s My Home”)

Genworth Mortgage Insurance Australia22
Directors’ report (continued)
Operating and financial review (continued)Strategy and Risk Opportunities (continued)Risks and OpportunitiesGenworth Australia maintains a disciplined approach to risk management and underwrites to a defined set of underwriting policies that determine which residential mortgage loans it will insure.
Genworth Australia’s risk management strategy forms an integral part of its risk management framework, ensuring the risk management framework remains relevant and aligned to the Board’s approved strategies.
The key business risks are those that impact the successful execution of the strategy. All of the key business risks identified have been mapped to the five strategic priorities of the Strategy and have been grouped by the key risk themes.
#1 #2 #3 #4 #5
Strengthen market leadership position Enhance profitability
Optimise capital position and enhance ROE
Maintain strong risk management discipline
Continue to work with regulators, rating agencies and other industry participants
Key risk Key controls/mitigation Strategic priorities
The value proposition of LMI in the Lender market may be challenged over the medium term
Lender customers may explore different risk transfer product structures
Increased competitive pressure and market disruptions
• Genworth Australia has a project team dedicated to working on strategies and products to broaden its product set and enhance its value proposition
• Continue to work with regulators and the industry to recognise LMI in risk and capital models
• Continue to work with Government lobbying in relation to capital recognition for IRB Lenders
#1
#2
Changing Lender dynamics, new entrant in the mortgage risk transfer market, regulatory changes or other factors may lead to reduced new insurance written
• Genworth Australia is working with regulators and the LMI industry to address actual and expected legislative and regulatory changes
• Genworth Australia maintains a forward looking Government Relations Plan
• Customer plans are in place to monitor the execution of priority areas and key activities of key customers
• Flexible product suite includes standard and non-standard product offerings
#1
#2
#4
Adverse legislative or regulatory changes
Adverse regulation may impact Genworth Australia’s business model, new business volumes and/or profitability
• Monitoring of regulatory environment and changes
• Continue to work with stakeholders to demonstrate the LMI value proposition
• Active regulatory engagement strategy
• Continue to work with Government and regulators
#2
#5

Annual Report 2015 23
Directors’ report (continued)
#1 #2 #3 #4 #5
Strengthen market leadership position Enhance profitability
Optimise capital position and enhance ROE
Maintain strong risk management discipline
Continue to work with regulators, rating agencies and other industry participants
Key risk Key controls/mitigation Strategic priorities
Unexpected macro-economic event results in deterioration in financial and capital performance
A deterioration in macro-economic conditions or outlook could result in a flow on impact to the financial and capital profile of Genworth Australia
• Product, location and segment risk responses
• Continue to enhance reserving and loss forecasting processes
• Risk Appetite Statement, review, monitor and report
• Contingency impact plans designed and monitored through dashboard
• Risk portfolio monitoring
• Macro-economic Contingency Plan
• ICAAP and Stress Testing processes
#1
#2
#3
#4
Capital relief for LMI
LMI may continue to not be explicitly recognised in AIRB lenders’ capital models or there is a reduction or removal of capital relief for ADIs that utilise LMI and are currently able to obtain capital relief
• Genworth Australia seeks to work with Lenders in relation to their capital positions
• Genworth Australia continues to work with regulators and other industry participants to recognise LMI
• Management maintains an active engagement plan with Government and Opposition
#2
#5
Changes in financial strength ratings
Genworth Australia’s financial strength rating may be downgraded
• Genworth Australia has a Contingency Plan to address ratings downgrade
• The listing of Genworth Mortgage Insurance Australia Limited on the ASX provides for additional capital flexibility if required
#1
#3
#4
Reinsurance renewals
Failure to renew reinsurance contracts as and when they fall due for renew
• Capital management strategy including Reinsurance Management Strategy
• Ongoing active management of the reinsurance program
• Ability to leverage external reinsurance experience
#3
#4
Risks related to Supply and Service Contracts with lender customers
– Termination before the expiry of the contractual term
– Change of control of a lender customer
– A ratings downgrade of Genworth Australia occurs
– Material breach or force majeure
• Customer contract renewal and extension process; contractual avenue to address any improvements required
• A Contingency Plan is maintained for the loss or potential loss of a customer
• Contractual safeguards are included in Customer contracts
#2
#3
#4
Change in interest rate cycle and risk of mark to market loss exposure
Lower yield environment continues to pressure both financial and pricing returns mark-to-market adjustments may have an adverse impact on profitability and financial position
• Execution of the Derivatives strategy
• Diversification of investment portfolio within the boundaries set by Risk Appetite Statement Investment Committee governance and oversight Risk Assessment prior to any change to Risk Appetite and related changes to the investment policy
• Education of investors and analysts on type of risk inherent in the portfolio
#2
#3

Genworth Mortgage Insurance Australia24
Directors’ report (continued)
Operating and financial review (continued)Performance review and outlookFinancial resultsThe Group’s key financial measures are summarised in the below table. All measures are presented on both a reported basis and a pro forma basis.
Financial performance measures (A$ million)
FY15 (audited/ reported)
FY14 (unaudited pro forma
FY14 (audited/ reported)
Gross earned premium 549.6 520.7 328.9
Net earned premium 469.9 445.8 282.8
NPAT 228.0 324.1 215.2
Underlying NPAT1 264.7 279.4 180.7
Non-IFRS performance metricsFY15
(reported)FY14
(pro forma)FY14
(reported)
(%)
Loss Ratio2 (%) 24.0% 19.0% 17.8%
Expense Ratio3 (%) 26.2% 26.5% 26.3%
Combined Ratio4 (%) 50.2% 45.5% 44.1%
Insurance Margin5 (%) 58.1% 65.8% 67.0%
Investment Return6 (%) 3.7% 4.0% 4.0%
ROE7 (%) 9.7% 13.8% 14.6%
Underlying ROE8 (%) 11.6% 12.2% 12.4%
1 Underlying NPAT excludes the after-tax impact of unrealised gains/(losses) on the investment portfolio.2 The Loss Ratio is calculated by dividing the net claims incurred by the Net Earned Premium.3 The Expense Ratio is calculated by dividing the sum of the acquisition costs and the other underwriting expenses by the Net Earned Premium.4 The Combined Ratio is the sum of the Loss Ratio and the Expense Ratio.5 The Insurance Margin is calculated by dividing the profit from underwriting and interest income on Technical Funds (including realised gains) by the Net Earned
Premium.6 The Investment Return is calculated as the interest income on Technical Funds plus the interest income on Shareholder Funds (excluding realised and
unrealised gains/ (losses)) divided by the average balance of the opening and closing cash and investments balance for each financial year.7 The ROE is calculated by dividing NPAT by the average of the opening and closing equity balance for each financial year.8 The Underlying ROE is calculated by dividing Underlying NPAT by the average of the opening and closing equity balance for each financial year excluding the
impact of after tax changes to the cash and investments balance on the balance sheet.
Annual Report 2015 25
Directors’ report (continued)
Basis of presentationThe pro forma financial results and measures have been prepared in accordance with recognition and measurement principles of Australian Accounting Standards and have not been subject to an audit or review. Under the pre-IPO group structure, there is no single Australian company with 100% control of Genworth Financial’s Australian Subsidiaries. As part of the IPO, a reorganisation was undertaken to consolidate the Australian Subsidiaries under a single Australian holding company, Genworth Mortgage Insurance Australia Limited. The pro forma financial information and key measures are prepared on the historical financial information and adjusted for the transactions as part of the implementation of a reorganisation plan for the IPO. This is to reflect the post IPO group structure, i.e. as if these IPO transactions had occurred as of 1 January 2013 and 2014 respectively.
The Group was formed on 19 May 2014 when the Company gained 100% control of all Australian Subsidiaries. The consolidated reported financial results represent the results for the period from 19 May 2014 to 31 December 2014.
Certain financial information has been presented on both a pro forma basis and a reported basis to provide additional insights into the underlying trends in the Group’s business. It may provide users with a better understanding of the financial condition and performance of the Group’s business.
Preparation of non-IFRS financial measuresThe financial metrics presented in performance review and outlook, include non-IFRS financial measures, such as Underlying NPAT, Loss Ratio, Expense Ratio, Combined Ratio, ROE and Underlying ROE, which the Group believes provides information that is useful for investors in understanding its performance, facilitates the comparison of results from period to period, and presents widely used industry performance measures.
However, these non-IFRS financial measures do not have a standardised meaning prescribed by Australian Accounting Standards and therefore may not be comparable to similarly titled measures presented by other entities and should not be construed as an alternative to other financial measures determined in accordance with Australian Accounting Standards.
Although the Group believes these non-IFRS measures provide useful information to users in measuring the financial performance and condition of its business, investors are cautioned not to place undue reliance on any of the non-IFRS financial measures presented, which have not been audited or reviewed.
A solid underwriting performance was recorded in FY15 as a result of the following key factors:
(a) Lower sales (Gross Written Premium) and higher resulting revenue (Net Earned Premium):
– GWP for FY15 is 20% lower than FY14, driven by a reduction in above 90% LVR volume written resulting from regulatory enforced policy changes restricting investment and HLVR lending. The result also reflects changes in the customer portfolio during the year;
– Net Earned Premium growth of 5.4% reflecting the seasoning of the recent larger book years including an $18.6 million benefit of an actuarial revision to the premium earnings pattern. This was offset by lower earned premium from current year GWP.
(b) Higher net claims incurred:
– There was an increase in reported delinquencies relative to a year ago, in particular from regional Queensland and Western Australia;
– As part of the actuarial review during the year, an $18 million reserve strengthening to the IBNR component of the outstanding claims reserve to better reflect the risk emergence.
(c) Lower financial income reflecting mark-to-market losses of $52.4 million and relative lower interest income resulting from lower investment yields
(d) The expense ratio for FY15 of 26.2% was slightly more favorable than the 26.5% in FY14 as a result of effective management of cost base
(e) Insurance margin decreased to 58.1% compared with 65.8% for FY14, reflecting higher net claims incurred and unfavorable investment income resulting from mark-to-market losses
(f) Higher financing costs was primarily driven by a $2.4 million one-time premium fee paid on the early redemption of the subordinated note in July 2015.

Genworth Mortgage Insurance Australia26
Directors’ report (continued)
Operating and financial review (continued)Review of financial conditionFinancial Position
Financial position (A$ million) FY15
(audited)FY14
(audited)
Cash and investments 3,925.9 4,159.6
Deferred acquisition costs 145.1 124.5
Total Assets 4,232.0 4,449.3
Trade and other payables 77.7 115.4
Outstanding claims reserve 279.0 230.9
Unearned premium 1,320.6 1,362.6
Interest bearing liabilities 244.4 138.6
Total liabilities 2,013.2 1,948.8
Net assets 2,218.7 2,500.5
The total assets of the Group as at 31 December 2015 were $4,232.0 million compared to $4,449.3 million at 31 December 2014. The movement was mainly driven by $223.3 million decrease in investments as a result of cash outflows from the $150 million on-market share buy-back program and a $52.4 million mark-to-market loss.
The total liabilities of the Group as at 31 December 2015 were $2,013.2 million compared to $1,948.8 million at 31 December 2014. Notable movements contributing to the $64.4 million increase over the period include:
– $37.7 million decrease in other trade and other payables, mainly related to an increase in income tax payments made in FY15;
– $46.1 million increase in outstanding claims reserve driven by a strengthening of the IBNR component to better reflect the risk emergence, as well as reflecting a rise in reported delinquencies compared with the prior year;
– $42.0 million decrease in unearned premium reflecting relatively lower level of new premium written in 2015, offset by seasoning of the prior years in force premium and additional $18.6 million recognised by adopting the actuarial revision to the premium earnings pattern in FY15; and
– $105.8 million increase in interest bearing liabilities, mainly related to issuance of $200.0 million subordinated notes in FY15 and redemption of $90.4 million of the existing $140.0 million subordinated notes.
The Group’s equity decreased by $281.8 million over the period, mainly reflecting the dividends paid in FY15 and capital reduction as a result of the on-market share buy-back program offset by current year earnings.
InvestmentsAs at 31 December 2015, the Group had a $3,925.9 million cash and investments portfolio, invested 96% in Australian denominated cash, cash equivalents and fixed income securities rated A- or higher.
Significant movements in investments since 31 December 2015 include:
– Decreased funds reflecting the capital management initiatives including the $150 million on-market share buy-back program and dividend payments; and
– $52.4 million mark-to-market loss recorded in FY15.
Capital MixThe Group measures its capital mix on a net tangible equity basis, i.e. after deduction of goodwill and intangibles, giving it strong alignment with regulatory and rating agency models. At 31 December 2015, the Group’s capital mix was:
– Ordinary equity (net of goodwill and intangibles) 89%
– Debt 11%

Annual Report 2015 27
Directors’ report (continued)
Capital ManagementThe Group’s capital position was solid at 31 December 2015, reflected in the Group’s regulatory capital solvency level of 1.59 times the PCA and a CET1 ratio of 1.44 times. The regulatory solvency position continues to be above the Board’s targeted solvency range of 1.32 – 1.44 times the PCA.
The table below illustrates the actual capital position as at 31 December 2015 compared with the capital position as at 31 December 2014.
PCA coverage ratio (Level 2)
(A$ in millions), as at 31 Dec 15 31 Dec 14
Common Equity Tier 1 Capital (incl. excess technical provisions) 2,351.2 2,742.1
Tier 2 Capital 249.6 112.0
Regulatory Capital Base 2,600.8 2,854.1
LMI Concentration Risk Charge (LMICRC) 1,344.2 1,498.5
Asset risk charge 76.9 128.0
Insurance risk charge 226.6 202.1
Operational risk charge 27.7 24.1
Aggregation benefit (37.1) (60.6)
Prescribed Capital Amount (PCA) 1,638.3 1,792.1
PCA Coverage ratio (times) 1.59 x 1.59 x
The decrease in CET1 capital in FY15 mainly reflects the $361.4 million dividends paid in FY15, the $150.0 million on-market share buy-back program and a $108.4 million decrease in the excess technical provisions, offset by $228.0 million reported NPAT. Tier 2 capital increased following the issuance of $200.0 million of subordinated notes and the redemption of $90.4 million of the existing $140.0 million notes. In FY14, there was a 20% capital reduction for the $140.0 million notes due to the transitional agreement approved by APRA. The decrease in the PCA in FY15 is mainly due to a decrease in Probable Maximum Loss and increase in deduction of Allowable Reinsurance.
Full year 2016 outlookGMA continues to focus on the strategic needs of our customers, especially during this period of heightened regulatory focus on the Australian mortgage market and lending standards.
The outlook for the Australian residential mortgage market remains strong, supported by sound fundamentals including low unemployment, record-low interest rates and a continued focus by regulators on lending standards. GMA expects house price appreciation to moderate in 2016.
The high LVR market continues to be constrained in 2016 and GMA expects GWP to decline by approximately 20% due to these market conditions.
GMA expects 2016 NEP to decline by approximately 5% and for the full year loss ratio to be between 25.0 and 35.0%. The Board will target an ordinary dividend payout ratio range of 50 to 80%.
The full year outlook is subject to market conditions and unforeseen circumstances or economic events.
DividendsDetails of the dividends paid or determined to be paid by the Group and the dividend policy employed by the Group are set out in the dividends note within the Financial Statements.
Environmental regulationsThe Group’s operations are not subject to any significant environmental regulations under either Commonwealth or State legislation.

Genworth Mortgage Insurance Australia28
Directors’ report (continued)
Operating and financial review (continued)Market capitalisationThe market capitalisation of the Company as at 31 December 2015 was $1.64 billion based on the closing share price of $2.76.
Events subsequent to reporting dateDetail of matters subsequent to the end of the financial year is set out below and in the events subsequent to reporting date note within the financial statements.
• On 29 January 2016, Fitch Ratings (Fitch) affirmed its insurer financial strength rating of the Group’s operating subsidiary, Genworth Financial Mortgage Insurance Pty Limited assigning an ‘A+’ rating
• On 5 February 2016, the Directors declared a 100% franked final dividend of 14 cents per share totalling $83,400,000 and a 100% franked special dividend of 5.3 cents per share totalling $31,500,000.
Likely developmentsFurther information about likely developments in the operations of the Group and the expected results of those operations in future financial years have not been included in this report because the directors believe it would be likely to result in unreasonable prejudice to the Group.
Company secretaryMr Jonathan (Jon) Downes was appointed as Company Secretary and General Counsel in September 2013. Mr Downes previously held a similar position with another global insurer with responsibility for enterprise risk management and compliance and prior to that worked as General Counsel for another insurer. Prior to that he worked as a solicitor with major legal practices in both Sydney and London.
Directors’ meetingsThe number of directors’ meetings (including meetings of committees of directors) and number of meetings attended by each of the directors of the Company during the financial year are:
Director Board meetingsAudit committee
meetingsRisk committee
meetings
Capital & investment committee meetings
Remuneration & nomination
committee meetings
A B A B A B A B A B
Ellen Comerford (ceased to be a Director on 9 October 2015) 7 9 - - - - - - - -
Anthony Gill 11 11 7 7 7 7 7 7 7 7
Richard Grellman 11 11 - - - - - - - -
Ian MacDonald 11 11 7 7 7 7 7 7 7 7
Samuel Marsico 10 11 - - 7 7 - - - -
Leon Roday 10 11 - - - - - - 7 7
Stuart Take 11 11 - - - - - - - -
Gayle Tollifson 11 11 7 7 7 7 7 7 - -
Jerome Upton 11 11 7 7 - - 7 7 - -
A - Number of meetings attended B - Number of meetings held during the time the director held office during the year
Note: All directors are normally invited to attend all Committee meetings. This register only records attendance of Committee members.

Annual Report 2015 29
Directors’ report (continued)
Indemnification and insurance of officers and directorsDuring the financial year, a controlled entity paid premiums to insure directors and certain officers of the Company for the year ended 31 December 2015 and, since the end of the financial year, the controlled entity has paid or agreed to pay premiums in respect of such insurance contracts for the year ending 31 December 2016. Such insurance contracts insure against liability (subject to certain exclusions) persons who are or have been directors or officers of the Group.
The directors have not included details of the nature of the liabilities covered or the amount of the premium paid as such disclosure is prohibited under the terms of the contracts.
The Group has not indemnified or made a relevant agreement for indemnifying against a liability any person who is or has been an auditor of the Group.
Directors’ interests and benefitsOther than the aggregate remuneration paid or receivable by directors included in the financial report, and remuneration as an executive paid or payable by the related body corporate, no director has received or become entitled to receive any benefit because of a contract made by the Group or a related body corporate with a director or with a firm of which a director is a member or with an entity in which the director has a substantial interest.
Rounding offThe Group is of a kind referred to in ASIC Class Order 98/100 dated 10 July 1998 and, in accordance with that Class Order, amounts in the consolidated financial statements and Directors’ Report have been rounded off to the nearest thousand dollars, unless otherwise stated.
Non-audit servicesThe directors are satisfied that the provision of non-audit services during the year by the auditor $35,000, is compatible with the general standard of independence for auditors imposed by the Corporations Act 2001 and in accordance with Genworth Australia’s Auditor Independence Policy, noting that:
• all non-audit services have been reviewed and approved to ensure that they do not impact the integrity and objectivity of the auditor; and
• none of the services undermine the general principles relating to auditor independence as set out in the Code of Conduct APES 110 Code of Ethics for Professional Accountants issued by the Accounting Professional & Ethical Standards Board, including reviewing or auditing the auditor’s own work, acting in a management or decision making capacity for the Group, acting as an advocate for the Group or jointly sharing risks and rewards.
Details of the amounts paid to the auditor of the Group, KPMG, and its network firms, for audit and non-audit services provided during the year are set out below:
2015$
Audit and review of financial statements 688,655
Regulatory audit services 56,810
Non-assurance services 35,000
Total paid/payable to KPMG 780,465

Genworth Mortgage Insurance Australia30
This page has been left blank intentionally

31Annual Report 2015
Remuneration report
Dear Shareholder,
I am pleased to present our annual remuneration report for the year ended 31 December 2015. In this, our second report since listing, we explain the Company’s approach to remuneration generally, highlight the changes to programs that were made in 2015 or planned for 2016 and provide the details of remuneration for Key Management Personnel (KMP). In doing so, we hope to convey the value we place on closely aligning remuneration programs and outcomes to business results and the experience of our shareholders.
2015 was a year of solid business performance, where we met or exceeded our financial objectives and made good progress on our strategic objectives. It was a year in which we implemented a number of enhancements to our remuneration programs including the introduction of a performance based LTI plan and a one-year deferral of a portion of STI awards for KMP. It was also a year in which we updated our LTI plan for 2016 to include relative total shareholder return (TSR) as a performance metric. You will find the details of all of these highlights in the pages that follow.
There were also a number of changes within our KMP during 2015, resulting from moves within the company. I thought it would be helpful to summarise the changes ahead of the report details:
Ellen Comerford retired from her role as CEO and Managing Director and moved to a non-KMP advisory role in October. At the same time, Georgette Nicholas, then CFO, was appointed Acting CEO and Luke Oxenham was promoted internally to the role of Acting CFO and joined the KMP group.
Conor O’Dowd was appointed Chief Actuary within the Company, stepping out of the Chief Risk Officer role and ceasing to be a KMP in October. At the same time, Andrew Cormack commenced as Chief Risk Officer, joining the Company from Genworth Financial’s Mortgage Insurance business in Europe.
Whilst outside of this reporting period, it is relevant to note that following a global search, Ms Nicholas was appointed CEO and Mr Oxenham was appointed as CFO in February 2016. As a result of her appointment, Ms Nicholas is now employed under a local employment agreement and, as such, her US expatriate benefits will cease.
As we move into our third year as an ASX listed company, we are pleased with the progress we have made in the design and delivery of remuneration programs that incentivise and reward performance that delivers on commitments to our customers and contributes to the creation of sustainable shareholder value. I hope that you agree and welcome your questions or comments.
Ian MacDonald
Chairman – Remuneration & Nominations Committee

Genworth Mortgage Insurance Australia32
Remuneration report
Contents(1) Executive summary (unaudited) 33
(2) Remuneration governance, policy and programs (audited) 34
(3) Relationship between company performance and remuneration (audited) 43
(4) Remuneration outcomes for executive KMP (audited) 45
(5) Contractual arrangements for Executive KMP (audited) 46
(6) Non-executive director remuneration (audited) 47
(7) KMP remuneration tables (audited) 48
(8) Relevant Interests of Directors (unaudited) 55

33Annual Report 2015
Remuneration report
1. Executive summaryThis report provides shareholders with an overview of GMA group’s remuneration governance, strategy, programs and outcomes for Key Management Personnel (KMP) for the year ended 31 December 2015.
The table below provides a concise summary of the remuneration received by Executive KMP in 2015. This table is for general information, and is supplementary to the statutory requirements contained in section 7. It is not prepared in accordance with accounting standards, as it includes both contracted and actual remuneration received over the calendar year; and excludes long service leave accruals, fringe benefit tax attributed to insurances/car parking and other non-monetary benefits.
Table 1a – 2015 Remuneration summary table as at 31 December 2015
Name and position – Executive KMP Year
Fixed remuneration
At-risk/performance remuneration
Short-term incentive (STI) Long-term incentive (LTI)
Contract TFR
(31.12.15)1Actual TFR received2 STI target
Actual STI awarded3 LTI target4 LTI vested5
Georgette Nicholas 2015 $467,844 $465,186 $300,140 $400,000 $207,792 $73,321
Acting Chief Executive Officer (CEO)6 2014 $374,195 $374,195 $187,098 $282,517 $207,792 $71,528
Luke Oxenham 2015 $383,250 $83,407 $27,292 $42,496 – –
Acting Chief Financial Officer (CFO)7 2014 – – – – – –
Andrew Cormack 2015 $475,000 $125,555 $42,631 $52,895 – –
Chief Risk Officer (CRO)8 2014 – – – – – –
Bridget Sakr 2015 $435,000 $433,595 $217,500 $230,000 $212,500 $157,235
Chief Commercial Officer (CCO) 2014 $425,000 $418,179 $212,500 $240,000 $212,500 $170,820
Tobin Fonseca 2015 $405,000 $401,641 $202,500 $230,000 $195,000 $101,488
Chief Operating Officer (COO) 2014 $390,000 $369,841 $195,000 $280,000 $195,000 $128,266
Former KMP
Ellen Comerford 2015 $767,000 $590,938 $506,923 $506,923 $797,500 $218,837
Former CEO & Managing Director9 2014 $725,000 $686,830 $616,250 $885,000 $797,500 $373,987
Conor O'Dowd 2015 $383,250 $337,254 $104,229 $81,844 - $28,104
Former Chief Risk Officer10 2014 $450,000 $447,534 $135,000 $60,000 $225,000 $25,429
1 Contract total fixed remuneration shows the fixed remuneration an individual is entitled to receive for a full year of service under their employment contract as at the end of the reporting period.
2 Actual TFR received shows the fixed remuneration earned throughout 2015 as a KMP, and is different to contract TFR due to increases provided part-way through the reporting period.
3 Actual STI awarded reflects 2015 STI awards (pro rated to reflect time spent as a KMP and including any amounts delivered as deferred STI, see section 4 for more details).
4 The 2015 LTI Target reflects the dollar value of the LTI grant awarded for the performance period starting January 1 2015. The 2014 values (which were forward looking 2015 LTI values based on KMP contracts at the time of the 2014 report) have been included for continuity. In addition, the 2014 disclosure of Ms Nicholas’ LTI target (as $187,098) was incorrect due to a full period average exchange rate being used instead of the exchange rate prior to the start of the performance period (31 December 2014).
5 The dollar value of legacy Genworth Financial equity that vested during the reporting period, (calculated using the share price and exchange rate at date of vesting). No GMA LTI plans have vested as at the end of the reporting period.
6 As CFO and Acting CEO, Ms Nicholas was an expatriate of Genworth Financial, and details of her remuneration arrangements are found in section 2.9. As an expatriate paid in USD, remuneration values are presented in AUD using an average exchange rate for the reporting period. A significant proportion of the increase in her remuneration when compared with 2014 is due to exchange rate fluctuation (was AUD/USD1/0.9086 in 2014 compared to 1/0.7524 in 2015). Ms Nicholas was CFO from 1 January until her appointment as Acting CEO effective 12 October. The Acting CEO received a ‘higher duties’ allowance of $159,492 (annualised). Her 2015 STI target was pro rated to reflect the time spent in each respective role and includes the higher duties allowance.
7 Mr Oxenham was appointed Acting CFO effective 12 October. The Acting CFO received a ‘higher duties’ allowance of $50,000 (annualised). His 2015 STI target was pro rated to reflect the time spent as Acting CFO and includes his higher duties allowance.
8 Mr Cormack was appointed CRO effective 1 October. His 2015 STI target was pro rated to reflect hire date and GMA group service.9 Ms Comerford retired from her role as CEO and Board member (including as a KMP) effective 9 October 2015. The actual TFR received figure reflects TFR
received as a KMP. The full-year figure is $760,000.10 Mr O’Dowd was appointed Chief Actuary, stepping down from the Chief Risk Officer role and ceasing to be a KMP effective 1 October. The actual TFR received
figure reflects TFR received as a KMP. The full-year figure is $434,929. His 2015 STI target was pro rated to reflect time spent throughout the year as a KMP. The Chief Actuary role is not eligible to participate in the LTI plan and does not have an LTI Target.

Genworth Mortgage Insurance Australia34
Remuneration report (continued)
1. Executive summary (continued)Throughout this report, KMP refers to those responsible for planning, directing and controlling the activities of the Company, made up of non-executive directors, the Executive Director and nominated executives. Please refer to section 6 for details relating to non-executive directors.
Table 1b Executive KMP in 2015
Name Position Term as KMP
Executive KMP
Georgette Nicholas Acting CEO1 Full year
Luke Oxenham Acting CFO 12 Oct – 31 Dec
Andrew Cormack CRO 1 Oct – 31 Dec
Bridget Sakr CCO Full year
Tobin Fonseca COO Full year
Former KMP
Ellen Comerford CEO & Managing Director 1 Jan – 9 Oct
Conor O'Dowd CRO 1 Jan – 1 Oct
2. Remuneration governance, policy and programs2.1 Governance overviewThe Remuneration and Nominations Committee (the Committee) was established to assist the Board in fulfilling its responsibilities to shareholders and regulators in relation to remuneration, succession planning, board effectiveness and renewal, and diversity. The Board’s final approval is required for any decision relating to the Committee’s responsibilities. The Committee liaises as required with the Audit and Risk Committees.
2.2 Use of independent remuneration advisorsThe Board and the Committee received advice from external advisers Guerdon Associates in 2015. Services included the provision of market data and market practices. All advice provided was accompanied with confirmation from Guerdon Associates that the advice was free from the undue influence of the KMP’s to whom it may pertain. No remuneration recommendations as defined under the Corporations Act were received in relation to KMP throughout this period.
2.3 Remuneration policy and strategyThe Company’s remuneration policy details the governance, structure and overall strategy through which the Company compensates employees. The Company’s remuneration strategy is to provide market competitive remuneration programs that help attract, retain and motivate highly competent employees who are dedicated to achieving the Company’s objectives in a manner that is consistent with the long-term interests of the Company and its shareholders. This strategy is reflected in specific remuneration programs which, subject to Board (and where applicable, shareholder) approval, deliver remuneration which aligns performance, outcomes, timeframes, shareholder, company and employee interests over the long-term.
1 Ms Nicholas was CFO from 1 January until her appointment as Acting CEO effective 12 October.

35Annual Report 2015
Remuneration report (continued)
2.4 Executive KMP remuneration programsThe Company’s Executive KMP remuneration programs are designed to align executive and shareholder interests by:
• using appropriate delivery vehicles (e.g. cash, equity and non-monetary benefits) and pay mix;
• measuring performance and delivering resulting remuneration over an appropriate time frame;
• using appropriate measures of competitiveness (e.g. median of appropriate comparator group); and
• operating within the Company’s risk management framework and relevant regulatory requirements (in particular, APRA Prudential Standard CPS 510).
The Company’s Executive KMP remuneration programs consist of a fixed remuneration (TFR) component, a short-term incentive (STI) component and a long-term incentive (LTI) component. Executive KMP participated in Genworth Financial’s global remuneration programs prior to listing in May 2014. Summary table 2.4a presents the components, characteristics and rationale of the Company’s current remuneration programs.
Table 2.4a Remuneration Framework
RemunerationComponents & performance measures
Delivery vehicle & time frame
Rationale & link to strategy Changes for 2016
Total Fixed Remuneration (TFR) Section 2.5
Notional base salary, superannuation contributions and notional value of car parking benefit. Performance per individual goals and job responsibilities.
TFR paid monthly as cash.
Attract and retain high performing employees with market competitive fixed remuneration.
No change in approach.
Short-Term Incentive (STI) Section 2.6
Individual STI targets expressed as a % of TFR. Awards based on achievement of company goals and individual performance.
2/3rds of each individual award delivered as cash in the first quarter after performance period; 1/3rd converted to share rights and deferred for one year.
Provide for pay at-risk as an incentive to the Senior Leadership Team for achievement of financial results and other strategic objectives over an appropriate time frame. Deferral, Board review and approval to ensure appropriate governance.
No change in approach.
Long-Term Incentive (LTI) Section 2.7
Individual LTI targets expressed as a % of TFR. Vesting based on three-year performance against two metrics (in 2015 Return on Equity (ROE) and Earnings Per Share growth (EPS).
Vested share rights convert to shares, providing linkage to shareholder experience. Three-year performance period and additional one-year deferral period mitigate focus on short-term at the expense of medium to long-term.
Provide for pay at-risk as an incentive to the Senior Leadership Team for achievement of financial results and shareholder value creation over a longer time frame. Deferral, Board review and approval to ensure appropriate governance.
Introduction of a relative LTI metric Total Shareholder Return (TSR), replacing the Earnings Per Share growth (EPS) metric used in 2015.
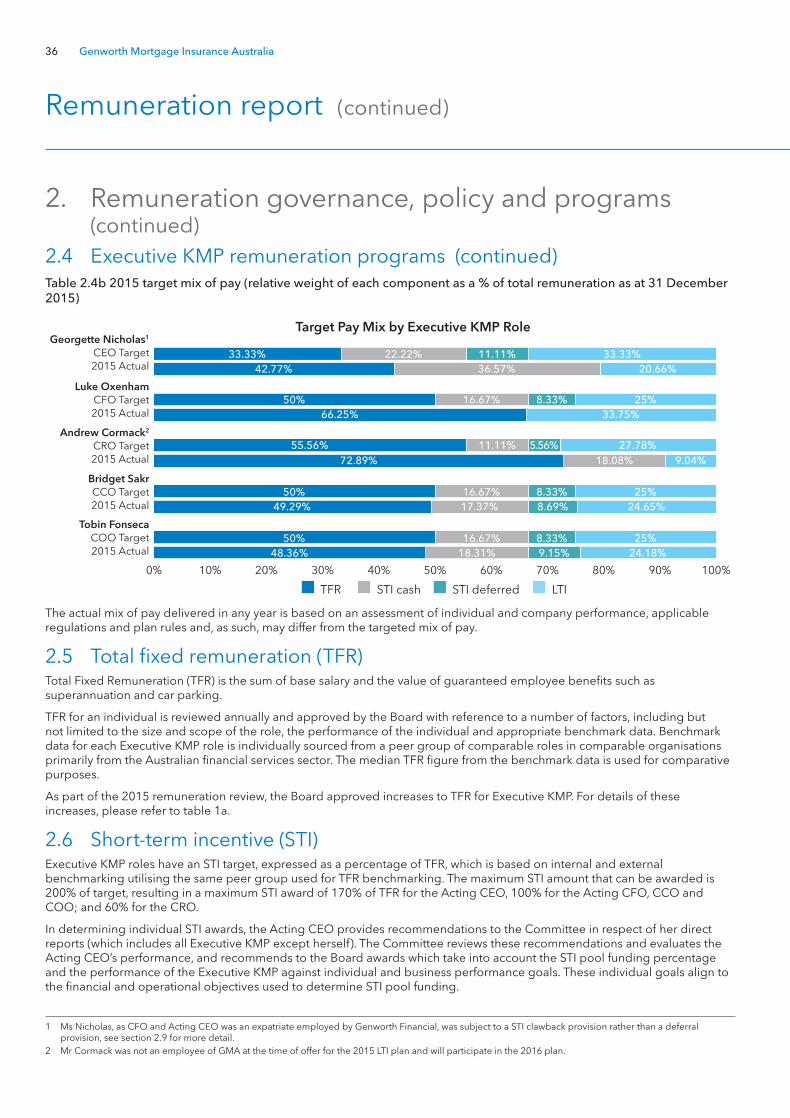
Genworth Mortgage Insurance Australia36
Remuneration report (continued)
2. Remuneration governance, policy and programs (continued)
2.4 Executive KMP remuneration programs (continued)Table 2.4b 2015 target mix of pay (relative weight of each component as a % of total remuneration as at 31 December 2015)
0% 10% 20% 30% 40% 50% 60% 70% 80% 90% 100%
STI cashTFR STI deferred LTI
Target Pay Mix by Executive KMP Role
Tobin FonsecaCOO Target2015 Actual
Bridget SakrCCO Target2015 Actual
Andrew Cormack2
CRO Target2015 Actual
Luke OxenhamCFO Target2015 Actual
Georgette Nicholas1
CEO Target2015 Actual
48.36% 18.31% 9.15% 24.18%50% 16.67% 8.33% 25%
49.29% 17.37% 8.69% 24.65%50% 16.67% 8.33% 25%
72.89% 18.08% 9.04%55.56% 11.11% 5.56% 27.78%
66.25% 33.75%50% 16.67% 8.33% 25%
42.77% 36.57% 20.66%33.33% 22.22% 11.11% 33.33%
The actual mix of pay delivered in any year is based on an assessment of individual and company performance, applicable regulations and plan rules and, as such, may differ from the targeted mix of pay.
2.5 Total fixed remuneration (TFR)Total Fixed Remuneration (TFR) is the sum of base salary and the value of guaranteed employee benefits such as superannuation and car parking.
TFR for an individual is reviewed annually and approved by the Board with reference to a number of factors, including but not limited to the size and scope of the role, the performance of the individual and appropriate benchmark data. Benchmark data for each Executive KMP role is individually sourced from a peer group of comparable roles in comparable organisations primarily from the Australian financial services sector. The median TFR figure from the benchmark data is used for comparative purposes.
As part of the 2015 remuneration review, the Board approved increases to TFR for Executive KMP. For details of these increases, please refer to table 1a.
2.6 Short-term incentive (STI)Executive KMP roles have an STI target, expressed as a percentage of TFR, which is based on internal and external benchmarking utilising the same peer group used for TFR benchmarking. The maximum STI amount that can be awarded is 200% of target, resulting in a maximum STI award of 170% of TFR for the Acting CEO, 100% for the Acting CFO, CCO and COO; and 60% for the CRO.
In determining individual STI awards, the Acting CEO provides recommendations to the Committee in respect of her direct reports (which includes all Executive KMP except herself). The Committee reviews these recommendations and evaluates the Acting CEO’s performance, and recommends to the Board awards which take into account the STI pool funding percentage and the performance of the Executive KMP against individual and business performance goals. These individual goals align to the financial and operational objectives used to determine STI pool funding.
1 Ms Nicholas, as CFO and Acting CEO was an expatriate employed by Genworth Financial, was subject to a STI clawback provision rather than a deferral provision, see section 2.9 for more detail.
2 Mr Cormack was not an employee of GMA at the time of offer for the 2015 LTI plan and will participate in the 2016 plan.

37Annual Report 2015
Remuneration report (continued)
Table 2.6a STI 2015 key characteristics
STI 2015 features Detail
Purpose of STI plan Motivate and retain employees by providing STI outcomes that balance individual and Company performance, reflect the ability of the role to influence Company performance, and operate within the Company's risk management framework.
Executive KMP Target %
(of TFR)
2015 Target $ Maximum %
(of TFR)
Maximum $
STI % & STI $ by role Acting CEO1:
Acting CFO2:
CRO3:
CCO:
COO:
85%
50%
30%
50%
50%
$300,140
$27,292
$42,631
$217,500
$202,500
170%
100%
60%
100%
100%
$600,279
$54,584
$85,261
$435,000
$405,000
Performance objectives Financial Objectives
Underlying Net Profit After Tax (NPAT) (35%)
Underlying Return on Equity (ROE) (35%)
Strategic Objectives
Execute key strategic initiatives (30%)
Aggregate objective weighting
Financial Objectives
70%
Strategic Objectives
30%
Performance period 1 January 2015 - 31 December 2015.
Performance assessment In Q1 2016 Company performance against each individual objective was evaluated to determine the STI pool funding percentage.
Award determination Combination of STI pool funding and individual performance.
Awards determined via Board and Committee review, recommendation and approval process. The Board and Committee have authority and discretion to adjust STI funding and individual awards (including to $0 if appropriate).
Payment date Q1 2016.
Payment method STI - 2/3 of the award paid in cash (inclusive of superannuation).
Deferred STI - 1/3 of the dollar value of award converted to a grant of share rights (subject to vesting conditions).
Deferral period Deferred STI component deferred for 12 months from end of the relevant performance period.
Deferred STI vesting conditions
Continuous active employment for 12 months from grant date.
Board and Committee satisfaction that adverse outcomes have not arisen that were not apparent when performance was assessed, and satisfaction that there was not excessive risk taking in achievement of results.
Share rights grant calculation
The number of share rights is determined by dividing the deferred STI dollar value by a 10-day Volume Weighted Average Price as at 31 December 2015. The Committee believes using a VWAP (instead of the share price at a single point in time or a discounted fair value methodology) reduces the impact daily volatility may have on the number granted and provides greater transparency around the value of share rights granted.
1 Ms Nicholas was CFO from 1 January until her appointment as Acting CEO effective 12 October. Her 2015 STI target was pro rated to reflect the time spent in each respective role and is inclusive of the higher duties allowance ($159,492 annualised). Her STI target and maximum percentage figures are presented as per plan rules and do not reflect pro rata treatment for the 2015 reporting period. Her effective STI target for 2015 was 64%.
2 Mr Oxenham was appointed Acting CFO effective 12 October. His 2015 STI target was pro rated to reflect the time spent as Acting CFO and is inclusive of the higher duties allowance ($50,000 annualised). His STI target and maximum percentage figures are presented as per plan rules and do not reflect pro rata treatment for the 2015 reporting period. His effective STI target for 2015 was 33%.
3 Mr Cormack was appointed CRO effective 1 October. His 2015 STI target was pro rated to reflect hire date. His STI target and maximum percentage figures are presented as per plan rules and do not reflect pro rata treatment for the 2015 reporting period. His effective STI target for 2015 was 34%.

Genworth Mortgage Insurance Australia38
Remuneration report (continued)
STI 2015 features Detail
Treatment of dividends calculation
Dividends, or the value of any dividends, are not received on unvested share rights. Notional dividend equivalents accrue during the deferral period and are delivered through an adjustment to the number of vested share rights at the end of the deferral period. This is calculated by taking the value of dividends distributed during the deferral period and dividing by a 10-day VWAP as at the vesting date, in whole share rights.
Treatment upon vesting Vested share rights entitle the holder to ordinary shares in the Company for nil consideration. The Company retains discretion to satisfy vested share rights delivered through the STI plan via the issuance of new shares or via an on-market purchase.
Treatment of terminating Executive KMP
Eligibility for an STI award is contingent on active, continuous employment throughout the performance period. In the event of resignation or termination, the Executive KMP are ineligible for an STI award, and unvested share rights lapse.
In the event of termination with ‘Good Leaver’ status (retirement, redundancy, death or permanent disability or as determined by the Board) – a pro rated portion of STI may be awarded at the Board and Committee's discretion. Treatment of unvested STI share rights is at Board and Committee’s discretion and may be pro rated, remain subject to the original vesting schedule, be subject to accelerated vesting, or converted to cash.
Change of control Board has discretion.
Table 2.6b 2016 STI performance objectives
STI performance objective & weighting
Rationale
Underlying NPAT (35%) Underlying NPAT will be used as it excludes the impact of volatile unrealised gains and losses on the investment portfolio (which are generally outside of the control of management).
Underlying ROE (35%) For similar reasons as described above in relation to underlying NPAT, ROE will also be measured via Underlying ROE.
Strategic Objectives (30%) 2016 strategic objectives revolve around enhancing our value proposition optimising our business processes.
2. Remuneration governance, policy and programs (continued)
2.6 Short-term incentive (STI) (continued)Table 2.6a STI 2015 key characteristics (continued)

39Annual Report 2015
Remuneration report (continued)
2.7 Long-term incentive (LTI)Prior to listing in May 2014, Executive KMP participated in the Genworth Financial LTI program. Grants to Australian participants were delivered as Restricted Share Units in Genworth Financial, 25% of which vest on each of the 1st, 2nd, 3rd and 4th anniversaries of the grant. These grants were part of Genworth Financial’s global remuneration programs and reinforced the link between executive remuneration outcomes and Genworth Financial shareholder outcomes over a longer timeframe. Genworth Financial LTI grants will continue to vest until 2018 and are detailed in the statutory tables.
Beginning in 2015, Executive KMP roles have had an LTI target, expressed as a percentage of TFR, which is based on internal and external benchmarking utilising the same peer group used for TFR and STI benchmarking. LTI dollar targets are calculated by multiplying the individual’s LTI percentage by their TFR at the start of the relevant performance period (which was 1 January 2015 for the 2015 LTI plan). LTI is provided via an annual grant of share rights which are subject to vesting conditions. Vesting conditions for the 2015 plan include performance based vesting scales in respect of company performance against Underlying Return on Equity (ROE) and compound annual growth in earnings per share (EPS).
Table 2.7a LTI 2015 key characteristics
LTI 2015 features Detail
Purpose of LTI plan Motivate and retain employees by providing LTI outcomes that align with longer term Company performance, reflect the ability of the role to influence Company performance and operate within the Company's risk management framework.
LTI % and grant value by executive KMP role
Executive KMP
Former CEO1:
CFO2:
CRO3:
CCO:
COO:
Target % (of TFR)
110%
50%
50%
50%
50%
Grant Value $
$797,500
$207,792
-
$212,500
$195,000
Performance metrics Underlying Return on Equity:
50% of the LTI grant. Calculated as the average of 3-year underlying net profit after tax (excluding unrealised gains or losses from investments) divided by the 3-year average equity (excluding mark to market value of investments).
Earnings Per Share growth (EPS):
50% of the LTI grant. Calculated as the 3-year compound average annual growth of earnings per share comprising basic earnings per share (after tax and excluding the impact of any share issuance or buy back). The Board may adjust EPS for items of a capital nature that are not reflective of management performance.
Vesting Summary Threshold performance level – 50% of the share rights will vest
Proportionate vesting occurs between threshold and maximum performance levels
Maximum performance level – 100% of the share rights will vest
Each performance metric is measured and vests (as applicable) independently of the other.
Performance period 1 January 2015 - 31 December 2017.
Performance assessment Performance to be assessed in Q1 2018. There is no re-testing of grants.
Deferral period 12 months from the end of the relevant performance period.
1 Ms Comerford was CEO at the time of the 2015 LTI grant. Ms Comerford will forfeit all of the share rights under the LTI 2015 grant upon cessation of her employment on 31 May, 2016.
2 Ms Nicholas was CFO at the time of the 2015 LTI grant. Ms Nicholas became Acting CEO effective October 12 and did not receive a grant of equity upon appointment to the Acting CEO role.
3 Mr O’Dowd did not participate in the 2015 LTI plan, instead receiving a grant of equity under the 2015 Equity Plan which is described in section 2.10. Mr Cormack was not an employee of GMA at the time of offer for the 2015 LTI plan and will participate in the 2016 plan.

Genworth Mortgage Insurance Australia40
Remuneration report (continued)
LTI 2015 features Detail
Vesting period/date 4 years in total from the start of relevant performance period (3 year performance period with an additional 1 year deferral period).
Award determination Performance period and final vesting percentages determined via Board and Committee review, recommendation and approval process.
The Board and the Committee have authority and discretion to adjust LTI vesting % and individual awards (including to 0% of grant if appropriate).
Payment method Grant of share rights. Vested share rights entitle the holder to ordinary shares in the Company for nil consideration. The Company retains discretion to satisfy vested share rights delivered through the LTI plan via the issuance of new shares or via an on-market purchase.
Vesting Conditions Continuous active employment for 4 years from grant date.
Board and Committee satisfaction that adverse outcomes have not arisen that were not apparent when performance was assessed, and satisfaction that there was not excessive risk taking in achievement of results.
Share rights grant calculation
The number of share rights is determined by dividing the grant value by a 10-day VWAP following the release of full-year results for 2015. The Committee believes using a VWAP (instead of the share price at a single point in time or a discounted fair value methodology) reduces the impact daily volatility may have on the number granted and provides greater transparency around the value of share rights granted.
Treatment of dividends Dividends, or the value of any dividends, are not received on unvested share rights. Notional dividend equivalents accrue during the vesting period and are delivered through an adjustment to the number of vested share rights at the end of the vesting period. This is calculated by taking the value of dividends distributed during the vesting period, applying the final vesting percentage and dividing by a 10-day VWAP as at the vesting date, in whole share rights.
Treatment of terminating Executive KMPs
Eligibility for an LTI grant or award is contingent on active, continuous employment throughout the vesting period. In the event of resignation/termination, unvested share rights lapse except as provided at the discretion of the Board for a 'Good Leaver' (see table 2.6a for details: 'treatment of terminating Executive KMPs’).
Change of control Board has discretion.
Changes for 2016:
Performance under the 2016 LTI plan will be measured using ROE and a relative Total Shareholder Return (TSR) metric (both weighted 50% of the total grant). Relative TSR has been introduced given the group’s strategic priorities and TSR’s ability to drive behaviours over the long-term that align shareholder return and executive reward.
The ASX top 200 (excluding resources companies) has been chosen as the comparator group for the 2016 LTI plan because out-performance against this group represents an important part of our value proposition to shareholders.
2. Remuneration governance, policy and programs (continued)
2.7 Long-term incentive (LTI) (continued)Table 2.7a LTI 2015 key characteristics (continued)

41Annual Report 2015
Remuneration report (continued)
Table 2.7b LTI 2016 key characteristics
LTI 2016 features Detail
Performance metrics Underlying Return on Equity (ROE):
50% of the 2016 LTI grant. Calculated as the average of 3-year underlying net profit after tax (excluding unrealised gains or losses from investments) divided by the 3-year average equity (excluding mark to market value of investments).
Relative Total Shareholder Return (TSR):
50% of the 2016 LTI grant. Calculated as the total return to shareholders (share price movement including value of dividends) over the performance period, expressed as a percentage of the starting share price. Dividends are reinvested on the ex-dividend date closing price and franking credits are excluded.
Vesting scales summary Vesting % 0% 50% 60% 70% 80% 90% 100%
Underlying ROE <9.5% 9.5% 10.2% 10.9% 11.6% 12.3% 13.0%
Relative TSR <50th 50th 55th 60th 65th 70th 75th
ROE vesting scales
16%15%14%13%12%11%10%9%8%7%6%0.00.10.20.30.40.50.60.70.80.91.01.1
Prop
ortio
n of
RO
E co
mpo
nent
elig
ible
to v
est
LTI vesting %
3-year underlying ROE %
TSR vesting scales
Prop
ortio
n of
TSR
com
pone
ntel
igib
le to
ves
t
LTI vesting %
100%95%90%85%80%75%70%65%60%55%50%45%40%35%30%25%20%15%0
10%20%30%40%50%60%70%80%90%
100%110%
TSR performance ranking relative to comparator group
Relative TSR comparator group
Top 200 ASX (excluding resources companies).

Genworth Mortgage Insurance Australia42
Remuneration report (continued)
2.8 Share ownership requirement for Executive KMPTo strengthen the alignment between Executive KMP and shareholders, Executive KMP are required to accumulate and maintain a minimum value of shares in the Company. The CEO is required to hold two times, and other Executive KMP one times their TFR (the measurement date for TFR is as at listing or appointment date, as applicable). The value of shares is calculated by using the greater of the preceding 12 month average price or retail price at listing.
Share ownership requirements must be met within five years of listing (or appointment, as applicable), and will be tested each time share rights vest. Until the ownership requirements are met, 25% of shares vested via equity plans (deferred STI component and LTI) must be retained.
2.9 Changes in Key Management PersonnelMs Comerford retired from her role as CEO and Board member (including as a KMP) effective 9 October 2015. Ms Nicholas and Mr Oxenham were appointed Acting CEO and Acting CFO respectively whilst the search process for a candidate to succeed Ms Comerford was undertaken. Details of the Acting CEO’s and Acting CFO’s remuneration arrangements are provided below.
As disclosed at the time of Ms Comerford’s retirement, she will remain with the company in an advisory role until 31 May 2016.
As reported in 2014, as CFO and Acting CEO, Ms Nicholas was an expatriate of Genworth Financial, and her remuneration arrangements, while aligned with the Company’s remuneration strategy, fell under Genworth Financial’s expatriate programs. As a result, components of her remuneration differed in some respects from those of other Executive KMP. These included:
• a base salary and other remuneration paid in USD, which has been converted to AUD for the purposes of this report using the 2015 average exchange rate (AUD/USD 1/0.7524). As a result of the 2015 remuneration review, her base salary increased from $340,000 to $352,000 USD;
• while STI and LTI performance objectives are the same as other Executive KMP, participation is calculated using base salary, not TFR, and any STI awarded is subject to a clawback provision rather than a deferral provision;
• as Acting CEO, Ms Nicholas received an Acting CEO Allowance of $159,492 (annualised);
• her STI target percentage was increased to 85%; and
• her 2015 STI target was calculated by pro rating her STI percentage and base salary plus Acting Allowance in each respective role.
As Acting CFO, Mr Oxenham received an Acting CFO Allowance of $50,000 (annualised). His Acting CFO STI target percentage was increased to 50% and his 2015 STI target was calculated by pro rating his STI percentages and base salary plus Acting Allowance based on the time spent throughout the reporting period as Acting CFO.
Mr O’Dowd was appointed Chief Actuary, stepping out of the Chief Risk Officer role and ceasing to be a KMP effective 1 October 2015. Mr O’Dowd received a grant of $100,000 (28,847 share rights) under the 2015 Equity plan (described below) in lieu of a grant under the 2015 LTI Plan since, prior to the grant date, it was announced that he would be moving to a role which is ineligible to participate in the LTI Plan.
Mr Cormack was appointed CRO on 1 October 2015. Prior to this role Mr Cormack was CRO for Genworth Financial’s Mortgage Insurance business in Europe, where he participated in their remuneration programs. In 2015, Mr Cormack was eligible for an STI award based on a full year of service, with his STI target pro rated to reflect the time spent in the European and Australian businesses. The pro rata portion of Mr Cormack’s STI award relating to his service in Europe has been paid by Genworth Financial. Mr Cormack’s continuous service has been recognised with reference to Genworth Financial equity plans and an incentive retention payment plan entered into between Mr Cormack and Genworth Financial in 2014. For completeness, these figures (inclusive of pro rating based on service as a KMP for the reporting period) are detailed in the statutory tables. However, all entitlements under both equity and incentive retention plans have been paid for by Genworth Financial.
Changes in 2016:
In February 2016, Ms Nicholas was appointed CEO and Mr Oxenham was appointed as CFO. As disclosed at the time of the announcement of her appointment, Ms Nicholas is now employed under a local employment agreement and her US expatriate benefits will cease in March 2016.
2. Remuneration governance, policy and programs (continued)

43Annual Report 2015
Remuneration report (continued)
2.10 Other Equity PlansGenworth administers an equity incentive plan for senior roles who are not eligible to participate in the LTI Plan, known as the 2015 Equity plan. Grants under the plan provide exposure to shareholder experience for senior employees and act as a retention tool. Grant values are converted to share rights using a 10-day VWAP following the release of full-year results for 2015. The share rights are subject to service based vesting conditions, with one-quarter of the share rights vesting on the 1st, 2nd, 3rd and 4th anniversary of the grant. Vested share rights entitle the holder to ordinary shares in the Company for nil consideration. The Company retains discretion to satisfy vested share rights delivered through the 2015 Equity plan via the issuance of new shares or via an on-market purchase. Notional dividend equivalents are not provided on 2015 Equity plan grants. In the event of resignation/termination, unvested share rights lapse except as provided at the discretion of the Board for a 'Good Leaver' (see table 2.6b for details). The Board and Committee have discretion over treatment in such circumstances (including the ability to deem vesting conditions satisfied and satisfy unvested grants in cash).
As Director Corporate Finance & Investor Relations, Mr Oxenham participated in the 2015 Equity plan, receiving a grant of $45,000 (12,981 share rights).
3. Relationship between company performance and remuneration
3.1 Performance overviewAcross the key financial measures of net earned premium growth, full year loss ratio and dividend payout ratio, Company performance was in line with or exceeded guidance for the reporting period, despite dynamic conditions in the industry.
Table 3.1a Summary of Company performance (2015)
Financial results2014
(unaudited1) 2015
Gross Written Premium ($m) $634.2 $507.6
Gross Earned Premium ($m) $520.7 $549.6
Net Earned Premium ($m) $445.8 $469.9
Net Investment Income ($m) $226.9 $107.9
Net Profit After Tax (NPAT) ($m) $324.1 $228.0
Underlying NPAT ($m) $279.4 $264.7
Loss Ratio 19.0% 24.0%
Expense Ratio 26.5% 26.2%
Reported Return On Equity 13.8% 9.7%
Underlying Return On Equity 12.2% 11.6%
Dividends paid $0.274 $0.503
Share capital ($m) $1,706.5 $1,556.5
Share price at start of reporting period $2.65 $3.64
Share price at end of period $3.64 $2.76
1 2014 results are presented in full calendar year pro-forma basis to enable meaningful comparison. As a result, the 2014 figures are unaudited.

Genworth Mortgage Insurance Australia44
Remuneration report (continued)
3.2 Link between performance and STI outcomesThe link between remuneration outcomes and business performance is both explicit and fundamental to the design, administration and outcomes of the Company’s remuneration programs. In light of GMA group’s solid performance against 2015’s STI objectives (see below for more detail), the Board determined the STI pool funding level to be 109% of the sum of STI targets.
Table 3.2a 2015 STI performance objectives and Board assessment of performance
STI performance objective & weighting Rationale Assessment of 2015 performance
Underlying Net Profit After Tax (NPAT) (35%)
As the headline figure of the various components that make up overall Company performance, an annual profit measure is a key performance objective.
Underlying NPAT for 2015 was $264.7m against a target of $259m. Key contributors to this result:
– gross written premium pressure as high-LVR segment impacted by reduced lender risk appetite and increased investor loans;
– resilient net earned premium growth, and
– loss ratio at the lower end of the forecast spectrum.
Underlying Return on Equity (ROE) (35%)
ROE is a key measure of the Company's ability to convert equity into returns (profit).
2015 underlying ROE results were strong, delivering 11.6% against a target of 11%.
Execute key strategic objectives (30%)
Key strategic priorities for each performance period may vary year-to-year based on priorities of the Company. For the 2015 performance period, this list included:- optimise capital position and investment portfolio returns;
– strengthen market leadership position;
– loss mitigation initiatives to enhance savings;
– people initiatives including focus on employee engagement, employee and leadership development and diversity.
The Board determined overall performance against key strategic objectives to be on target.
3. Relationship between company performance and remuneration (continued)

45Annual Report 2015
Remuneration report (continued)
4. Remuneration outcomes for executive KMPTable 4a STI outcomes
Executive KMPTarget STI % (of TFR)
Target STI $ Max STI $
Cash STI awarded1
Deferred STI
awarded2
Deferred STI share
rightsTotal STI
awarded $
Actual STI awarded
(% of TFR)
Actual STI awarded
(% of max)
STI not awarded
(% of max)
Georgette Nicholas Acting CEO3 85% $300,140 $600,280 $400,000 $0 0 $400,000 85% 67% 33%
Luke Oxenham Acting CFO4 50% $27,292 $54,584 $42,496 $0 0 $42,496 11% 78% 22%
Andrew Cormack CRO5 30% $42,631 $85,262 $35,264 $17,631 6,817 $52,895 11% 62% 38%
Bridget Sakr CCO 50% $217,500 $435,000 $153,334 $76,666 29,644 $230,000 53% 53% 47%
Tobin Fonseca COO 50% $202,500 $405,000 $153,334 $76,666 29,644 $230,000 57% 57% 43%
Former KMP
Ellen Comerford Former CEO6 85% $506,923 $1,013,846 $337,949 $168,941 65,337 $506,923 66% 50% 50%
Conor O'Dowd Former CRO7 30% $104,229 $208,458 $81,844 $0 0 $81,844 21% 39% 61%
1 Cash STI awarded figure is inclusive of superannuation.2 Deferred STI awarded is the one-third portion of total STI award deferred for 12 months. The deferred STI award is converted to share rights using a 10-day
VWAP as at 31 December 2015 ($2.586) and will vest on 1 March 2017 subject to continuous active service and Board and Committee satisfaction that adverse outcomes have not arisen that were not apparent when performance was assessed, and satisfaction that there was not excessive risk taking in achievement of results.
3 Ms Nicholas was CFO from 1 January until her appointment as Acting CEO effective 12 October. As Acting CEO Ms Nicholas received a ‘higher duties’ allowance of $159,492 (annualised). Ms Nicholas’ 2015 STI target was pro rated to reflect the time spent in each respective role and includes the higher duties allowance.
4 Mr Oxenham was appointed Acting CFO effective 12 October. The Acting CFO received a ‘higher duties’ allowance of $50,000 (annualised). Mr Oxenham’s 2015 STI target was pro rated to reflect the time spent as Acting CFO and includes the higher duties allowance.
5 Mr Cormack was appointed CRO effective 1 October. Mr Cormack’s 2015 STI target was pro rated to reflect hire date.6 Ms Comerford retired from her role as CEO effective 9 October 2015.7 Mr O’Dowd was appointed Chief Actuary, stepping down from the Chief Risk Officer role and as a KMP effective 1 October. His 2015 STI target was pro rated to
reflect time spent as CRO in the reporting period.
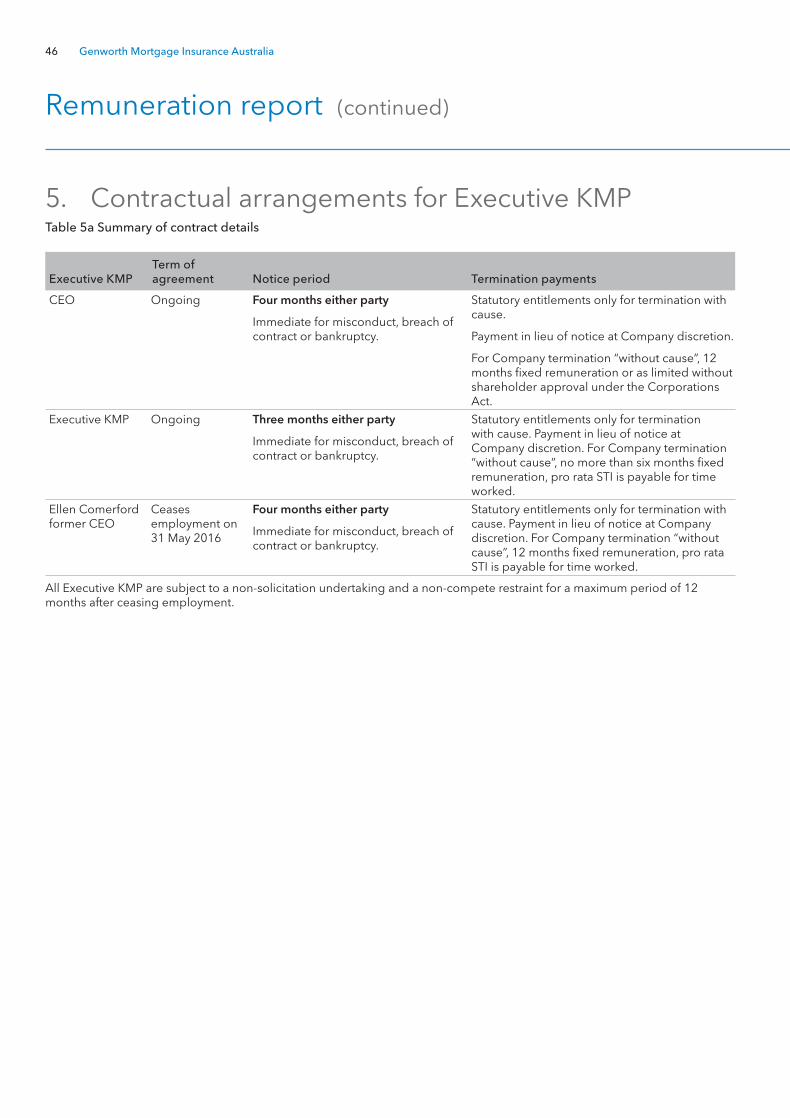
Genworth Mortgage Insurance Australia46
Remuneration report (continued)
5. Contractual arrangements for Executive KMPTable 5a Summary of contract details
Executive KMPTerm of agreement Notice period Termination payments
CEO Ongoing Four months either party
Immediate for misconduct, breach of contract or bankruptcy.
Statutory entitlements only for termination with cause.
Payment in lieu of notice at Company discretion.
For Company termination “without cause”, 12 months fixed remuneration or as limited without shareholder approval under the Corporations Act.
Executive KMP Ongoing Three months either party
Immediate for misconduct, breach of contract or bankruptcy.
Statutory entitlements only for termination with cause. Payment in lieu of notice at Company discretion. For Company termination “without cause”, no more than six months fixed remuneration, pro rata STI is payable for time worked.
Ellen Comerford former CEO
Ceases employment on 31 May 2016
Four months either party
Immediate for misconduct, breach of contract or bankruptcy.
Statutory entitlements only for termination with cause. Payment in lieu of notice at Company discretion. For Company termination “without cause”, 12 months fixed remuneration, pro rata STI is payable for time worked.
All Executive KMP are subject to a non-solicitation undertaking and a non-compete restraint for a maximum period of 12 months after ceasing employment.

47Annual Report 2015
Remuneration report (continued)
6. Non-executive director remunerationTable 6a Key Management Personnel in 2015 – non-executive directors
Name Position Term as KMP since listing
Independent non-executive directors
Richard Grellman Chairman Full Period
Tony Gill Independent Director Full Period
Ian MacDonald Independent Director Full Period
Gayle Tollifson Independent Director Full Period
Genworth Financial designated non-executive Directors
Samuel Marsico Director Full Period
Leon Roday Director Full Period
Stuart Take Director Full Period
Jerome Upton Director Full Period
Non-executive directors are entitled to such remuneration as determined by the Board, provided the aggregate maximum annual amount (referred to as the aggregate fee cap) approved by shareholders is not exceeded. The aggregate fee cap remains $1.5 million per annum, and is inclusive of the Company’s superannuation obligations. NEDs who are executives of Genworth Financial (Mr Take and Mr Upton) were paid by Genworth Financial in the ordinary course of their duties and were not paid fees by Genworth Australia. As Mr Marsico and Mr Roday have retired as executives of Genworth Financial, they were paid fees as set out in section 7 KMP remuneration tables.
Table 6b NED fee table
Position Annual fee
Non-executive Directors (excluding Mr Take and Mr Upton)
Board Chairman $265,000
Director1 $115,000
Committee chair (per Committee) $20,000
Committee member (per Committee) $10,000
Director fees are reviewed annually and may be adjusted in line with market standards within the aggregate fee cap.
The focus of NEDs is principally the stewardship, strategic direction and medium to long-term performance of the Company. Accordingly remuneration programs for NEDs are neither performance based or at-risk.
While there are no specific share ownership requirements for NEDs, they are encouraged to own one times their annual base fees in Company shares. The current independent directors support this approach and intend to achieve this shareholding over time.
1 Mr Roday is paid by Genworth Financial for serving on the Genworth Canada and Genworth Australia Boards. The amount reflected in the statutory tables is the portion of his remuneration attributable to the Genworth Australia Board and Remuneration & Nominations Committee.

Genworth Mortgage Insurance Australia48
Remuneration report (continued)
7. KMP remuneration tablesTable 7a Statutory remuneration table – 1 January to 31 December 2015
Short term remunerationLong Term/Post-employment
BenefitsShare-based
payments
KMPCash
salary1Other cash
benefits2
Non-monetary benefits3
Cash STI awarded4
Deferred STI
awarded5 Sub-totalSuperannuation
benefits14
Long Service Leave
accrual15RSUs and
other equity16Termination
benefits17 Total
% of total remuneration
that is performance
related
% of total remuneration
that is delivered as options
Executive KMP Georgette Nicholas Acting 2015 $465,186 $286,420 $276,774 $400,000 $0 $1,428,380 $55,347 $0 $339,043 $0 $1,822,770 24% 0%CEO 2014 $231,357 $124,637 $102,107 $175,703 $0 $633,804 $167,275 $0 $183,497 $0 $984,576 18% 3%Luke Oxenham Acting CFO 2015 $75,955 $11,219 $144 $42,496 $0 $129,814 $7,452 $1,086 $26,977 $0 $165,329 26% 0%Andrew Cormack CRO 2015 $106,746 $109,6016 $35,738 $35,264 $3,320 $290,669 $16,945 $3,123 $20,516 $0 $331,253 22% 0%Bridget Sakr CCO 2015 $388,971 $2,750 $18,552 $153,333 $37,762 $601,368 $37,214 $13,887 $359,829 $0 $1,012,298 20% 0%
2014 $249,142 $373 $10,662 $149,260 $0 $409,437 $10,019 -$1,631 $207,583 $0 $625,408 24% 0%Tobin Fonseca COO 2015 $360,813 $0 $17,871 $153,333 $37,762 $569,779 $33,418 $14,733 $342,630 $0 $960,560 20% 0%
2014 $217,606 $0 $9,327 $174,137 $0 $401,070 $10,198 $6,600 $167,234 $0 $585,102 30% 0%Former KMPEllen Comerford 2015 $534,407 $0 $14,255 $337,949 $74,781 $961,392 $50,769 $29,916 $790,194 $504,751 $2,337,022 21% 0%Former CEO 2014 $437,218 $373 $13,039 $550,397 $0 $1,001,027 $9,392 $22,883 $548,113 $0 $1,581,415 35% 0%Conor O’Dowd 2015 $303,153 $0 $13,306 $81,844 $0 $398,303 $28,553 $4,595 $221,170 $0 $652,621 13% 0%Former CRO 2014 $244,947 $0 $8,851 $37,315 $0 $291,113 $23,150 $2,304 $147,825 $0 $464,392 8% 0%
Non-executive DirectorsRichard Grellman Chairman 2015 $242,008 $0 $19,179 n/a n/a $261,187 $22,991 $0 $0 $0 $284,178 0% 0%
2014 $149,694 $0 $8,406 n/a n/a $158,100 $14,149 $0 $0 $0 $172,249 0% 0%Tony Gill7 Director 2015 $165,000 $0 $0 n/a n/a $165,000 $0 $0 $0 $0 $165,000 0% 0%
2014 $102,016 $0 $0 n/a n/a $102,016 $0 $0 $0 $0 $102,016 0% 0%Ian MacDonald8 Director 2015 $150,685 $0 $0 n/a n/a $150,685 $14,315 $0 $0 $0 $165,000 0% 0%
2014 $93,206 $0 $0 n/a n/a $93,206 $8,810 $0 $0 $0 $102,016 0% 0%Gayle Tollifson9 Director 2015 $150,685 $0 $0 n/a n/a $150,685 $14,315 $0 $0 $0 $165,000 0% 0%
2014 $93,206 $0 $010 n/a n/a $93,206 $8,810 $0 $0 $0 $102,016 0% 0%Samuel Marsico11 Director 2015 $125,000 $0 $0 n/a n/a $125,000 $0 $0 $0 0 $125,000 0% 0%
2014 $0 $0 $0 n/a n/a $0 $0 $0 $0 $0 $0 0% 0%Leon Roday12 Director 2015 $104,167 $0 $0 n/a n/a $104,167 $0 $0 $0 $0 $104,167 0% 0%
2014 $0 $0 $0 n/a n/a $0 $0 $0 $0 $0 $0 0% 0%Stuart Take Director 2015 $0 $0 $0 n/a n/a $0 $0 $0 $0 $0 $0 0% 0%
2014 $0 $0 $0 n/a n/a $0 $0 $0 $0 $0 $0 0% 0%Jerome Upton13 Director 2015 $0 $0 $0 n/a n/a $0 $0 $0 $0 $0 $0 0% 0%
2014 $0 $0 $0 n/a n/a $0 $0 $0 $0 $0 $0 0% 0%
1 Cash salary for Executive KMP consists of base salary and any salary sacrifice arrangements; for non-executive directors it consists of Director fees and any salary sacrifice arrangements. Consistent with the 2014 report, 2014 figures are pro rata values reflective of the shortened reporting period due to the Company listing in May 2014. As CFO and Acting CEO, Ms Nicholas was an expatriate of Genworth Financial, and details of her remuneration arrangements are found in section 2.9. As an expatriate paid in USD, remuneration values are presented in AUD using an average exchange rate for the reporting period. A significant proportion of the increase in Ms Nicholas’ remuneration when compared with 2014 is due to exchange rate fluctuation (was AUD/USD 1/0.9086 in 2014 compared to 1/ 0.7524 in 2015).
2 Other cash benefits include an annual health reimbursement offered to all employees, cash allowances provided to Ms Nicholas as part of her expatriate remuneration arrangements, and Acting Allowances as part of transition arrangements.
3 Non-monetary benefits include insurance premiums, executive health benefits, other non-cash benefits (such as car parking) and related Fringe Benefits Tax (FBT), and reimbursements relating to Mr Cormack’s relocation.
4 Cash STI awarded is the actual STI cash payment relating to 2015 performance, inclusive of super, accrued for in 2015. Actual payment made in March 2016.5 Deferred STI awarded is the one-third portion of total STI award deferred for 12 months, see section 2.6a for more detail. The value disclosed is the portion of
the value of the equity instruments recognised as an expense in this reporting period. The value of each share right granted under the 2015 deferred STI plan has been calculated using the share price at the end of the performance period ($2.76, as at 31 December 2015).
6 Figure includes a relocation allowance paid to Mr Cormack upon relocation to Australia and $37,974 which is the pro rata portion of the incentive retention payment agreement between Mr Cormack and Genworth Financial (his previous employer). This disclosure reflects the portion of the total award relating to his GMA service. However, Genworth Financial paid for the complete award.
7 Mr Gill is Chairman of the Capital & Investment Committee and a member of the Audit, Risk, and Remuneration & Nominations Committees.

49Annual Report 2015
Remuneration report (continued)
7. KMP remuneration tablesTable 7a Statutory remuneration table – 1 January to 31 December 2015
Short term remunerationLong Term/Post-employment
BenefitsShare-based
payments
KMPCash
salary1Other cash
benefits2
Non-monetary benefits3
Cash STI awarded4
Deferred STI
awarded5 Sub-totalSuperannuation
benefits14
Long Service Leave
accrual15RSUs and
other equity16Termination
benefits17 Total
% of total remuneration
that is performance
related
% of total remuneration
that is delivered as options
Executive KMP Georgette Nicholas Acting 2015 $465,186 $286,420 $276,774 $400,000 $0 $1,428,380 $55,347 $0 $339,043 $0 $1,822,770 24% 0%CEO 2014 $231,357 $124,637 $102,107 $175,703 $0 $633,804 $167,275 $0 $183,497 $0 $984,576 18% 3%Luke Oxenham Acting CFO 2015 $75,955 $11,219 $144 $42,496 $0 $129,814 $7,452 $1,086 $26,977 $0 $165,329 26% 0%Andrew Cormack CRO 2015 $106,746 $109,6016 $35,738 $35,264 $3,320 $290,669 $16,945 $3,123 $20,516 $0 $331,253 22% 0%Bridget Sakr CCO 2015 $388,971 $2,750 $18,552 $153,333 $37,762 $601,368 $37,214 $13,887 $359,829 $0 $1,012,298 20% 0%
2014 $249,142 $373 $10,662 $149,260 $0 $409,437 $10,019 -$1,631 $207,583 $0 $625,408 24% 0%Tobin Fonseca COO 2015 $360,813 $0 $17,871 $153,333 $37,762 $569,779 $33,418 $14,733 $342,630 $0 $960,560 20% 0%
2014 $217,606 $0 $9,327 $174,137 $0 $401,070 $10,198 $6,600 $167,234 $0 $585,102 30% 0%Former KMPEllen Comerford 2015 $534,407 $0 $14,255 $337,949 $74,781 $961,392 $50,769 $29,916 $790,194 $504,751 $2,337,022 21% 0%Former CEO 2014 $437,218 $373 $13,039 $550,397 $0 $1,001,027 $9,392 $22,883 $548,113 $0 $1,581,415 35% 0%Conor O’Dowd 2015 $303,153 $0 $13,306 $81,844 $0 $398,303 $28,553 $4,595 $221,170 $0 $652,621 13% 0%Former CRO 2014 $244,947 $0 $8,851 $37,315 $0 $291,113 $23,150 $2,304 $147,825 $0 $464,392 8% 0%
Non-executive DirectorsRichard Grellman Chairman 2015 $242,008 $0 $19,179 n/a n/a $261,187 $22,991 $0 $0 $0 $284,178 0% 0%
2014 $149,694 $0 $8,406 n/a n/a $158,100 $14,149 $0 $0 $0 $172,249 0% 0%Tony Gill7 Director 2015 $165,000 $0 $0 n/a n/a $165,000 $0 $0 $0 $0 $165,000 0% 0%
2014 $102,016 $0 $0 n/a n/a $102,016 $0 $0 $0 $0 $102,016 0% 0%Ian MacDonald8 Director 2015 $150,685 $0 $0 n/a n/a $150,685 $14,315 $0 $0 $0 $165,000 0% 0%
2014 $93,206 $0 $0 n/a n/a $93,206 $8,810 $0 $0 $0 $102,016 0% 0%Gayle Tollifson9 Director 2015 $150,685 $0 $0 n/a n/a $150,685 $14,315 $0 $0 $0 $165,000 0% 0%
2014 $93,206 $0 $010 n/a n/a $93,206 $8,810 $0 $0 $0 $102,016 0% 0%Samuel Marsico11 Director 2015 $125,000 $0 $0 n/a n/a $125,000 $0 $0 $0 0 $125,000 0% 0%
2014 $0 $0 $0 n/a n/a $0 $0 $0 $0 $0 $0 0% 0%Leon Roday12 Director 2015 $104,167 $0 $0 n/a n/a $104,167 $0 $0 $0 $0 $104,167 0% 0%
2014 $0 $0 $0 n/a n/a $0 $0 $0 $0 $0 $0 0% 0%Stuart Take Director 2015 $0 $0 $0 n/a n/a $0 $0 $0 $0 $0 $0 0% 0%
2014 $0 $0 $0 n/a n/a $0 $0 $0 $0 $0 $0 0% 0%Jerome Upton13 Director 2015 $0 $0 $0 n/a n/a $0 $0 $0 $0 $0 $0 0% 0%
2014 $0 $0 $0 n/a n/a $0 $0 $0 $0 $0 $0 0% 0%
8 Mr MacDonald is Chairman of the Remuneration & Nominations Committee and a member of the Audit, Risk and Capital & Investment Committees.9 Ms Tollifson is Chairman of the Audit and Risk Committees and a member of the Capital and Investment Committee. 10 The 2014 report incorrectly identified MsTollifson as receiving a $1,968 non-monetary benefit. 11 Mr Marsico is a member of the Risk Committee.12 Mr Roday is a member of the Remuneration & Nominations Committee. Mr Roday is paid by Genworth Financial for serving on the Genworth Canada and
Genworth Australia Boards. The amount reflected in the statutory tables is the portion of his remuneration attributable to the Genworth Australia Board and Remuneration & Nominations Committee in the reporting period (he retired from his role as a Genworth Financial executive in February 2015). He is paid in USD which is converted to AUD using the average exchange rate for the reporting period.
13 Mr Upton is a member of the Capital & Investment Committee and the Audit Committee.14 As CFO and Acting CEO, Ms Nicholas participated in Genworth Financial’s post-employment benefits.15 Long Service Leave accruals are presented as the expense movement for the reporting period.16 The fair value of equity instruments calculated at the date of grant using the Black Scholes model and allocated to each reporting period evenly over the period
from grant date to vesting date. The value disclosed is the portion of the fair value of the equity instruments recognised as an expense in this reporting period. The fair value of 2015 LTI grants provided to Ms Nicholas, Ms Sakr, Mr Fonseca and Ms Comerford in the period is $3.09. The fair value of the 2015 Equity plan grants provided to Mr Oxenham and Mr O’Dowd is $2.83 (vesting in 2016), $2.55 (vesting in 2017), $2.29 (vesting in 2018) and $2.06 (vesting in 2019).
17 Termination benefits accrued for in 2015, actual payment will be made in May 2016.

Genworth Mortgage Insurance Australia50
Remuneration report (continued)
Table 7b Share right holdings for the reporting period ending 31 December 2015.
Movement During the Year
Executive KMP Equity plan Grant detail Grant date Issue price Vesting date
# Held at 31
December 2014
Number granted forfeited Vested
Other movements Exercised
# Held at 31 Dec
2015
Name & Position Georgette Nicholas Acting CEO
GFI Equity 2011 GFI '11 Grant 9 February 2011 $12.61 9 Feb ‘15 1,000 0 0 1,000 0 1,000 0GFI Equity 2012 GFI '12 Grant 14 February 2012 $8.31 14 Feb ’15, ‘16 2,266 0 0 1,133 0 1,133 1,133GFI Equity 2013 GFI '13 Grant 15 February 2013 $8.79 15 Feb ‘15, ‘16, ‘17 6,000 0 0 2,000 0 2,000 4,000GFI Equity 2014 GFI '14 Grant 20 February 2014 $16.90 20 Feb ’15, ’16, ‘17, ‘18 11,050 0 0 2,763 0 2,763 8,287IPO Special Grant IPO Grant 21 May 2014 $2.65 20 May ’16, ’17, ‘18 188,949 0 0 0 0 0 188,949LTI 2015 LTI '15 Grant 1 January 2015 $3.47 31 Dec '18 0 59,943 0 0 0 0 59,943
Luke Oxenham Acting CFO
GFI Equity 2013 GFI '13 Grant 15 February 2013 $16.91 15 Feb ’16, ‘17 3,124 0 0 0 0 0 3,124GFI Equity 2014 GFI '14 Grant 20 February 2014 $16.90 20 Feb ’16, ’17, ‘18 2,962 0 0 0 0 0 2,962IPO Special Grant IPO Grant 21 May 2014 $2.65 20 May ’16, ’17, ‘18 75,471 0 0 0 0 0 75,471
Equity 2015 Equity '15 Grant 1 March 2015 $3.47 1 March ’16, ’17, ’18, ‘19 0 0 0 0 12,981 0 12,981Andrew Cormack CRO
GFI Equity 2012 GFI '12 Grant 14 February 2012 $8.31 14 Feb ‘16 650 0 0 0 0 0 650
GFI Equity 2013 GFI '13 Grant 15 February 2013 $8.79 15 Feb ’16, ‘17 3,000 0 0 0 0 0 3,000GFI Equity 2014 GFI '14 Grant 20 February 2014 $16.90 20 Feb ’16, ’17, ‘18 2,700 0 0 0 0 0 2,700
Bridget Sakr CCO
GFI Equity 2007 GFI '07 Grant 7 February 2007 $42.68 7 Feb ‘15 2,500 0 0 2,500 0 2,500 0GFI Equity 2011 GFI '11 Grant 9 February 2011 $12.61 9 Feb ‘15 2,083 0 0 2,083 0 2,083 0GFI Equity 2012 GFI '12 Grant 14 February 2012 $8.31 14 Feb ’15, ‘16 7,250 0 0 3,625 0 3,625 3,625GFI Equity 2013 GFI '13 Grant 15 February 2013 $8.79 15 Feb ‘15, ‘16, ‘17 12,487 0 0 4,163 0 4,163 8,324GFI Equity 2014 GFI '14 Grant 20 February 2014 $16.90 20 Feb ’15, ’16, ‘17, ‘18 9,600 0 0 2,400 0 2,400 7,200IPO Special Grant IPO Grant 21 May 2014 $2.65 20 May ’16, ’17, ‘18 188,949 0 0 0 0 0 188,949LTI 2015 LTI '15 Grant 1 January 2015 $3.47 31 Dec ‘18 0 61,301 0 0 0 0 61,301
Tobin Fonseca COO
GFI Equity 2012 GFI '12 Grant 1 March 2012 $8.73 1 March ’15, ‘16 7,500 0 0 3,750 0 0 3,750GFI Equity 2013 GFI '13 Grant 15 February 2013 $8.79 15 Feb ‘15, ‘16, ‘17 10,950 0 0 3,650 0 0 7,300GFI Equity 2014 GFI '14 Grant 20 February 2014 $16.90 20 Feb ’15, ’16, ‘17, ‘18 9,200 0 0 2,300 0 0 6,900IPO Special Grant IPO Grant 21 May 2014 $2.65 20 May ’16, ’17, ‘18 188,949 0 0 0 0 0 188,949LTI 2015 LTI '15 Grant 1 January 2015 $3.47 31 Dec '18 0 56,253 0 0 0 0 56,253
Former KMPEllen Comerford Former CEO & Managing Director
GFI Equity 2011 GFI Joining Grant 3 January 2011 $13.29 3 Jan ‘15 5,000 0 0 5,000 0 5,000 0
GFI '11 Grant 9 February 2011 $12.61 9 Feb ‘15 2,500 0 0 2,500 0 2,500 0GFI Equity 2012 GFI '12 Grant 14 February 2012 $8.31 14 Feb ‘15, ‘16 12,500 0 0 6,250 0 6,250 6,250GFI Equity 2013 GFI '13 Grant 15 February 2013 $8.79 15 Feb ’15, ’16, ‘17 23,737 0 0 7,913 0 7,913 15,8241
GFI Equity 2014 GFI '14 Grant 20 February 2014 $16.90 20 Feb ’15, ’16, ‘17, ‘18 18,150 0 0 4,538 0 4,538 13,1622
IPO Special Grant IPO Grant 21 May 2014 $2.65 20 May ’16, ’17, ‘18 660,377 0 0 0 0 0 660,3773
LTI 2015 LTI '15 Grant 1 January 2015 $3.47 31 Dec '18 0 230,062 0 0 0 0 230,0624
Conor O’Dowd Former CRO
GFI Equity 2013 GFI '13 Grant 2 December 2013 $16.91 2 Dec ’15, ‘16, ‘17 7,500 0 0 2,500 0 2,500 5,000GFI Equity 2014 GFI '14 Grant 20 February 2014 $16.90 20 Feb ’15, ’16, ‘17, ‘18 8,400 0 0 2,100 0 2,100 6,300IPO Special Grant IPO Grant 21 May 2014 $2.65 20 May ’16, ’17, ‘18 188,949 0 0 0 0 0 188,949Equity 2015 Equity '15 Grant 1 March 2015 $3.47 1 March ’16, ’17, ’18, ‘19 0 28,847 0 0 0 0 28,847
7 KMP remuneration tables (continued)

51Annual Report 2015
Remuneration report (continued)
Table 7b Share right holdings for the reporting period ending 31 December 2015.
Movement During the Year
Executive KMP Equity plan Grant detail Grant date Issue price Vesting date
# Held at 31
December 2014
Number granted forfeited Vested
Other movements Exercised
# Held at 31 Dec
2015
Name & Position Georgette Nicholas Acting CEO
GFI Equity 2011 GFI '11 Grant 9 February 2011 $12.61 9 Feb ‘15 1,000 0 0 1,000 0 1,000 0GFI Equity 2012 GFI '12 Grant 14 February 2012 $8.31 14 Feb ’15, ‘16 2,266 0 0 1,133 0 1,133 1,133GFI Equity 2013 GFI '13 Grant 15 February 2013 $8.79 15 Feb ‘15, ‘16, ‘17 6,000 0 0 2,000 0 2,000 4,000GFI Equity 2014 GFI '14 Grant 20 February 2014 $16.90 20 Feb ’15, ’16, ‘17, ‘18 11,050 0 0 2,763 0 2,763 8,287IPO Special Grant IPO Grant 21 May 2014 $2.65 20 May ’16, ’17, ‘18 188,949 0 0 0 0 0 188,949LTI 2015 LTI '15 Grant 1 January 2015 $3.47 31 Dec '18 0 59,943 0 0 0 0 59,943
Luke Oxenham Acting CFO
GFI Equity 2013 GFI '13 Grant 15 February 2013 $16.91 15 Feb ’16, ‘17 3,124 0 0 0 0 0 3,124GFI Equity 2014 GFI '14 Grant 20 February 2014 $16.90 20 Feb ’16, ’17, ‘18 2,962 0 0 0 0 0 2,962IPO Special Grant IPO Grant 21 May 2014 $2.65 20 May ’16, ’17, ‘18 75,471 0 0 0 0 0 75,471
Equity 2015 Equity '15 Grant 1 March 2015 $3.47 1 March ’16, ’17, ’18, ‘19 0 0 0 0 12,981 0 12,981Andrew Cormack CRO
GFI Equity 2012 GFI '12 Grant 14 February 2012 $8.31 14 Feb ‘16 650 0 0 0 0 0 650
GFI Equity 2013 GFI '13 Grant 15 February 2013 $8.79 15 Feb ’16, ‘17 3,000 0 0 0 0 0 3,000GFI Equity 2014 GFI '14 Grant 20 February 2014 $16.90 20 Feb ’16, ’17, ‘18 2,700 0 0 0 0 0 2,700
Bridget Sakr CCO
GFI Equity 2007 GFI '07 Grant 7 February 2007 $42.68 7 Feb ‘15 2,500 0 0 2,500 0 2,500 0GFI Equity 2011 GFI '11 Grant 9 February 2011 $12.61 9 Feb ‘15 2,083 0 0 2,083 0 2,083 0GFI Equity 2012 GFI '12 Grant 14 February 2012 $8.31 14 Feb ’15, ‘16 7,250 0 0 3,625 0 3,625 3,625GFI Equity 2013 GFI '13 Grant 15 February 2013 $8.79 15 Feb ‘15, ‘16, ‘17 12,487 0 0 4,163 0 4,163 8,324GFI Equity 2014 GFI '14 Grant 20 February 2014 $16.90 20 Feb ’15, ’16, ‘17, ‘18 9,600 0 0 2,400 0 2,400 7,200IPO Special Grant IPO Grant 21 May 2014 $2.65 20 May ’16, ’17, ‘18 188,949 0 0 0 0 0 188,949LTI 2015 LTI '15 Grant 1 January 2015 $3.47 31 Dec ‘18 0 61,301 0 0 0 0 61,301
Tobin Fonseca COO
GFI Equity 2012 GFI '12 Grant 1 March 2012 $8.73 1 March ’15, ‘16 7,500 0 0 3,750 0 0 3,750GFI Equity 2013 GFI '13 Grant 15 February 2013 $8.79 15 Feb ‘15, ‘16, ‘17 10,950 0 0 3,650 0 0 7,300GFI Equity 2014 GFI '14 Grant 20 February 2014 $16.90 20 Feb ’15, ’16, ‘17, ‘18 9,200 0 0 2,300 0 0 6,900IPO Special Grant IPO Grant 21 May 2014 $2.65 20 May ’16, ’17, ‘18 188,949 0 0 0 0 0 188,949LTI 2015 LTI '15 Grant 1 January 2015 $3.47 31 Dec '18 0 56,253 0 0 0 0 56,253
Former KMPEllen Comerford Former CEO & Managing Director
GFI Equity 2011 GFI Joining Grant 3 January 2011 $13.29 3 Jan ‘15 5,000 0 0 5,000 0 5,000 0
GFI '11 Grant 9 February 2011 $12.61 9 Feb ‘15 2,500 0 0 2,500 0 2,500 0GFI Equity 2012 GFI '12 Grant 14 February 2012 $8.31 14 Feb ‘15, ‘16 12,500 0 0 6,250 0 6,250 6,250GFI Equity 2013 GFI '13 Grant 15 February 2013 $8.79 15 Feb ’15, ’16, ‘17 23,737 0 0 7,913 0 7,913 15,8241
GFI Equity 2014 GFI '14 Grant 20 February 2014 $16.90 20 Feb ’15, ’16, ‘17, ‘18 18,150 0 0 4,538 0 4,538 13,1622
IPO Special Grant IPO Grant 21 May 2014 $2.65 20 May ’16, ’17, ‘18 660,377 0 0 0 0 0 660,3773
LTI 2015 LTI '15 Grant 1 January 2015 $3.47 31 Dec '18 0 230,062 0 0 0 0 230,0624
Conor O’Dowd Former CRO
GFI Equity 2013 GFI '13 Grant 2 December 2013 $16.91 2 Dec ’15, ‘16, ‘17 7,500 0 0 2,500 0 2,500 5,000GFI Equity 2014 GFI '14 Grant 20 February 2014 $16.90 20 Feb ’15, ’16, ‘17, ‘18 8,400 0 0 2,100 0 2,100 6,300IPO Special Grant IPO Grant 21 May 2014 $2.65 20 May ’16, ’17, ‘18 188,949 0 0 0 0 0 188,949Equity 2015 Equity '15 Grant 1 March 2015 $3.47 1 March ’16, ’17, ’18, ‘19 0 28,847 0 0 0 0 28,847
1 7,912 share rights will be forfeited upon cessation of employment on 31 May 2016. 2 9,074 share rights will be forfeited upon cessation of employment on 31 May 2016.3 440,252 share rights will be forfeited upon cessation of employment on 31 May 2016.4 230,062 share rights will be forfeited upon cessation of employment on 31 May 2016.

Genworth Mortgage Insurance Australia52
Remuneration report (continued)
Table 7c Share option holdings for the reporting period ending 31 December 2015.
Movement During the Year
Executive KMP Equity plan Grant detail Grant date Issue price Vesting date
# Held at 31 December
2014Number granted Forfeited Vested Exercised Expired
# Held at
31 Dec 2015
Fair value per
instrument
Name & Position Georgette Nicholas Acting CEO
GFI Equity 2009 GFI '09 Grant - Options 19 August 2009 $9.41 19 Aug ’11, ’12, ‘13 2,550 0 0 0 0 0 2,550 $20.88
GFI Equity 2010 GFI '10 Grant - Options 10 February 2010 $16.20 10 Feb ’11, ’12, ‘13, ‘14 15,000 0 0 0 0 0 15,000 $11.99
GFI Equity 2011 GFI '11 Grant - Options 9 February 2011 $12.61 9 Feb ’12, ’13, ’14, ‘15 18,000 0 0 0 0 0 18,000 $3.09
GFI Equity 2012 GFI '12 Grant -Options 14 February 2012 $8.31 14 Feb ’13, ’14, ’15, ‘16 20,400 0 0 0 0 0 20,400 $2.36
GFI Equity 2013 GFI '13 Grant -Options 15 February 2013 $8.79 15 Feb ’14, ’15, ’16, ’17, 18,000 0 0 0 0 0 18,000 $2.40
Andrew Cormack CRO
GFI Equity 2009 GFI '09 Grant - Options 19 August 2009 $9.41 19 Aug ’10, ’11, ‘12 2,000 0 0 0 0 0 2,000 $41.98
19 Aug ’10, ’11, ‘12 2,450 0 0 0 0 0 2,450 $33.99
19 Aug ’10, ’11, ‘12, ‘13 3,799 0 0 0 0 0 3,799 $20.88
GFI Equity 2010 GFI '10 Grant - Options 10 February 2010 $16.20 10 Feb ’11, ’12, ’13, ‘14 12,000 0 0 0 0 0 12,000 $11.99
GFI Equity 2011 GFI '11 Grant - Options 9 February 2011 $12.61 9 Feb ’12, ’13, ’14, ‘15 8,500 0 0 0 0 0 8,500 $3.09
GFI Equity 2012 GFI '12 Grant - Options 14 February 2012 $8.31 14 Feb ’13, ’14, ’15, ‘16 11,700 0 0 0 0 0 11,700 $2.36
GFI Equity 2013 GFI '13 Grant - Options 15 February 2013 $8.79 15 Feb ’14, ’15, ’16, ’17, 13,500 0 0 0 0 0 13,500 $2.40
GFI Equity 2014 GFI '14 Grant - Options 20 February 2014 $16.90 20 Feb ’15, ’16, ’17, ‘18 14,000 0 0 0 0 0 14,000 $3.40
7 KMP remuneration tables (continued)
Notes for share right and option tables:Issue Price is the share price of the instrument at the date of grant. All GFI grant issue prices and fair values have been converted from USD to AUD using the exchange rate as at the date of grant.

53Annual Report 2015
Remuneration report (continued)
Table 7c Share option holdings for the reporting period ending 31 December 2015.
Movement During the Year
Executive KMP Equity plan Grant detail Grant date Issue price Vesting date
# Held at 31 December
2014Number granted Forfeited Vested Exercised Expired
# Held at
31 Dec 2015
Fair value per
instrument
Name & Position Georgette Nicholas Acting CEO
GFI Equity 2009 GFI '09 Grant - Options 19 August 2009 $9.41 19 Aug ’11, ’12, ‘13 2,550 0 0 0 0 0 2,550 $20.88
GFI Equity 2010 GFI '10 Grant - Options 10 February 2010 $16.20 10 Feb ’11, ’12, ‘13, ‘14 15,000 0 0 0 0 0 15,000 $11.99
GFI Equity 2011 GFI '11 Grant - Options 9 February 2011 $12.61 9 Feb ’12, ’13, ’14, ‘15 18,000 0 0 0 0 0 18,000 $3.09
GFI Equity 2012 GFI '12 Grant -Options 14 February 2012 $8.31 14 Feb ’13, ’14, ’15, ‘16 20,400 0 0 0 0 0 20,400 $2.36
GFI Equity 2013 GFI '13 Grant -Options 15 February 2013 $8.79 15 Feb ’14, ’15, ’16, ’17, 18,000 0 0 0 0 0 18,000 $2.40
Andrew Cormack CRO
GFI Equity 2009 GFI '09 Grant - Options 19 August 2009 $9.41 19 Aug ’10, ’11, ‘12 2,000 0 0 0 0 0 2,000 $41.98
19 Aug ’10, ’11, ‘12 2,450 0 0 0 0 0 2,450 $33.99
19 Aug ’10, ’11, ‘12, ‘13 3,799 0 0 0 0 0 3,799 $20.88
GFI Equity 2010 GFI '10 Grant - Options 10 February 2010 $16.20 10 Feb ’11, ’12, ’13, ‘14 12,000 0 0 0 0 0 12,000 $11.99
GFI Equity 2011 GFI '11 Grant - Options 9 February 2011 $12.61 9 Feb ’12, ’13, ’14, ‘15 8,500 0 0 0 0 0 8,500 $3.09
GFI Equity 2012 GFI '12 Grant - Options 14 February 2012 $8.31 14 Feb ’13, ’14, ’15, ‘16 11,700 0 0 0 0 0 11,700 $2.36
GFI Equity 2013 GFI '13 Grant - Options 15 February 2013 $8.79 15 Feb ’14, ’15, ’16, ’17, 13,500 0 0 0 0 0 13,500 $2.40
GFI Equity 2014 GFI '14 Grant - Options 20 February 2014 $16.90 20 Feb ’15, ’16, ’17, ‘18 14,000 0 0 0 0 0 14,000 $3.40

Genworth Mortgage Insurance Australia54
Remuneration report (continued)
Table 7d KMP and their related parties direct, indirect and beneficial shareholdings (including movements during the period ending 31 December 2015)
Movement during the period
Executive KMP
Balance at 31 December
2014
Received via vesting/
exercising Other changes
Balance at 31 December
2015
Georgette Nicholas Acting CEO 0 0 0 0
Luke Oxenham Acting CFO 0 0 0 0
Andrew Cormack CRO 0 0 0 0
Bridget Sakr Chief Commercial Officer 0 0 0 0
Tobin Fonseca Chief Operating Officer 18,867 0 (18,867) 0
Former KMP
Ellen Comerford Former CEO 0 0 0 0
Conor O'Dowd Former CRO 0 0 0 0
Non-executive Directors
Richard Grellman Chairman 28,301 0 8,364 36,665
Tony Gill Director 188,679 0 (50,000) 138,679
Ian MacDonald Director 75,471 0 0 75,471
Gayle Tollifson Director 56,603 0 0 56,603
Samuel Marsico Director 0 0 0 0
Leon Roday Director 19,609 0 0 19,609
Stuart Take Director 9,699 0 0 9,699
Jerome Upton Director 19,534 0 0 19,534
7 KMP remuneration tables (continued)

55Annual Report 2015
Remuneration report (continued)
8. Relevant Interests of DirectorsTable 8a Relevant interest of each director in Genworth Australia and its related bodies corporate.
Directors
GMA Group balance held directly
or indirectly at 31 Dec 2015
Genworth Financial balance directly
or indirectly at 31 Dec 20151
Genworth MI Canada Inc. balance
directly or indirectly at 31 Dec 2015
Name & positionRichard Grellman Chairman Shares: 36,665
Share rights: 0
Shares: 0
Share rights: 0
Options: 0
Shares: 0
Share rights: 0
Options: 0
Tony Gill Director Shares: 138,679
Share rights: 0
Shares: 0
Share rights: 0
Options: 0
Shares: 0
Share rights: 0
Options: 0
Ian MacDonald Director Shares: 75,471
Share rights: 0
Shares: 0
Share rights: 0
Options: 0
Shares: 0
Share rights: 0
Options: 0
Gayle Tollifson Director Shares: 56,603
Share rights: 0
Shares: 0
Share rights: 0
Options: 0
Shares: 0
Share rights: 0
Options: 0
Samuel Marsico Director Shares: 0
Share rights: 0
Shares: 9,215
Share rights: 0
Options: 0
Shares: 624
Share rights: 0
Options: 0
Leon Roday Director Shares: 19,609
Share rights: 0
Shares: 25,509
Share rights: 626,033
Options: 0
Shares: 3,020
Share rights: 0
Options: 0
Stuart Take Director Shares: 9,699
Share rights: 0
Shares: 21,042
Share rights: 112,241
Options: 34,600
Shares: 0
Share rights: 0
Options: 0
Jerome Upton Director Shares: 19,534
Share rights: 0
Shares: 15,482
Share rights: 162,520
Options: 27,550
Shares: 906
Share rights: 0
Options: 0
1 Share rights in Genworth Financial include Restricted Stock Units, Performance Stock Units and Stock Appreciation Rights.

Genworth Mortgage Insurance Australia56
Directors’ report (continued)
The lead auditor’s independence declaration is set out on page 57 and forms part of the Directors’ Report.
Signed in accordance with a resolution of the Directors:
Richard Grellman Gayle TollifsonChairman Director
Dated at Sydney, 25 February 2016

57Annual Report 2015
Lead auditor’s independence declaration
Lead Auditor’s Independence Declaration under Section 307C of the Corporations Act 2001
To: the Directors of Genworth Mortgage Insurance Australia Limited
I declare that, to the best of my knowledge and belief, in relation to the audit for the financial year ended 31 December 2015 there have been:
(i) no contraventions of the auditor independence requirements as set out in the Corporations Act 2001 in relation to the audit; and
(ii) no contraventions of any applicable code of professional conduct in relation to the audit
KPMG
Ian MoyserPartner
Dated 25 February 2016

Genworth Mortgage Insurance Australia58
Financial Statements
ContentsConsolidated statement of comprehensive income 59Consolidated statement of financial position 60Consolidated statement of changes in equity 61Consolidated statement of cash flows 62
Section 1 Basis of preparation 63
1.1 Reporting entity 631.2 Basis of preparation 63
Section 2 Risk Management 65
2.1 Financial risk management 65
Section 3 Results for the year 71
3.1 Gross written premium 713.2 Investment income 713.3 Other underwriting expenses 723.4 Net cash provided by operating activities 723.5 Income taxes 733.6 Dividends 743.7 Earnings per share 76
Section 4 Insurance contracts 77
4.1 Net claims incurred 774.2 Deferred reinsurance expense 784.3 Deferred acquisition costs 784.4 Outstanding claims 794.5 Non reinsurance recoveries 814.6 Unearned premium 824.7 Liability adequacy test 824.8 Accounting estimates and judgements 834.9 Actuarial assumptions and methods 844.10 Capital adequacy 86
Section 5 Capital management and financing 87
5.1 Capital management 875.2 Interest bearing liabilities 885.3 Equity 895.4 Capital commitments and contingencies 895.5 Other reserves 90
Section 6 Operating assets and liabilities 91
6.1 Intangibles 916.2 Goodwill 926.3 Employee benefits provision 926.4 Trade and other receivables 936.5 Trade and other payables 936.6 Cash and cash equivalents 94
Section 7 Other disclosures 94
7.1 Parent entity disclosures 947.2 Auditor’s remuneration 957.3 Key management personnel disclosures 957.4 Related party disclosures 967.5 Controlled entities 967.6 Share based payments 977.7 Deed of cross guarantee 1037.8 Events subsequent to reporting date 104
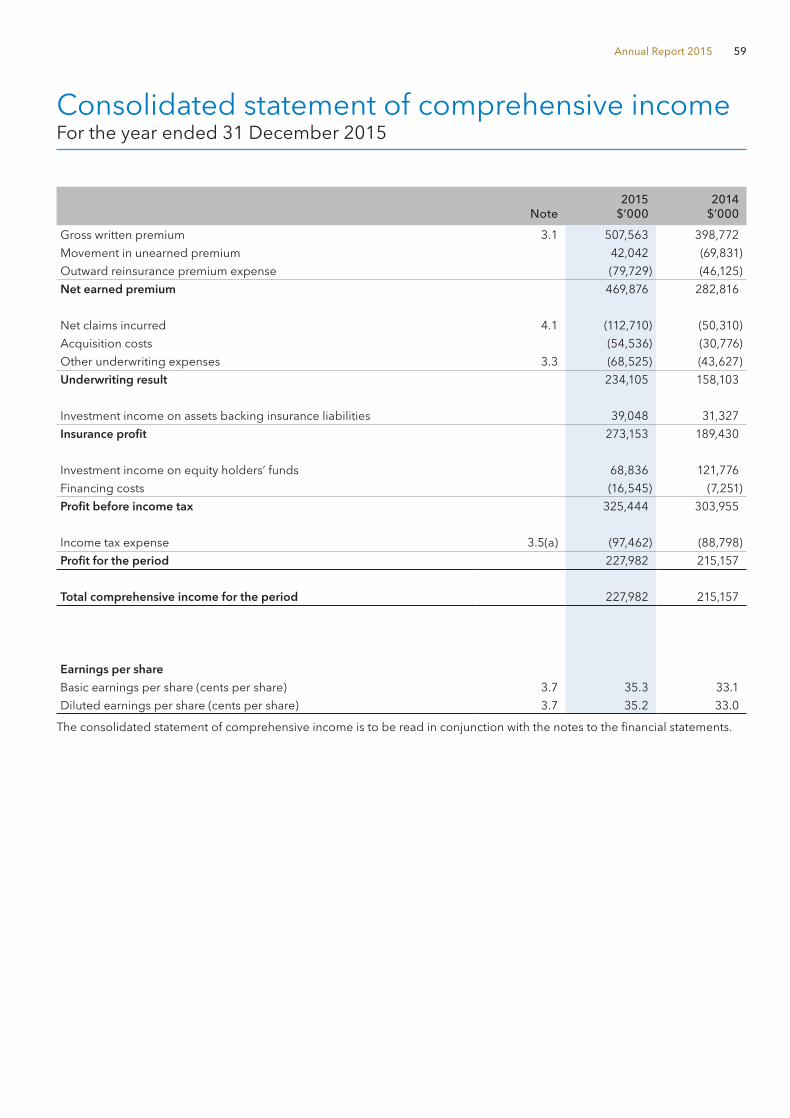
59Annual Report 2015
Consolidated statement of comprehensive incomeFor the year ended 31 December 2015
Note2015
$’0002014
$’000
Gross written premium 3.1 507,563 398,772
Movement in unearned premium 42,042 (69,831)
Outward reinsurance premium expense (79,729) (46,125)
Net earned premium 469,876 282,816
Net claims incurred 4.1 (112,710) (50,310)
Acquisition costs (54,536) (30,776)
Other underwriting expenses 3.3 (68,525) (43,627)
Underwriting result 234,105 158,103
Investment income on assets backing insurance liabilities 39,048 31,327
Insurance profit 273,153 189,430
Investment income on equity holders’ funds 68,836 121,776
Financing costs (16,545) (7,251)
Profit before income tax 325,444 303,955
Income tax expense 3.5(a) (97,462) (88,798)
Profit for the period 227,982 215,157
Total comprehensive income for the period 227,982 215,157
Earnings per share
Basic earnings per share (cents per share) 3.7 35.3 33.1
Diluted earnings per share (cents per share) 3.7 35.2 33.0
The consolidated statement of comprehensive income is to be read in conjunction with the notes to the financial statements.

Genworth Mortgage Insurance Australia60
Consolidated statement of financial positionAs at 31 December 2015
Note2015
$’0002014
$’000
Assets
Cash 78,114 88,596
Accrued investment income 34,621 40,925
Investments including derivatives 2.1.(f) 3,847,759 4,071,037
Trade and other receivables 6.4 2,831 3,701
Prepayments 2,179 2,168
Deferred reinsurance expense 4.2 71,040 80,602
Non-reinsurance recoveries 4.5 28,770 16,412
Deferred acquisition costs 4.3 145,075 124,470
Plant and equipment 828 1,234
Deferred tax assets 3.5(b) 10,593 8,211
Intangibles 6.1 1,026 2,802
Goodwill 6.2 9,123 9,123
Total assets 4,231,959 4,449,281
Liabilities
Trade and other payables 6.5 77,658 115,360
Reinsurance payable 86,753 93,948
Outstanding claims 4.4 276,983 230,874
Unearned premium 4.6 1,320,590 1,362,632
Employee benefits provision 6.3 6,810 7,417
Interest bearing liabilities 5.2 244,416 138,575
Total liabilities 2,013,210 1,948,806
Net assets 2,218,749 2,500,475
Equity
Share capital 5.3(a) 1,556,470 1,706,467
Share based payment reserve 5.3(b) 5,521 3,832
Other reserves 5.5 (476,559) (476,559)
Retained earnings 1,133,317 1,266,735
Total equity 2,218,749 2,500,475
The consolidated statement of financial position is to be read in conjunction with the notes to the financial statements.

61Annual Report 2015
Consolidated statement of changes in equityFor the year ended 31 December 2015
Share capitalOther
reservesRetained earnings
Share based payment
reserve Total
$’000 $’000 $’000 $’000 $’000
Balance at 1 January 2014 - - - - -
Profit after taxation - - 215,157 - 215,157
Dividends declared and paid - - (18,200) - (18,200)
Transactions with owners in their capacity as owners - (476,559) 1,069,778 1,954 595,173
Issuance of shares 1,706,467 - - - 1,706,467
Share based payment expense recognised - - - 3,315 3,315
Share based payment settled - - - (1,437) (1,437)
Balance at 31 December 2014 1,706,467 (476,559) 1,266,735 3,832 2,500,475
Balance at 1 January 2015 1,706,467 (476,559) 1,266,735 3,832 2,500,475
Profit after taxation - - 227,982 - 227,982
Dividends declared and paid - - (361,400) - (361,400)
Share based payment expense recognised - - - 2,515 2,515
Share based payment settled - - - (1,293) (1,293)
Buy-back of shares, net of transaction costs (149,997) - - - (149,997)
Share based payment expense to be recharged back to the major shareholder - - - 467 467
Balance at 31 December 2015 1,556,470 (476,559) 1,133,317 5,521 2,218,749
The consolidated statement of changes in equity is to be read in conjunction with the notes to the financial statements.

Genworth Mortgage Insurance Australia62
Consolidated statement of cash flowsFor the year ended 31 December 2015
Note2015
$’0002014
$’000
Cash flows from operating activities
Premiums received 507,563 398,772
Interest and other income 156,835 91,034
Claims paid (78,959) (48,941)
Financial expense on long term borrowings (13,893) (7,251)
Cash payments in the course of operations (199,915) (115,672)
Income tax paid (155,263) (40,894)
Net cash provided by operating activities 3.4 216,368 277,048
Cash flows from investing activities
Payment for plant and equipment and intangibles (251) (283)
Payments for investments (822,238) (1,214,884)
Proceeds from sale of investments 1,002,856 977,621
Proceeds from acquisition of subsidiaries - 67,295
Net cash used in investing activities 180,367 (170,251)
Cash flows from financing activities
Proceeds from issuance of share capital - 583,000
Equity issuance costs - (16,033)
Net proceeds from long term borrowings 104,180 -
Repayment of related party note - (566,968)
Dividends paid (361,400) (18,200)
Payments for the on-market buy-back of shares (149,997) -
Net cash provided by financing activities (407,217) (18,201)
Net (decrease)/increase in cash held (10,482) 88,596
Cash and cash equivalents at the beginning of the financial year 88,596 -
Cash and cash equivalents at the end of the financial year 6.6 78,114 88,596
The consolidated statement of cash flows is to be read in conjunction with the notes to the financial statements.

63Annual Report 2015
Notes to the financial statements
Section 1 Basis of preparation1.1 Reporting entityThis general purpose consolidated financial report is for the year ended 31 December 2015 and comprises the consolidated financial statements for Genworth Mortgage Insurance Australia Limited and its controlled entities (together referred to as the Group). The Company is a for-profit entity domiciled in Australia and its shares are publicly traded on ASX. The Group operates in one business and geographical segment conducting loan mortgage insurance business in Australia; hence no segment information is presented.
The annual financial report was authorised for issue by the Board of Directors on 25 February 2016.
1.2 Basis of preparation(a) Statement of complianceThis report has been prepared in accordance with the Corporations Act 2001, Australian Accounting Standards adopted by the Australian Accounting Standards Board and the ASX listing rules. International Financial Reporting Standards form the basis of Australian Accounting Standards adopted by the AASB, being Australian equivalents to IFRS. The financial report also complies with IFRSs and interpretations adopted by the International Accounting Standards Board.
Selected explanatory notes are included to explain events and transactions that are significant to an understanding of the financial position and performance of the Group.
(b) Basis of preparationThe Company has a 31 December year end. It was incorporated on 21 December 2011 with $1 share capital and had nil operating activity until it gained control of Genworth Financial Australia Holdings, LLC on 19 May 2014 as part of the IPO restructure. The year ended 31 December 2014 represents the Company’s 12 months results and the trading results of the Group from 19 May 2014 to 31 December 2014. For the results of the standalone company only, please refer to Note 7.1.
The consolidated financial report is presented in Australian dollars.
The consolidated statement of financial position has been prepared using the liquidity format of presentation, in which the assets and liabilities are presented broadly in order of liquidity. The assets and liabilities comprise both current amounts (expected to be recovered or settled within 12 months after the reporting date) and non-current amounts (expected to be recovered or settled more than 12 months after the reporting date). For those assets and liabilities that comprise both current and non-current amounts, information regarding the respective current and non-current amounts is disclosed in the relevant note to the financial statements.
The consolidated financial report is prepared on the historical cost basis except for investments being stated at fair value and outstanding claims and the related reinsurance recoveries on unpaid claims being stated at present value.

Genworth Mortgage Insurance Australia64
Notes to the financial statements (continued)
Section 1 Basis of preparation (continued)1.2 Basis of preparation (continued)(c) Changes in accounting policiesNew accounting standards and amendments issued but not yet effectiveA number of new standards, amendments to standards and interpretations noted below are effective for annual periods beginning on or after 1 January 2016, and have not been applied in preparing these consolidated financial statements. An initial assessment of these standards and amendments has taken place and the application of these standards is not expected to have material impact on the Group’s accounting policies. AASB 9 Financial Instruments, which becomes mandatory for the Group’s 2018 financial statements, could change the classification and measurement of financial assets. The Group does not plan to adopt this standard early and the extent of the impact has not been determined.
New standards, amendments and interpretations Operative date
AASB 9 Financial Instruments 1/01/2018
AASB 2013-9 Amendments to Australian Accounting Standards – Conceptual Framework, Materiality and Financial Instrument: Part C Financial Instrument
1/01/2018
AASB 15 Revenue from contracts with customers 1/01/2017
AASB 2014-1 Amendments to Australian Accounting Standards – Part E 1/01/2018
AASB 2014-4 Amendments to Australian Accounting Standards – Clarification of Acceptable Methods of Depreciation and Amortisation
1/01/2016
AASB 2015-1 Amendments to Australian Accounting Standards – Annual improvement to Australian Accounting Standards 2012-2014 Cycle
1/01/2016
AASB 2015-2 Amendments to Australian Accounting Standards – Disclosure Initiative: Amendment to AASB 101
1/01/2016
AASB 2015-8 Amendments to Australian Accounting Standards – Effective date of AASB 15
1/01/2017
AASB 2015-3 Amendments to Australian Accounting Standards arising from the Withdrawal of AASB 1031 Materiality
1/07/2015
(d) Rounding offThe Group is of a kind referred to in ASIC Class Order 98/100 dated 10 July 1998 and, in accordance with that Class Order, amounts in the consolidated financial report and Directors’ Report have been rounded off to the nearest thousand dollars, unless otherwise stated.
(e) Use of estimates and judgementsThe preparation of a financial report requires management to make judgements, estimates and assumptions that affect the application of policies and reported amounts of assets, liabilities, income and expenses. The estimates and associated assumptions are based on historical experience and various other factors that are believed to be reasonable in the circumstances, the results of which form the basis of making judgements about the carrying values of assets and liabilities that are not readily apparent from other sources.
These estimates and underlying assumptions are reviewed on an ongoing basis and actual results may vary from estimates. Revisions to accounting estimates are recognised in the period in which the estimate is revised if the revision affects only that period or in the period of the revision and future periods if the revision affects both current and future periods.
Judgements made by management in the application of Australian Accounting Standards that have a significant effect on the financial report and estimates with a significant risk of material adjustment are discussed in Note 4.8.
Mortgage insurance business is seasonal in nature. While net premiums earned, investment income and underwriting and administrative expenses are relatively stable from quarter to quarter, premiums written and losses may vary each quarter. The variations in premium written are driven by the level of mortgage origination and related mortgage policies written, which are typically lowest in the first quarter each year. Delinquencies and losses on claims vary from quarter to quarter primarily as the result of prevailing economic conditions as well as the characteristics of the insurance in-force portfolio such as size and age. All revenue and expenses are recognised in accordance with the accounting policies.
The accounting policies have been applied consistently by the Group.

65Annual Report 2015
(f) Principles of consolidationThe Group incorporates the assets and liabilities of the Company and all subsidiaries as at the reporting date and the results of the Company and all subsidiaries for the period set out in note 1.2(b) as if they had operated as a single entity.
Transactions eliminated on consolidationUnrealised gains and losses and inter-entity balances resulting from transactions with or between controlled entities are eliminated in full on consolidation.
Section 2 Risk ManagementThe Group has exposure to credit, liquidity and market risks relating to its use of financial instruments. This note presents information about the Group’s exposure to each of these risks, the Group’s objectives, policies and processes for measuring and managing risk.
2.1 Financial risk management(a) Risk management frameworkThe Board has overall responsibility for the establishment and oversight of the risk management framework. The Board has established a Risk Committee as well as Audit Committee and Capital Investment Committee. The Risk Committee is responsible for developing and monitoring the Group’s risk management policies. The committee reports regularly to the Board on its activities.
The Group’s risk management policies are established to identify and analyse the risks faced by the Group, to set appropriate risk limits and controls, and to monitor risks and adherence to limits. Risk management policies and systems are reviewed to reflect changes in market conditions and the Group’s activities. The Group, through its management policies and procedures, aims to develop a disciplined and constructive control environment in which all employees understand their roles and obligations.
The Audit Committee oversees, amongst other things, how management monitors compliance with the risk management policies and procedures and reviews the adequacy of the risk management framework in relation to the risks faced by the Group. The Audit Committee is assisted in its oversight role by internal audit. Internal audit undertakes reviews of risk management controls and procedures, the results of which are reported to the Audit Committee.
(b) Risk concentrationRisk is managed primarily through appropriate pricing, product design, risk selection, appropriate investment strategy, financial strength ratings and reinsurance. It is vital that the Group closely monitors and responds to any changes in the general economic and commercial environment in which it operates.
Due to the nature of the Australian economy, the majority of mortgages are originated through the country’s four largest banks. The Group’s top three lender customers accounted for approximately 66% of the Group’s gross written premium, as outlined in the table below:
Lender customer FY15 GWP
Lender customer 1 44%
Lender customer 2 12%
Lender customer 3 10%
(c) Market riskMarket risk is the risk that the market price of assets change and the potential for such change to result in the actual market value of Genworth Australia’s assets being adversely impacted.

Genworth Mortgage Insurance Australia66
Notes to the financial statements (continued)
Section 2 Risk Management (continued)2.1 Financial risk management (continued)(c) Market risk (continued)(i) Currency riskCurrency risk is the risk of loss arising from an unfavourable movement in market exchange rates. The Group is exposed to currency risk on its investments in receivables and payables denominated in a currency other than Australian dollars and the net investment in foreign branch operations. The currency giving rise to the risk is New Zealand dollars. The NZ currency risk exposure to the Group is not material.
The potential impact on the Group’s profit and loss and equity as a result of a 10% depreciation/ appreciation of the Australian dollar at the reporting date, assuming all other variables remain constant, is shown below.
2015 2014
+10% -10% +10% -10%
$’000 $’000 $’000 $’000
Impact to profit and loss and equity of 10% depreciation/ appreciation of Australian Dollar on New Zealand assets and liabilities. 185 (226) 625 (764)
(ii) Cash flow and fair value interest rate riskThe Group is exposed to interest rate risk arising on interest bearing assets. Assets with floating rate interest expose the Group to cash flow interest rate risk. Fixed interest rate assets expose the Group to fair value interest rate risk.
The Group’s strategy is to invest in high quality, liquid fixed interest securities and cash and to actively manage the duration. The Group used derivative financial instruments in the form of interest rate swaptions to mitigate interest rate risk arising from fixed interest securities. The risk management processes over these derivative financial instruments include close senior management scrutiny, including appropriate board approval. Derivatives are used only for approved purposes and are subject to delegated authority levels provided to management. The level of derivative exposure is reviewed on an ongoing basis. Appropriate segregation of duties exists with respect to derivative use and compliance with policy, limits and other requirements is closely monitored.
The investment portfolios are actively managed to achieve a balance between cash flow interest rate risk and fair value interest rate risk bearing in mind the need to meet the liquidity requirements of the insurance business.
The Group has exposure to interest rate risk on its term subordinated notes. The interest rate on these notes is reset quarterly. The Group manages the level of assets with similar maturities to offset this exposure.
The potential impact of movements in interest rates on the Group’s profit and loss and equity as a result of 1% increase/decrease in the investments including derivatives, assuming all other variables remain constant, are shown below.
2015 2014
+1% -1% +1% -1%
$’000 $’000 $’000 $’000
Investments – fixed interest securities and related interest rate derivatives 59,174 (49,761) 69,253 (66,860)

67Annual Report 2015
(d) Credit risk exposuresCredit risk is the risk of default by borrowers and transactional counterparties as well as the loss of value of assets due to deterioration in credit quality. The Group’s credit risk arises predominantly from investment activities and the amounts are as indicated by the carrying amounts of the financial assets.
The Group’s investment portfolio comprises 96% (2014: 98%) of total securities and cash with counterparties having a rating of A- or better. The Group does not expect any investment counterparties to fail to meet their obligations given their strong credit ratings.
The credit quality of financial assets that are neither past due nor impaired is assessed by reference to external credit ratings (if available) or to historical information about counterparty default rates. As at balance date there were no assets past due.
The ratings in the following table are the lower equivalent rating of either Standard & Poor’s or Moody’s.
2015 2014
$’000 $’000
Cash at bank and short-term bank deposits
AAA 37,534 20,858
AA 547,188 456,511
A 5,000 81,132
BBB 8,800 9,987
BB 3,000 3,000
601,522 571,488
Investments
AAA 1,621,255 1,482,560
AA 884,749 1,111,255
A 677,320 883,220
BBB 141,027 111,110
3,324,351 3,588,145
Accrued interest receivable
AAA 14,808 14,761
AA 11,437 14,986
A 6,487 9,632
BBB 1,879 1,534
BB 10 12
34,621 40,925
Receivables without external credit rating 2,831 3,701
(e) Liquidity riskLiquidity risk is the risk that there are insufficient cash resources to meet payment obligations to policyholders and creditors without affecting the daily operations or the financial condition of the Group.
Management of liquidity risk includes asset and liability management strategies. The assets held to back insurance liabilities consist predominantly of highly rated fixed income securities which can generally be readily sold or exchanged for cash. The assets are managed so as to effectively match the interest rate maturity profile with the expected pattern of claims payments.

Genworth Mortgage Insurance Australia68
Notes to the financial statements (continued)
Section 2 Risk Management (continued)2.1 Financial risk management (continued)(e) Liquidity risk (continued)The money market securities are restricted to investment grade securities with concentrations of investments managed in accordance with investment mandates.
2015Less than
1 year 1 - 5 years Total
Financial liabilities $’000 $’000 $’000
Payables 68,138 9,520 77,658
Reinsurance payable 75,396 11,357 86,753
Outstanding claims provision 202,181 74,802 276,983
345,715 95,679 441,394
2014Less than
1 year 1 - 5 years Total
Financial liabilities $’000 $’000 $’000
Payables 115,060 300 115,360
Reinsurance payable 59,848 34,100 93,948
Outstanding claims provision 166,861 64,013 230,874
341,769 98,413 440,182
(f) Fair value measurementsAccounting policiesFinancial assets backing general insurance liabilities
The assets backing general insurance liabilities are those assets required to cover the technical insurance liabilities (outstanding claims and unearned premiums) plus an allowance for capital adequacy.
The Group has designated the assets backing general insurance activities based on its function. Initially insurance technical balances are offset against the required assets, with any additional assets required being allocated based on liquidity.
In accordance with the Company’s investment strategy, the Company actively monitors the average duration of the notional assets allocated to insurance activities to ensure sufficient funds are available for claim payment obligations.
The Group accounts for financial assets and any assets backing insurance activities at fair value through profit and loss, with any unrealised profits and losses recognised in the statement of comprehensive income.
The valuation methodologies of assets valued at fair value are summarised below:
• Cash assets and bank overdrafts are carried at face value of the amounts deposited or drawn; and
• Fixed interest securities are initially recognised at fair value, determined as the quoted cost at date of acquisition. They are subsequently remeasured to fair value at each reporting date. For securities traded in an active market, fair value is determined by reference to published bid price quotations. For securities not traded and securities traded in a market that is not active, fair value is determined using valuation techniques with the most common technique being reference to observable market data using the fair values of recent arm’s length transactions involving the same or similar instruments. In the absence of observable market information, unobservable inputs which reflect management’s view of market assumption are used. Valuation techniques maximise the use of observable inputs and minimise the use of unobservable inputs.
Financial assets not backing general insurance liabilities
Investments not backing insurance liabilities are designated as financial assets at fair value through profit and loss on the same basis as those backing insurance liabilities.

69Annual Report 2015
Derivative financial instruments
Derivatives are used solely to manage risk exposure and are not used for trading or speculation.
Derivatives are initially recognised at trade date at fair value; attributable transaction costs are recognised in profit or loss as incurred. Subsequent to initial recognition, derivatives are measured at fair value through profit and loss.
Investments
2015 2014
$’000 $’000
Fixed interest rate
Short term deposits 496,574 394,993
Government and semi-government bonds 870,166 588,791
Corporate bonds 1,962,917 2,500,691
3,329,657 3,484,475
Floating interest rate
Short term deposits 26,834 87,899
Corporate bonds 489,714 498,663
516,548 586,562
Derivatives
Investment related derivatives 1,554 -
Total investments 3,847,759 4,071,037
Current 1,103,268 925,695
Non-current 2,744,491 3,145,342
3,847,759 4,071,037
The Group’s financial assets and liabilities are carried at fair value.
The Group investments carried at fair value have been classified under the three levels of the IFRS fair value hierarchy as follows:
Level 1 - Quoted prices in an active market: Fair value investments which are quoted in active and known markets. The quoted prices are those at which transactions have regularly and recently taken place within such markets.
Level 2 - Valuation techniques with observable parameters: Fair value investments using inputs other than quoted prices within Level 1 that are observable either directly or indirectly.
Level 3 - Valuation techniques with significant unobservable parameters: Fair value investments using valuation techniques that include inputs that are not based on observable market data.
31 December 2015 Level 1 Level 2 Level 3 Total
$’000 $’000 $’000 $’000
Financial Instruments
Government and semi-government bonds - 870,166 - 870,166
Corporate bonds - 2,404,131 48,500 2,452,631
Short term deposits 523,408 - - 523,408
Derivatives - - 1,554 1,554
Total 523,408 3,274,297 50,054 3,847,759

Genworth Mortgage Insurance Australia70
Notes to the financial statements (continued)
Section 2 Risk Management (continued)2.1 Financial risk management (continued)(f) Fair value measurements (continued)Accounting policies (continued)Investments (continued)
There is an insignificant proportion of investments, 1% (2014: 1%), for which a valuation methodology is used to determine the fair value. These assets are effectively marked to model rather than fair value. Reasonable changes in the judgement applied in conducting these valuations would not have a significant impact on the statement of financial position.
31 December 2014 Level 1 Level 2 Level 3 Total
$’000 $’000 $’000 $’000
Financial Instruments
Government and semi-government bonds - 587,829 962 588,791
Corporate bonds - 2,950,854 48,500 2,999,354
Short term deposits 482,892 - - 482,892
Total 482,892 3,538,683 49,462 4,071,037
The following table shows a reconciliation from the beginning balances to the ending balances for fair value measurements in Level 3 of the fair value hierarchy:
Balance at 1 January
2015 Purchases DisposalsMovement
in fair value
Balance at 31 December
2015
$’000 $’000 $’000 $’000 $’000
Financial Instruments
Government and semi-government bonds 962 - (962) - -
Corporate bonds 48,500 - - - 48,500
Derivatives - 2,502 (948) 1,554
Total 49,462 2,502 (962) (948) 50,054
Interest bearing liabilities are initially measured at fair value (net of transaction costs) but are subsequently measured at amortised cost. The Company considers the fair value of the interest bearing liabilities to be approximate to that of the carrying value. The interest bearing liabilities have been classified as Level 2 under the three levels of the IFRS fair value hierarchy.
Derivative financial instrumentsDuring the year, the Group purchased interest rate swaptions to mitigate interest rate risk arising from fixed interest securities. An interest rate swaption is an option to enter into an interest rate swap. Each option exists for a period of time and the purchaser pays a one-time, up-front premium to acquire the options. The purchaser has a right, but not obligation, to exercise the option if interest rates reach a particular level.
Interest rate swaptions are valued using an income approach. The primary inputs into the valuation represent the forward interest rate swap curve, which is generally considered an observable input, forward interest rate volatility and time value component associated with the optionality in the derivative. As a result of the significant unobservable inputs associated with the forward interest rate volatility input, these derivatives are classified as Level 3.

71Annual Report 2015
Reporting date positions
The notional amount and fair value of derivative financial instruments, together with their maturity profile, are provided below:
2015 2014
Within 1 year
Maturity profile 1 to
5 years
Maturity profile over 5 years
Notional contract amount
Fair value asset
Notional contract amount
Fair value asset
$’000 $’000 $’000 $’000 $’000 $’000 $’000
Investment related derivatives
Interest rate swaptions 1,700,000 - - 1,700,000 1,554 - -
Section 3 Results for the year3.1 Gross written premiumAccounting policiesGross written premium comprises amounts charged to policyholders (direct premium) or other insurers (inward reinsurance premium) for insurance contracts. Premium charged to policyholders excludes stamp duties and goods and services tax (GST) collected on behalf of third parties.
2015 2014
$’000 $’000
Direct premium 506,488 393,420
Inward reinsurance premium 1,075 5,352
507,563 398,772
3.2 Investment incomeAccounting policiesInterest revenueInterest revenue is recognised as it accrues, taking into account the coupon rate on investments, and interest rates on cash and cash equivalents, net of withholding tax paid or payable.
Gains/ (losses) in fair value of investmentsRefer to Note 2.1.(f) Accounting policies and fair value estimations for further details.
2015 2014
$’000 $’000
Interest 150,530 100,370
Gains/ (losses) in fair value of investments
Unrealised (52,436) 49,224
Realised 9,790 3,508
Total investment income 107,884 153,102
Represented by
Investment income on assets backing insurance liabilities 39,048 31,326
Investment income on equity holders’ funds 68,836 121,776
107,884 153,102
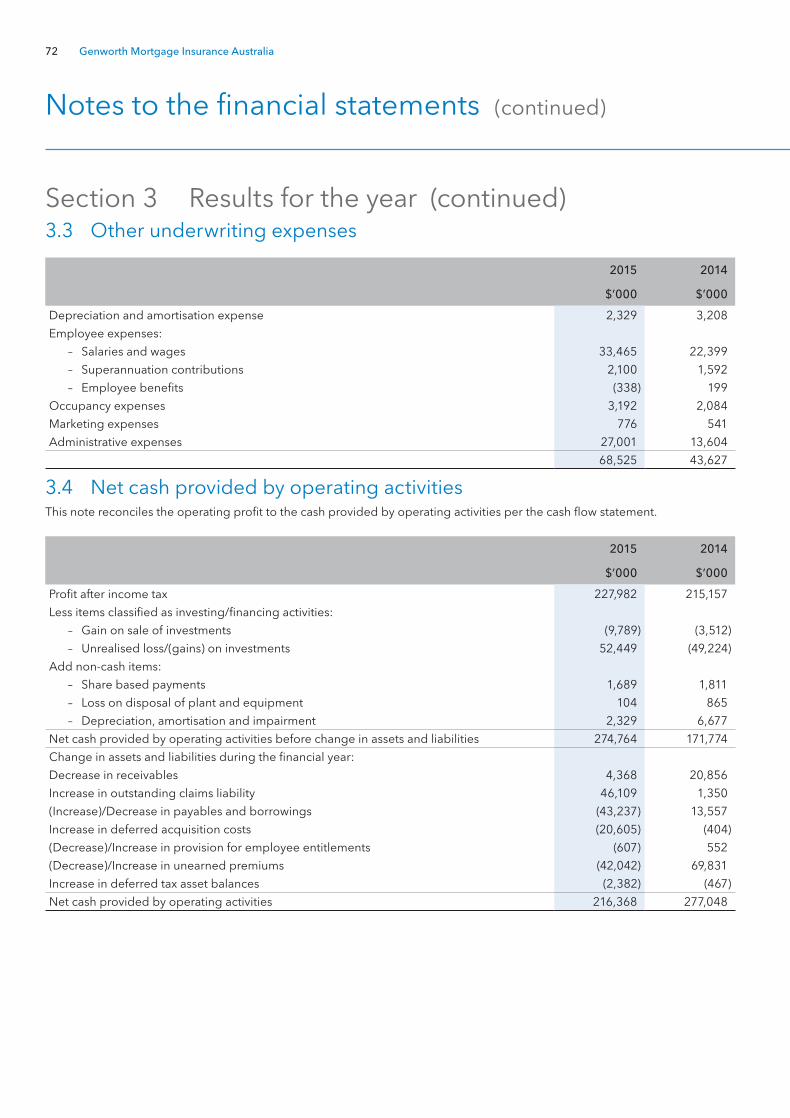
Genworth Mortgage Insurance Australia72
Notes to the financial statements (continued)
Section 3 Results for the year (continued)3.3 Other underwriting expenses
2015 2014
$’000 $’000
Depreciation and amortisation expense 2,329 3,208
Employee expenses:
– Salaries and wages 33,465 22,399
– Superannuation contributions 2,100 1,592
– Employee benefits (338) 199
Occupancy expenses 3,192 2,084
Marketing expenses 776 541
Administrative expenses 27,001 13,604
68,525 43,627
3.4 Net cash provided by operating activitiesThis note reconciles the operating profit to the cash provided by operating activities per the cash flow statement.
2015 2014
$’000 $’000
Profit after income tax 227,982 215,157
Less items classified as investing/financing activities:
– Gain on sale of investments (9,789) (3,512)
– Unrealised loss/(gains) on investments 52,449 (49,224)
Add non-cash items:
– Share based payments 1,689 1,811
– Loss on disposal of plant and equipment 104 865
– Depreciation, amortisation and impairment 2,329 6,677
Net cash provided by operating activities before change in assets and liabilities 274,764 171,774
Change in assets and liabilities during the financial year:
Decrease in receivables 4,368 20,856
Increase in outstanding claims liability 46,109 1,350
(Increase)/Decrease in payables and borrowings (43,237) 13,557
Increase in deferred acquisition costs (20,605) (404)
(Decrease)/Increase in provision for employee entitlements (607) 552
(Decrease)/Increase in unearned premiums (42,042) 69,831
Increase in deferred tax asset balances (2,382) (467)
Net cash provided by operating activities 216,368 277,048

73Annual Report 2015
3.5 Income taxesAccounting policiesIncome tax on the profit or loss for the year comprises current and deferred tax. Income tax is recognised in the statement of comprehensive income except to the extent that it relates to items recognised directly in equity. Current tax is expected tax payable on the taxable income for the year, using tax rates enacted or substantially enacted at the statement of financial position date, and any adjustment to tax payable in respect of previous years.
Deferred tax is provided using the statement of financial position method, providing for temporary differences between the carrying amounts of assets and liabilities for financial reporting purposes and the amounts used for taxation purposes. The following temporary differences are not provided for: goodwill not deductible for tax purposes; the initial recognition of assets or liabilities that affect neither accounting or taxable profit; and differences relating to investments in subsidiaries to the extent that they will probably not reverse in the foreseeable future. The amount of deferred tax provided is based on the expected manner of realisation or settlement of the carrying amount of assets and liabilities using tax rates enacted or substantively enacted at the statement of financial position date.
A deferred tax asset is recognised only to the extent that it is probable that future taxable profits will be available against which the asset can be utilised. Deferred tax assets are reduced to the extent that it is no longer probable that the related tax benefit will be realised.
Additional income taxes that arise from the distribution of dividends are recognised at the same time as the liability to pay the related dividend.
The Group’s subsidiaries constitute a tax consolidated group of which the Company is the head entity. Under the tax consolidation system, the head entity is liable for the current income tax liabilities of that group. Entities are jointly and severally liable for the current income tax liabilities of the Group where the head entity defaults, subject to the terms of a valid tax sharing agreement between the entities in the Group. Assets and liabilities arising from the Company under the tax funding arrangement are recognised as amounts receivable from or payable to other entities in the Group.
(a) Income tax expense
31 December 2015
31 December 2014
$’000 $’000
Current tax 98,293 90,163
Deferred tax (718) 974
(Over)/ under provision in prior year
Current tax 1,551 (1,950)
Deferred tax (1,664) (389)
97,462 88,798
(i) Reconciliation of income tax expense to prima facie tax payable
31 December 2015
31 December 2014
$’000 $’000
Prima facie income tax expense calculated at 30% on profit 97,633 91,186
Increase in income tax expense due to:
(Over)/ under provision in prior year (113) (2,339)
Other non-taxable items (58) (49)
Income tax expense on the profit 97,462 88,798
(ii) Current tax liabilities
The Company is liable for the current income tax liabilities of the tax consolidated group.
The Group’s liability includes the income tax payable by all members of the tax consolidated group.

Genworth Mortgage Insurance Australia74
Notes to the financial statements (continued)
Section 3 Results for the year (continued)3.5 Income taxes (continued)Accounting policies (continued)(b) Deferred tax assets and liabilities
2015 2014
$’000 $’000
Deferred tax asset balance comprises temporary differences attributable to:
Employee benefits 3,951 3,962
Share based payments and accrued expenses 1,063 134
Fixed assets and intangibles, including Research & development 166 (341)
Provision for indirect claims handling costs 5,413 4,457
10,593 8,211
Net deferred tax
Balance at 1 January 8,211 -
Balance acquired on 19 May 2014 - 7,626
Credited to the statement of comprehensive income 718 974
Under/ (over) provision of prior year tax 1,664 (389)
Closing balance at 31 December 10,593 8,211
3.6 DividendsAccounting policyA provision for dividends is made in respect of ordinary shares when dividends have been declared on or before the reporting date but have not yet been distributed at that date.
(a) Restrictions that may limit the payment of dividendsThere are currently no restrictions on the payment of dividends by the Company other than:
• the provisions of the Corporations Act 2001 and the Company’s constitution; and
• the payment of dividends is generally limited to profits subject to ongoing solvency obligations noting that, under the APRA Level 2 Group supervision requirements, the Company is required to obtain approval from APRA before payment of dividends on ordinary shares that exceeds the Group’s after tax earnings as defined by APRA.
Cents per share
Total amount $m Payment date
Tax rate for franking credit
Percentage franked
2014 final dividend 13.1 85.2 6 March 2015 30% 100%
2014 special dividend 11.5 74.8 6 March 2015 30% 100%
2015 interim dividend 12.5 81.3 4 September 2015 30% 100%
2015 special dividend 18.5 120.3 4 September 2015 30% 100%
The Board normally resolves to pay dividends for a period after the relevant reporting date. In accordance with the accounting policy, dividends for a six monthly period are generally recognised in the following six month period.

75Annual Report 2015
(b) Dividends not recognised at reporting dateIn addition to the above dividends, the Board determined to pay the following dividend after the reporting date but before finalisation of this financial report and it has not been recognised in this financial report.
Cents per share
Total amount $m
Expected payment date
Tax rate for franking credit
Percentage franked
2015 final dividend 14.0 83.4 4 March 2016 30% 100%
2015 special dividend 5.3 31.5 4 March 2016 30% 100%
(c) Dividend franking accountThe balance of the franking account arises from:
• franked income received or recognised as a receivable at the reporting date;
• income tax paid, after adjusting for any franking credits which will arise from the payment of income tax provided for in the financial statements; and
• franking debits from payment of dividends recognised as a liability at the reporting date.
31 December 2015
31 December 2014
Franking account balance at reporting date at 30% 5,225,329 15,196,032
Franking credits to arise from payment of income tax payable 21,834,947 67,408,646
Franking credits available for future reporting periods 27,060,276 82,604,678
Franking account impact of dividends determined before issuance of financial report but not recognised at reporting date (49,248,086) (68,528,571)
Franking credits available/(deficits) for subsequent financial periods based on a tax rate of 30% (22,187,810) 14,076,107
In accordance with the tax consolidation legislation, the Company as the head entity in the tax consolidated group has assumed the benefit of available franking credits. The Company actively manages the franking account to ensure the balance remains positive at each reporting date, in accordance with tax legislation.

Genworth Mortgage Insurance Australia76
Notes to the financial statements (continued)
Section 3 Results for the year (continued)3.7 Earnings per shareAccounting policiesBasic earnings per share is calculated by dividing the profit after tax by the weighted average number of shares on issue during the reporting period.
Diluted earnings per share is calculated by dividing the profit after tax adjusted for any costs associated with dilutive potential ordinary shares by the weighted average number of ordinary shares and dilutive potential ordinary shares.
Basic and diluted earnings per share have been calculated using the weighted average and dilutive number of shares outstanding during the year of 645,532,000. The difference between basic and diluted earnings per share is caused by the granting of potentially dilutive securities such as share rights, options and restricted share units (RSUs).
31 December 2015
31 December 2014
Basic earnings per share (cents per share) 35.3 33.1
Diluted earnings per share (cents per share) 35.2 33.0
(a) Reconciliation of earnings used in calculating earnings per share
31 December 2015
31 December 2014
$’000 $’000
Profit after tax 227,982 215,157
Profit used in calculating basic and diluted earnings per share 227,982 215,157
(b) Reconciliation of weighted average number of ordinary shares used in calculating earnings per share
31 December 2015
31 December 2014
$’000 $’000
Weighted average number of ordinary shares on issue 645,532 650,104
Weighted average number of shares used in the calculation of basic earnings per share 645,532 650,104
Weighted average number of dilutive potential ordinary shares
Bonus element of shares 2,056 1,255
Weighted average number of shares used in the calculation of diluted earnings per share 647,588 651,359

77Annual Report 2015
Section 4 Insurance contractsAccounting policiesClassification of insurance contractsContracts under which an entity accepts significant insurance risk from another party (the policyholder) by agreeing to compensate the policyholder or other beneficiary if a specified uncertain future event (the insured event) adversely affects the policyholder or other beneficiary are classified as insurance contracts. Insurance risk is risk other than financial risk.
4.1 Net claims incurred(a) Claims analysis
31 December 2015
$’000
31 December 2014
$’000
Gross claims incurred 133,206 56,968
Reinsurance and other recoveries revenue (8,696) (6,658)
Borrower recoveries recognised (11,800) –
Net claims incurred 112,710 50,310
(b) Claims development
2015 2014
Current year
$’000
Prior years $’000
Total $’000
Current year
$’000
Prior years $’000
Total $’000
Gross claims expense
Direct 204,013 (72,360) 131,653 84,475 (30,159) 54,316
Inwards reinsurance 7,689 (6,136) 1,553 2,897 (245) 2,652
Gross claims incurred – undiscounted 211,702 (78,496) 133,206 87,372 (30,404) 56,968
Reinsurance and other recoveries revenue
Reinsurance and other recoveries – undiscounted (1,321) (7,375) (8,696) (159) (6,499) (6,658)
Borrower recoveries recognised (1,331) (10,469) (11,800) – – –
Net claims incurred 209,050 (96,340) 112,710 87,213 (36,902) 50,310

Genworth Mortgage Insurance Australia78
Notes to the financial statements (continued)
Section 4 Insurance contracts (continued)4.2 Deferred reinsurance expenseAccounting policiesReinsurance expensePremium ceded to reinsurers is recognised as an expense in accordance with the pattern of reinsurance coverage received. Accordingly, a portion of outwards reinsurance premium is treated at the balance date as a deferred reinsurance expense.
31 December 2015
$’000
31 December 2014
$’000
Balance at 1 January 80,602 –
Balance acquired on 19 May 2014 – 117,203
Deferral of reinsurance premium on current year contracts 70,165 9,524
Expensing of reinsurance premium previously deferred (79,727) (46,125)
Balance as at 31 December 71,040 80,602
Current 59,683 46,502
Non-current 11,357 34,100
71,040 80,602
4.3 Deferred acquisition costsAccounting policiesCosts associated with obtaining and recording mortgage insurance contracts are referred to as acquisition costs and are capitalised when they relate to the acquisition of new business or the renewal of existing business. These are presented as deferred acquisition costs (DAC) and amortised using the same basis as the earning pattern of premium over the period of the related insurance contracts. The balance at the reporting date represents the capitalised acquisition costs relating to unearned premium and is stated at cost subject to a liability adequacy test.
The Group reviews all assumptions underlying DAC and tests DAC for recoverability annually. If the balance of unearned premiums is less than the current estimate of future losses and related expenses a charge to income is recorded for additional DAC amortisation.
Refer to Note 4.8 Accounting estimates and judgements for further detailed information.
31 December 2015
$’000
31 December 2014
$’000
Opening balance at 1 January 124,470 –
Balance acquired on 19 May 2014 – 124,066
Acquisition costs incurred in year 70,879 26,087
Amortisation charge (50,274) (25,683)
Balance as at 31 December 145,075 124,470
Current 51,940 27,036
Non-current 93,135 97,434
145,075 124,470

79Annual Report 2015
4.4 Outstanding claimsAccounting policiesClaims expense and a liability for outstanding claims are recognised in respect of direct and inward reinsurance business. The liability covers claims reported and outstanding, IBNR and the expected direct and indirect costs of settling those claims. Outstanding claims are assessed by estimating the ultimate cost of settling delinquencies, which includes IBNR and settlement costs, using statistics based on past experience and trends. Changes in outstanding claims are recognised in profit or loss in the reporting period in which the estimates are changed.
The provision for outstanding claims contains a risk margin to reflect the inherent uncertainty in the central estimate, the central estimate being the expected value of outstanding claims.
Refer to Note 4.8 Accounting estimates and judgements and Note 4.9 Actuarial assumptions and methods for further detailed information.
2015$’000
2014$’000
Central estimate 242,938 202,800
Risk margin 34,045 28,074
Gross outstanding claims 276,983 230,874
(a) Reconciliation of changes in outstanding claims
2015$’000
2014$’000
Opening balance at 1 January 230,874 –
Balance acquired on 19 May 2014 – 229,505
Current period net claims incurred 112,710 50,310
Movement in non-reinsurance recoveries 12,358 –
Claims paid (78,959) (48,941)
Balance at 31 December 276,983 230,874
Current 202,181 182,214
Non-current 74,802 48,660
276,983 230,874

Genworth Mortgage Insurance Australia80
Notes to the financial statements (continued)
Section 4 Insurance contracts (continued)4.4 Outstanding claims (continued)(b) Claims development
Underwriting years
Prior years1 $’000
2007 $’000
2008 $’000
2009 $’000
2010 $’000
2011 $’000
2012 $’000
2013 $’000
2014 $’000
2015 $’000
Total $’000
At end of year of underwrite 204,831 9,303 8,438 4,393 701 992 1,079 1,021 777 1,424 232,959
One year later 150,229 39,265 44,511 19,629 7,004 6,668 7,805 6,825 12,917 294,853
Two years later 129,761 61,383 47,593 36,755 15,006 10,997 11,246 20,870 333,611
Three years later 106,406 45,634 52,954 47,621 9,744 9,990 24,535 296,884
Four years later 42,476 50,059 79,244 24,386 8,107 15,925 220,197
Five years later 34,904 61,174 31,875 16,589 23,971 168,513
Six years later 48,439 29,491 22,638 40,761 141,329
Seven years later 12,446 10,196 23,698 46,340
Eight years later (1,819) (11,264) (13,083)
All future years (40,129) (40,129)
Net incurred to date 687,544 295,241 310,951 190,134 64,533 44,572 44,665 28,716 13,694 1,424 1,681,474
Net paid to date 660,996 267,051 269,299 149,983 43,410 23,024 14,617 4,284 558 39 1,433,261
Outstanding claims provision at 31 December 2015 28,285 29,470 43,543 41,974 22,082 22,526 31,412 25,541 13,732 1,448 260,013
Recoveries on Paid Claims at 31 December 2015 1,737 1,280 1,891 1,823 959 978 1,364 1,109 596 63 11,800
Underwriting years
Prior years1 $’000
2007 $’000
2008 $’000
2009 $’000
2010 $’000
2011 $’000
2012 $’000
2013 $’000
2014 $’000
Total $’000
At end of year of underwrite 204,831 9,302 8,438 4,392 701 992 1,079 1,021 777 231,533
One year later 150,229 39,266 44,511 19,629 7,004 6,668 7,805 6,826 281,938
Two years later 129,761 61,383 47,593 36,755 15,005 10,997 11,246 312,740
Three years later 106,406 45,634 52,953 47,622 9,744 9,989 272,348
Four years later 42,476 50,058 79,244 24,386 8,107 204,271
Five years later 34,904 61,174 31,875 16,589 144,542
Six years later 48,439 29,491 22,639 100,569
Seven years later 12,446 10,196 22,642
All future years (1,819) (1,819)
Net incurred to date 727,673 306,505 287,253 149,373 40,561 28,646 20,130 7,847 777 1,568,764
Net paid to date 690,099 269,425 238,526 115,504 25,780 10,958 3,325 687 – 1,354,303
Outstanding claims provision at 31 December 2014 37,574 37,081 48,727 33,869 14,781 17,689 16,805 7,159 777 214,462
1 Prior 2007 underwriting years

81Annual Report 2015
(c) Reconciliation of claims development table to outstanding claims provision
2015$’000
2014$’000
Closing outstanding claims provision per claims development table 260,013 214,462
Non reinsurance recoveries 16,970 16,412
Gross closing outstanding claims provision 276,983 230,874
4.5 Non reinsurance recoveriesAccounting policiesReinsurance and other recoveries receivableReinsurance and other recoveries receivable on paid claims, reported claims not yet paid and IBNR claims are recognised as revenue. Recoveries receivable on paid claims are presented as part of non-reinsurance recoveries receivable net of any provision for impairment based on objective evidence for individual receivables. Recoveries receivable are assessed in a manner similar to the assessment of outstanding claims. Reinsurance does not relieve the Group of its liabilities to policyholders and reinsurance recoveries are, if applicable, presented as a separate asset on the statement of financial position.
2015$’000
2014$’000
Opening balance 16,412 –
Balance acquired on 19 May 2014 – 16,635
Movement of non-reinsurance recoveries 558 (223)
Borrower recoveries receivable recognised 11,800 –
Closing balance 28,770 16,412
When claims are paid, GMA typically obtains a legally enforceable judgement against borrowers for the amount of the loss incurred. GMA actively engages in collection activities to recover monies from borrowers under these judgements. Based on a history of successful collection activities over the last few years and current economic conditions, an expected recovery rate was established and a recovery accrual related to claims paid was recorded. This resulted in a $11.8 million increase in non-reinsurance recoveries receivable and a corresponding decrease in net claims incurred.

Genworth Mortgage Insurance Australia82
Notes to the financial statements (continued)
Section 4 Insurance contracts (continued)4.6 Unearned premiumAccounting policiesEarned and unearned premium revenuePremiums have been brought to account as income from the date of attachment of risk over periods up to 11 years based on an actuarial assessment of the pattern and period of risk. The earned portion of premium received is recognised as revenue. The balance of premium received is recorded as unearned premium.
Refer to Note 4.8 Accounting estimates and judgements for further detailed information.
31 December 2015
$’000
31 December 2014
$’000
Balance at 1 January 1,362,632 –
Balance acquired on 19 May 2014 – 1,292,801
Premiums incepted during the year 507,563 398,772
Premiums earned during the year (549,605) (328,941)
Balance as at 31 December 1,320,590 1,362,632
Current 423,944 391,427
Non-current 896,646 971,205
1,320,590 1,362,632
4.7 Liability adequacy testAccounting policiesThe liability adequacy test is an assessment of the carrying amount of the unearned premium liability and is conducted at each reporting date. If current estimates of the present value of the expected cash flows relating to future claims plus an additional risk margin to reflect the inherent uncertainty in the central estimate exceed the unearned premium liability less related deferred reinsurance and deferred acquisition costs, then the unearned premium liability is deemed to be deficient. The test is performed at the portfolio level of contracts that are subject to broadly similar risks and that are managed together as a single portfolio. Any deficiency is recognised in the statement of comprehensive income, with a corresponding impact in the statement of financial position, recognised first through the write down of related deferred acquisition costs and any remaining balance being recognised as an unexpired risk liability.
The liability adequacy test has identified a surplus in the portfolio of contracts that are subject to broadly similar risks.
The probability of sufficiency adopted in performing the liability adequacy test is set at the 75th percentile.
For the purposes of the liability adequacy test, the present value of expected future cash flows for future claims, including the risk margin, for the Group are as follows:
31 December 2015
$’000
31 December 2014
$’000
Discounted central estimate of premium liability 737,443 666,987
Risk margin – premium liability (75% PoS) 201,075 188,831
938,518 855,818

83Annual Report 2015
4.8 Accounting estimates and judgementsCritical accounting estimates and judgementsThe Group makes judgements, estimates and assumptions that affect the application of accounting policies and the reported amounts of assets, liabilities, income and expenses. Estimates and judgements are continually evaluated and are based on historical experience and other factors, including expectations of future events that are believed to be reasonable under the circumstances.
A data enhancement project was completed by the Company during the year in order to refine its assessment of risk emergence and to better inform both reserving practices and premium earning patterns. As a result of this project, the assumptions underlying the premium earning scale and the Incurred But Not Reported claims estimates have been refined. The assumption changes resulted in an increase in both the net earned premium and the outstanding claims estimates.
The areas where critical accounting estimates and judgements are applied are noted below.
Estimation of premium revenue/ unearned premium/ deferred acquisition costs (Note 3.1, Note 4.3 and Note 4.6)Premium is earned over periods of up to 10 years. The principle underlying the earning recognition is to derive a premium earning scale which recognises the premium in accordance with the incidence of claims risk.
The review of the premium earning scale is based on an analysis of the historical pattern of claims incurred and the pattern of policy cancellations. The estimate for unearned premiums is established on the basis of this earning scale. Assumptions recommended by the Appointed Actuary recognise that the unearned premium relating to cancelled policies is brought to account immediately.
Deferred acquisition costs are amortised under the same premium earnings scale as the related insurance contract.
Estimation of outstanding claims liabilities (Note 4.4)Provision is made for the estimated claim cost of reported delinquencies at the reporting date, including the cost of delinquencies incurred but not yet reported to the Group.
The estimated cost of claims includes direct expenses to be incurred in settling claims gross of expected third party recoveries. The Group takes all reasonable steps to ensure that it has appropriate information regarding its claims exposure. However, given the uncertainty in establishing claims provisions, it is likely that the final outcome will prove to be different from the original liability established.
A risk margin is added to the central estimate as an additional allowance for uncertainty in the ultimate cost of claims over and above the central estimate. The overall margin adopted by the Group is determined after considering the uncertainty in the portfolio, industry trends, the Group’s risk appetite and the margin corresponding with that appetite.
The estimation of IBNR is generally subject to a greater degree of uncertainty than the estimation of the cost of settling claims already notified to the Group, where more information about the claim event is generally available. IBNR claims may often not be apparent to the insured until some time after the events giving rise to the claims have happened.
In calculating the estimated cost of unpaid claims, the Group uses a variety of estimation techniques, generally based upon statistical analysis of historical experience, which assumes that the development pattern of the current claims will be consistent with past experience. Allowance is made, however, for changes or uncertainties which might create distortion in the underlying statistics or cause the cost of unsettled claims to increase or decrease when compared with the cost of previously settled claims.
Provisions are calculated gross of any recoveries. A separate estimate is made of the amounts that will be recoverable from lenders under specified arrangements. Estimates are also made for amounts recoverable from borrowers and property valuers, based upon the gross provisions.

Genworth Mortgage Insurance Australia84
Notes to the financial statements (continued)
Section 4 Insurance contracts (continued)4.9 Actuarial assumptions and methodsThe Group internally values the outstanding claims liabilities at the reporting date. The valuation approach is consistent with that recommended by the Appointed Actuary.
The valuation methods used are based on the underlying attributes of the claims portfolio. The Group establishes provisions for outstanding claims in two parts:
• delinquent loans advised to the Group; and
• IBNR.
For loans where the mortgagee is in possession and a claim has been submitted, the claimed amount adjusted for amounts not eligible to be claimed is provided. For loans where there is a MIP but a claim has not yet been submitted, case estimate based approach is used using the current outstanding loan balance including accumulated arrears adjusted for selling costs, the most recent property valuation, or an estimate thereof, and any amounts not eligible to be claimed.
The provision in respect of delinquent loans not in possession by the mortgagee is determined according to the following formula:
• outstanding loan amount multiplied by frequency factor multiplied by severity factor.
In applying this formula:
• the outstanding loan amount insured is the total outstanding amount on those loans advised to the Group by the lenders as being delinquent;
• the frequency and severity factors are based on a review of historical claims and delinquency experience performed by the Appointed Actuary and adopted by the Group.
Actuarial assumptions and processHistorical information relating to arrears and claims history for the Group is provided to the Appointed Actuary in order to determine the underlying assumptions. The Appointed Actuary examines all past underwriting years, including the mix of business by loan to value ratio and loan size band, the region in which the mortgaged property is located, product types, loan purpose and arrears duration.
Statistical modelling is used to identify significant explanatory factors affecting outcomes for frequency and severity based on historical claims experience.
The Appointed Actuary identifies significant explanatory factors affecting outcomes and incorporates this information into models for frequency and severity. The models incorporate past and anticipated movements in key variables to determine appropriate assumptions for reserving. The actuarial assumptions used in determining the outstanding claims liabilities other than MIPs are:
FrequencyWhile the propensity for a delinquent loan to become a claim varies for many explanatory factors (as determined by the Appointed Actuary’s analyses), the frequency basis is summarised on any given balance date and expressed so that it varies by LVR band and number of payments in arrears taking into account the average mix of effects of the other explanatory factors on the balance date. Additional loadings may be placed on these factors according to the geographic location, loan balance, External Dispute Resolution (those borrowers accessing ombudsman services or seeking legal representation) and the lender, to adjust for shorter-term expectations of frequency.
SeverityClaim severity varies according to the number of payments in arrears and the geographic region of the properties secured by the mortgages. Claim severity is expressed as a percentage of the outstanding loan amount at the arrears date.
The following average frequency and severity factors were used in the measurement of outstanding claims:
• Average frequency factor is 36% (2014: 36%)
• Average severity factor is 25% (2014: 24%)
IBNRThe IBNR provision is estimated by analysing the historical pattern of reported delinquencies.

85Annual Report 2015
Risk MarginThe risk margin is an additional allowance for uncertainty in the ultimate cost of claims over and above the central estimate determined on the bases set out above. The overall margin adopted by the Group is determined after considering the uncertainty in the portfolio, industry trends, the Group’s risk appetite and the margin corresponding with that appetite.
The Appointed Actuary reviews the factors impacting the portfolio to establish a recommended risk margin at the level required by the Group and APRA. Factors considered include:
• variability of claims experience of the portfolio;
• quality of historical data;
• uncertainty due to future economic conditions;
• diversification within the portfolio; and
• increased uncertainty due to future legislative changes.
A risk margin for outstanding claims of 15% (2014: 15%) of net central estimate has been assumed and is intended to achieve a 75% PoS.
No discounting has been applied to non-current claims on the basis that the effect is immaterial.
The weighted average term to settlement is approximately 23 months (2014: 21 months).
Sensitivity AnalysisThe valuation of outstanding claims incorporates a range of factors that involve interactions with economic indicators, statistical modelling and observed historical claims development. Certain variables are expected to impact outstanding claims liabilities more than others and consequently a greater degree of sensitivity to these variables is expected.
Future economic conditions and, in particular, house prices, interest rates and unemployment (for new delinquencies) impact frequency and, to a lesser extent, severity.
The actuarial result is based on the central estimate of the net outstanding claim liabilities. The impact on the profit and loss before income tax to changes in key actuarial assumptions is set out in the table below.
The upper and lower bounds of a 95% confidence interval of frequency and severity outcomes are applied as sensitivity factors. The impact of applying the sensitivities is asymmetric around the central estimate due to the assumed asymmetry of the distribution of outcomes of the net outstanding claim liabilities.
Impact on outstanding claims liabilities to changes in key variables
Change in variable
2015
Impact on outstanding
claims liabilities
2015$’000
Change in variable
2014
Impact on outstanding
claims liabilities
2014$’000
Frequency factor – upper 97.5th 18% 98,021 18% 82,728
Frequency factor – lower 2.5th –13% –71,367 –13% –59,326
Severity factor – upper 97.5th 7% 58,633 7% 51,326
Severity factor – lower 2.5th –6% –48,807 –5% –42,725
Claims handling expensesClaims handling expenses are estimated after considering historical actual expenses and management’s projected costs of handling claims over the weighted average term to settlement.

Genworth Mortgage Insurance Australia86
Notes to the financial statements (continued)
Section 4 Insurance contracts (continued)4.10 Capital adequacyAPRA’s Prudential Standard GPS 110 Capital Adequacy requires additional disclosure in the annual financial statements to improve policyholder and market understanding of the capital adequacy of the companies in the Group.
When an insurer is a controlled entity of an authorised non-operating holding company (NOHC), the Level 2 Group comprises the authorised NOHC and its controlled entities. The Company became the authorised NOHC for the Level 2 Group after acquiring 100% ownership of all Australian subsidiaries as a result of the IPO reorganisation structure.
The following companies comprise the APRA Level 2 Group:
Genworth Financial Mortgage Insurance Finance Pty Limited
Genworth Financial New Holdings Pty Ltd
Genworth Financial Mortgage Insurance Holdings Pty Limited
Genworth Financial Mortgage Insurance Pty Limited
Genworth Financial Services Pty Limited
Genworth Financial Mortgage Indemnity Limited
Genworth Financial Australia Holdings, LLC
The calculation for Prescribed Capital Amount (PCA) for the APRA Level 2 Group provided below is based on the APRA Level 2 Group requirements.
31 December 2015
$’000
31 December 2014
$’000
Tier 1 capital
Paid-up ordinary shares 1,556,470 1,706,467
Other reserves (471,038) (472,727)
Retained earnings 1,133,316 1,266,734
Less: Deductions (20,258) (19,490)
Net surplus relating to insurance liabilities 152,720 261,114
Net Tier 1 capital 2,351,210 2,742,098
Tier 2 capital 249,600 112,000
Total capital base 2,600,810 2,854,098
Insurance risk charge 226,642 202,082
Insurance concentration risk charge 1,344,181 1,498,461
Asset risk charge 76,930 127,998
Asset concentration risk charge – –
Operational risk charge 27,679 24,083
Aggregation benefit (37,086) (60,521)
Total PCA 1,638,346 1,792,103
PCA coverage 1.59 1.59

87Annual Report 2015
Section 5 Capital management and financing5.1 Capital managementThe capital management strategy plays a central role in managing risk to create shareholder value, whilst meeting the crucial and equally important objective of providing an appropriate level of capital to protect both policyholders’ and lenders’ interests and satisfy regulators. Capital finances growth, capital expenditure and business plans and also provides support in the face of adverse outcomes from insurance and other activities and investment performance.
The determination of the capital amount and mix is built around three core considerations. The Group aims to hold capital to meet the highest requirements derived from these three considerations:
(a) Regulatory capitalThe regulated controlled entities are subject to APRA’s prudential standards, which set out the basis for calculating the Prescribed Capital Requirement, the minimum level of capital that the regulator deems must be held to meet policyholder obligations. The capital base is expected to be adequate for the size, business mix, complexity and risk profile of the business and, as such, the PCR utilises a risk based approach to capital adequacy. The PCR is the sum of the capital charges for insurance, investments and other assets, investment concentration, operational and catastrophe concentration risk plus any supervisory adjustment imposed by APRA.
It is the Group’s policy to hold regulatory capital levels in excess of the PCR. The Group maintains sufficient capital to support the PCR, which is APRA’s derivation of the required capital to meet a 1 in 200 year risk of absolute ruin, and has at all times during the current and prior financial year complied with the externally imposed capital requirements to which it is subject.
Capital calculations for regulatory purposes are based on a premium liabilities model which is different from the deferral and matching model which underpins the measurement of assets and liabilities in the financial statements. The premium liabilities model estimates future expected claim payments arising from future events insured under existing policies. This differs from the measurement of the outstanding claims liabilities on the statement of financial position, which considers claims relating to events that have occurred up to and including the reporting date.
On 3 July 2015, the Company’s wholly owned subsidiary, GFMI issued $200,000,000 of 10 year, non-call 5 subordinated notes. The notes qualify as Tier 2 Capital under APRA’s capital adequacy framework.
In connection with the 3 July 2015 issue of subordinated notes, GFMI redeemed $90,000,000 of its existing $140,000,000 subordinated notes, which have a first call date of 30 June 2016. Refer to Note 5.2 Interest bearing liabilities for further information.
(b) Ratings capitalThe controlled entities maintain their capital strength by reference to a target financial strength rating from an independent ratings agency. The ratings help to reflect the financial strength of these entities and demonstrate to stakeholders their ability to pay claims.
Standard & Poor’sOn 30 November 2015, S&P affirmed GFMI financial strength and issuer credit rating at ‘A+’ and ‘stable’.
On 1 December 2015, S&P withdrew the financial strength and credit ratings on Genworth Financial Mortgage Indemnity Ltd at Genworth Australia’s request following Genworth Australia’s review of the benefits of continuing to having this run-off entity rated.
Moody’sOn 20 February 2015, Moody’s reaffirmed the insurance financial strength rating of both GFMI and Genworth Financial Mortgage Indemnity Ltd at ‘A3.’ On 16 December 2015, Moody’s issued a credit opinion which maintained this insurance financial strength rating and outlook.
Fitch RatingsOn 5 August 2015, Fitch Ratings (Fitch) affirmed its insurer financial strength rating of GFMI assigning an ‘A+’ rating.
(c) Economic capitalIn conjunction with the considerations set out above, which are important to the functioning of the business, consideration is given to the capital needs of the business through ongoing operations.

Genworth Mortgage Insurance Australia88
Notes to the financial statements (continued)
Section 5 Capital management and financing (continued)5.2 Interest bearing liabilitiesAccounting policiesInterest bearing liabilities are initially recognised at fair value less transaction costs that are directly attributable to the transaction. After initial recognition the liabilities are carried at amortised cost using the effective interest rate method.
Finance related costs include interest, which is accrued at the contracted rate and included in payables, and amortisation of transaction costs which are capitalised, presented together with borrowings, and amortised over the life of the borrowings. This cost also includes the write off of capitalised transaction costs and premium paid on the early redemption of borrowings.
31 December 2015
$’000
31 December 2014
$’000
Subordinated notes
$140 million subordinated notes (A) 49,619 140,000
$200 million subordinated notes (B) 200,000 –
Less: capitalised transaction costs (5,203) (1,425)
244,416 138,575
(A) On 3 July 2015, GFMI redeemed $90,000,000 of its existing $140,000,000 subordinated notes, which have a first call date of 30 June 2016. GFMI incurred a $2.4 million one-time premium fee paid on the early redemption of the subordinated notes which was included under finance related costs.
Key terms and conditions are:
• Interest is payable quarterly in arrears, with the rate each calendar quarter being the average of the 90 day bank bill swap rate at the end of the prior quarter plus a margin equivalent to 4.75% per annum; and
• The notes mature on 30 June 2021 (non-callable for the first 5 years) with the issuer having the option to redeem at par from 30 June 2016. Redemption at maturity, or any earlier date provided for in the terms and conditions of issue, is subject to prior approval by APRA.
(B) On 3 July 2015, GFMI issued $200,000,000 of 10 year, non-call 5 subordinated notes. The notes qualified as Tier 2 Capital under the APRA’s capital adequacy framework.
Key terms and conditions are:
• Interest is payable quarterly in arrears, with the rate each calendar quarter being the average of the 90 day bank bill swap rate at the end of the prior quarter plus a margin equivalent to 3.5% per annum; and
• The notes mature on 3 July 2025 (non-callable for the first 5 years) with the issuer having the option to redeem at par from 3 July 2020. Redemption at maturity, or any earlier date provided for in the terms and conditions of issue, is subject to prior approval by APRA.

89Annual Report 2015
5.3 Equity(a) Share capital
31 December 2015
$’000
31 December 2014
$’000
Issued fully paid capital
Opening balance 1,706,467 –
Issuance of share capital 650,000,000 ordinary shares – 1,706,467
Buy-back shares, net of transaction costs (149,997) –
Balance at 31 December 1,556,470 1,706,467
The Company’s issued shares do not have a par value. All ordinary shares are fully paid. Ordinary shares have the right to receive dividends as declared and, in the event of winding up the Company, to participate in the proceeds from the sale of all surplus assets in proportion to the number of and amounts paid up on shares held.
Ordinary shares entitle their holder to one vote, either in person or by proxy, at a meeting of the Company.
Issued fully paid capital of $1,706,467,000 represents issuance of 650,000,000 ordinary shares at $2.65 less the underwriting costs of $16,033,000.
On-market buy-backOn 30 October 2015, GMA announced its intention to commence, with effect from 16 November 2015, an on-market share buy-back program for shares up to a maximum equivalent value of $150 million.
As at 31 December 2015, GMA has acquired 54,600,000 of shares for a total consideration of $150 million.
(b) Share based payment reserve
31 December 2015
$’000
31 December 2014
$’000
Opening balance 3,832 –
Balance acquired on 19 May 2014 – 1,954
Share-based payment expense 2,515 3,315
Share-based payment settled (1,293) (1,437)
Share-based payment expense to be recharged back to the major shareholder 467 –
Closing balance 5,521 3,832
Refer to Note 7.6 Share based payments for further detailed information.
5.4 Capital commitments and contingenciesAccounting policiesThe Group leases property and equipment under operating leases where the lessor retains substantially all the risks and benefits of ownership of the leased items, expiring from one to five years. The leases have varying terms, escalation clauses and renewal rights. On renewal, the terms of the leases are renegotiated. Lease payments comprise a base amount plus an incremental contingent rental. Contingent rentals are based on movements in the Consumer Price Index. Lease payments are recognised as an expense in profit and loss on a straight line basis over the term of these leases. Lease incentives received are recognised as an integral part of the total lease expense over the term of the lease.

Genworth Mortgage Insurance Australia90
Notes to the financial statements (continued)
Section 5 Capital management and financing (continued)5.4 Capital commitments and contingencies (continued)Accounting policies (continued)Operating lease commitments
31 December 2015
$’000
31 December 2014
$’000
The estimated future amounts of operating lease commitments not provided for in the financial statements are payable:
Within one year 6,491 6,368
One year or later and no later than five years 9,988 16,760
16,479 23,128
ContingenciesThere were no contingent liabilities as at 31 December 2015.
5.5 Other reserves
31 December 2015
$’000
31 December 2014
$’000
Opening balance (476,559) –
Common control transaction – (476,559)
(476,559) (476,559)
Under the pre IPO Group structure, there was no single Australian company with 100% control of Genworth’s Australian subsidiaries. As part of the reorganisation plan, a corporate reorganisation was undertaken to reorganise the intragroup debt and equity funding arrangements and to facilitate the repayment of funding arrangements with the Genworth Financial Group. The following steps were applied to reflect the reorganisation plan:
• $450 million of preference shares issued by Genworth Financial New Holdings Pty Ltd and held by GFI were transferred to the Group. As a result, the Preference Shares were eliminated in the consolidated statements of financial position;
• The receivable associated with a loan provided by GFI to Genworth Financial Australia Holdings, LLC was transferred to the Group. As a result, the loan receivable was eliminated in the consolidated statements of financial position; and
• $720 million short-term note provided by GFI to the Group was repaid with the proceeds of the Offer.
Following the implementation of the reorganisation plan, the Company became the holding company of the Group and the following entities were consolidated to form the Group:
• Genworth Financial Mortgage Insurance Pty Limited;
• Genworth Financial Mortgage Indemnity Limited;
• Genworth Financial Services Pty Limited;
• Genworth Financial Mortgage Insurance Holdings Pty Limited;
• Genworth Financial Mortgage Insurance Finance Holdings Limited;
• Genworth Financial Mortgage Insurance Finance Pty Limited;
• Genworth Financial New Holdings Pty Limited; and
• Genworth Financial Australia Holdings, LLC.
The Group has determined that the reorganisation represents a business combination involving entities under common control and therefore the Group is not required to account for the reorganisation as a business combination under AASB 3 Business combinations. The reorganisation involved transactions with owners from which no goodwill arises; therefore any difference in these transactions is recognised directly in equity as other reserves.
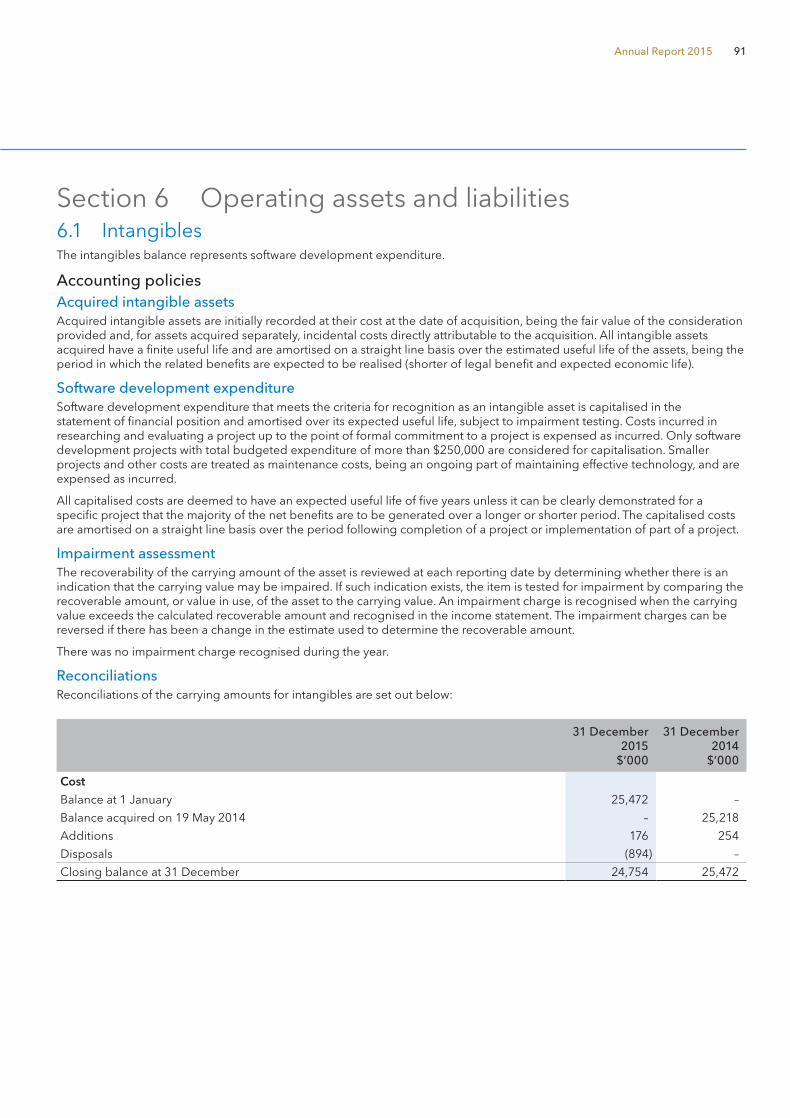
91Annual Report 2015
Section 6 Operating assets and liabilities6.1 IntangiblesThe intangibles balance represents software development expenditure.
Accounting policiesAcquired intangible assetsAcquired intangible assets are initially recorded at their cost at the date of acquisition, being the fair value of the consideration provided and, for assets acquired separately, incidental costs directly attributable to the acquisition. All intangible assets acquired have a finite useful life and are amortised on a straight line basis over the estimated useful life of the assets, being the period in which the related benefits are expected to be realised (shorter of legal benefit and expected economic life).
Software development expenditureSoftware development expenditure that meets the criteria for recognition as an intangible asset is capitalised in the statement of financial position and amortised over its expected useful life, subject to impairment testing. Costs incurred in researching and evaluating a project up to the point of formal commitment to a project is expensed as incurred. Only software development projects with total budgeted expenditure of more than $250,000 are considered for capitalisation. Smaller projects and other costs are treated as maintenance costs, being an ongoing part of maintaining effective technology, and are expensed as incurred.
All capitalised costs are deemed to have an expected useful life of five years unless it can be clearly demonstrated for a specific project that the majority of the net benefits are to be generated over a longer or shorter period. The capitalised costs are amortised on a straight line basis over the period following completion of a project or implementation of part of a project.
Impairment assessmentThe recoverability of the carrying amount of the asset is reviewed at each reporting date by determining whether there is an indication that the carrying value may be impaired. If such indication exists, the item is tested for impairment by comparing the recoverable amount, or value in use, of the asset to the carrying value. An impairment charge is recognised when the carrying value exceeds the calculated recoverable amount and recognised in the income statement. The impairment charges can be reversed if there has been a change in the estimate used to determine the recoverable amount.
There was no impairment charge recognised during the year.
ReconciliationsReconciliations of the carrying amounts for intangibles are set out below:
31 December 2015
$’000
31 December 2014
$’000
Cost
Balance at 1 January 25,472 –
Balance acquired on 19 May 2014 – 25,218
Additions 176 254
Disposals (894) –
Closing balance at 31 December 24,754 25,472

Genworth Mortgage Insurance Australia92
Notes to the financial statements (continued)
Section 6 Operating assets and liabilities (continued)6.1 Intangibles (continued)Accounting policies (continued)Reconciliations (continued)
31 December 2015
$’000
31 December 2014
$’000
Accumulated amortisation and impairment losses
Balance at 1 January (22,670) –
Balance acquired on 19 May 2014 – (19,770)
Amortisation (1,848) (2,900)
Disposals 790 –
Closing balance at 31 December (23,728) (22,670)
Total net intangibles 1,026 2,802
6.2 GoodwillAccounting policiesBusiness combinations are accounted for by applying the purchase method. Goodwill represents the difference between the cost of the acquisition and the fair value of the net identifiable assets acquired.
Goodwill is stated at deemed cost less any accumulated impairment losses.
The carrying value of goodwill is tested for impairment at each reporting date. The impairment test involves the use of accounting estimates and assumptions. The recoverable amount of the cash generating unit is determined on the basis of value in use calculation which is performed on a pre-tax basis. The present value of future cash flow projections is based on the most recent management approved budgets, which generally do not forecast beyond five years. The carrying value of identifiable intangible assets is deducted from the value generated in the cash flow projections to arrive at a recoverable value for goodwill, which is then compared with the carrying value of goodwill.
31 December 2015
$’000
31 December 2014
$’000
Goodwill – at deemed cost 9,123 9,123
6.3 Employee benefits provisionAccounting policiesThe carrying amount of provisions for employee entitlements approximates fair value.
Wages, salaries and annual leaveThe accruals for employee entitlements to wages, salaries and annual leave represent present obligations resulting from employees’ services provided up to the statement of financial position date, calculated at undiscounted amounts based on wage and salary rates that the entity expects to pay as at reporting date including related on-costs.
Long service leaveThe Company’s net obligation in respect of long-term benefits other than pension plans is the amount of future benefit that employees have earned in return for their service in the current and prior periods. A liability for long service leave is recognised as the present value of estimated future cash outflows to be made in respect of services provided by employees up to the reporting date. The estimated future cash outflows are discounted using interest rates on national government guaranteed securities which have terms to maturity that match, as closely as possible, the estimated future cash outflows. Factors which affect the estimated future cash outflows such as expected future salary increases including related on-costs and expected settlement dates are incorporated in the measurement.

93Annual Report 2015
Superannuation commitmentsThe Group has a defined contribution superannuation plan. Employees are entitled to varying levels of benefits on retirement based on accumulated employer contributions and investment earnings thereon as well as benefits in the event of disability or death. Contributions by the Group are, as a minimum, in accordance with the Superannuation Guarantee Levy.
31 December 2015
$’000
31 December 2014
$’000
Annual leave 2,666 3,078
Long service leave 4,144 4,339
6,810 7,417
Current 4,760 5,123
Non-current 2,050 2,294
6,810 7,417
As at the balance date there were 259 employees (2014: 324)
6.4 Trade and other receivablesAccounting policiesThe collectability of receivables is assessed at balance date and an impairment loss is made for any doubtful accounts.
31 December 2015
$’000
31 December 2014
$’000
Other debtors 2,831 3,701
Current 2,831 3,701
Carrying amounts of receivables reasonably approximate fair value at the reporting date. None of the receivables are impaired or past due.
6.5 Trade and other payablesAccounting policiesLiabilities are recognised for amounts to be paid in the future for goods or services received. Trade accounts payable are normally settled within 30-60 days. The carrying amount of accounts payable approximates fair value.
31 December 2015
$’000
31 December 2014
$’000
Accrued expenses 41,452 21,656
Related party payables 22,479 78,190
Interest payable 2,711 57
Trade creditors and other payables 11,016 15,457
77,658 115,360
Current 68,138 115,060
Non-current 9,520 300
77,658 115,360
Included in the related party payables are the balances related to taxes payable to the head entity of $21,835,000 (2014: $77,437,000). Under the tax consolidation system, current tax liabilities recognised for the year by the Group are assumed by the head entity in the tax consolidated group.

Genworth Mortgage Insurance Australia94
Notes to the financial statements (continued)
Section 6 Operating assets and liabilities (continued)6.6 Cash and cash equivalentsAccounting policiesCash and cash equivalents includes cash on hand, deposits held at call with financial institutions and other short-term and highly liquid investments with original maturities of three months or less that are readily convertible to known amounts of cash and that are subject to an insignificant risk of changes in value. Cash and cash equivalents are measured at fair value, being the principal amount.
Cash at the end of the financial year as shown in the statement of cash flows is reconciled to the related items in the statement of financial position as follows:
2015$’000
2014$’000
Cash assets 78,114 88,596
78,114 88,596
Section 7 Other disclosures7.1 Parent entity disclosures
2015$’000
2014$’000
Result of the parent entity
Profit for the period 263,977 264,217
Total comprehensive income for the period 263,977 264,217
Financial position of parent entity
Current assets 213,061 3,709
Total assets 2,149,534 2,388,254
Current liabilities (18,752) (11,631)
Total liabilities (18,752) (11,631)
Net assets 2,130,782 2,376,623
Total equity of the parent entity comprising of:
Share capital 1,556,470 1,706,467
Retained earnings 148,595 246,017
Share based payment 3,264 1,686
Other reserves 422,453 422,453
Total equity 2,130,782 2,376,623
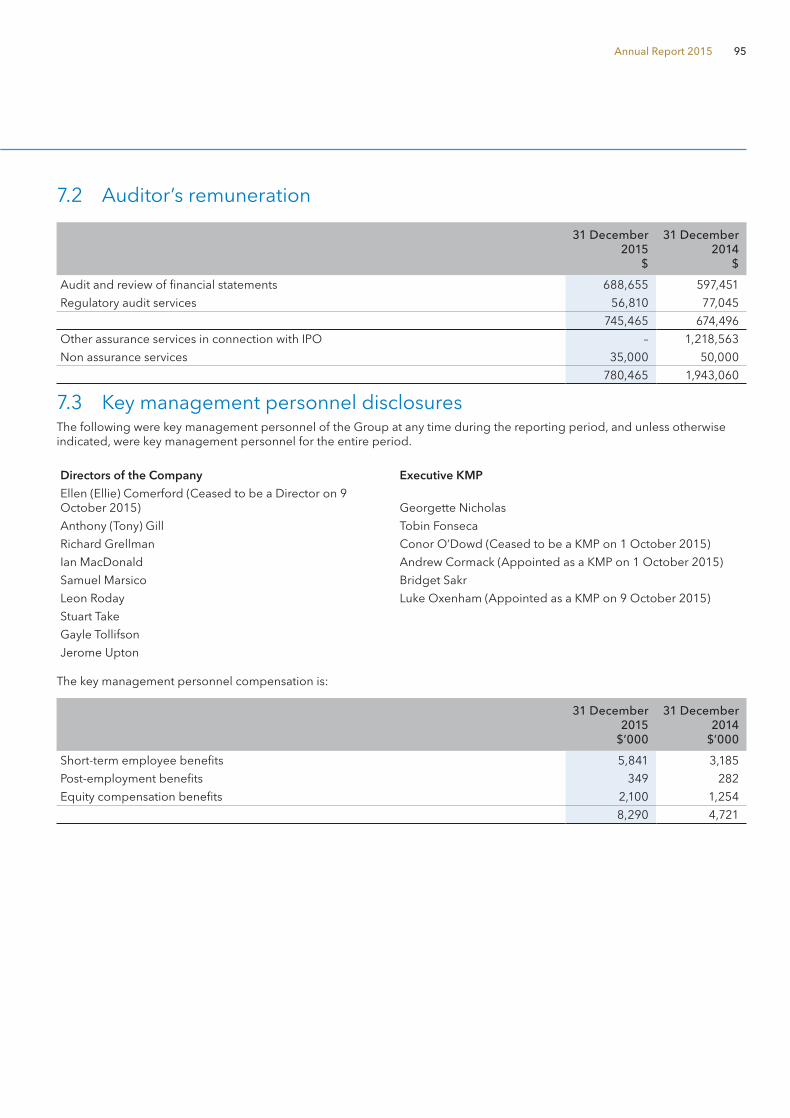
95Annual Report 2015
7.2 Auditor’s remuneration
31 December 2015
$
31 December 2014
$
Audit and review of financial statements 688,655 597,451
Regulatory audit services 56,810 77,045
745,465 674,496
Other assurance services in connection with IPO – 1,218,563
Non assurance services 35,000 50,000
780,465 1,943,060
7.3 Key management personnel disclosuresThe following were key management personnel of the Group at any time during the reporting period, and unless otherwise indicated, were key management personnel for the entire period.
Directors of the Company Executive KMP
Ellen (Ellie) Comerford (Ceased to be a Director on 9 October 2015) Georgette Nicholas
Anthony (Tony) Gill Tobin Fonseca
Richard Grellman Conor O’Dowd (Ceased to be a KMP on 1 October 2015)
Ian MacDonald Andrew Cormack (Appointed as a KMP on 1 October 2015)
Samuel Marsico Bridget Sakr
Leon Roday Luke Oxenham (Appointed as a KMP on 9 October 2015)
Stuart Take
Gayle Tollifson
Jerome Upton
The key management personnel compensation is:
31 December 2015
$’000
31 December 2014
$’000
Short-term employee benefits 5,841 3,185
Post-employment benefits 349 282
Equity compensation benefits 2,100 1,254
8,290 4,721

Genworth Mortgage Insurance Australia96
Notes to the financial statements (continued)
Section 7 Other disclosures (continued)7.4 Related party disclosuresTransactions with related parties are undertaken on normal commercial terms and conditions.
Corporate overheadOn settlement of the Company‘s IPO, the Group entered into certain agreements with Genworth Financial and its affiliates. Under the agreements GFI will provide certain services to the Group, with most services being terminated if GFI ceases to beneficially own more than 50% of the common shares of the Company or at the request of either party at annual successive renewal terms after the initial term ends on 31 December 2016. The services rendered by GFI and affiliated companies consist of finance, human resources, legal and compliance, investment services, information technology and other specified services. These transactions are in the normal course of business and accordingly are measured at fair value. Payment for these service transactions are non-interest bearing and are settled on a quarterly basis. The Group incurred net charges of $5,581,000 (2014: $3,817,000) for the year ended 31 December 2015. There is a payable balance of $468,000 (2014: $792,000) as at 31 December 2015.
Share buy-backGFI participated in on-market sale transactions during the buy-back program to maintain the approximately 52% stake in the Group. GFI has sold 28.4 millions of shares for a total consideration of $76.7 million as at 31 December 2015. Refer to Note 5.3 Equity for further details.
Other related party transactionsCertain non-executive directors of the Group were employed by the major shareholder, GFI, during the financial year. Costs of services provided by these directors were not charged to the Group.
Major shareholder and its ultimate parent entityThe major shareholder of the Group is Genworth Financial International Holdings, LLC & Genworth Holdings, Inc. (as partners of the Genworth Australian General Partnership) representing 51.95% ownership. The ultimate parent entity of AGP is GFI which is incorporated in Delaware, United States of America.
7.5 Controlled entitiesAccounting policiesSubsidiaries are entities controlled by the Company. Control exists when the Company is exposed, or has rights, to variable returns from its involvement with the entity and has the ability to affect those returns through its power over the entity. In assessing control, the Company considers the purpose and design of each entity in order to identify the relevant activities, how decisions about the relevant activities are made, who has the ability to direct those activities and who receives the returns from those activities. The financial statements of controlled entities are included from the date control commences until the date control ceases.

97Annual Report 2015
The consolidated financial statements incorporate the assets, liabilities and results of the following controlled entities.
Country of incorporation
Equity holding (%)
Name of entityClass of
shares 2015 2014
Genworth Financial Mortgage Insurance Holdings Pty Limited Australia Ordinary 100 100
Genworth Financial Mortgage Insurance Pty Limited Australia Ordinary 100 100
Genworth Financial Services Pty Limited Australia Ordinary 100 100
Genworth Financial Mortgage Indemnity Limited Australia Ordinary 100 100
Genworth Financial Mortgage Insurance Finance Pty Limited Australia Ordinary 100 100
Genworth Financial Mortgage Insurance Finance Holdings Pty Limited Australia Ordinary 100 100
Genworth Financial New Holdings Pty Limited Australia Ordinary 100 100
Genworth Financial Australia Holdings, LLC Australia Ordinary 100 100
7.6 Share based paymentsAccounting policiesShare-based payment transactionsShare based remuneration is provided in various forms to eligible employees and executive Directors of the Group in compensation for services provided to the Group.
The fair value at the grant date, being the date both the employee and the employer agree to the arrangement, is determined using a Black Scholes model based on the share price at grant date and the vesting conditions. The fair value does not change over the life of the instrument. At each reporting period during the vesting period and upon final vesting or expiry of the equity instruments, the total accumulated expense is revised based on the fair value at grant date and the latest estimate of the number of equity instruments that are expected to vest based on the vesting conditions, and taking into account the expired portion of the vesting period. The movement in the total of accumulated expenses from the previous reporting date is recognised in the profit and loss with a corresponding movement in the share based payment reserve.
To satisfy obligations under the various share based remuneration plans, shares are generally expected to be equity settled.
Share Rights PlanOn 21 May 2014, the Group granted restricted share rights to a number of key employees including executive KMP. The aggregate amount of these share rights was $7,265,000. One third of the share rights granted during the year vest on each of the second, third and fourth anniversaries of the grant date. If at any time an employee ceases continuous service with the Group, any unvested share rights are immediately cancelled, except in cases of retirement, redundancy, total and permanent disability or death.
In addition to the grants to key employees, other employees were granted an amount of share rights in the aggregate amount of $276,000. All share rights granted to other employees vest on the third anniversary of the grant date. If at any time an employee ceases continuous service with the Group, any unvested share rights vest immediately. The aggregate amount of $276,000 was expensed during the year ended 31 December 2014.
On 7 May 2015, the Group granted additional share rights in the aggregate amount of $509,967 to 16 employees. One fourth of the share rights vest on each of the four vesting dates, which are 1 March 2016, 1 March 2017, 1 March 2018 and 1 March 2019.

Genworth Mortgage Insurance Australia98
Notes to the financial statements (continued)
Section 7 Other disclosures (continued)7.6 Share based payments (continued)Accounting policies (continued)Share Rights Plan (continued)The fair value of the share rights is calculated as at the grant date using a Black Scholes valuation. The factors and assumptions used for the valuation are summarised in the below table:
2015 2014
Grant date 7/5/2015 21/5/2014
Share price on grant date ($) $3.09 $2.95
Dividend yield 11.16% 7.8%
Risk free rate (%) Tranche 1: 2.03% Tranche 1: 2.60%
Tranche 2: 2.03% Tranche 2: 2.71%
Tranche 3: 2.20% Tranche 3: 3.08%
Tranche 4: 2.35%
Vesting dates Tranche 1: 1 March 2016 Tranche 1: 20 May 2016
Tranche 2: 1 March 2017 Tranche 2: 20 May 2017
Tranche 3: 1 March 2018 Tranche 3: 20 May 2018
Tranche 4: 1 March 2019
Key terms and conditions:• The rights are granted for nil consideration.
• Holders do not receive dividends and do not have voting rights until the rights are exercised.
Details of the number of employee share rights granted, exercised and forfeited or cancelled during the year were as follows:
2015 Grant date
Balance at 1 January
2015Granted in
the yearExercised in
the year (*)
Cancelled/forfeited in
the year
Balance at 31 December
2015
Vested and exercisable at
end of the year
Number Number Number Number Number Number
21/05/2014 2,703,775 – (11,278) (137,779) 2,554,698 –
21/05/2014 99,250 (28,374) – 70,876 –
7/5/2015 – 147,115 (7,211) 139,904 –
Total 2,803,025 147,115 39,652 (144,990) 2,765,478 –
2014 Grant date
Balance at 1 January
2014Granted in
the yearExercised in
the year (*)
Cancelled/forfeited in
the year
Balance at 31 December
2014
Vested and exercisable
at end of the year
Number Number Number Number Number Number
21/05/2014 – 2,741,509 – (37,734) 2,703,775 –
21/05/2014 – 104,151 (4,901) – 99,250 –
Total – 2,845,660 (4,901) (37,734) 2,803,025 –

99Annual Report 2015
Long-term incentive planThe Group implemented a long term incentive plan for executive KMP which is performance oriented and reflects local market practice.
On 7 May 2015, the Group granted share rights in the aggregate amount of $1,822,777 to senior management employees.
Key terms and conditions:• The rights are granted for nil consideration.
• Holders do not receive dividends and do not have voting rights until the rights are exercised.
• Each allocation is split equally into two portions which are subject to different performance hurdles with a twelve month deferral period after the performance period ends. The vesting conditions are as follows:
• 50% is subject to a return on equity hurdle (ROE allocation)
• 50% is subject to an earnings per share hurdle (EPS allocation)
• The number of share rights offered is determined by dividing the grant value of the 2015 long term incentive plan by $3.47, being the 10-day volume weighted average price (VWAP) of the Company share price following the release of full-year results for 2014, rounded down to the nearest whole share right. Each share right is a right granted to acquire a fully paid ordinary share of the Company.
• The fair value of the share rights is the share price as at the grant date.
If an employee ceases employment with the Group before the performance conditions are tested, their unvested rights will generally lapse.
Details of the number of employee share rights granted, exercised and forfeited or cancelled during the year were as follows:
Grant date
Balance at 1 January
2015Granted in
the yearExercised in
the year
Cancelled/forfeited in
the year
Balance at 31 December
2015
Vested and exercisable
at end of the year
Number Number Number Number Number Number
7/5/2015 – 525,834 – – 525,834 –
22/6/2015 – 7,737 – – 7,737 –
Total – 533,571 – – 533,571 –
Omnibus Incentive PlanGFI, GFMI and LLC entered into a Cost Agreement on 15 July 2005 (as varied from time to time) pursuant to which GFI agreed to offer its 2004 Omnibus Incentive Plan and its 2012 Omnibus Incentive Plan (Omnibus Incentive Plans) to certain employees of GFMI and LLC.
Under the Omnibus Incentive Plans, GFI issues stock options, stock appreciation rights, restricted stock, restricted stock units, other stock based awards and dividend equivalent awards with respect to its common stock to employees of its affiliates throughout the world. Under the Cost Agreement, GFMI and LLC have agreed to bear the costs for their employees’ participation in the Omnibus Incentive Plans from time to time. Employees of GFMI and LLC will not, following the IPO, receive any further awards under the Omnibus Incentive Plans. Any incentives after that date will be provided through the Group’s share rights plan. However, GFMI and LLC will continue to bear the costs of past awards under the Omnibus Incentive Plans. The Group has reserved for such costs and the amount of the reserve is marked to market to reflect the Group’s exposure to those costs having regard to the price of GFI shares.

Genworth Mortgage Insurance Australia100
Notes to the financial statements (continued)
Section 7 Other disclosures (continued)7.6 Share based payments (continued)Accounting policies (continued)Omnibus Incentive Plan (continued)Details of the number of employee options granted, exercised and forfeited or cancelled during the year were as follows:
2015 Grant date Expiry date
Exercise price
Balance at 1 January
2015Granted in
the yearExercised
in the year
Cancelled/forfeited
in the year
Balance at 31
December 2015
Vested and exercisable
at end of the year
Number Number Number Number Number Number
20/07/2005 20/07/2015 44.04 2,400 – – 2,400 – –
09/08/2006 09/08/2016 46.82 6,600 – – 6,600 6,600
13/02/2008 13/02/2018 31.28 7,800 – – 7,800 7,800
12/02/2009 12/02/2019 3.37 20,500 – 3,000 17,500 17,500
19/08/2009 20/07/2015 10.70 99 – – 99 – –
19/08/2009 09/08/2016 10.70 3,049 – – 3,049 3,049
19/08/2009 31/07/2017 10.70 2,450 – – 2,450 2,450
19/08/2009 13/02/2018 10.70 6,288 – – 6,288 6,288
10/02/2010 10/02/2020 19.45 48,600 – – 48,600 48,600
09/02/2011 09/02/2021 17.49 38,500 – – 38,500 38,500
14/02/2012 14/02/2022 12.18 46,800 – – 46,800 35,100
15/02/2013 15/02/2023 12.43 46,500 – – 46,500 23,250
20/02/2014 20/02/2024 20.89 14,000 – – 14,000 3,500
Total 243,586 – 3,000 2,499 238,087 192,637
Weighted average exercise price $16.07 3.37 42.72 $15.95 $16.34
Balance at 1 January 2015 is adjusted for options granted in prior periods to employees who transferred into/out of the Group during the year.

101Annual Report 2015
2014 Grant date Expiry date
Exercise Price
Balance at 1
January 2014
Balance acquired
on 19 May 2014
Granted in the
year
Exercised in the
year
Cancelled/forfeited
in the year
Balance at 31
December 2014
Vested and exercisable
at end of the year
Number Number Number Number Number Number Number
25/05/2004 25/05/2014 23.9 – 24,180 – – 24,180 – –
20/07/2005 20/07/2015 39.34 – 2,400 – – – 2,400 2,400
09/08/2006 09/08/2016 41.83 – 6,600 – – – 6,600 6,600
13/02/2008 13/02/2018 27.94 – 7,800 – – – 7,800 7,800
12/02/2009 12/02/2019 3.01 – 20,500 – – – 20,500 20,500
19/08/2009 25/05/2014 9.56 – 1,552 – 1,552 – – –
19/08/2009 20/07/2015 9.56 – 398 – 299 – 99 99
19/08/2009 09/08/2016 9.56 – 1,248 – 199 – 1,049 1,049
19/08/2009 03/10/2016 9.56 – 1,110 – 1,110 – – –
19/08/2009 31/07/2017 9.56 – 2,149 – 2,149 – – –
19/08/2009 13/02/2018 9.56 – 6,300 – 3,750 – 2,550 2,550
12/02/2010 12/02/2020 17.38 – 37,800 – – 1,200 36,600 36,600
09/02/2011 09/02/2021 15.63 – 30,000 – – – 30,000 22,500
14/02/2012 14/02/2022 10.88 – 35,100 – – – 35,100 17,550
15/02/2013 15/02/2023 11.10 – 33,000 – – – 33,000 8,250
Total – 210,137 – 9,059 25,380 175,698 125,898
Weighted average exercise price – $15.34 – $9.56 $23.59 12.08 $9.31
Balance at 1 January 2014 is adjusted for options granted in prior periods to employees who transferred into/out of the Group during the year.

Genworth Mortgage Insurance Australia102
Notes to the financial statements (continued)
Section 7 Other disclosures (continued)7.6 Share based payments (continued)Accounting policies (continued)Omnibus Incentive Plan (continued)Details of the number of employee RSUs granted, exercised and forfeited or cancelled during the year were as follows:
2015 Grant date
Balance at 1 January
2015Granted in
the yearExercised
in the year
Cancelled/forfeited in
the year
Balance at 31
December 2015
Vested and exercisable
at end of the year
Number Number Number Number Number Number
07/02/2007 2,500 – 2,500 – – –
01/03/2011 5,000 – 5,000 – – –
02/09/2011 10,477 – 10,477 – – –
03/01/2012 7,500 – 3,750 – 3,750 –
06/01/2012 2,500 – 1,250 – 1,250 –
11/01/2012 12,500 – 6,250 – 6,250 –
14/02/2012 37,863 – 18,933 1,249 17,681 –
15/02/2013 111,666 – 37,234 5,448 68,984 –
1/08/2013 5,625 – – 5,625 – –
1/10/2013 4,500 – 1,500 – 3,000 –
2/12/2013 7,500 – 2,500 – 5000 –
14/2/2014 126,550 – 31,646 2,962 91,942 –
20/03/2015 – 1,350 – – 1,350 –
Total 334,181 1,350 121,040 15,284 199,207 –
Balance at 1 January 2015 is adjusted for RSUs granted in prior periods to employees who transferred into/out of the Group during the year.

103Annual Report 2015
2014 Grant date
Balance at 1 January
2014
Balance acquired
on 19 May 2014
Granted in the year
Exercised in the year
Cancelled/forfeited in
the year
Balance at 31
December 2014
Vested and exercisable
at end of the year
Number Number Number Number Number Number Number
07/02/2007 – 2,500 – – – 2,500 –
10/02/2010 – 6,831 – 6,831 – – –
01/11/2010 – 2,500 – – 2,500 – –
01/03/2011 – 10,000 – 5,000 – 5,000 –
02/09/2011 – 24,045 – 12,027 2,249 9,769 –
03/01/2012 – 11,250 – 3,750 – 7,500 –
06/01/2012 – 3,750 – 1,250 – 2,500 –
11/01/2012 – 18,750 – 6,250 – 12,500 –
14/02/2012 – 61,971 – 20,658 4,750 36,563 –
15/02/2013 – 184,950 – 46,247 31,537 107,166 –
1/08/2013 – 7,500 – 1,875 – 5,625 –
1/10/2013 – 6,000 – 1,500 – 4,500 –
2/12/2013 – 10,000 – 2,500 – 7,500 –
20/2/2014 – – 129,800 – 6,850 122,950 –
Total – 350,047 129,800 107,888 47,886 324,073 –
Balance at 1 January 2014 is adjusted for RSUs granted in prior periods to employees who transferred into/out of the Group during the year.
7.7 Deed of cross guaranteeThe following entities are parties to a deed of cross guarantee under which each party to the deed guarantees the debts of each other party to the deed. Under Class Order 98/1418 (as amended) issued by the Australian Securities and Investment Commission, the Australian incorporated subsidiaries that are parties to the Deed have been relieved from the requirement to prepare, have audited and lodge with ASIC financial reports and Directors’ reports under the Corporations Act.
The subsidiaries of the Company that are parties to the Deed are:
• Genworth Financial Australia Holdings, LLC
• Genworth Financial Mortgage Insurance Finance Pty Ltd
• Genworth Financial Mortgage Insurance Finance Holdings Pty Ltd
• Genworth Financial New Holding Pty Ltd
• Genworth Financial Mortgage Insurance Holdings Pty Ltd
• Genworth Financial Services Pty Ltd

Genworth Mortgage Insurance Australia104
Notes to the financial statements (continued)
Section 7 Other disclosures (continued)7.7 Deed of cross guarantee (continued)A consolidated statement of comprehensive income and consolidated statement of financial position, comprising the Company and its controlled entities which are a party to the Deed, after eliminating all transactions between parties to the Deed of Cross Guarantee for the year ended 31 December 2015 is set out as follows:
Consolidated statement of comprehensive income
2015$’000
2014$’000
Income 2,471 1,610
Expenses (3,121) (1,717)
Financial income 2,450 438
Financing costs – (224)
Profit before income tax 1,800 107
Income tax expense 618 (1,390)
Profit for the year 1,182 1,283
Total comprehensive income for the year 1,182 1,283
Consolidated statement of financial position
2015$’000
2014$’000
AssetsCash 869 17,407Investments 212,924 250,235Trade and other receivables 1,004 –Prepayments 102 94Deferred tax asset 184 139Total assets 215,083 267,875LiabilitiesTrade and other payables 610 357Employee benefits provision 214 271Total liabilities 824 628
Net assets 214,259 267,247EquityShare capital 1,556,470 1,706,467Share based payment reserve 3,264 1,686Other reserves (476,558) (476,558)Retained earnings (868,917) (964,348)Total equity 214,259 267,247
7.8 Events subsequent to reporting dateAs the following event occurred after reporting date and did not relate to conditions existing at reporting date, no account has been taken in the financial statements for the current reporting year ended 31 December 2015.
• On 29 January 2016, Fitch Ratings (Fitch) affirmed its insurer financial strength rating of the Group’s operating subsidiary, Genworth Financial Mortgage Insurance Pty Limited assigning an ‘A+’ rating.
• On 5 February 2015, the Directors declared a 100% franked final dividend of 14 cents per share totalling $83,400,000 and a 100% franked special dividend of 5.3 cents per share totalling $31,500,000.

105Annual Report 2015
Directors’ declaration
In the opinion of the Directors of Genworth Mortgage Insurance Australia Limited (the Company):
(a) the consolidated financial statements and notes set out on pages 58 to 104 are in accordance with the Corporations Act 2001, including:
(i) giving a true and fair view of the Group’s financial position as at 31 December 2015 and of its performance, as represented by the results of its operations, and its cash flows for the period ended on that date; and
(ii) complying with Australian Accounting Standards in Australia and the Corporations Regulations 2001 and other mandatory professional reporting requirements; and
(b) the financial statements and notes comply with International Financial Reporting Standards; and
(c) there are reasonable grounds to believe that the Group will be able to pay its debts as and when they become due and payable.
Signed in accordance with a resolution of the Directors
Richard Grellman Gayle Tollifson
Chairman Director
Dated at Sydney, 25 February 2016.

Genworth Mortgage Insurance Australia106
Independent auditor’s report
To the members of Genworth Mortgage Insurance Australia LimitedReport on the financial reportWe have audited the accompanying financial report of Genworth Mortgage Insurance Australia Limited (the Company), which comprises the consolidated statement of financial position as at 31 December 2015, and consolidated statement of comprehensive income, consolidated statement of changes in equity and consolidated statement of cash flows for the period ended on that date, notes 1.1 to 7.8 comprising a summary of significant accounting policies and other explanatory information and the directors’ declaration of the Group comprising the Company and the entities it controlled at the year’s end or from time to time during the financial period.
Directors’ responsibility for the financial reportThe directors of the Company are responsible for the preparation of the financial report that gives a true and fair view in accordance with Australian Accounting Standards and the Corporations Act 2001 and for such internal control as the directors determine is necessary to enable the preparation of the financial report that is free from material misstatement whether due to fraud or error. In note 1.2(a), the directors also state, in accordance with Australian Accounting Standard AASB 101 Presentation of Financial Statements, that the financial statements of the Group comply with International Financial Reporting Standards.
Auditor’s responsibilityOur responsibility is to express an opinion on the financial report based on our audit. We conducted our audit in accordance with Australian Auditing Standards. These Auditing Standards require that we comply with relevant ethical requirements relating to audit engagements and plan and perform the audit to obtain reasonable assurance whether the financial report is free from material misstatement.
An audit involves performing procedures to obtain audit evidence about the amounts and disclosures in the financial report. The procedures selected depend on the auditor’s judgement, including the assessment of the risks of material misstatement of the financial report, whether due to fraud or error. In making those risk assessments, the auditor considers internal control relevant to the entity’s preparation of the financial report that gives a true and fair view in order to design audit procedures that are appropriate in the circumstances, but not for the purpose of expressing an opinion on the effectiveness of the entity’s internal control. An audit also includes evaluating the appropriateness of accounting policies used and the reasonableness of accounting estimates made by the directors, as well as evaluating the overall presentation of the financial report.
We performed the procedures to assess whether in all material respects the financial report presents fairly, in accordance with the Corporations Act 2001 and Australian Accounting Standards, a true and fair view which is consistent with our understanding of the Group’s financial position and of its performance.
We believe that the audit evidence we have obtained is sufficient and appropriate to provide a basis for our audit opinion.
IndependenceIn conducting our audit, we have complied with the independence requirements of the Corporations Act 2001.
Auditor’s opinionIn our opinion:
(a) the financial report of the Group is in accordance with the Corporations Act 2001, including:
(i) giving a true and fair view of the Group’s financial position as at 31 December 2015 and of its performance for the period ended on that date; and
(ii) complying with Australian Accounting Standards and the Corporations Regulations 2001.
(b) the financial report also complies with International Financial Reporting Standards as disclosed in note 1.2(a).

107Annual Report 2015
Independent auditor’s report
Report on the remuneration reportWe have audited the Remuneration Report included on pages 31 to 55 of the Directors’ Report for the period ended 31 December 2015. The directors of the Company are responsible for the preparation and presentation of the remuneration report in accordance with Section 300A of the Corporations Act 2001. Our responsibility is to express an opinion on the remuneration report, based on our audit conducted in accordance with auditing standards.
Auditor’s opinionIn our opinion, the remuneration disclosures that are contained in the sections of the Directors’ Remuneration Report of Genworth Mortgage Insurance Australia Limited for the period ended 31 December 2015 that are described as audited comply with Section 300A of the Corporations Act 2001.
KPMG
Ian Moyser
Partner
Sydney
25 February 2016

Genworth Mortgage Insurance Australia108
Shareholder information
Unless otherwise stated, the information in this section is current as at 29 February 2016.
Annual General Meeting (AGM)The 2016 annual general meeting (AGM) of Genworth Mortgage Insurance Australia Limited will be held on 5 May 2016, at the Mint, 10 Macquarie Street, Sydney NSW 2000. The AGM will be webcast live at http://investor.genworth.com.au and an archive version will be placed on the website to enable the AGM to be viewed at a later time.
Genworth Mortgage Insurance Australia Limited is listed on ASX and its ordinary shares are quoted under the ASX code “GMA”.
Annual ReportThe default option for receiving annual reports is in electronic format via Genworth Australia’s website at genworth.com.au To request a copy of the Annual Report, please contact the Share Registry.
Online voting Shareholders can lodge voting instructions electronically either as a direct vote or by appointing a proxy for the 2016 AGM at http://investorcentre.linkmarketservices.com.au. The information required to log on and use online voting is shown on the voting form distributed to shareholders with the Notice of Annual General meeting.
Voting RightsAt a general meeting, a shareholder present in person or by proxy, attorney or representative has one vote on a show of hands and on a poll has one vote for each fully paid share held. A person who holds a share which is not fully paid is entitled, on a poll, to a fraction of a vote equal to the proportion which the amount paid bears to the total issue price of the share.
Voting at any meeting of shareholders is by a show of hands unless a poll is demanded in the manner described in the Company’s Constitution. If there are two or more joint holders of a share and more than one of them is present at a general meeting, in person or by proxy, attorney or representative, and tenders a vote in respect of the share, the Company will count only the vote cast by, or on behalf of, the shareholder by the joint holder whose name appears first in the Company’s register of shareholder.
The quorum required for a meeting of members is two shareholders. If the votes are equal on a proposed resolution, the matter is decided in the negative.
Shareholder questionsShareholders can submit a written question to the Company or the Company’s auditor in regard to the AGM or any of the proposed resolutions to be considered at the AGM, using the form supplied with the Notice of AGM distributed to shareholders. Forms should be returned to the Company with the personalised voting form in the pre-addressed envelope provided or by fax to +61 1300 366 228.
Shareholders may also submit questions after completing online voting instructions online at http://investorcentre.linkmarketservices.com.au.
Questions for the Company’s auditor must be received by 5pm on Thursday, 28 April 2016. Members will also be given a reasonable opportunity to ask questions of the Company and the auditor at the AGM.
During the course of the AGM, the Company intends to answer as many of the frequently asked questions as practicable but will not be responding to individual questions. Responses to the most commonly asked questions will be added to the website at www.genworth.com.au.
Manage your HoldingQuestions regarding shareholdings can be directed to the Company’s Share Registry. Your Securityholder Reference Number (SRN) or Holder Identification Number (HIN) will be required to verify your identity. Share Registry contact information can be found in the Corporate Directory of this report.
Shareholders that are broker (CHESS) sponsored should direct queries relating to incorrect registrations, name changes and address changes to their broker.
Information about GenworthInformation about Genworth Mortgage Insurance Australia Limited, including company announcements, presentations and reports can be accessed at http://investor.genworth.com.au
Shareholders can register to receive an email alert advising of new Genworth media releases, financial announcements or presentations. Registration for email alerts is available on Genworth’s website at http://investor.genworth.com.au under the Investor Services section.
If information is not directly available on Genworth’s website, shareholders may contact the Company directly at [email protected]

109Annual Report 2015
Shareholder information
Ordinary shares informationImportant dates *
GMA year end 31 December 2015Full year results and dividend announced 5 February 2016Record date for dividend 19 February 2016 Dividend paid 4 March 2016Annual report and notice of meeting mail out commences 31 March 2016Annual general meeting 5 May 2016GMA half year end 30 June 2016
* Note dates are subject to change.
Ordinary shares and share rightsAs at 29 February 2016, the Company had on issue the following equity securities:
• 595,400,000 Shares
• 3,298,672 Share Rights
Substantial holders of ordinary shares
NameNumber of
sharesVoting power
(%)Date of
notice
Genworth Financial International Holdings, LLC and Genworth Holdings, Inc. (as partners of the Genworth Australian General Partnership), and their related bodies corporate
Perpetual Limited and subsidiaries
337,700,000
47,607,873
52.0
8.0
2 October 2015
24 February 2016Note: substantial holder details are as disclosed in substantial holding notices given to the Company.
Twenty largest holders of ordinary shares
Rank NameNumber of
shares% of issued
shares
1 Genworth Financial International Holdings, LLC and Genworth Holdings, Inc. (as partners of the Genworth Australian General Partnership) 309,333,200 51.95
2 HSBC Custody Nominees (Australia) Limited 66,084,716 11.10
3 Citicorp Nominees Pty Limited 38,644,389 6.49
4 J P Morgan Nominees Australia Limited 38,003,484 6.38
5 National Nominees Limited 30,373,309 5.10
6 RBC Investor Services Australia Nominees Pty Limited 28,119,356 4.72
7 BNP Paribas Nominees Pty Ltd 15,730,178 2.64
8 UBS Nominees Pty Ltd 4,150,315 0.70
9 RBC Investor Services Australia Nominees Pty Limited 3,260,930 0.55
10 Brazil Farming Pty Ltd 2,150,000 0.36
11 RBC Investor Services Australia Nominees Pty Limited 1,744,469 0.29
12 HSBC Custody Nominees (Australia) Limited 1,542,691 0.26
13 BNP Paribas Nominees Pty Ltd 1,534,108 0.26
14 CS Fourth Nominees Pty Limited 1,383,933 0.23
15 Sandhurst Trustees Ltd 1,344,823 0.23
16 HSBC Custody Nominees (Australia) Limited 1,276,103 0.21
17 Warbont Nominees Pty Ltd 1,221,294 0.21
18 Mr Stephen Craig Jermyn 1,200,000 0.20
19 SCJ Pty Ltd 1,000,000 0.17
20 Navigator Australia Ltd 975,933 0.16
Total for Top 20 549,073,231 92.22

Genworth Mortgage Insurance Australia110
Shareholder information (continued)
Distribution schedule of holders of ordinary shares
Range of ordinary shareholders as at 29 February 2016Number of
holdersNumber of
shares% of issued
shares1-1000 726 379,025 0.061,001 – 5,000 1,393 4,123,151 0.695,001-10,000 790 6,162,863 1.0410,001 – 100,000 717 19,467,920 3.27100,001 and over 77 565,267,041 94.94Total 3,703 595,400,000 100.00Shareholders with less than a marketable parcel of 231 ordinary shares 191
Dividend detailsShare class Dividend Franking Amount per share Payment date
Ordinary Interim Fully franked 12.5 cents 4 September 2015
Ordinary Special Fully franked 18.5 cents 4 September 2015
Ordinary Final Fully franked 14.0 cents 4 March 2016
Ordinary Special Fully franked 5.3 cents 4 March 2016
Share rights informationDistribution schedule of holders of share rights
Range of share right holders as at 29 February 2016Number of
holdersNumber of
share rights% of total
share rights1-1000 186 70,122 2.131,001 – 5,000 1 4,704 0.145,001-10,000 9 61,671 1.8710,001 – 100,000 16 626,364 18.99100,001 and over 8 2,535,811 76.87Total 220 3,298,672 100.00
Voting rightsShare Rights do not carry any voting rights. Ordinary shares issued or transferred to participants on the vesting of Share Rights carry the same rights and entitlements as other issued shares.
Shares purchased on-market for the purposes of the Genworth Australia share rights plan33,544 shares were purchased on-market for the purposes of the Genworth Australia Share Rights Plan during the period from 1 January 2015 to 31 December 2015 at an average price of $3.26 per share.
On-market buy-backThere is no current on-market buy-back.

111Annual Report 2015
Glossary
AASB Australian Accounting Standards Board
AGP Genworth Australian General Partnership
AIFRS Australian equivalents to IFRS
APRA Australian Prudential Regulation Authority
ASX Australian Securities Exchange
Australian Subsidiaries Genworth Financial’s 100% owned Australian subsidiaries prior to the IPO
Book Year The calendar year an LMI policy is originated
CET1 or Tier 1 Capital As defined by GPS 112, Tier 1 Capital comprises the highest quality components of capital that fully satisfy all of the following essential characteristics:
• provide a permanent and unrestricted commitment of funds;
• are freely available to absorb losses;
• do not impose any unavoidable servicing charge against earnings; and
• rank behind the claims of policyholders and creditors in the event of winding up
Combined ratio The sum of the loss ratio and the expense ratio
DUA Delegated underwriting authority
EPS Earnings per share
Expense ratio Calculated by dividing the sum of the acquisition costs and the other underwriting expenses by the net earned premium
FBT Fringe benefit tax
Genworth Australia or the Group The Company and its subsidiaries
Genworth Financial Group Genworth Financial and its subsidiaries, excluding Genworth Australia
Genworth Financial or GFI Genworth Financial, Inc. and, where relevant, its predecessors
GFMI Genworth Financial Mortgage Insurance Pty Limited
GLIC Genworth Life Insurance Co.
GMA or the Company Genworth Mortgage Insurance Australia Limited ABN 72 154 890 730
Gross earned premium or GEP The earned premium for a given period prior to any outward reinsurance expense
GWP Gross written premium
HLVR High loan to value ratio. Generally, a residential mortgage loan with an LVR in excess of 80% is referred to as an HLVR loan
IBNR Delinquent loans that have been incurred but not reported
ICAAP Internal Capital Adequacy Assessment Process
IFRS International Financial Reporting Standards
Indemnity Genworth Financial Mortgage Indemnity Ltd
Insurance margin Calculated by dividing the profit from underwriting and interest income on technical funds (including realised and unrealised gains or losses) by the net earned premium
Investment return Calculated as the interest income on technical funds plus the interest income on shareholder funds (excluding realised and unrealised gains/(losses)) divided by the average balance of the opening and closing cash and investments balance for each financial year
IPO Initial Public Offering
KMP Key Management Personnel, as the term is defined in the Corporations Act 2001 (Cth)
Level 2 and Level 2 Group “Level 2 insurance group” as defined by APRA under Prudential Standard GPS 001, referring to a consolidated insurance group
LLC Genworth Financial Australia Holdings, LLC
LMI Lenders Mortgage Insurance
LMI Market The market for LMI provided by external LMI Providers and LMI subsidiaries but excluding the retention of risk by Lenders and other forms of risk mitigation or risk transfer by Lenders in relation to the credit risk of residential mortgage loans
LMI Provider A provider of LMI, excluding LMI subsidiaries
LMI subsidiary A provider of LMI owned or controlled by the insured or a member of its corporate group

Genworth Mortgage Insurance Australia112
Glossary (continued)
Loss ratio Calculated by dividing the net claims incurred by the net earned premium
LTI Long term incentive
LVR Loan to value ratio. This percentage is calculated by dividing the gross value of a loan (excluding capitalisation of LMI premium) by the value of the property securing the loan. The value is based on the lower of the valuation of the underlying property accepted or externally obtained by the lender at origination or the price paid
Major Banks Australia and New Zealand Banking Group Limited ABN 11 005 357 522, Commonwealth Bank of Australia ABN 48 123 123 124, National Australia Bank Limited ABN 12 004 044 937 and Westpac Banking Corporation ABN 33 007 457 141 and each of their affiliated brokers and other residential lending distribution channels
MIP Mortgagee in possession
NED Non-executive director
Net earned premium or NEP The earned premium for a given period less any outward reinsurance expense
NIW New insurance written
NOHC Non-operating holding company
NPAT Net profit after tax
Omnibus Incentive Plans The Genworth Financial 2004 Omnibus Incentive Plan and 2012 Omnibus Incentive Plan
PCA Prescribed capital amount
PCA coverage Calculated by dividing the regulatory capital base by the prescribed capital amount
PCR The PCA plus any supervisory adjustment determined by APRA
PDR Performance and Development Review
PoS Probability of sufficiency
Regulatory capital base The sum of Tier 1 Capital and Tier 2 Capital
ReMS Reinsurance Management Strategy
Return on Equity (ROE) Calculated by dividing NPAT by the average of the opening and closing equity balance for a financial period
Rights Plan Genworth Australia Share Rights Plan
RMF Risk Management Framework
RMS Risk Management Strategy
RSU Restricted share units
S&P Standard & Poor’s Ratings Services
Shareholder Agreement The agreement between the Company, Genworth Holdings, Inc., Genworth Financial International Holdings, LLC and Genworth Financial dated 21 May 2014, as amended
SLT Senior Leadership Team
STI Short term incentive
Supply and Service Contract A contract between a lender customer and Genworth Australia for the supply of LMI and related services
Technical Funds Investments held to support unearned premium and outstanding claims reserves
TFR Total fixed remuneration
Tier 2 Capital As defined by GPS 112, Tier 2 Capital comprises components of capital that fall short of the quality of Tier 1 Capital but nonetheless contribute to the overall strength of a regulated institution and its capacity to absorb losses
Underlying Equity Total equity excluding the after-tax impact of unrealised gains or losses on the investment portfolio. For 2014, this has been calculated on a pro forma basis
Underlying NPAT Underlying NPAT excludes the after-tax impact of unrealised gains or losses on the investment portfolio
Underlying ROE Calculated by dividing Underlying NPAT by the average of opening and closing Underlying equity for a financial period
VWAP Volume weighted average price
WGEA Workplace Gender Equality Agency
Corporate directory
Registered officeGenworth Mortgage Insurance Australia LimitedLevel 26101 Miller StreetNorth Sydney NSW 2060
Telephone: +61 1300 655 422Fax: +61 1300 366 228
Website: genworth.com.au
Company SecretaryMr Luke Oxenham, Chief Financial Officer & Company Secretary
Share registryLink Market Services LimitedLevel 12680 George StreetSydney NSW 2000
Telephone: +61 1300 554 474Fax: +61 2 9287 0303
Email: [email protected]
Website: www.linkmarketservices.com.au
Link Investor Centrehttp://investorcentre.linkmarketservices.com.au
Australian Securities ExchangeGenworth Mortgage Insurance Australia Limited is listed under the ASX code “GMA”.
Annual ReportTo request a copy of the Annual Report, please contact the Share Registry. Electronic versions of the Annual Report are available at http://investor.genworth.com.au.
The cover has been printed on Pacesetter Coated which is made from elemental chlorine free bleached pulp sourced from well-managed forests and controlled sources. It is manufactured by an ISO 14001 certified mill.
The text has been printed Pacesetter Laser Recycled which is 30% recycled and made up from elemental chlorine free bleached pulp which is PEFC certified sourced from sustainably managed sources. It is manufactured by an ISO 14001 certified mill.
