5 yıldız tez flash visual evoked potentials and early visual (2)
TRANSCRIPT

Glasgow Theses Service http://theses.gla.ac.uk/
McGlone, Laura (2012) Flash visual evoked potentials and early visual development in infants born to drug misusing mothers. MD thesis. http://theses.gla.ac.uk/3184/ Copyright and moral rights for this thesis are retained by the Author A copy can be downloaded for personal non-commercial research or study, without prior permission or charge This thesis cannot be reproduced or quoted extensively from without first obtaining permission in writing from the Author The content must not be changed in any way or sold commercially in any format or medium without the formal permission of the Author When referring to this work, full bibliographic details including the author, title, awarding institution and date of the thesis must be given

Flash visual evoked potentials and early visual development in infants born to drug misusing mothers
Dr Laura McGlone, MBChB, MRCPCH
Submitted in fulfilment of the requirements for the degree of Doctor of Medicine
Department of Child Health
University of Glasgow
February 2012
No part of this thesis has been submitted in support of an application for another
degree or qualification of this or any other university.

2
Acknowledgements I would firstly like to thank my supervisors, Dr Helen Mactier and Professor
Lawrence Weaver for their time, patience, support, encouragement and
constructive criticism.
A special thanks to Dr Ruth Hamilton, who came up with the original idea for this
work and who spent hours poring over VEP traces with me. I am grateful to the
whole research team, Dr Ruth Hamilton, Professor Daphne McCulloch, Dr Michael
Bradnam, Mr Richard Boulton and Dr Jane MacKinnon, who contributed so much
time and effort to make this project successful. I am particularly grateful to
Richard Boulton for creating an excellent database to store study information
and spending long hours writing the computer software for the flicker FFT
analysis. I would also like to acknowledge Elaine Doherty and Lesley Farrell who
assisted with some of the recording sessions.
I am indebted to Dr Gail Cooper and Mrs Huda Hassan for analysing the numerous
meconium samples and to Mr Bill Borland for analysing the urine toxicology
samples.
A special thanks to Angie Groundland and Michelle McIntosh who were the
opticians involved in the study. This study would not have been possible without
the support of the midwives on the postnatal wards and the kind participation of
all the babies and mothers who took part in the study.
I will always be grateful to the Yorkhill Children‟s Foundation and Tenovus
Scotland who provided funding for the study. I would also like to acknowledge Dr
David Young who cheerfully provided statistical advice and helped with some of
the more complicated statistics.
Finally, this work is dedicated to my husband Alan and my daughter Zara for
their unlimited patience and love throughout.

3
List of Contents
1 Chapter 1 Introduction ................................................................................... 15
1.1 Drug misuse in pregnancy ...................................................................... 15
1.1.1 Incidence ......................................................................................... 15
1.1.2 Pregnancy outcomes ....................................................................... 15
1.1.3 Management in pregnancy .............................................................. 16
1.1.4 Identification of drug exposure ........................................................ 16
1.1.4.1 Techniques ............................................................................... 16
1.1.4.2 Blood/urine ............................................................................... 17
1.1.4.3 Meconium/hair .......................................................................... 17
1.2 Effects of maternal drug misuse on the infant ......................................... 19
1.2.1 Neonatal abstinence syndrome ....................................................... 19
1.2.2 Neurodevelopmental outcomes ....................................................... 21
1.2.3 Visual outcomes .............................................................................. 22
1.3 Assessing the infant visual system: clinical assessment ........................ 24
1.4 Assessing the infant visual system: visual evoked potentials ................. 27
1.4.1 Types of VEPs ................................................................................. 29
1.4.2 The infant VEP ................................................................................ 29
1.4.2.1 Flash VEP ................................................................................ 29
1.4.2.2 Flicker VEP ............................................................................... 32
1.4.2.3 Pattern VEP .............................................................................. 34
1.4.3 VEPs in preterm and sick infants ..................................................... 39
1.4.4 Clinical applications of the VEP ....................................................... 42
1.4.5 Subject variables and the VEP ........................................................ 44
1.4.6 Drug misuse and the VEP ............................................................... 45
1.5 Conclusion .............................................................................................. 46
2 Chapter 2 Pilot studies ................................................................................... 49
2.1 Flash Visual Evoked Potentials in newborn infants exposed to methadone in utero .............................................................................................................. 49
2.1.1 Introduction ...................................................................................... 49
2.1.2 Aims ................................................................................................ 49
2.1.3 Subjects and Methods ..................................................................... 49
2.1.4 Results ............................................................................................ 53
2.1.5 Conclusions ..................................................................................... 56
2.2 Flicker Visual Evoked Potentials in healthy term newborn infants .......... 58
2.2.1 Introduction ...................................................................................... 58
2.2.2 Aims ................................................................................................ 58
2.2.3 Subjects and Methods ..................................................................... 58
2.2.4 Results ............................................................................................ 61
2.2.5 Conclusion ....................................................................................... 65
2.3 Visual Evoked Potentials in preterm infants ............................................ 66
2.3.1 Introduction ...................................................................................... 66
2.3.2 Aims ................................................................................................ 66
2.3.3 Subjects and Methods ..................................................................... 66
2.3.3.1 Recording ................................................................................. 66
2.3.3.2 Stimuli ...................................................................................... 67
2.3.3.3 Data processing and analysis................................................... 67
2.3.4 Results ............................................................................................ 68
2.3.4.1 Demographics .......................................................................... 68
2.3.4.2 Flash VEPs ............................................................................... 68
2.3.4.3 Flicker VEPs ............................................................................. 72
2.3.5 Conclusion ....................................................................................... 74

4
2.4 Ocular and electrophysiology abnormalities in children exposed to methadone in utero ........................................................................................... 75
2.4.1 Introduction ...................................................................................... 75
2.4.2 Aims ................................................................................................ 75
2.4.3 Subjects and Methods ..................................................................... 75
2.4.4 Results ............................................................................................ 76
2.4.5 Conclusion ....................................................................................... 80
3 Chapter 3 Methods ........................................................................................ 81
3.1 Objectives ............................................................................................... 82
3.2 Hypothesis and aims .............................................................................. 83
3.3 Subjects and setting ............................................................................... 85
3.4 Sample size calculation .......................................................................... 86
3.5 Recruitment ............................................................................................ 87
3.6 Data collection ........................................................................................ 87
3.6.1 Maternal data .................................................................................. 87
3.6.2 Neonatal data .................................................................................. 88
3.6.3 Confidentiality and data protection .................................................. 89
3.7 Toxicology .............................................................................................. 89
3.7.1 Toxicology samples ......................................................................... 89
3.7.2 Toxicology analysis ......................................................................... 89
3.8 Neonatal VEP recording ......................................................................... 92
3.8.1 Flash VEPs ...................................................................................... 92
3.8.2 Flicker VEPs .................................................................................... 92
3.9 Follow up assessment ............................................................................ 93
3.9.1 VEP testing ...................................................................................... 93
3.9.2 Clinical visual assessment ............................................................... 96
3.9.3 Neurodevelopmental assessment ................................................... 97
3.9.4 Growth parameters .......................................................................... 97
3.10 Data analysis .......................................................................................... 98
3.10.1 VEPs ............................................................................................... 98
3.10.1.1 Flash VEPs ............................................................................... 98
3.10.1.2 Flicker VEPs ........................................................................... 103
3.10.1.3 Pattern VEPs .......................................................................... 103
3.10.2 Drug exposure ............................................................................... 107
3.10.3 NAS ............................................................................................... 107
3.11 Statistical analysis ................................................................................ 108
4 Chapter 4 Results: Neonatal data ................................................................ 114
4.1 Demographics ...................................................................................... 114
4.2 Neonatal Abstinence Syndrome ........................................................... 117
4.3 Neonatal flash VEPs ............................................................................. 119
4.3.1 Normative control data .................................................................. 120
4.3.2 Data description and luminance comparison ................................. 122
4.3.3 Drug-exposed and comparison VEPs ............................................ 126
4.3.4 Investigation of potential confounders ........................................... 133
4.3.5 Relationship with NAS ................................................................... 138
4.3.6 Relationship with drug and alcohol exposure ................................ 141
4.4 Neonatal flicker VEPs ........................................................................... 149
4.4.1 Flicker responses ......................................................................... 149
4.4.2 Flicker amplitudes .......................................................................... 154
4.4.3 Neonatal flicker VEPs and NAS..................................................... 157
5 Chapter 5 Results: Follow up data ............................................................... 159
5.1 Growth parameters and general health ................................................ 159
5.2 Infant Pattern VEPs .............................................................................. 160

5
5.2.1 Pattern VEP responses ................................................................. 160
5.2.2 Pattern VEP latencies .................................................................... 161
5.2.3 Pattern VEP amplitudes ................................................................ 164
5.2.4 Pattern VEPs and NAS .................................................................. 167
5.2.5 Pattern VEPs and drug exposure .................................................. 168
5.2.6 Pattern reversal VEPs ................................................................... 169
5.3 Visual outcomes ................................................................................... 170
5.4 Developmental outcomes ..................................................................... 174
5.4.1 Development and drug exposure group ........................................ 179
5.5 Neonatal VEPs and outcomes .............................................................. 182
5.5.1 Neonatal flash VEPs and visual outcome ...................................... 182
5.5.2 Neonatal flash VEPs and developmental outcome ........................ 183
5.5.3 Neonatal flash VEPs and six month pattern VEPs ........................ 184
5.6 Summary of six month assessment ...................................................... 185
6 Chapter 6 Discussion ................................................................................... 186
6.1 Subject demographic characteristics .................................................... 186
6.2 Neonatal visual electrophysiology ........................................................ 188
6.2.1 Neonatal VEPs .............................................................................. 188
6.2.2 Proposed mechanism for alteration in VEPs ................................. 190
6.3 Six month follow up............................................................................... 191
6.3.1 Growth parameters ........................................................................ 191
6.3.2 VEPs ............................................................................................. 192
6.3.3 Visual outcome .............................................................................. 192
6.3.4 Neurodevelopmental outcome ....................................................... 195
6.3.5 Proposed overall aetiology ............................................................ 196
6.4 Study strengths ..................................................................................... 197
6.5 Study limitations ................................................................................... 198
6.6 Clinical recommendations ..................................................................... 200
6.7 Future research and controversies ....................................................... 201
7 Chapter 7 Appendices ................................................................................. 203
7.1 Appendix 1: Parent information sheet ................................................... 203
7.2 Appendix 2: Letter to G.P. .................................................................... 207
7.3 Appendix 3: PRM neonatal abstinence syndrome guidelines ............... 208
7.4 Appendix 4: Standard Operating Procedure for recording VEPs .......... 212
7.5 Appendix 5: Letter to parent ................................................................. 216
7.6 Appendix 6: Standard Operating Procedure for visual assessment ...... 217
7.7 Appendix 7: Standard Operating Procedure for neurodevelopmental assessment. .................................................................................................... 221
7.8 Appendix 8: Letter to ophthalmology .................................................... 224
7.9 Appendix 9: Press release and media clip ............................................ 225
7.10 Appendix 10: Further reflections on methodology and future research 226
8 References .................................................................................................. 229

6
List of Tables Table 1-1 Pattern VEP check sizes ...................................................... 34
Table 1-2 Predictive value of the VEP in infancy ..................................... 41
Table 2-1 Pilot patient demographics .................................................. 54
Table 2-2 Flicker F1 VEP amplitudes ................................................... 63
Table 2-3 Flash VEPs in preterm and term infants ................................... 69
Table 2-4 Flicker responses in term and preterm infants ........................... 73
Table 2-5 Flicker amplitude in term and preterm infants ........................... 73
Table 2-6 Drug exposure and systemic findings ....................................... 77
Table 2-7 Ocular and electrophysiology findings ..................................... 79
Table 4-1 Infant and maternal demographics ........................................ 116
Table 4-2 NAS and admission details for drug-exposed infants .................... 118
Table 4-3 Normative comparison flash VEP data .................................... 120
Table 4-4 VEP data description and luminance comparison ........................ 124
Table 4-5 Neonatal flash VEPs for drug-exposed and comparison infants ........ 130
Table 4-6 Flash VEPs and NAS .......................................................... 139
Table 4-7 Flash VEPs and NAS severity ................................................ 140
Table 4-8 Drug exposure status ........................................................ 142
Table 4-9 Flash VEPs and drug exposure .............................................. 147
Table 4-10 Proportion of F1 responses ................................................ 151
Table 4-11 Proportion of F2 responses ................................................ 152
Table 4-12 Proportion of F1, F2 or F3 responses .................................... 153
Table 4-13 F1 amplitude ................................................................ 155
Table 4-14 F2 amplitude ................................................................ 156
Table 4-15 Flicker amplitudes and NAS ............................................... 158
Table 5-1 Pattern VEP latencies ........................................................ 162
Table 5-2 Pattern VEP amplitudes ..................................................... 164
Table 5-3 Pattern VEP parameters and NAS .......................................... 167
Table 5-4 Pattern VEP parameters and drug exposure .............................. 168
Table 5-5 Developmental outcome of cases and controls .......................... 176
Table 5-6 Developmental outcome and NAS .......................................... 177
Table 5-7 Developmental outcome and drug exposure ............................. 180
Table 5-8 Neonatal flash VEPs and visual outcome .................................. 182
Table 5-9 Neonatal flash VEPs and developmental outcome ...................... 183
Table 5-10 Neonatal flash VEPs and infant pattern VEPs ........................... 184

7
List of Figures Figure 1-1 Visual pathways in the brain ................................................ 28
Figure 1-2 Adult flash VEP ................................................................ 31
Figure 1-3 Infant flash VEP ............................................................... 31
Figure 1-4 Infant flicker VEP ............................................................. 33
Figure 1-5 Adult pattern reversal VEP .................................................. 35
Figure 1-6 Adult pattern onset VEP ..................................................... 35
Figure 1-7 Infant pattern reversal VEP ................................................. 37
Figure 1-8 Maturation of the infant flash VEP ......................................... 39
Figure 1-9 Drug misuse flowchart ....................................................... 48
Figure 2-1 VEP classification ............................................................. 52
Figure 2-2 Distribution of VEP waveforms. ............................................ 55
Figure 2-3 Flicker F1 response ........................................................... 60
Figure 2-4 Flicker F1 and F2 response .................................................. 60
Figure 2-5 Flicker VEP response ......................................................... 62
Figure 2-6 Boxplot of flicker amplitude ................................................ 64
Figure 2-7 Scatterplot of flash and flicker amplitude ................................ 64
Figure 2-8 Boxplot of flash VEP amplitude in preterm infants. ..................... 70
Figure 2-9 Preterm VEP waveform ...................................................... 71
Figure 3-1 Infant drug exposure ......................................................... 91
Figure 3-2 Pattern VEP testing .......................................................... 95
Figure 3-3 Typical flash VEP response .................................................. 99
Figure 3-4 Mature flash VEP response ................................................. 100
Figure 3-5 Immature flash VEP response .............................................. 101
Figure 3-6 Atypical flash VEP response ................................................ 102
Figure 3-7 Non-detectable flash VEP response ....................................... 102
Figure 3-8 Infant pattern onset responses ............................................ 105
Figure 3-9 Infant pattern reversal response .......................................... 106
Figure 4-1 Scatterplot of VEP latency and gestational age ......................... 121
Figure 4-2 Histograms of VEP latency and amplitude ............................... 123
Figure 4-3 Boxplot of VEP amplitude with dim and bright flash ................... 125
Figure 4-4 VEP morphology with dim and bright flash .............................. 125
Figure 4-5 Boxplot of VEP amplitude in drug-exposed and comparison infants . 129
Figure 4-6 VEP morphology with dim flash stimulus. ................................ 131
Figure 4-7 VEP morphology with bright flash stimulus .............................. 132
Figure 4-8 Scatterplot of VEP amplitude and OFC ................................... 134
Figure 4-9 Boxplot of VEP amplitude and smoking status .......................... 135
Figure 4-10 Pattern of drug exposure in cases ....................................... 143
Figure 4-11 Boxplot of VEP amplitudes and drug exposure ........................ 148
Figure 5-1 Boxplot of pattern VEP latency ............................................ 163
Figure 5-2 Boxplot of pattern VEP amplitude ........................................ 165
Figure 5-3 Boxplot of Griffiths GQ scores ............................................. 178
Figure 5-4 Boxplot of development scores and drug exposure .................... 181

8
List of publications based on thesis Hamilton R, McGlone L, MacKinnon JR, Russell HC, Bradnam MS, Mactier H.
Ophthalmic, clinical and visual electrophysiological findings in children born to
mothers prescribed substitute methadone in pregnancy. Br J Ophthalmol 2010
Jun; 94 (6): 696-700.
McGlone L, Mactier H, Weaver LT. Drug misuse in pregnancy: losing sight of the
baby? Arch Dis Child 2009 Sept; 94 (9): 708-12.
McGlone L, Mactier H, Hamilton R, Bradnam MS, Boulton R, Borland W, Hepburn
M, McCulloch DL. Visual evoked potentials in infants exposed to methadone in
utero. Arch Dis Child 2008; 93: 784-6.
McGlone L, Mactier H, MacKinnon JR. Outcome in infants exposed to methadone
in utero. BMJ 2008; 337: a1774.
Published abstracts
Mactier H, McGlone L, Hamilton R, Boulton R, McCulloch DL, Bradnam MS,
Borland W, Cooper G, Hassan H, Weaver LT. Abnormal visual evoked potentials
in newborn infants of drug-misusing mothers: is prescription of substitute
methadone to blame? Arch Dis Child Fetal Neonatal Ed 2011; 96: Fa45-46.
McGlone L, Hamilton R, McCulloch DL, MacKinnon J, Bradnam MS, Groundland A,
McIntosh M, Weaver LT, Mactier H. Exposure to maternal methadone in utero:
visual and developmental outcomes at 6 months. Arch Dis Child 2011; 96: A34.
McGlone L, Hamilton R, MacKinnon J, Russell H, Mactier H. Drug misuse in
pregnancy: losing sight of the baby? Scot Med J 2010; 55 (1): 52-55.
McCulloch DL, McGlone L, Boulton RG, Doherty E, Hamilton R, Bradnam MS,
Mactier H. Neonatal VEPs to transient and steady-state luminance stimuli:
normative data. Doc Ophthalmol 2010; 121(suppl): 4.
9
Hamilton R, McGlone L, MacKinnon J, Russell H, Bradnam MS, Mactier H. VEPs
and ophthalmic findings in children exposed to substance misuse in utero. Doc
Ophthalmol 2009; 119(suppl): 17-92.
Hamilton R, McGlone L, Mactier H, Bradnam MS, Boulton R, Borland W, Hepburn
M, McCulloch DL. Neonatal flash VEPs: effect of exposure to methadone in utero.
Doc Ophthalmol 2008; 117(suppl): 17.
McCulloch DL, McGlone L, Bradnam MS, Hepburn M, Hamilton R, Borland W,
Boulton R, Pieh C, Bach M, Mactier H. Flash and flicker VEPs in newborn term
infants of drug-misusing mothers. Doc Ophthalmol 2007; 115: 30.

10
Abbreviations IUGR Intra uterine growth restriction NAS Neonatal abstinence syndrome FAEE Fatty acid ethyl ester DVM Delayed visual maturation CVI Cerebral visual impairment VEP Visual evoked potential SNR Signal to noise ratio F1 Fundamental response F2 First harmonic F3 Second harmonic ERG Electroretinogram BMI Body mass index OFC Occipitofrontal circumference DEPCAT Carstairs deprivation index LBW Low birth weight SMA Small for gestational age ISCEV International Society for Clinical Electrophysiology of Vision GQ General Quotient SD Standard deviation IQR Inter-quartile range NNU Neonatal unit VA Visual acuity Units ms milliseconds µV microvolts cm centimetres gm grams Hz Hertz cds/m2 candela seconds per metre squared 1‟ 1 minute of arc

11
Summary
Background / Aims:
Maternal drug misuse in pregnancy is a significant clinical and public health
problem. Consequences for the newborn infant include prematurity, intrauterine
growth restriction (IUGR) and neonatal abstinence syndrome (NAS). There is
increasing evidence that maternal drug misuse in pregnancy may have longer
term adverse effects on infant visual and neurodevelopmental outcome. Most of
the evidence regarding visual outcomes in particular derives from small
uncontrolled studies with a lack of adequately powered, controlled studies to
date.
The visual evoked potential (VEP) can be used to assess the integrity and
maturity of the infant visual pathway and both visual and neurodevelopmental
abnormalities can be predicted by abnormal VEPs in infancy. Drug misuse is also
associated with alteration of the VEP in adults and in animal models. Many drugs
used in pregnancy can cross the placenta and enter the fetal circulation,
including illicit drugs and prescribed methadone, which is the currently
recommended treatment for pregnant opiate-dependent women. Hitherto few
studies have investigated the effects of maternal drug misuse upon the newborn
infant VEP.
This study investigates in detail the effects of prescribed methadone and
additional illicit drug use in pregnancy upon the infant VEP recorded at birth and
at six months of age, and explores any association with NAS. The range and
incidence of visual and neurodevelopmental abnormalities at six months of age is
described, and how these relate to a history of NAS and the pattern of in utero
drug exposure is explored.
Pilot work:
Pilot work demonstrated the feasibility of recording neonatal flash VEPs in a
small group of infants exposed to methadone in utero, and showed that drug
exposed infants had abnormal VEPs compared to unmatched controls.

12
A further pilot study described longer term visual outcomes, which included
nystagmus, reduced visual acuity and strabismus, in a selected group of infants
and children exposed to methadone in utero, thus informing clinical and
electrophysiological assessment at six months of age. The pilot studies were
followed by a major prospective cohort study.
Prospective Study:
One hundred and two term infants of mothers prescribed substitute methadone
during pregnancy and 50 comparison infants matched for birth weight, gestation
and socio-economic group were recruited in the neonatal period. Flash and
flicker VEPs were recorded from the occipital scalp of infants within three days
of birth. Drug exposure was determined by maternal history, maternal and infant
urine and meconium toxicology. Excess alcohol exposure in utero was
determined by elevated fatty acid ethyl esters in meconium.
Neonatal flash VEPs were classified as mature, typical, or immature according to
waveform morphology, and amplitude and latencies measured. Flicker VEPs
were analysed using a fast-Fourier transformation and responses at each flicker
frequency determined.
The same cohort of drug-exposed and comparison infants was invited for clinical
visual evaluation at six months of age in conjunction with pattern-onset VEPs
and Griffiths developmental assessment.
Results:
Neonatal testing:
Neonatal VEPs were successfully recorded from 100 drug-exposed infants and 50
matched comparison infants at a median age of 24 hours (IQR 13-44).
Gestational age, birth weight and socio-economic group did not differ between
groups. Flash VEPs from methadone-exposed infants had fewer P1 components
(p=0.001), and were more likely to be of immature waveform (p<0.001)
compared to comparisons. VEPs from methadone-exposed infants were also
smaller in overall amplitude (median 27µV vs 39.5µV, p<0.001). The relative risk

13
of an abnormal VEP in the methadone-exposed cohort was 5.6 with an
attributable risk percent of 82%. The majority of infants were exposed to illicit
drugs in addition to prescribed methadone, most commonly opiates (74%) and
benzodiazepines (66%). VEPs did not differ between infants exposed to opiates
only, those additionally exposed to benzodiazepines and those exposed to
stimulants. Regression analysis confirmed that the difference in VEP parameters
between drug-exposed and comparison infants was associated with methadone
exposure and not other drugs of misuse.
48% of the methadone-exposed cohort developed NAS requiring pharmacological
treatment; there was no association between neonatal VEPs and subsequent
onset or severity of NAS.
Flicker VEP analysis demonstrated an optimal flicker frequency of 4.6 Hz in both
groups, but there were few differences in the proportion of responses between
groups.
Six month follow-up:
Retention rate to six month follow-up was 79% for the methadone-exposed
cohort and 52% for comparison infants. Age at assessment (median 27 weeks,
range 26-30 wk), weight and OFC did not differ between groups. The
demographic characteristics of comparison infants who were followed up were
compared to those of comparison infants who were not followed up. There were
no significant differences in birth weight (2 sample t-test p=0.445), OFC (2
sample t-test p=0.712), gestation (Mann-Whitney test p=0.984), 5-minute Apgar
score (Mann-Whitney test p=0.263) or DEPCAT score (Mann-Whitney test
p=0.258) between groups.
Methadone-exposed infants were more likely to have visual abnormalities than
comparison infants, even after correcting for excess in utero alcohol exposure
(40% vs 8%; adjusted p=0.007). Abnormalities in the methadone-exposed cohort
included nystagmus (11%), strabismus (25%) and reduced visual acuity (22%). The
relative risk of an abnormal visual outcome in the methadone-exposed cohort
was 5.1 with an attributable risk percent of 80%.
14
Electrophysiological abnormalities persisted at six months of age: methadone-
exposed infants had smaller amplitude pattern VEPs (25 μV vs 34 μV; p=0.005)
with delayed peak latencies (115ms vs 99ms; p=0.019) and fewer responses at
the small check size (p=0.003), compared to controls.
Methadone-exposed infants had significantly lower neurodevelopmental scores
compared to comparison infants (GQ 97 for cases vs 105 for controls; p<0.001),
even after correcting for maternal smoking, antidepressant treatment and
excess alcohol consumption during pregnancy. Infants exposed to poly-drug
misuse and treated for NAS in the newborn period performed particularly poorly
on their neurodevelopmental scores. Visual impairment was an independent
predictor of poor neurodevelopmental outcome and most infants scoring <85 on
neurodevelopmental assessment had co-existing visual problems.
Conclusions:
In utero exposure to prescribed methadone and other substances of misuse is
associated with an alteration in visual electrophysiology in the newborn period
suggestive of immature visual maturation. These changes are independent of
additional benzodiazepine or stimulant exposure, and appear to be associated
with prescribed substitute methadone.
At six months of age, there is a high incidence of clinical visual abnormalities in
infants exposed to methadone and other drugs of misuse in utero. Persistence of
electrophysiological abnormalities beyond the neonatal period suggests that
opiates may have a longer term effect on the developing visual system. Drug-
exposed infants also have poorer neurodevelopmental scores than matched
comparison infants after correcting for maternal smoking and excess alcohol
intake. The bias of loss to follow-up was minimised by the high retention rate of
drug-exposed infants. Although there was a higher loss of comparison infants,
there were no differences in demographic characteristics between comparison
infants followed up and those not followed up, suggesting the groups were
similar. In addition, published data suggest the incidence of visual abnormalities
described in the comparison population to be representative of the larger
population. Infants born to drug-misusing mothers are highly vulnerable and
warrant early comprehensive visual assessment.

15
1 Chapter 1 Introduction
1.1 Drug misuse in pregnancy
1.1.1 Incidence
The use of illicit non-prescribed drugs by pregnant women is unfortunately a
common problem in some parts of the United Kingdom (UK) (1-5). There are
thought to be between 250,000 and 350,000 children of known problem drug
users in the UK - about one child for every problem drug user (6). In Scotland it
is estimated that 4-6% of all children under the age of 16 years have a drug-using
parent, representing between 41,000 and 59,000 children. The incidence of
maternal drug misuse is increasing with anonymous screening suggesting that 11-
16% of expectant women use at least one illicit substance during pregnancy (7).
It is also well recognised that a high percentage of women misuse more than one
drug in pregnancy - studies have shown that the majority of mothers prescribed
methadone in pregnancy misuse other substances, with up to 66% taking
additional benzodiazepines and heroin (8,9).
1.1.2 Pregnancy outcomes
Among the drug misusing population the incidence of unplanned pregnancy is
high and antenatal care is often erratic. Substance misuse in pregnancy is
associated with increased risk of pregnancy complications including premature
rupture of the membranes, placental abruption, antepartum haemorrhage,
stillbirth and neonatal death (1,2). Infants born to drug misusing mothers
represent a very high risk group, with increased rates of preterm birth and intra-
uterine growth restriction (IUGR) (1,5,10-12). Substance misusing mothers as a
group tend to suffer from the consequences of poverty including physical and
mental ill health and poor nutritional status. They are likely to smoke cigarettes,
and may experience domestic violence and drink excessive amounts of alcohol
(1,13). Such unfavourable circumstances pose a threat to the health of the
newborn, not least to neurological and visual development.

Chapter 1 16
1.1.3 Management in pregnancy
Management of maternal opiate misuse during pregnancy includes substitute
prescribing of methadone, a synthetic opioid which stabilises lifestyle, reduces
the incidence of preterm birth and IUGR and reduces risk-taking behaviour
(2,5,10-12). Several studies have reported an increase in birth weight and
reduction in neonatal mortality rate associated with prescribed methadone use
compared to illicit opiates. Meta-analysis found the mean reduction in birth
weight below normal with maternal methadone use to be 279 grams, compared
to a reduction of 489 grams with illicit heroin use (14). The use of methadone in
pregnancy is associated with better compliance with antenatal obstetric care
and better preparation for parenting responsibilities (11). Regular prescription
of methadone engages patients and facilitates attendance for both antenatal
care and social service support. Methadone is also more pharmacologically stable
than heroin: it is more slowly absorbed and longer acting and leads to stable
blood concentrations when taken daily. Maintenance methadone abolishes most
of the symptoms of heroin intoxication and withdrawal, which are harmful to the
fetus. Attempted withdrawal from illicit opiates and methadone treatment
during pregnancy has poor outcomes and guidelines recommend that opiates
should not be withdrawn after 32 weeks‟ gestation (13).
Despite the potential benefits, substitute prescribing of methadone in pregnancy
remains an emotive topic, which has attracted political and media debate and
led to some health professionals‟ refusal to prescribe (15). One significant
disadvantage of methadone is the high incidence of neonatal abstinence
syndrome (NAS) which is seen in infants who have been exposed to methadone in
utero.
1.1.4 Identification of drug exposure
1.1.4.1 Techniques
Maternal reporting of drug misuse is often inaccurate due to guilt,
embarrassment and/or fear of legal or custodial repercussions. Maternal
interview has been found to have a low sensitivity for detecting opiate and
cocaine exposure (67% and 65% sensitivity respectively) (16). As a result of this,

Chapter 1 17
various techniques to determine more accurately in utero drug exposure have
been established. In clinical practice drug screening is performed as infrequently
as possible to foster a sense of trust and responsibility and to keep women
engaged with health services (8). In research practice, however, additional
toxicology analysis is often employed to determine a more comprehensive
pattern of drug exposure. Techniques for detecting gestational exposure to drugs
of misuse include maternal and infant urine or blood analysis, meconium and
neonatal hair analysis.
1.1.4.2 Blood/urine
Blood samples for methadone levels can be taken from the umbilical cord after
delivery or by either venesection or capillary blood sampling of the infant. Urine
toxicology can detect the vast majority of drugs of misuse and is easily
performed on both mother and infant postnatally. The main limitation of both
blood and urine analyses is that due to the short half-life of many drugs of
misuse, these methods can only be used to detect drug exposure late in
pregnancy. Cocaine in particular has a very short half-life and can only be
detected in blood or urine for up to one week following exposure. Cannabis and
opiates have longer half-lives but will still only be detected for a maximum of
three to four weeks following exposure. These limitations have led to the
development of other biological markers, which reflect longer term exposure to
illicit drugs and alcohol.
1.1.4.3 Meconium/hair
Meconium and neonatal hair analysis have become established methods for
defining in utero exposure to drugs of misuse (17,18). Deposition of drugs into
meconium begins at approximately 12 to 16 weeks of gestation when fetal
swallowing commences, and therefore meconium analysis examines drug
exposure in the second two trimesters of pregnancy. Neonatal hair grows during
the third trimester and will reflect exposure to illicit drugs during this time. Bar-
Oz et al (2003) investigated the sensitivity of meconium analysis and neonatal
hair analysis in 185 paired samples collected from infants with a history of in
utero drug exposure (17). They found that meconium analysis was more sensitive
at detecting cocaine and cannabis compared to neonatal hair analysis and, since

Chapter 1 18
meconium is a discarded material, had the added advantage of being more
acceptable to parents. All drugs of misuse commonly screened for in infant urine
can be detected by meconium analysis including opiates, methadone,
benzodiazepines, cocaine, cannabinoid and amphetamine.
Meconium analysis can also be used to detect prenatal ethanol exposure (19,20).
As prenatal ethanol exposure may be a confounding factor for abnormal visual
and neurological development, it is important to measure co-exposure in studies
of drug-exposed infants. In a similar manner to under-reporting of illicit drug
use, pregnant women will often deny excessive alcohol use during pregnancy and
a biological marker of exposure would therefore be useful.
Ethanol conjugates to a number of fatty acid species collectively named fatty
acid ethyl esters (FAEEs). Ethanol can cross the placenta in pregnancy due to its
small molecular size and high water solubility and enter the fetal circulation.
Fetal ethanol metabolism leads to the formation of FAEEs, which are deposited
in fetal meconium. Studies have shown that meconium FAEE analysis is fivefold
more sensitive than self-reported screening for detection of ethanol-exposed
pregnancies (19).

Chapter 1 19
1.2 Effects of maternal drug misuse on the infant
1.2.1 Neonatal abstinence syndrome
Illicit substances used by mothers in pregnancy can cross from the maternal
circulation, via the placenta to enter the fetal circulation, resulting in a physical
drug dependency in the newborn. At birth division of the umbilical cord leads to
abrupt discontinuation of the supply of illicit drug to the infant, which can result
in neonatal drug withdrawal commonly referred to as neonatal abstinence
syndrome (NAS). Signs of NAS include irritability, jitteriness, increased muscle
tone, poor feeding, tachypnoea, diarrhoea, sweating, sneezing, yawning, skin
excoriation and, in extreme cases, convulsions.
Methadone, morphine and heroin activate opiate receptors in the brain, which
decrease the activity of adenylate cyclase, resulting in reduced cAMP production
and release of noradrenaline. During chronic exposure, noradrenaline release
gradually increases towards its normal level as tolerance to the drug develops. If
opiates are withdrawn, their inhibitory effect is lost, resulting in symptoms of
withdrawal.
Signs of NAS may develop within 12 hours of birth or they may not be apparent
until the second week of life or even later. This is due to differences in the
pharmacological properties of addictive substances and/or differences in
metabolism. Approximately 40-60% of infants who have been exposed to
methadone in utero will develop symptoms of NAS (8,12,21,22).
Factors that may influence the development of NAS include maternal methadone
dose, the use of other illicit drugs, maternal cigarette smoking, rate of placental
transfer of methadone, inter-individual variation in metabolism of methadone
between mother and baby, and breast-feeding (8,9,23-25).
Prescribed maternal methadone dose has not consistently been found to
correlate with the development of NAS. Some of the studies investigating this
did not, however, correct for confounding factors such as additional illicit drug
use (12,22). A large recent retrospective audit of 450 singleton infants born to
mothers prescribed methadone in pregnancy showed a strong correlation

Chapter 1 20
between prescribed maternal methadone dose and the risk of the infant
developing NAS, even when corrected for additional illicit drug use (8). Heavy
cigarette smoking concurrent with methadone use is associated with higher NAS
scores (23), and use of illicit drugs in addition to methadone may increase the
requirement for treatment (9). Breast-feeding appears to reduce the
requirement for pharmacological treatment of NAS (8,26): Dryden et al found
that breast-feeding for greater than 72 hours was independently associated with
a halving of the odds of the infant requiring pharmacological treatment for NAS.
The mechanism of this is unclear, as studies have demonstrated that transfer of
methadone into maternal milk is minimal (25). It may partly be due to the
soothing effect that breast-feeding has on newborn infants (27).
Several objective scoring systems exist to guide initiation and intensification of
treatment; the most commonly utilised of these are the Finnegan and Lipsitz
scores (28,29). Treatment options for infants developing NAS secondary to
maternal opiate use in pregnancy include opiates, sedatives (phenobarbital or
diazepam) and supportive treatments (swaddling, pacifiers, massage, relaxation
baths, and waterbeds) (30-33). Cochrane meta-analysis of available studies
found a reduction in treatment failure with opiate use compared to the other
interventions (30). A combination of opiate and phenobarbital may reduce the
severity of withdrawal and duration of hospitalisation as well as improving
neurobehavioural scores, and is often required to treat NAS following polydrug
misuse (32,33).
Due to the many different factors involved in the development of NAS, it is
impossible to predict the likelihood of onset in individual cases and so the
management of infants born to drug-misusing mothers is expectant, usually
involving prolonged postnatal hospital stay to observe for signs of NAS. One study
reported that the median postnatal stay for healthy maternal drug-exposed
infants who did not require pharmacological treatment was seven days, more
than three times longer than the median stay for healthy non-maternal drug-
exposed babies (8). This extended postnatal stay does however have some
advantage in allowing for social work assessment prior to discharge and
organisation of a comprehensive post-discharge care plan.
Chapter 1 21
Infants born to drug misusing mothers constitute a significant workload to health
and social services and are a resource burden: Dryden et al found that infants
born to mothers prescribed methadone in pregnancy accounted for 2.9% of all
hospital births but 18.2% of neonatal cot days. Better understanding of the
patho-physiology of NAS would be helpful in managing drug misuse in pregnancy
and guiding treatment of infants.
1.2.2 Neurodevelopmental outcomes
There are numerous data linking maternal opiate misuse with developmental
delay (34-50). Fifteen studies have followed up a total of 770 drug-exposed
infants and reported on their neurodevelopmental outcome at ages ranging from
two months to 12 years. Various different scales of infant and child development
were used and, due to heterogeneity of the studies, meta-analysis is not
possible. Furthermore, retention to follow-up was often low (a mean of 66% in
infants followed up after one year of age). Motor developmental delay was
demonstrated in several of the studies (34,38,49) and a low mental development
index or low intelligence quotient (IQ) was found by many authors
(34,35,38,43,47). Several papers report behavioural problems in children who
had been exposed to drug-misuse in utero, including aggression, poor
concentration, social inhibition and, in particular, attention deficit hyperactivity
disorder (44-46,48,50). Small head circumference is commonly reported at birth,
usually associated with low birth weight, although catch-up growth does occur.
Other reported neurological anomalies include cerebral palsy and abnormalities
of muscle tone and posture (34,45,47).
Environmental factors and poor parenting skills may in part account for some of
these findings. Attempts have been made to correct for confounding factors by
examining the differences in outcome in children raised by their parents
compared to those who had been adopted (45). One study found that children in
adoptive homes had better psychomotor scores than those living with their
parents, suggesting that the environment plays a significant role in outcome.
The children in adoptive homes, however, still had significantly lower scores on
one of their performance scales compared to non-drug exposed controls (45).
Bunikowski et al (1998) found no difference in developmental outcome between

Chapter 1 22
infants in foster care versus those living with their biological parents, and
described significantly lower development quotients in drug-exposed infants
compared to controls (34). These studies are not necessarily contradictory as
children in foster care are commonly moved between accommodations including
those of their natural parents. Topley et al (2008) described an optimistic
outcome in children of drug-misusing parents who were in full-time schooling,
with no child having a statement of special educational need and a similar
number (17%) requiring a low level of additional support in school compared to
the corresponding local population (48). None of the children in this latter study
had a formal developmental assessment performed however, and a high
proportion had behavioural or concentration difficulties.
The high loss of study subjects to follow-up is a criticism of many of these
studies and is a reflection of the social disruption that is associated with the
drug culture. It is unlikely, however, that infants whose family life is so chaotic
that they are untraceable at follow-up will perform better than those infants for
whom data are obtainable (38). The retention of infants in longitudinal or
follow-up studies from socially deprived backgrounds is recognised to be
challenging. However various techniques can be employed to maximise study
retention rates including reimbursement of transport costs and diligent tracking
of participants (51).
1.2.3 Visual outcomes
Prenatal exposure to various harmful substances can have adverse effects on
infant visual development (52). Strabismus, nystagmus, hypoplastic optic discs,
delayed visual maturation and prolonged eyelid oedema have been reported
following in utero cocaine exposure, as well as both superficial and deep retinal
haemorrhages (53-55). It is postulated that these findings may be due in part to
retinal vascular changes caused by the vasoconstrictive effects of cocaine on
placental blood vessels.
Ocular abnormalities are also seen in infants with fetal alcohol syndrome, and
include short horizontal palpebral fissures, epicanthus, telecanthus,
microphthalmia, refractive errors, strabismus and retinal vessel tortuosity (56-
58). Up to half of infants born to alcoholic mothers demonstrate optic nerve
Chapter 1 23
hypoplasia. This is consistent with animal studies: in utero alcohol exposure in
rats is associated with ultra structural damage to the macroglial cells and myelin
sheaths and hypoplasia of the optic nerve (59,60). Animal models demonstrate
that ethanol exposure during a critical period of early development has an
adverse effect on neurotransmitter systems, resulting in apoptosis of developing
neurons. A similar pattern of apoptotic neurodegeneration may lead to many of
the ophthalmic manifestations and other central nervous system features of
fetal alcohol syndrome.
There are fewer data regarding visual outcome in infants exposed to opiates
and/or benzodiazepines in utero. Gill et al (2003) undertook ophthalmology
assessment in 49 infants born to opiate-dependent mothers, the majority of
whom (77%) were exposed to opiates alone (61). Twenty-nine infants had a full
examination and 20 completed a telephone questionnaire only. Seven of the
infants examined had confirmed strabismus and a further six of the telephone-
surveyed children had a history of intermittent strabismus. This equates to an
incidence of strabismus of over ten times that of the general population. The
authors found no differences in the incidence of strabismus between those
infants treated for NAS and those not (61). Similarly, Nelson et al (1987) found
an incidence of strabismus of 24% in their cohort of 29 infants assessed up to two
years of age (62). The majority of infants in this study were however exposed to
polydrug misuse including cocaine and amphetamines. A recent Scottish study
found that 26% of infants born to opiate-using mothers failed health visitor vision
screening tests in the community on at least one occasion within the first six
months of life: 42% of the referred group had abnormalities confirmed by formal
ophthalmology assessment including nystagmus and squint (4).
The presence of nystagmus in five children born to drug-addicted mothers was
reported first in 2002 (63). Three children presented with congenital horizontal
pendular nystagmus and two children with a transient horizontal nystagmus in
association with NAS. More recently nystagmus, strabismus and delayed visual
development were described in 14 infants exposed to methadone and/or
benzodiazepine in utero (64). The nystagmus was horizontal in all cases and in
most cases was noted in the first six months of life. Recent follow-up of this
cohort has suggested the nystagmus and reduced visual acuity may be
permanent in children exposed to opiates and benzodiazepines in utero (65).

Chapter 1 24
1.3 Assessing the infant visual system: clinical
assessment
The most common visual abnormalities reported in infants who have been
exposed to opiate misuse in utero are reduced visual acuity, nystagmus, delayed
visual maturation, strabismus and refractive errors (61,62,64,65).
Visual acuity can be assessed in infancy using Cardiff or Teller acuity cards (66).
Cardiff cards contain simple picture images and Teller cards contain black and
white grating patterns. Cardiff picture images are drawn with a white band
bordered by two narrow black bands, all on a neutral grey background. If the
visual target lies beyond the subject‟s acuity limit it merges with the background
and becomes invisible. The picture targets are of the same overall size but with
decreasing width of black and white bands: acuity is defined by the narrowest
white band for which the target is visible. The principle of the test is
preferential looking – an infant will choose to look towards a visible target rather
than a plain stimulus.
Nystagmus described in association with maternal drug misuse is usually
horizontal in nature and will be detected by observation (64,65). Manifest
nystagmus is apparent on observation of the child with both eyes open, and is
usually best observed with the child fixating on a small toy. Latent nystagmus is
a type of congenital nystagmus that is only present with monocular viewing, and
manifest latent nystagmus is that which is present with both eyes open but beats
in a different direction depending on which eye is viewing (i.e. always towards
the viewing eye).
Delayed visual maturation (DVM) is the condition whereby infants appear
behaviourally visually delayed at a young age with no corresponding ocular or
central nervous system abnormalities, but then recover vision over a period of
time (usually by six months of age) (67,68). Such infants usually present in the
first few months of life with a failure to fix and follow and will demonstrate
reduced visual acuity on testing. The diagnosis is made retrospectively when the
infant recovers normal vision.

Chapter 1 25
Strabismus (squint) can be detected using the Hirschberg test in infancy (equal
pupillary light reaction) (69). The presence of strabismus in an infant over six
months of age warrants ophthalmology assessment. Timely detection can lead to
early intervention with correction of refractive errors, selective patching and
occasionally surgery (69). Unattended strabismus can lead to amblyopia,
susceptibility to which is greatest in the first three years of life. In addition, the
cosmetic disorder associated with strabismus can interfere with social and
psychological development: children with uncorrected strabismus are at
significantly greater risk of displaying conduct and externalising problems (70).
Refractive errors require retinoscopy for diagnosis and include hypermetropia
(long sightedness), myopia (short sightedness) and astigmatism. Accurate
assessment of refractive errors in infancy usually requires pupil dilatation as
young infants will not fixate on a static object for assessment. The technique of
rapid retinoscopy through undilated pupils has been described as an efficient
method of detecting high refractive errors and candidates for nonstrabismic
amblyopia in childhood (71).
Cerebral visual impairment (CVI) involves disordered higher visual processing and
may also involve reduced visual acuity and visual fields (72-74). CVI can be
diagnosed by structured history taking and validated by observation of behaviour
and testing. Two higher visual processing pathways have been described: the
dorsal stream and the ventral stream. The dorsal stream passes between the
occipital lobes and the posterior parietal lobes and allows appraisal of the whole
visual scene and visual guidance of movement through the scene. Dorsal stream
dysfunction causes problems with the processing of complex visual scenes such
as finding a toy in a toy-box or on a patterned background, finding clothes in a
drawer and seeing objects at a distance (as there is more to see). It also causes
problems with visual guidance of movement such as inaccurate reach and grasp,
difficulty with curbs and steps, and difficulty crossing floor boundaries. The
ventral stream passes between the occipital lobes and the temporal lobes and is
responsible for visual recognition, orientation and visual memory. Ventral stream
dysfunction causes problems with recognising faces, understanding facial
expression, navigation and copying. Children with CVI will often develop coping
strategies to help them adapt to everyday life, such as coding and recognising by
colour. Problems interpreting the visual world and the compensatory strategies

Chapter 1 26
required can affect behaviour; some children demonstrate hyperactivity,
withdrawal and aggression. The implementation of a developmental programme
and strategies to modify behaviour can result in significant improvement in
visual function (72-74).

Chapter 1 27
1.4 Assessing the infant visual system: visual evoked
potentials
The visual evoked potential (VEP) is an electrical signal generated in the visual
cortex of the brain in response to a visual stimulus (75,76). A normal VEP
depends upon an intact visual pathway from the retina via the optic nerves and
optic chiasm to the lateral geniculate nuclei and visual cortex (Figure 1-1).
VEPs reflect visual and cortical integrity and are a useful measure of visual
development. They can be used to detect, quantify and monitor abnormalities of
the visual system (76). In clinical paediatric practice, VEPs are used in the
detection and management of optic nerve hypoplasia or atrophy, amblyopia,
congenital cataract, delayed visual maturation and cortical visual impairment
(76). An abnormal VEP is strongly predictive of visual abnormalities and adverse
neurological outcome in selected preterm and term infants (77-81).

Chapter 1 28
Figure 1-1 Visual pathways in the brain
Chapter 1 29
1.4.1 Types of VEPs
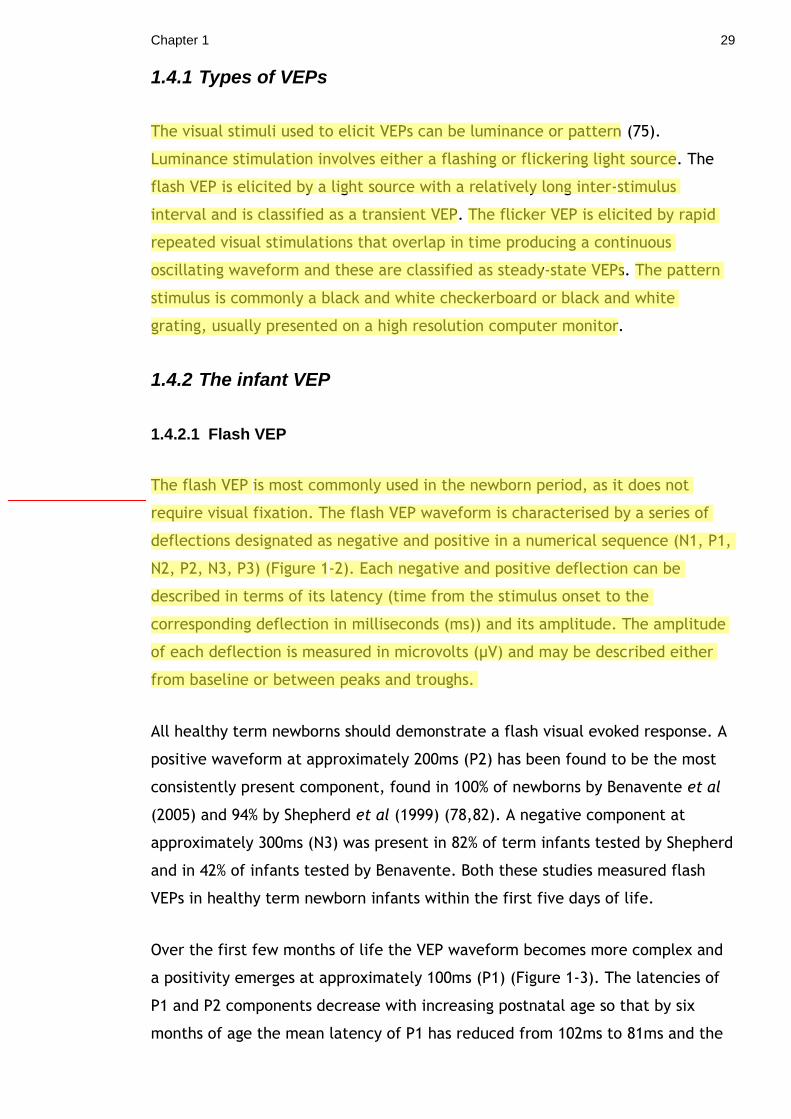
The visual stimuli used to elicit VEPs can be luminance or pattern (75).
Luminance stimulation involves either a flashing or flickering light source. The
flash VEP is elicited by a light source with a relatively long inter-stimulus
interval and is classified as a transient VEP. The flicker VEP is elicited by rapid
repeated visual stimulations that overlap in time producing a continuous
oscillating waveform and these are classified as steady-state VEPs. The pattern
stimulus is commonly a black and white checkerboard or black and white
grating, usually presented on a high resolution computer monitor.
1.4.2 The infant VEP
1.4.2.1 Flash VEP
The flash VEP is most commonly used in the newborn period, as it does not
require visual fixation. The flash VEP waveform is characterised by a series of
deflections designated as negative and positive in a numerical sequence (N1, P1,
N2, P2, N3, P3) (Figure 1-2). Each negative and positive deflection can be
described in terms of its latency (time from the stimulus onset to the
corresponding deflection in milliseconds (ms)) and its amplitude. The amplitude
of each deflection is measured in microvolts (µV) and may be described either
from baseline or between peaks and troughs.
All healthy term newborns should demonstrate a flash visual evoked response. A
positive waveform at approximately 200ms (P2) has been found to be the most
consistently present component, found in 100% of newborns by Benavente et al
(2005) and 94% by Shepherd et al (1999) (78,82). A negative component at
approximately 300ms (N3) was present in 82% of term infants tested by Shepherd
and in 42% of infants tested by Benavente. Both these studies measured flash
VEPs in healthy term newborn infants within the first five days of life.
Over the first few months of life the VEP waveform becomes more complex and
a positivity emerges at approximately 100ms (P1) (Figure 1-3). The latencies of
P1 and P2 components decrease with increasing postnatal age so that by six
months of age the mean latency of P1 has reduced from 102ms to 81ms and the

Chapter 1 30
mean latency of P2 has reduced from 200ms to 147ms. The amplitude of both P1
and P2 increases significantly with increasing postnatal age and by six months of
age the flash VEP has matured significantly and starts to resemble that of an
adult (82,83).

Chapter 1 31
Figure 1-2 Adult flash VEP Six components are present (N1, P1, N2, P2, N3, P3). The major component, P2 has a latency of approximately 120ms in healthy adults.
Figure 1-3 Infant flash VEP Components present include positivity at 100ms (P1), positivity at 200ms (P2) and negativity at 300ms (N3).

Chapter 1 32
1.4.2.2 Flicker VEP
An alternative and novel luminance electrophysiology technique is the flicker
VEP. A flickering light stimulus will elicit VEPs that overlap in time to produce a
continuous oscillating waveform. A mathematical technique, the Fourier
analysis, is used to interpret the data (84,85).
As with the flash VEP, the flicker response does not require infant visual fixation
and can therefore be recorded in the newborn period. Early data suggest that
the flicker response may provide an alternative practical and objective indicator
of visual pathway integrity (86-88). The flicker VEP involves presenting a
flickering light stimulus at various frequencies usually ranging from 4 to 40 Hz.
This flickering light stimulus has the potential to evoke cortical activity at the
stimulation frequency. Mathematical analysis of the VEP by Fourier
transformation will determine whether a response is present at the frequency
under investigation (Figure 1-4). A cortical response detected at the exact
stimulus frequency being applied is designated the fundamental response (F1). A
cortical response present at an exact multiple of the stimulus frequency is
designated the harmonic response (F2 at double the stimulus frequency, F3 at
triple the stimulus frequency). The optimal stimulus frequency is the frequency
which generates the largest amplitude response. Limited data available in the
literature suggest the optimal flicker frequency is approximately 4Hz at one
week of age, increasing to 7Hz at six months of age, still considerably below the
optimal flicker frequency of approximately 18Hz in adult subjects (87,88).

Chapter 1 33
Figure 1-4 Infant flicker VEP A 4.7 Hz flickering light stimulus produces a continuous oscillating waveform, which is shown in (1). Fourier analysis is applied to the data to convert it from the time domain (1: time on x axis in milliseconds) into the frequency domain (2: frequency on x axis in Hz). This demonstrates a response at 4.7 Hz (large amplitude spike at a frequency of 4.7Hz on graph (2)). The second large spike at approx 10 Hz is the harmonic response (2). A harmonic response is commonly seen in analysis of the flicker VEP although its aetiology is unclear. It is signified by a response at an exact multiple of the primary response – in this case the harmonic response in graph (2) is shown by the large spike at 9.4Hz.

Chapter 1 34
1.4.2.3 Pattern VEP
The recommended pattern stimulus is a black and white checkerboard (75). The
stimulus is described by the visual angle subtended by the side of a single check
and measured in degrees and minutes of arc subtended at the eye. One minute
of arc (1‟) is a unit of angular measurement equal to one sixtieth (1/60) of a
degree.
Table 1-1 Pattern VEP check sizes
Minutes of
arc
Degree Size of check
15‟
0.25 Small
60‟
1 Medium
120‟
2 Large
All checks should be square with an equal number of light and dark checks. Two
forms of pattern VEP testing have been established – pattern reversal and
pattern onset. Pattern reversal involves a pattern that abruptly reverses (i.e.
black to white and white to black) at a specified number of reversals per
second. In the pattern onset VEP, the pattern is abruptly exchanged with a
diffuse grey background. Overall screen luminance must remain equal during
pattern reversal or pattern onset/offset.
Visual stimulation with an alternating pattern produces a VEP waveform that in
healthy adult subjects consists of a negative deflection at 75ms (N75), a positive
deflection at 100ms (P100) and a negative deflection at 135ms (N135) (Figure 1-
5). The pattern reversal VEP has relatively low intrasubject and intersubject
variability and it is therefore the preferred method of testing in most
circumstances. A pattern onset stimulus produces a similar negative-positive
deflection designated C1 and C2 (Figure 1-6).

Chapter 1 35
Figure 1-5 Adult pattern reversal VEP The pattern reversal VEP typically consists of three components: a negativity at 75ms, a positivity at 100ms and a negativity at 135ms.
Figure 1-6 Adult pattern onset VEP The pattern onset VEP is more variable in appearance than pattern reversal. The response consists of two major components in adults: a C1 component at approximately 75ms and a C2 component at approximately 125ms.

Chapter 1 36
An assessment of cortical acuity can be made by reducing the spatial frequency
of the pattern stimuli (i.e. the checks on the checkerboard get smaller and
smaller) until no reproducible VEP can be recorded.
The pattern VEP is generally thought to have limited applicability in the newborn
period, as it requires an awake and attentive baby. Harding et al (1989),
however, have documented a positive component at 280 ms in response to a
pattern reversal stimulus in infants between 33 and 37 weeks gestational age
(89).
The pattern reversal VEP in healthy infants in the first year of life is well
described; the main component being a simple positivity at approximately 200
ms, commonly referred to as P100 (Figure 1-7) (90-92). The VEP response to
small checks is absent at birth but develops between two to four months of age.
The latency of the P100 component reduces with increasing postnatal age, from
approximately 200 ms at six weeks of age, to 150 ms at six months of age and
100ms at 12 months (92). Pattern VEP latencies are longer for smaller check
sizes and therefore normative data specific for the check size under
investigation must always be used. A study of pattern VEPs in 161 infants
between three weeks and two years of age demonstrated rapid visual
development in the first six months of life as shown by the development of
reproducible VEPs to smaller check sizes and a rapid decrease in the latency of
the first reproducible positive peak (92).
Infant fixation on the visual display should be monitored during pattern VEP
testing and the recording interrupted during periods of loss of fixation. Various
strategies may be used to direct the infant‟s visual attention to the pattern
screen and include dangling small objects in front of the screen and
superimposing interesting pictures upon the pattern.

Chapter 1 37
Figure 1-7 Infant pattern reversal VEP Black and white reversing checkerboards produce a negative-positive-negative waveform, conventionally labelled N75-P100-N145: however, in infants, it is normal for the P100 peak to be as late as 200ms, depending on their age and the size of the checkerboard.

Chapter 1 38
Summary: Characteristic features of a maturing VEP in infancy
Flash VEP:
Emergence of P2 component
Emergence of P1 component
Increased amplitude of components
Reduced latency of components
Flicker VEP:
Increase in optimal flicker frequency
Pattern VEP:
Reduced latency of components
Response detected at smaller check sizes

Chapter 1 39
1.4.3 VEPs in preterm and sick infants
The flash VEP can be recorded from the occipital scalp as early as 24 weeks
gestation. The dominant feature of the preterm flash VEP is a broad negativity
at about 300 ms, commonly referred to as N3 (78,93). By around 35 weeks
gestation the P2 component emerges and the VEP starts to resemble that of
term infants (Figure 1-8).
Figure 1-8 Maturation of the infant flash VEP The predominant characteristic of the preterm infant VEP is a broad negativity at 300ms (N3). Taylor JM, McCulloch DL. Journal of Clinical Neurophysiology 1992; 9(3): 357-72.
Chapter 1 40
Several studies have investigated the predictive value of the flash VEP in
determining clinical outcome for preterm infants (78,94-97,77). Shepherd et al
(1999) recorded the flash VEP in 81 preterm infants and found the sensitivity and
specificity with regards to survival to be 86% and 89% respectively, and with
respect to development of cerebral palsy to be 60% and 92%. Pike et al (2000)
found the flash VEP could predict cerebral palsy with a sensitivity of 71% and
specificity of 90% and Kato et al (2000) found corresponding values of 78% and
94% in their study of 60 preterm infants. Poor prognostic factors for outcome
include an absent VEP at any age, a delayed N3 latency before term age and an
absent P2 component at term. In their study of 62 preterm infants, Beverley et
al (1990) found that an abnormal VEP correlated with intraventricular
haemorrhage but was not predictive of neurodevelopmental outcome. Similarly,
Ekert et al (1997) found that the flash VEP correlated with the development of
periventricular leukomalacia but not with neurodevelopmental outcome.
The flash VEP has also been investigated as a tool to predict prognosis in term
infants with perinatal asphyxia (79,98-100). The largest study by Taylor et al
(1992) examined serial flash VEPs in 92 term infants with birth asphyxia. They
found that death or severe neurological impairment could be predicted if an
absent VEP was documented at any time or if abnormalities of the waveform
persisted beyond day four of life. These findings were similar to other papers
which have found VEPs to have a high predictive value for death or
neurodevelopmental impairment (79,98,99).
Pattern orientation reversal VEPs have been described in term and preterm
infants using rapid orientation reversal of sine wave gratings at 4 Hz and 8 Hz
(101). The authors found that very low birth weight infants with normal
neonatal ultrasound scans and neurological outcome had similar VEPs to term
infants. Four infants in this study with abnormal cranial ultrasounds had absent
VEPs and a subsequent abnormal neurological outcome (101). A further study by
the same authors found the orientation reversal VEP to be predictive of a low
neurodevelopmental score in preterm infants with a sensitivity of 86% and
specificity of 65% (102). Mercuri et al (1999) found that the orientation reversal
VEP also correlated with cerebral damage as assessed by MRI in term infants
with perinatal brain insults (103). The use of VEPs in predicting outcome in
preterm and term infants is summarised in Table 1-2.

Chapter 1 41
Table 1-2 Predictive value of the VEP in infancy
Reference VEP type Subjects Outcome Sensitivity/specificity
(where given)
Taylor, McCulloch
(81)
Flash / pattern
32 children 4mth-5yr, cortical
blindness
Predictive of long-term visual outcome
100% / 94 %
McCulloch et al (80)
Flash / pattern
25 term infants, birth asphyxia
Predictive of long-term visual outcome
-
Shepherd et al (78)
Flash
81 preterm
infants
Predictive of death and CP
Death 86% / 89%, CP 60% / 92%
Pike, Marlow (97)
Flash
92 preterm
infants
Predictive of CP and transient dystonia
71% / 90%
Kato et al (77)
Flash
60 preterm
infants
Predictive of CP 78% / 94%
Taylor et al (100)
Flash 92 term infants, birth asphyxia
Predictive of death or severe neurological
impairment
78% / 100%
Whyte et al (79)
Flash 25 term infants, birth asphyxia
Predictive of
neurodevelopmental outcome
-
Muttitt et al (99)
Flash 36 term infants, birth asphyxia
Predictive of
neurodevelopmental outcome
91% / 100%
Whyte (98) Flash 93 term infants, birth asphyxia
Predictive of
neurodevelopmental outcome
89% / 100%
Atkinson et al (102)
OR-VEP 26 preterm
infants
Predictive of Griffiths development quotient
< 80
86% / 65%
Mercuri et al (103)
OR-VEP
29 term infants,
HIE or brain lesions on MRI
Predictive of neuromotor outcome
90% / 87%
CP: cerebral palsy, HIE: hypoxic ischaemic encephalopathy, MRI: magnetic resonance imaging

Chapter 1 42
1.4.4 Clinical applications of the VEP
Visual acuity estimation:
VEP estimates of visual acuity are useful in infants who cannot co-operate with
standard visual acuity tests (76,104). Visual acuity can be estimated by
determining the smallest pattern size that elicits an identifiable VEP. With
adequate co-operation reproducible VEPs should be obtained to check sizes
down to 15 minutes of arc or smaller in children over three months of age.
Lesions of the eye and ocular media:
Although diagnoses of ocular abnormalities are usually apparent from clinical
examination, the VEP can be used to provide presurgical information about the
integrity of the afferent visual pathways in conditions such as congenital
cataracts. The VEP can also be used to assess visual acuity and guide
management in conditions such as congenital glaucoma and retinal dystrophies.
Lesions of the afferent visual pathway:
In conditions such as optic nerve hypoplasia, optic nerve atrophy or glioma of
the optic nerve or chiasm, the VEP can be used to assess the degree of
functional visual loss and monitor disease progression and / or recovery.
Delayed visual maturation:
VEPs can be useful in infants with delayed visual maturation (DVM) to
differentiate between DVM and more serious aetiologies of permanent visual
impairment. Flash and pattern VEPs are usually present in DVM although they
may have prolonged latencies, small amplitude or abnormal waveforms (105).
The VEPs normalise as vision recovers spontaneously in these patients.
Amblyopia:
Amblyopia is subnormal visual acuity in one or both eyes despite correction of
any significant refractive error. The word is used to denote a specific

Chapter 1 43
developmental disorder of visual function arising from sensory stimulation
deprivation. Amblyopia is usually asymptomatic and is detected only by
screening programmes. Monocular pattern VEPs are sensitive for early detection
of amblyopia and can be used to monitor treatment. The typical findings in
amblyopia are small amplitude VEPs and absent VEPs to small check sizes in the
amblyopic eye. During occlusion therapy, VEPs become equal and symmetrical as
acuity equalises in the two eyes.
Cortical blindness:
Chronic cortical blindness is usually due to prenatal or perinatal events whereas
acute-onset cortical blindness results from an insult to the posterior visual
pathways. The pattern VEP is useful in determining the level of visual function in
infants with chronic cortical blindness. In children with acute-onset cortical
blindness, the flash VEP is a useful prognostic test for visual recovery (81).
Special circumstances: infants with nystagmus
In adult subjects, pattern onset and pattern reversal VEPs were compared
between subjects with nystagmus and those with normal vision using
checkerboard stimuli of two sizes (120‟ and 60‟). In the presence of nystagmus,
pattern reversal VEPs were significantly smaller and of poorer quality than those
obtained by pattern-onset stimuli (106). This study confirmed similar findings
from other authors suggesting that pattern-reversal stimulation is not reliable in
patients with horizontal nystagmus (107,108). Therefore, in the presence of
nystagmus, the recommended method of pattern VEP testing is pattern onset.

Chapter 1 44
1.4.5 Subject variables and the VEP
Sleep state: In young infants sleep state and eye opening state may influence
the flash and flicker VEP (82,109-111). Sleeping infants have longer latency
components compared to alert infants and the VEP amplitude is significantly
smaller during quiet sleep compared to awake in both term and preterm infants.
Documentation of sleep and eye opening state is therefore important during VEP
recording. Sleep state can be defined using a behavioural scoring system
assessing eye opening state, body movements, facial movements and
vocalisations (112). This can be simplified to four sleep states: quiet sleep,
active sleep, quiet wakefulness and active wakefulness.
Intrauterine growth restriction: Infants with IUGR were found to have smaller
amplitude flash VEPs compared to normally grown controls by Stanley et al
(113). However, all these IUGR infants had detectable VEPs of comparable
waveform to normally grown control infants.
Head size: The relationship between VEP latency and both sex and head size was
investigated by Gregori et al (2006) who recorded pattern-reversal VEPs in
healthy adult subjects (114). They found the P100 latency to be shorter in
female subjects with smaller head circumference although there was no
difference in the subgroup of the two sexes with a comparable range of head
sizes. They concluded that the difference in VEP latency between groups was
attributable to head size and not to sex. Malcolm et al have investigated gender
and OFC differences in healthy term infants undergoing pattern-reversal VEPs
(91): they found shorter peak latencies in infants with smaller head
circumference but also found an independent effect of gender on P1 latency,
with females demonstrating shorter peak latencies than males. Accurate
recording of growth parameters, including occipito-frontal circumference, and
sex is therefore important when comparing VEPs.

Chapter 1 45
1.4.6 Drug misuse and the VEP
Drug and alcohol misuse are associated with alterations in visual
electrophysiology in adults and in animal subjects (115-118). Rat pups born to
methadone-exposed mothers demonstrated delayed latency flash VEPs and
reduced amplitude flicker VEPs compared to controls at the peak of the
abstinence syndrome (119). There were no long term effects and all VEPs were
normal 21 days after birth.
Methamphetamine misuse causes a delay in P100 peak latency of pattern VEPs in
adult subjects compared to controls. It is suggested this may be due to dopamine
depletion during long term drug misuse (117). Pattern VEPs in adult subjects
exposed to methadone demonstrate a delay in N75 and P100 compared to
normal controls (115). Proposed mechanisms for these alterations in visual
sensitivity include increased turnover of dopamine in the retina and an adverse
effect on neural transmission within primary visual areas of the brain. Pattern
VEPs in adult subjects with previous cocaine use demonstrate a significantly
delayed P100 latency, conceivably due to the vasoconstrictive affect of cocaine
on the retinal, optic nerve and occipital vasculature (116). Chronic alcoholism
has also been shown to have an effect on the pattern VEP with reported
abnormalities including delayed P100 and abnormal VEP waveform (118,120).
Whitham et al (2010) have recently described pattern-reversal VEPs recorded at
four months of age in infants who had been exposed to methadone in utero and
buprenorphine in utero compared to control infants (121). They recruited 30
buprenorphine-maintained women, 22 methadone-maintained women and 33
non-opioid dependent controls. They found that the methadone exposed infants
had significantly delayed P1 latencies in response to 48‟ and 69‟ check sizes
compared to the buprenorphine exposed infants and controls. No neonatal
testing was undertaken in this study and the results were not correlated with
longer term visual outcomes.

Chapter 1 46
1.5 Conclusion
Maternal drug misuse is a significant problem in pregnancy and can seriously
affect the health of not only the mother, but also the fetus and newborn infant.
The currently recommended treatment for pregnant opiate-dependent women is
prescribed substitute methadone, but in common with other illicit drugs used in
pregnancy this crosses the placenta and enters the fetal circulation.
The association of maternal drug misuse with prematurity, IUGR and NAS is well
recognised and there is increasing evidence of longer term impact on infant
visual and neurodevelopmental outcome. Most of the evidence regarding longer
term visual outcomes in particular derives from small uncontrolled studies, with
no adequately powered controlled studies published to date.
The VEP can be used to assess the integrity and maturity of the infant visual
pathway. Testing is non-invasive and can be easily performed in the neonatal
period. Both visual and neurodevelopmental abnormalities can be predicted by
abnormal VEPs in infancy, with abnormalities including absent responses,
delayed latencies and immature morphology. Drug misuse is associated with
alteration of the VEP in adult humans and in animal models. To date, however,
few studies have investigated the effects of maternal drug misuse upon the
newborn infant VEP.
This study investigates in detail the effects of prescribed methadone and
additional illicit drug use in pregnancy upon the newborn infant VEP. It aims to
define abnormalities of the newborn VEP by comparison with matched infants
and, by repeating VEPs in these cohorts at six months of age, to assess whether
in utero drug exposure has a longer-term effect on visual electrophysiology.
Extensive data will be collected regarding drug exposure, including history and
toxicology analyses, allowing investigation of the effects of individual drugs of
misuse on the VEP, both at birth and at six months of age.
The study also aims to determine visual and neurodevelopmental outcomes in
later infancy in this cohort. By performing a combined clinical visual and
neurodevelopmental assessment at six months of age, it describes the incidence

Chapter 1 47
and scope of abnormalities and assesses how these relate to a history of NAS and
the pattern of in utero drug exposure.
The study seeks to determine the predictive role of the VEP in the early
detection of visual and neurodevelopmental abnormalities secondary to
maternal drug misuse in the knowledge that, if the VEP correlates with longer
term visual and/or developmental outcome, this relatively simple and
inexpensive investigation could trigger earlier referral to appropriate specialists
and result in improved outcome in this vulnerable group of infants.
The study also seeks to investigate the potential value of the VEP in predicting
the onset and severity of NAS. This condition has significant health implications
for the infant, family unit and health care resources but its pathophysiology is
poorly understood. If the VEP were found to be predictive of NAS, this
technique could be used to improve management of these infants by allowing
earlier targeted treatment of NAS and earlier hospital discharge of infants
unlikely to be affected.
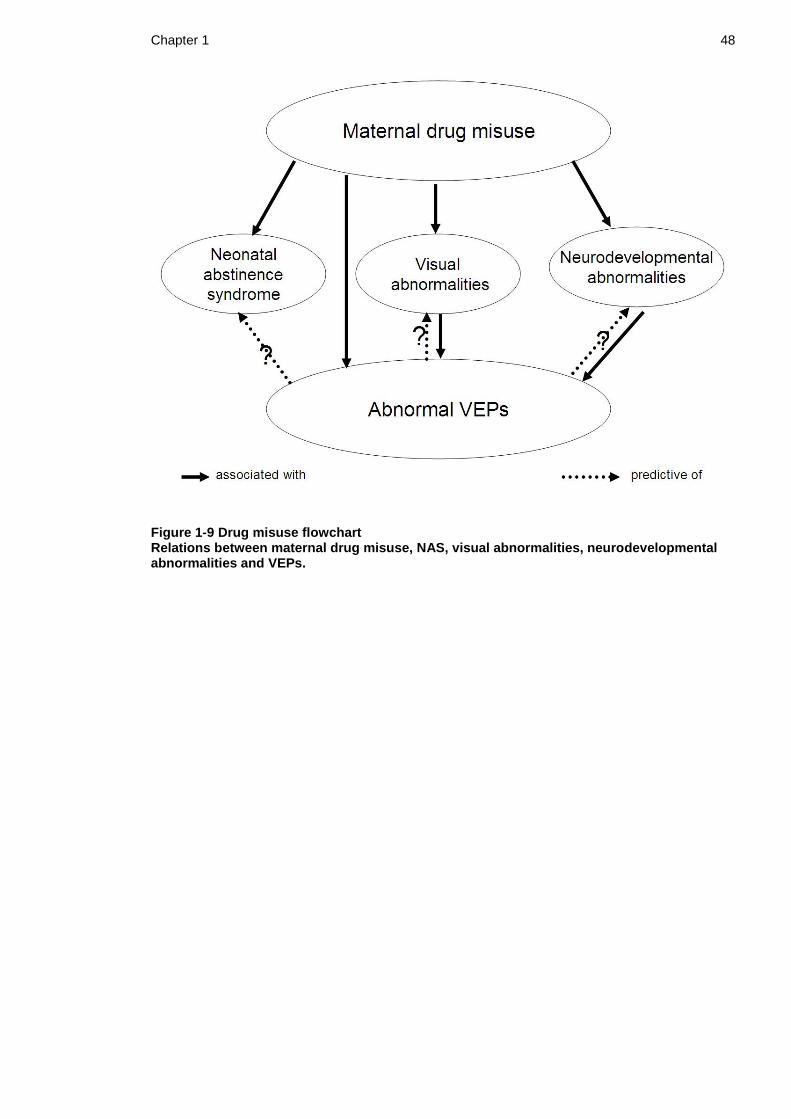
Chapter 1 48
Figure 1-9 Drug misuse flowchart Relations between maternal drug misuse, NAS, visual abnormalities, neurodevelopmental abnormalities and VEPs.

49
2 Chapter 2 Pilot studies
2.1 Flash Visual Evoked Potentials in newborn infants
exposed to methadone in utero
2.1.1 Introduction
Drug misuse has been demonstrated to cause an alteration of the VEP in human
adults as well as in animal studies, and maternal drug misuse has been
associated with impaired infant visual development (61,62,64,115,119). A pilot
study was undertaken to test the hypothesis that maternal drug misuse in
pregnancy is associated with an alteration of the VEP in the neonatal period.
2.1.2 Aims
To assess the feasibility of measuring flash VEPs in newborn infants
exposed to methadone in utero.
To compare flash VEPs recorded in the first few days after birth from
infants exposed to methadone in utero and from non-maternal drug
exposed control infants.
To describe the short term maturation of VEPs in drug-exposed infants.
2.1.3 Subjects and Methods
This was a prospective case-control pilot study. Eligible infants were born at
term (>37 completed weeks gestation) to drug-misusing mothers who had been
prescribed substitute methadone during pregnancy. Exclusion criteria were
ocular abnormalities, other major congenital abnormalities and significant
neonatal illness. Infants were recruited from the postnatal ward of the Women‟s
Reproductive Health Service in the Princess Royal Maternity, Glasgow. Control
subjects were healthy term infants born in the study hospital, using identical
exclusion criteria. The multidisciplinary care package offered to drug misusing
women included a postpartum stay of up to ten days to monitor for signs of NAS

Chapter 2 50
and to provide parenting support. Infants were assessed for significant NAS using
a modified Lipsitz score undertaken twice daily by experienced midwifery staff.
Significant NAS was diagnosed if two modified Lipsitz scores at 12 hourly
intervals were >5, and the infant was unusually difficult to console and/or
feeding poorly. Pharmacological treatment was then commenced, with oral
morphine solution as first line therapy.
Drug exposure in utero was determined from maternal history and infant urine
toxicology. Infant bag urine samples were obtained after consent and before
administration of any medication to the baby. Samples were stored at -20oC until
analysis in a single batch on an Abbott Architect c8200 analyser (Abbott, Abbott
Park, IL, USA), using Abbott Multigent reagents (EMIT immunoassays) according
to manufacturer‟s instructions. Assays included opiates, methadone,
benzodiazepines, amphetamines, cannabinoids and cocaine metabolites.
The first VEP recording was performed within four days of birth, and a second
recording was undertaken after one week if the infant remained in hospital.
VEPs were recorded from the occipital scalp using three silver-silver chloride
electrodes in the midline occipital (recording), midline frontal (reference) and
mastoid (ground) positions. Electrode positions were determined using the
standard 10:20 clinical montage (75). Scalp-electrode impedance was measured
before each recording and electrodes repositioned if necessary to ensure that
impedance was below 10 kohms. A hand-held integrating sphere (Colorburst®,
Diagnosys LLC, Lowell, MA 01854) was presented 5 cm from the infant‟s eyes in
the midline and delivered bright white flashes (50 cd s/m2) at 1 Hz. All
stimulation was binocular. A minimum of two averaged VEPs of 30 flashes each
were collected to ensure reproducibility. Awake/sleep state and degree of eye
opening were documented. VEPs were stored and subsequently assessed by two
independent observers, blinded to the infant‟s clinical course. VEPs were
classified as typical (predominant positivity near 200 ms, P2), atypical (more
complex response with unusual peak latencies), immature (predominant
negativity near 300 ms, N3), or non-detectable (Figure 2-1). The largest peak to
trough amplitude was measured for all detectable VEPs and the total sum
amplitude of all peaks and troughs was calculated. When present, peaks and
troughs were labelled in order of increasing latency as P1, P2, N3, P3 and

Chapter 2 51
amplitude from baseline and latency noted. Each outcome was compared
between methadone-exposed and control infants.
The study was approved by Glasgow Royal Infirmary research ethics committee
(REC reference: 06/S0704/5) and written informed parental consent obtained for
all infants.

Chapter 2 52
Figure 2-1 VEP classification
A. Typical VEP response: Predominant positivity at ~ 200ms (P2).
B. Immature response: Predominant negativity at ~ 300 ms (N3).
C. Atypical response: Complex response with unusual peak and trough latencies.
D. Non-detectable: No reproducible VEP present.

Chapter 2 53
2.1.4 Results
Twenty-one methadone-exposed infants and 20 control infants were recruited.
The characteristics of the two groups are described in Table 2-1. The maternal
methadone-exposed group differed from the control group with respect to birth
weight (2818 gm vs 3486 gm; p<0.001) and head circumference (32.9 cm vs 34.9
cm; p<0.001). The methadone-exposed infants were also of earlier gestation
(38.6±1.4 vs 39.8±0.95 weeks; p=0.002).
The first VEP was recorded at a median age of 30 hours – this age did not differ
significantly between the groups. VEPs were repeated after one week in 14 of
the maternal methadone-exposed infants, seven of whom developed significant
NAS. Eight methadone-exposed infants in total developed NAS requiring
pharmacological treatment. Interpretable data were obtained in 54/55 VEP
sessions; in one session the infant was too unsettled to allow a successful
recording (VEP was successfully recorded two days later).
Toxicology: Eleven of the 13 infant urine samples obtained were positive for
methadone. For both negative infant samples, maternal urine testing confirmed
methadone use during late pregnancy. Other substances detected in infant urine
included benzodiazepines (8/13), cocaine (2/13) and cannabinoids (1/13).
VEPs: At 1-4 days of age, maternal methadone-exposed infants had an abnormal
distribution of VEP waveforms compared to controls infants (Chi2 =12.0, p<
0.01), with fewer typical VEPs and more immature waveforms. VEPs were non-
detectable in five cases (Figure 2-2).

Chapter 2 54
Table 2-1 Pilot patient demographics
Methadone (n=21)
Control (n=20)
p value
Gestation (weeks)
38.6 (1.4)
39.8 (0.95)
0.002
Male: Female
10:11
10:10
0.879
Birth weight (grams)
2818 (533)
3486 (535)
<0.001
OFC (cm)
32.9 (1.38 )
34.9 ( 1.45)
<0.001
Data are means (standard deviations).

Chapter 2 55
Figure 2-2 Distribution of VEP waveforms. White: control group (n=20). Black: drug-exposed infants at a median age of one day (n=21). Grey: drug-exposed infants at a median age of eight days (n=14). Data are expressed as a percentage of each group.

Chapter 2 56
Median total sum amplitude was significantly different between groups: 17μV
for the methadone-exposed group and 30μV for the control group (Mann-Whitney
test, 95% CI of difference 5–25μV, p=0.002). All measured peaks and troughs for
methadone-exposed infants tended to have longer mean implicit times than
controls and the difference was significant for P2: P1, 132ms versus 117ms
(p=0.4); P2, 240ms versus 189ms (p=0.004); N3, 315ms versus 302ms (p=0.6); P3,
394ms versus 334ms (p=0.2). Amplitudes of P1, P2 and N3 were smaller for
methadone-exposed infants than controls: P1, 3μV versus 5μV (p=0.02); P2, 14μV
versus 18μV (p=0.009); N3, 10μV versus 16μV (p=0.045). P3 amplitude did not
differ between groups.
Sleep and eyelid closure had no significant effect on the amplitudes of these
bright flash VEPs but P2 was prolonged in sleep (215±28 ms) compared with P2 of
awake infants (194±16 ms; p=0.03).
After one week VEPs in the methadone-exposed infants had an increased
proportion of typical, and fewer non-detectable VEPs (Figure 2-2) but amplitude
remained low (median 11.3; range 0-21). There were no significant differences
in any of the measured VEP parameters between the seven infants who did and
the seven infants who did not develop NAS.
2.1.5 Conclusions
These pilot data showed significant differences in the neonatal flash VEP of
infants exposed to methadone in utero compared with non-drug-exposed control
infants. VEPs in drug-exposed infants were more likely to be absent and, if
present, to show delayed peak and trough latencies, smaller amplitudes and
immature waveform.
These pilot data suggested a need for a further study of VEPs in infants exposed
to drug misuse in utero. Questions raised included whether the VEP could be of
use in predicting the onset of NAS and/or predicting visual and
neurodevelopmental abnormalities secondary to maternal drug misuse. Longer
term follow up of a larger number of maternal drug-exposed infants, along with
comprehensive toxicology was required to address these questions, and to

Chapter 2 57
determine any relationship between the neonatal VEP and the pattern of
maternal drug misuse in pregnancy.

Chapter 2 58
2.2 Flicker Visual Evoked Potentials in healthy term
newborn infants
2.2.1 Introduction
An alternative method of assessing visual pathway function in the newborn
period uses steady state luminance stimuli, otherwise described as the flicker
VEP. Infants show maturation of the optimal stimulus frequency in the first year
of life, reaching typical adult values of 12 to 15Hz by approximately 15 months
of age. An optimal stimulus frequency of 4-5Hz has been reported in infants
during the first few months of life (86,88) but very few studies have reported
flicker VEPs in newborn infants.
2.2.2 Aims
To describe flicker VEPs in a cohort of healthy term newborn infants.
To determine optimal flicker frequencies and luminance, to guide the
testing protocol for subsequent studies of maternal drug-exposed infants.
2.2.3 Subjects and Methods
Subjects:
This was a prospective observational study carried out at the PRM, Glasgow. All
healthy, term (≥37 completed weeks gestation) infants born in the study hospital
were eligible for inclusion. Exclusion criteria were significant neonatal illness,
congenital ocular abnormality or a history of in utero exposure to drug misuse.
All infants were ≤48 hrs of age at the time of testing. Informed parental consent
was obtained for all participants and Research Ethics Committee approval was
obtained prior to study commencement.

Chapter 2 59
Recording:
VEPs were recorded in a dimly illuminated room with the infant placed supine in
a cot. Recording sessions were timed to suit the infant‟s feeding schedule in
order to maximise co-operation. VEPs were recorded using three silver-silver
chloride electrodes in the midline occipital (recording), midline frontal
(reference) and mastoid (ground) positions. Electrode positions were determined
using the standard 10:20 clinical montage. Scalp-electrode impedance was
measured before each recording and was below 5 kohms. Awake/sleep state
and degrees of eye opening were documented. The VEP signals were amplified
and band-pass filtered (0.6-100Hz).
Stimuli:
A hand held LED-based stimulator (Colorburst®, Diagnosys LLC, Lowell, MA
01854) was used to present the flickering light 5cm from the infant‟s eyes in the
midline. Frequencies of 2.9 Hz, 4.64 Hz, 7.3 Hz, 12.7 Hz, 18.55 Hz and 38.1 Hz
were presented at two different luminances (80 cds/m2 and 500 cds/m2),
subsequently referred to as dim and bright flicker respectively. All stimulation
was binocular. The stimulus was a white square waveform. A sample frequency
of 1000Hz was used and the time window varied according to the frequency
under investigation (4096ms for 2.9Hz and 4.64 Hz, 2048ms for 7.3 Hz, 1024ms
for 12.7 Hz, 18.5 Hz and 38.1 Hz).
Data processing and analysis:
Each averaged VEP was subjected to resampling and Fourier analysis (84). Noise
was estimated as the average of the two neighbouring spectral lines (one below
and one above the response frequency). A significant response was defined as a
signal to noise ratio (SNR) of > 2.82 which corresponds to a p value < 0.05 (85). A
significant response at each flicker frequency was sought for both the
fundamental response (F1) and its first harmonic (F2) (Figure 2-3, Figure 2-4).
The optimal stimulus frequency was described for each recording, defined as the
frequency that elicited the highest amplitude response at F1.

Chapter 2 60
Figure 2-3 Flicker F1 response Flicker VEP recorded on day 1 of life using a bright flicker light stimulus with a frequency of 4.6Hz. A significant response is shown at F1 (signal magnitude 4.8, Signal to Noise Ratio 11.6, p < 0.001) as demonstrated by the spike at 4.6Hz. No response is seen at F2.
Figure 2-4 Flicker F1 and F2 response Flicker VEP recorded on day 2 of life using a bright flicker light stimulus at a frequency of 4.6Hz. A significant fundamental response is seen at F1 (signal magnitude 7.4, Signal to Noise Ratio 7.15, p = 0.002) and a significant harmonic response is seen at F2 (signal magnitude 2.5, Signal to Noise Ratio 4.1, p = 0.013).
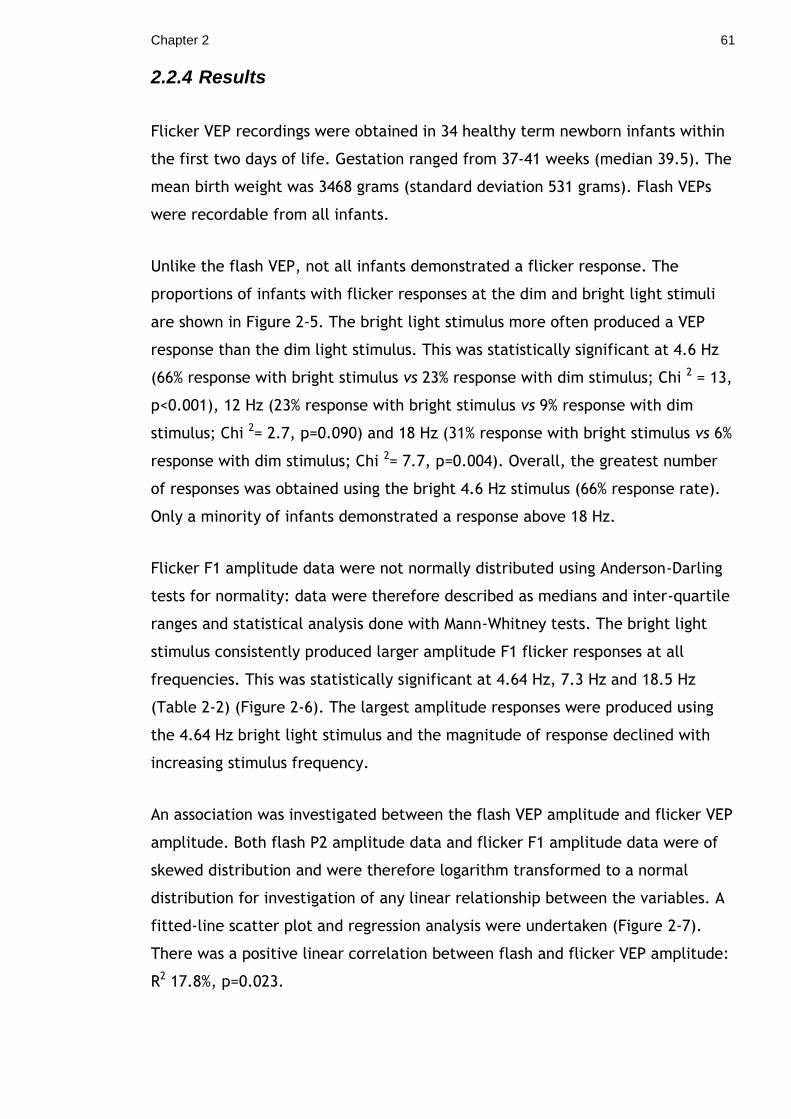
Chapter 2 61
2.2.4 Results
Flicker VEP recordings were obtained in 34 healthy term newborn infants within
the first two days of life. Gestation ranged from 37-41 weeks (median 39.5). The
mean birth weight was 3468 grams (standard deviation 531 grams). Flash VEPs
were recordable from all infants.
Unlike the flash VEP, not all infants demonstrated a flicker response. The
proportions of infants with flicker responses at the dim and bright light stimuli
are shown in Figure 2-5. The bright light stimulus more often produced a VEP
response than the dim light stimulus. This was statistically significant at 4.6 Hz
(66% response with bright stimulus vs 23% response with dim stimulus; Chi 2 = 13,
p<0.001), 12 Hz (23% response with bright stimulus vs 9% response with dim
stimulus; Chi 2= 2.7, p=0.090) and 18 Hz (31% response with bright stimulus vs 6%
response with dim stimulus; Chi 2= 7.7, p=0.004). Overall, the greatest number
of responses was obtained using the bright 4.6 Hz stimulus (66% response rate).
Only a minority of infants demonstrated a response above 18 Hz.
Flicker F1 amplitude data were not normally distributed using Anderson-Darling
tests for normality: data were therefore described as medians and inter-quartile
ranges and statistical analysis done with Mann-Whitney tests. The bright light
stimulus consistently produced larger amplitude F1 flicker responses at all
frequencies. This was statistically significant at 4.64 Hz, 7.3 Hz and 18.5 Hz
(Table 2-2) (Figure 2-6). The largest amplitude responses were produced using
the 4.64 Hz bright light stimulus and the magnitude of response declined with
increasing stimulus frequency.
An association was investigated between the flash VEP amplitude and flicker VEP
amplitude. Both flash P2 amplitude data and flicker F1 amplitude data were of
skewed distribution and were therefore logarithm transformed to a normal
distribution for investigation of any linear relationship between the variables. A
fitted-line scatter plot and regression analysis were undertaken (Figure 2-7).
There was a positive linear correlation between flash and flicker VEP amplitude:
R2 17.8%, p=0.023.

Chapter 2 62
Figure 2-5 Flicker VEP response The graph demonstrates the proportion of infants with a flicker VEP response at frequencies ranging from 2.9 Hz to 38.1 Hz. Responses to dim and bright light stimuli are shown and both the fundamental response (F1) and the first harmonic are shown (F2). The greatest proportion of responses was obtained using the 4.6 Hz bright flicker stimulus.

Chapter 2 63
Table 2-2 Flicker F1 VEP amplitudes
Freq Dim stimulus Bright stimulus p-value
2.9 Hz 2.79 (1.50-5.03) 2.98 (1.85-4.66) 0.946 (-0.87,0.86)
4.64 Hz 1.09 (0.66-1.75) 3.41 (2.60-4.59) <0.001 (-2.82,-1.68)
7.3 Hz 0.85 (0.46-1.13) 1.16 (0.61-1.56) 0.048 (-0.53,0.007)
12.7 Hz 0.47 (0.33-0.71) 0.58 (0.42-0.95) 0.057 (-0.30,0.003)
18.5 Hz 0.25 (0.16-0.34) 0.46 (0.31-0.71) <0.001 (-0.32,-0.10)
38.1 Hz 0.08 (0.04-0.12) 0.09 (0.05-0.15) 0.300 (-0.05,0.01)
Data are medians (inter-quartile ranges). Statistical analysis was done using Mann-Whitney tests. The 95% confidence interval for difference is given in brackets after the p-value. The bright flicker stimulus produced larger amplitude F1 responses at all frequencies which was statistically significant at 4.64 Hz, 7.3 Hz and 18.5 Hz. The optimal stimulus frequency was 4.64 Hz.

Chapter 2 64
Figure 2-6 Boxplot of flicker amplitude The bright flickering 4.64 Hz stimulus produced larger amplitude responses compared to the dim stimulus; Mann-Whitney test: p<0.001.
Figure 2-7 Scatterplot of flash and flicker amplitude There was a positive linear association between the flash and flicker VEP amplitude data (R
2
17.8%, p=0.023).
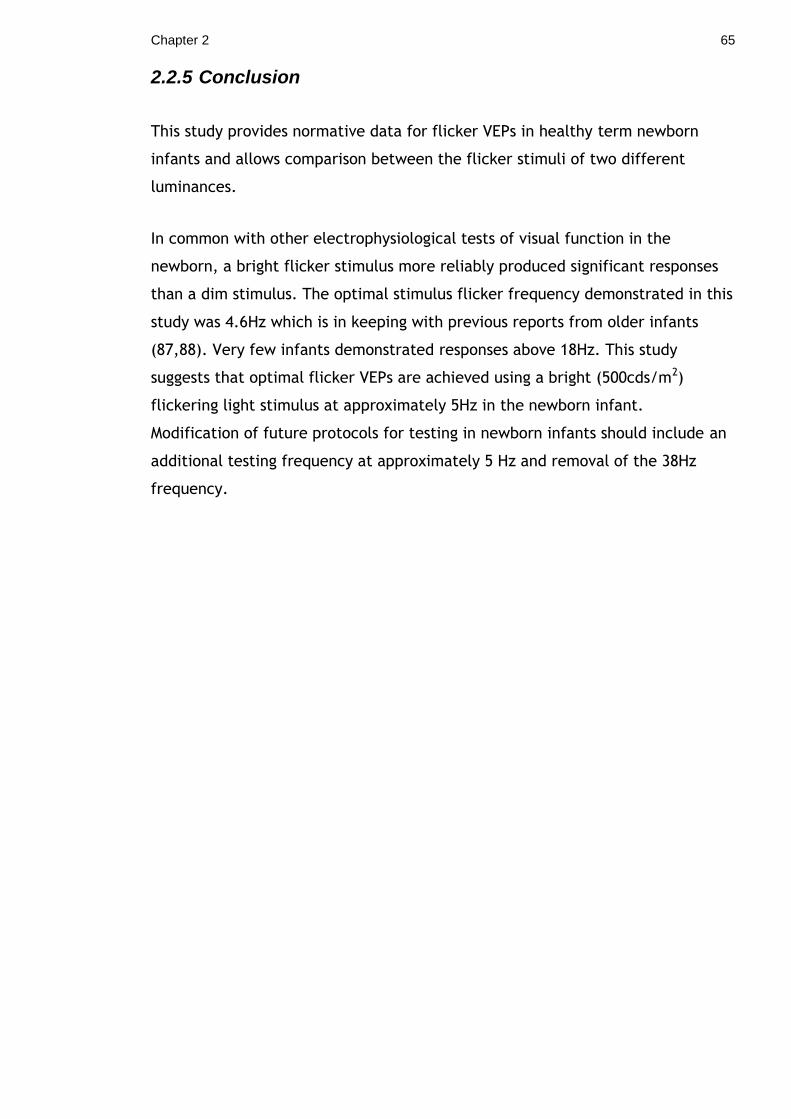
Chapter 2 65
2.2.5 Conclusion
This study provides normative data for flicker VEPs in healthy term newborn
infants and allows comparison between the flicker stimuli of two different
luminances.
In common with other electrophysiological tests of visual function in the
newborn, a bright flicker stimulus more reliably produced significant responses
than a dim stimulus. The optimal stimulus flicker frequency demonstrated in this
study was 4.6Hz which is in keeping with previous reports from older infants
(87,88). Very few infants demonstrated responses above 18Hz. This study
suggests that optimal flicker VEPs are achieved using a bright (500cds/m2)
flickering light stimulus at approximately 5Hz in the newborn infant.
Modification of future protocols for testing in newborn infants should include an
additional testing frequency at approximately 5 Hz and removal of the 38Hz
frequency.

Chapter 2 66
2.3 Visual Evoked Potentials in preterm infants
2.3.1 Introduction
Immature flash VEPs, similar to those of moderately preterm infants, have been
described in newborn infants exposed to methadone in utero in pilot study
1(122). Since flicker VEP recording is a more objective method applicable in the
newborn period there is a requirement for established normative values for
flicker VEPs in healthy moderately preterm infants.
2.3.2 Aims
To describe flash and flicker VEPs in a group of moderately preterm infants.
2.3.3 Subjects and Methods
This was a prospective observational study. Inclusion criteria were moderately
preterm infants (33 – 35+6 weeks‟ gestation) born at the PRM who were clinically
stable and appropriately grown (birth weight >10th centile and <90th centile).
Exclusion criteria were congenital ocular abnormality, other significant
congenital abnormality, significant neonatal illness and/or a history of maternal
drug misuse in pregnancy. To provide a comparative group 14 healthy term
infants were matched to the preterm infants for sex, DEPCAT score (123) and
maternal smoking status.
2.3.3.1 Recording
VEPs were recorded within 12 to 72 hours of birth. VEPs were recorded in a
dimly illuminated room with the infant placed supine in their cot or incubator.
Each recording session was timed according to the infant‟s feeds, to maximise
co-operation. VEPs were recorded using three silver-silver chloride electrodes in
the midline occipital (recording), midline frontal (reference) and mastoid
(ground) positions. Scalp-electrode impedance was measured before each
recording and was below 5 kohms. Awake/sleep state and degrees of eye
opening were documented. The VEP signals were amplified and band-pass
filtered (0.6-100Hz).

Chapter 2 67
2.3.3.2 Stimuli
A hand held LED-based stimulator (Colorburst®, Diagnosys LLC, Lowell, MA
01854) was used to present the flash and flicker light 5cm from the infant‟s eyes
in the midline. Bright (50 cds/m2) and dim (5 cds/m2) white flashes were
delivered at 1 Hz and a minimum of two averaged VEPs of 30 flashes each were
collected to ensure reproducibility. A bright flickering light stimulus was then
presented at frequencies of 4.64 Hz, 5.86 Hz, 7.32 Hz, 12.7 Hz and 18.55 Hz.
These flicker frequencies were modified from those used in the pilot study of
term newborn infants: an additional frequency was added at 5.86 Hz as the pilot
study had demonstrated an optimal response at 4.6 Hz, and the 38 Hz frequency
was removed as few term infants had demonstrated a response at this level. Two
different flicker stimuli were used at each frequency – a pulse wave and a sine
wave. All stimulation was binocular. A sample frequency of 1000Hz was used and
the time window varied according to the frequency under investigation (4096ms
for 4.64 Hz, 2048ms for 5.86 Hz and 7.32 Hz, 1024ms for 12.7 Hz and 18.55 Hz).
2.3.3.3 Data processing and analysis
Flash VEPs
VEPs were classified as present or absent. When present, peaks and troughs
were labelled in order of increasing latency as P1, P2, N3, P3 and amplitude
from baseline and latency noted. Total sum amplitude of all peaks and troughs
was calculated. The morphology of the preterm waveform was described relative
to term controls infants.
Flicker VEPs
Each VEP was subjected to resampling and Fourier analysis (85). Noise was
estimated as the average of the two neighbouring spectral lines (one below and
one above the response frequency) and a significant response was defined as a
signal to noise ratio (SNR) of >2.82 which corresponds to a p value <0.05 (85). A
significant response at each flicker frequency was sought for both the
fundamental response (F1) and the first harmonic (F2). The optimal stimulus

Chapter 2 68
frequency was also described, defined as the frequency which elicited the
highest amplitude response at F1.
The study was approved by the Glasgow Royal Infirmary research ethics
committee (REC reference number 09/S0704/2) and informed parental consent
was obtained for all participants.
2.3.4 Results
2.3.4.1 Demographics
Fourteen preterm infants and 14 term infants matched for sex, DEPCAT score
and smoking status were recruited to the study. The median gestation of the
preterm group was 35 weeks (IQR 34-35) and of the term group was 39 weeks
(IQR 38-41). Mean birth weight and head circumference of the preterm infants
were significantly lower than that of the term infants (mean birth weight 2219
grams vs 3219 grams, p<0.001; mean OFC 31.4 cm vs 35.1 cm, p<0.001).
2.3.4.2 Flash VEPs
Significantly fewer preterm infants had a VEP response with the dim light
stimulus compared to term infants. When a response was present it was of
reduced amplitude and delayed P2 latency (Table 2-3).
All preterm and term infants had a VEP response to the bright light stimulus.
Significantly fewer preterm infants had a P1 response compared to term infants.
Mean P2 latency with the bright light stimulus was again delayed in the preterm
group; however this was not statistically significant. Total VEP amplitude was
similarly reduced with the bright light stimulus (Table 2-3, Figure 2-8).

Chapter 2 69
Table 2-3 Flash VEPs in preterm and term infants
DIM FLASH BRIGHT FLASH
Preterm Term p-value Preterm Term p-value
VEP present 50% 100% 0.006 100% 100% 1.000
P1 present 0% 7% 1.000 0% 50% 0.006
P2 present 29% 93% 0.001 100% 100% 1.000
P2 latency (ms)
260
(13.3)
218
(32.7)
0.028 250
(44.6)
224
(37.1)
0.104
Total amp (µV)
1.15
(0-7.8)
25.45
(9.7-43.3)
<0.001 22.6
(17.4-31.2)
48.6
(27.9-69.7)
0.006
Data are percentage response (%), mean (standard deviation) for P2 latency and median (inter-quartile range) for amplitude.

Chapter 2 70
Figure 2-8 Boxplot of flash VEP amplitude in preterm infants. Preterm infants had significantly smaller amplitude responses compared to term infants with both the bright flash stimulus (p=0.006) and dim flash stimulus (p<0.001).

Chapter 2 71
The flash preterm infant VEP waveforms were also used to better define an
immature VEP morphology for future studies. On review of the waveforms it was
found that no preterm VEPs had P1 components and all had P2 and N3
components. In 13/14 preterm waveforms, the amplitude of N3 was greater than
three times the amplitude of P2 (Figure 2-9).
Figure 2-9 Preterm VEP waveform A bright flash VEP waveform recorded from an infant born at 34 weeks gestation on day 2 of life. No P1 component was present. The waveform was a predominant negativity with N3 amplitude greater than three times P2 amplitude.

Chapter 2 72
2.3.4.3 Flicker VEPs
Twelve preterm infants underwent flicker VEP analysis (two sets of data were
lost due to a computer system failure). Results were compared to those of 14
term infants matched as described above. Similar to term infants, preterm
infants had an optimal flicker response at 4.6 Hz. On statistical analysis the
preterm group had a greater proportion of responses at 5.86Hz compared to
controls but had fewer responses at 18.55Hz (Table 2-4). However, using a
Bonferonni correction to account for the number of statistical tests performed,
these differences were not significant.
Flicker F1 amplitudes were compared between the 12 preterm infants and the
14 matched term infants. There were few differences in amplitude between
groups (Table 2-5). At 18.55 Hz the term infants had larger amplitude flicker F1
responses, but after using a Bonferroni correction for the number of statistical
test performed this was no longer significant and may have been due to chance.

Chapter 2 73
Table 2-4 Flicker responses in term and preterm infants
Pulse wave Sine wave
Freq (Hz) Preterm Term p-value Preterm Term p-value
4.64 83% 64% 0.391 92% 79% 0.598
5.86 75% 29% 0.047 50% 79% 1.000
7.32 25% 43% 0.429 50% 57% 1.000
12.7 17% 21% 1.000 17% 14% 1.000
18.55 0% 36% 0.042 0% 14% 0.483
Statistical analysis was undertaken to investigate the flicker VEP response between preterm and term infants. Using a Bonferroni correction to account for the number of statistical tests performed, a p-value of <0.005 was considered significant.
Table 2-5 Flicker amplitude in term and preterm infants
Pulse wave Sine wave
Freq (Hz) Preterm Term p-value Preterm Term p-value
4.64 2.74 2.77 0.777 3.67 1.96 0.095
5.86 1.51 0.89 0.269 1.44 1.88 0.857
7.32 0.94 1.43 0.129 1.36 1.67 0.341
12.7 0.78 0.59 0.487 0.84 0.85 0.699
18.55 0.42 0.61 0.033 0.49 0.47 0.738
Data are median values. Mann-Whitney tests were used for comparisons between groups.

Chapter 2 74
2.3.5 Conclusion
Preterm infants had fewer flash VEP responses compared to term infants and in
particular fewer P1 responses. The total VEP amplitude was reduced and P2
latency delayed. A reasonable definition for the preterm infant flash VEP
waveform was: no P1 component present, predominant N3 waveform with N3
amplitude greater than three times the P2 amplitude. Preterm infants
demonstrated similar flicker responses to term infants with 4 Hz to 18 Hz
stimuli. However, the numbers studied may have been too small to detect
significant differences between groups. Optimal stimulus frequency for both
groups was 4.64 Hz.

Chapter 2 75
2.4 Ocular and electrophysiology abnormalities in
children exposed to methadone in utero
2.4.1 Introduction
There is increasing evidence to suggest that in utero opiate and benzodiazepine
exposure has an adverse effect on infant visual development (61,64). Within the
local ophthalmology and visual electrophysiology service, it was recognised that
an increasing number of children were being referred with a history of maternal
methadone use (personal communication – Drs R Hamilton and J MacKinnon).
2.4.2 Aims
To describe the combined ophthalmology and visual electrophysiology
findings in infants and children who had been exposed to methadone and
other drugs of misuse in utero and referred to a regional visual
electrophysiology service.
To use this information to inform the testing protocol for the follow-up
phase of the study.
2.4.3 Subjects and Methods
This was a retrospective descriptive case series of children referred to paediatric
ophthalmology services because of concerns regarding visual function and who
were known to have been exposed in utero to methadone. Ophthalmic and
orthoptic examination included visual acuity, cover tests, ocular motility,
cycloplegic refraction and dilated fundoscopy. Visual acuity was assessed using
age-appropriate tests; some subjects were unable to cooperate with behavioural
acuity tests and step VEP acuity assessment was used instead. Delayed visual
maturation was a retrospective diagnosis in babies with visual behaviour which
was poorer than expected for their postnatal age but which improved by six
months of age. Structured history taking was used to seek evidence of cerebral
visual impairment (CVI) in older children (72).

Chapter 2 76
Following ophthalmology and orthoptic review, all infants were assessed in a
specialist visual electrophysiology clinic where appropriate investigations were
undertaken depending on the age of the child and presenting symptoms. VEPs
and electroretinograms (ERGs) were recorded according to international
standards, but with methods modified to suit the age of the child (75). Pattern-
reversal VEPs to a black-and-white checkerboard at 100% contrast, subtending
30°×24° and reversing at 1.1Hz were recorded. Pattern-onset VEPs were
recorded to a black-and-white checkerboard at 100% contrast, interleaved with
an isoluminant grey screen, subtending 30°×24° and reversing at 1.1Hz. Flash
VEPs were recorded to a hand-held diffuse flash with a time-integrated
luminance of 11.7 cds /m2. In order to estimate acuity, step VEPs were recorded
to black-and-white reversing checks using real-time analysis and a successive
approximation algorithm to find spatial thresholds (124).
Paediatric and neonatal case notes were reviewed, and details obtained
regarding maternal antenatal urine toxicology when available. Subjects were
excluded from the case series if they had been born before 32 weeks gestation
or had another diagnosis which could potentially account for their visual
abnormalities such as fetal alcohol syndrome or birth asphyxia.
2.4.4 Results
Twenty children underwent comprehensive ophthalmology and visual
electrophysiology assessment. All children had been exposed to prescribed
substitute methadone in utero and a majority had also been exposed to illicit
drugs in utero, most commonly benzodiazepines (11/20, 55%) and heroin (8/20,
40%). Drug exposure as determined from case notes and maternal urine
toxicology is shown in Table 2-6. Twelve infants (60%) had received
pharmacological treatment for NAS.

Chapter 2 77
Table 2-6 Drug exposure and systemic findings
Patient
number
Gestation
(wks)
MDN Heroin BDZ Other drugs Alcohol Treatment
for NAS
1 38
2 32
3 39
4 40 Cannabis
5 38
6 39
7 40
8 38 Cocaine
9 36 Cocaine
10 34 Cannabis
11 40 Cannabis
12 35 Cannabis
13 40
14 38
15 36
16 38 Antidepressant
17 41
18 40 Cannabis
19 37
20 39 DF118
MDN: methadone, BDZ: benzodiazepines, NAS: neonatal abstinence syndrome, DF118: dihydrocodeine.

Chapter 2 78
Ocular and electrophysiology findings are shown in Table 2-7. The most common
abnormalities demonstrated were reduced visual acuity (19/20, 95%), nystagmus
(14/20, 70%), delayed visual maturation (10/20, 50%), strabismus (6/20, 30%)
and refractive errors (6/20, 30%).
Significantly more infants with a history of treated NAS developed nystagmus
than those without NAS: 11/12 (92%) versus 3/8 (38%); Fisher‟s exact test,
p=0.017. Nystagmus was horizontal in nature with the majority having a
pendular wave-form although one patient exhibited a jerk type pattern. The
observed characteristics of the nystagmus varied in being manifest, latent, or
manifest with a latent component. Interestingly, patient 13 initially had
manifest latent nystagmus which developed with time into latent nystagmus
alone. Fundal examination was abnormal in two cases – one case had bilateral
abnormal blood vessels crossing the macula which showed regression at five
months of age, and the other had slight pallor of both optic discs.
Twelve patients (60%) had abnormal visual electrophysiology. One of these
(patient 11) had a reduced amplitude cone and flicker ERG, but normal fundus
and normal pattern-onset VEP to 60‟ checks. All other ERGs recorded were
normal (n=13). Flash VEPs were recorded from 11 patients and were normal in
eight (73%) and delayed in three cases (patients 5, 10 and 12). Pattern-reversal
VEPs were recorded from six patients and were normal in two cases but delayed
or absent in four cases (patients 5, 9, 17 and 20). Pattern-onset VEPs were
recorded in six cases and were normal in five but delayed in one (patient 5).
Eleven subjects had their visual acuity estimated using the step VEP; in nine
cases (82%), acuity was abnormal for age. Step VEP acuity estimates agreed with
contemporary behavioural acuity assessments in all of the nine cases where both
were available.
Five children (25%) had significant neurodevelopmental problems
(developmental delay in four, cerebral palsy in one), three of whom (patients 2,
13 and 19) had CVI and one of whom (patient 12) had a delayed flash VEP.
Cerebral visual impairment (CVI), causing functional visual processing problems
including dorsal and ventral stream abnormalities, was screened for in the older
children by structured history taking and was found in five cases (25%).

Chapter 2 79
Table 2-7 Ocular and electrophysiology findings
Patient
DVM Nystagmus Strabismus Refractive
error
CVI Flash
VEP
P-R VEP P-O VEP VEP
acuity
1 XT Normal Raised
2 Normal Raised
3 Normal
4 Normal Raised
5 Delayed Abnormal Delayed
6 Normal Normal
7 ET Normal
8 Normal Raised
9 HA Normal Absent Raised
10 Delayed Normal Raised
11 Normal
12 XT MA (rt eye) Delayed Raised
13 MT Normal
14 XT H Raised
15 Normal
16 HA Normal Raised
17 Absent Normal
18
19 ET HA Normal
20 A Delayed Raised
DVM: delayed visual maturation, ET: esotropia, XT: exotropia, MT: microtropia. For refraction M: myopia, H: hypermetropia, A: astigmatism. CVI: cerebral visual impairment, VEP: visual evoked potential, P-O: pattern onset, P-R: pattern reversal.

Chapter 2 80
2.4.5 Conclusion
Ocular abnormalities detected in infants and children exposed to methadone and
other substances of misuse in utero included reduced visual acuity, nystagmus,
delayed visual maturation, refractive errors and strabismus (125). There was also
a high incidence of VEP abnormalities. Infants who have received treatment for
NAS may be at particular risk of visual abnormalities, especially nystagmus.
Visual assessment of infants exposed to drug misuse in utero should include an
assessment of visual acuity, observation for nystagmus, corneal reflexes to
assess for strabismus and assessment for refractive errors; as well as
measurement of VEPs. Due to the high incidence of nystagmus in this cohort, the
preferred method of pattern VEP testing should be pattern-onset (106).

81
3 Chapter 3 Methods
Maternal drug misuse can seriously affect the health of the fetus and newborn
infant. The association of maternal drug misuse with prematurity, IUGR and NAS
is well recognised, and there is growing concern about infant visual and
developmental outcome. Drug misuse is associated with changes in the visual
system as measured by VEPs in adults and in animal models. Since visual
abnormalities and neurodevelopmental abnormalities can be predicted by
abnormal VEPs in infancy, it is postulated that the VEP may be a valuable tool in
the detection of adverse effects of maternal drug misuse upon the infant.
Pilot work demonstrated the feasibility of recording VEPs in the neonatal period
and showed abnormal VEPs in infants exposed to drug misuse in utero compared
to unmatched controls (Chapter 2.1). Further pilot work described the scope of
clinical visual abnormalities in a selected group of infants and children exposed
to methadone in utero (Chapter 2.4). Further study was required to validate and
investigate these pilot data and would require recruitment of a large number of
methadone exposed infants, along with comprehensive toxicology collection and
longer term follow up.

Chapter 3 82
3.1 Objectives
There were two parts to the study:
Part 1: Neonatal visual evoked potentials
In the first part of the study, neonatal VEPs were measured in infants who had
been exposed in utero to methadone and other drugs of misuse. These VEPs
were compared to VEPs from matched non-maternal drug-exposed infants.
Associations were sought between neonatal VEPs and the pattern of in utero
drug exposure. Investigations were also undertaken to determine whether
neonatal VEPs were predictive of the development of NAS.
Part 2: Early visual and neurological development
In the second part of the study the same cohort of maternal drug-exposed and
comparison infants was followed-up at six months of age with clinical visual and
electrophysiology assessment as well as assessment of overall
neurodevelopmental progress. An association was sought between the neonatal
VEP and both visual and developmental outcome at six months of age.

Chapter 3 83
3.2 Hypothesis and aims
Hypothesis (1):
The neonatal VEP is altered in infants exposed in utero to methadone compared
to non-exposed infants.
Aims (1):
To describe neonatal VEPs in infants exposed in utero to methadone.
To compare these data with data obtained from non-maternal drug-exposed
infants.
Hypothesis (2):
The neonatal VEP can be used to predict which infants will develop NAS.
Aim (2):
To assess whether the neonatal VEP is predictive of NAS.
Hypothesis (3):
Clinical visual abnormalities are more common in infants exposed in utero to
methadone than non-exposed infants.
Aims (3):
To compare visual development at six months of age in infants exposed in utero
to methadone with that of non-maternal drug-exposed infants.
To define the incidence of visual abnormalities in infants exposed in utero to
methadone compared to non-exposed infants.

Chapter 3 84
Hypothesis (4):
Developmental abnormalities are more common in infants exposed in utero to
methadone than non-exposed infants.
Aim (4):
To compare developmental outcomes at six months of age in infants exposed in
utero to methadone with that of non-exposed infants.
Hypothesis (5):
The neonatal VEP can be used to predict which infants will develop visual and/or
developmental abnormalities.
Aim (5):
To assess if visual and/or developmental outcome at six months of age
correlates with the neonatal VEP.
Hypothesis (6):
At six months of age the VEPs differ between infants who had been exposed to
methadone in utero and non-exposed infants.
Aim (6):
To describe and compare VEPs in infants who had been exposed to methadone in
utero and non-exposed infants at six months of age.

Chapter 3 85
3.3 Subjects and setting
The study was conducted at the Princess Royal Maternity (PRM), the largest
maternity unit in Glasgow, which provides obstetric care to the majority of drug-
misusing women in the city.
Eligible infants were born to drug-misusing mothers prescribed substitute
methadone in pregnancy and delivered at or admitted within 48 hours of birth to
the PRM. Exclusion criteria were prematurity (defined as <36 completed weeks
of gestation), congenital ocular abnormality, other significant congenital
abnormalities and significant neonatal illness.
For comparative purposes, 50 non-maternal drug-exposed infants were recruited
with exclusion criteria identical to the cases. To correct for any potential
confounding effect of birth weight, gestation or socio-economic status on the
newborn infant VEP, the infants were matched as follows: completed week of
gestation, birth weight ± 250 grams, DEPCAT socio-economic group ± 1(123).
The study was approved by Glasgow Royal Infirmary Research Ethics Committee
prior to study commencement (REC reference number 08/S0704/40). The study
was also granted overall management approval for Greater Glasgow and Clyde
Health Board prior to commencement (Research and Development Project
number YN08NN325). All aspects of the study were conducted in accordance
with Good Clinical Practice guidelines.
Neonatal recruitment commenced on 15th October 2008 and ended on 30th March
2010. Six month follow-up commenced on 21st April 2009 and ended on 28th
September 2010.
Design: Prospective cohort study.

Chapter 3 86
3.4 Sample size calculation
Pilot study 1 demonstrated a significant difference in flash VEP latency,
amplitude and morphology between 21 methadone-exposed infants and 20
control infants (122). These infants were however exposed to poly-drug misuse.
The aim was to recruit enough patients to determine the independent effects of
different drugs of misuse as well as substitute methadone on the neonatal VEP.
From local audit and research data it was estimated that approximately 20% of
pregnant women prescribed substitute methadone would use no additional illicit
substances (126). It was therefore calculated that 100 maternal drug-exposed
infants would require to be recruited to identify a sub-group of 20 who had been
exposed to methadone alone, thereby permitting study of the isolated effect of
methadone on the neonatal VEP. In addition, to minimise the confidence
intervals of parameters such as VEP amplitude and latency the largest feasible
number of infants was recruited within the two year duration of the study. From
local audit, it was predicted that approximately 150 babies per year would be
delivered at PRM to mothers prescribed substitute methadone, of whom around
120 would be delivered at >36 weeks gestation. Based on previous studies, a 65%
recruitment rate predicted around 70 eligible infants recruited each year. This
was a conservative estimate as recruitment rate in the pilot study was 84%. To
allow sufficient time for completion of the six month follow-up an eighteen
month recruitment period was planned, anticipating recruitment of 100
maternal drug-exposed infants to the study. Drop-out was predicted to be
minimal for Part 1 of the study since all intervention was neonatal.
From this cohort, a sub-group of around 50 (50%) infants was expected to
develop significant NAS requiring pharmacological treatment (4,126). A group of
this size was likely to demonstrate 95% confidence intervals for averages of
neonatal flash VEP parameters of around ±2.3μV and ±10.7ms for P2 amplitude
and latency (78), which is adequately narrow for clinical purposes. To match this
study group in size, it was proposed to recruit the same number of non-maternal
drug-exposed infants (n=50).
Follow-up: Local audit demonstrated that approximately half of all methadone-
exposed infants offered follow-up clinic appointments failed to attend on two or

Chapter 3 87
more occasions (126). Follow-up studies of developmental outcome in infants
exposed to opiates in utero report drop-out rates varying from 10-60%
(38,45,47). A 40% drop-out by six months was therefore assumed, giving 60
drug-exposed infants and 30 comparison infants for visual and
neurodevelopmental assessment at this age. A well-accepted test battery of
child development for examining functional vision (127) used a sample size of 28
to define normal results at around six months: these data gave confidence to
describe adequately both groups with the predicted study numbers.
3.5 Recruitment
Eligible mothers and babies were identified by daily communication with the
midwifery and medical staff on the postnatal wards of the PRM. All mothers
were approached in person after discussion with the attending midwife. Mothers
were given verbal and written details of the study and time to consider
participation and to discuss the study with their partner (Appendix 1 - Parent
Information Sheet). If verbal consent was given, the mother was asked to sign a
consent form and was given a copy of both the consent form and Parent
Information Sheet to keep. A copy of the consent form was inserted in the
baby‟s notes and a record kept for the study document folder. Consent for the
six month follow-up was also obtained at this time, and maternal contact details
recorded. A letter was subsequently sent to the General Practitioner to inform
them of the infant‟s participation in the study (Appendix 2 - Letter to GP).
3.6 Data collection
3.6.1 Maternal data
Information regarding the pattern of drug misuse in pregnancy was obtained
from mothers of both drug-exposed and comparison infants by confidential
interview and by review of maternal case notes. Mothers were also asked about
their smoking habit and alcohol use in pregnancy. The interview was conducted
with the mother alone, and it was stressed that information disclosed would not
affect the care that either the mother or her baby would receive.
Chapter 3 88
Further maternal data collected included age, body mass index (BMI),
prescription of antidepressants or antipsychotics during pregnancy and
socioeconomic group. Socioeconomic group was defined using the Carstairs
DEPCAT scoring system (123). This scoring system uses information from the 2001
Census to place geographical areas into socioeconomic groups based on the
following: presence of overcrowding, unemployment, social class (based on
occupation) and car ownership. The report provides a DEPCAT score for each
postcode in Scotland with a score of one representing the most affluent areas
and a score of seven representing the most socially deprived areas.
3.6.2 Neonatal data
Data collected included birth weight, sex, gestation, method of delivery, Apgar
scores at birth, occipito-frontal circumference (OFC) and method of feeding.
Most of these data were collected from maternal and neonatal case notes. The
OFC was measured with a disposable measuring tape three times in succession
by the researcher and the largest value plotted on an appropriate growth chart
(Four-in-one decimal growth charts, Designed and published by Child Growth
Foundation, Harlow Printing Limited). The closest centile line for both birth
weight and OFC was documented. Low birth weight (LBW) was defined as birth
weight < 2500g, and small for gestational age (SGA) was defined for infants
whose birth weight was < 3rd centile for gestational age.
The presence and severity of NAS was recorded throughout the infant‟s hospital
stay, including requirement for and duration of pharmacological treatment. NAS
severity was assessed as per routine practice at PRM, using a modified version of
the Lipstiz scoring tool (Appendix 3 - PRM neonatal abstinence syndrome
guidelines) (28). Infants underwent twice daily NAS scoring by trained midwifery
staff on the postnatal ward. Treatment was commenced if infants had two NAS
scores ≥5 and they were unable to be settled between feeds. Treatment was
commenced as per protocol with oral morphine solution at a dose of 60
micrograms/kg/dose four hourly and increased if necessary in increments of 10
micrograms/kg/dose to a total of 80 micrograms/kg/dose four hourly. Infants
whose symptoms remained significant on the maximum dose of oral morphine
solution, or whose symptoms worsened after weaning of oral morphine solution,

Chapter 3 89
were commenced on oral phenobarbital solution. Length of hospital stay and
need for admission to the Neonatal Unit were recorded.
3.6.3 Confidentiality and data protection
All patient related information was stored on a password protected study
database. At study entry, each participant was allocated a unique study
identification number and all personal data were stored anonymously on the
study database under this number. A list matching study number to patient
identification was stored separately on a password protected computer.
3.7 Toxicology
3.7.1 Toxicology samples
Most methadone-prescribed mothers had routine urinalysis performed at their
booking hospital visit and at approximately 36 weeks gestation. Additional urine
toxicology samples were obtained in some mothers during their pregnancy, on
clinical grounds. A specimen of the infant‟s urine and a sample of meconium
were obtained as soon as possible after delivery (but after informed consent had
been obtained), to facilitate accurate assessment of the pattern of drug
exposure in utero. Urine was obtained via a urine bag applied to the infant‟s
perineum, and was sent to the laboratory in a universal container. Meconium
was obtained directly from the infant‟s nappy and collected into a universal
container. Samples of each were frozen at -20°C prior to being analysed in
batches. Meconium samples were also obtained from comparison infants after
study recruitment and screened for alcohol metabolites.
3.7.2 Toxicology analysis
Maternal and infant urine samples were analysed by the regional toxicology
laboratory at Gartnavel General hospital using Abbott enzyme multiplied
immunoassay technique (EMIT) assays run to Substance Abuse and Mental Health
Services Administration guidelines on an Abbott Architect Analyser. Assays

Chapter 3 90
included methadone, opiates, benzodiazepines, amphetamines, cannabinoids
and cocaine metabolites.
Meconium samples were analysed in the Department of Forensic Medicine and
Science at the University of Glasgow. Established methods for drug testing in
meconium involved enzyme-linked immunosorbent assay screening plus solid
phase and liquid-liquid extraction followed by gas chromatography-mass
spectrometry. These procedures allowed detection of the major drug groups,
including methadone and detected elevated fatty acid ethyl esters as a
biomarker for prenatal alcohol exposure (17,128). A cut-off level of ≥ 10,000
nanograms/gram was used to signify excessive alcohol consumption in pregnancy
(19).

Chapter 3 91
Figure 3-1 Infant drug exposure A comprehensive assessment of drug exposure was undertaken in infants exposed to methadone in utero using the methods summarised above.
Chapter 3 92
3.8 Neonatal VEP recording
VEPs were recorded within 72 hrs of birth in accordance with a Standard
Operating Procedure (Appendix 4 – Standard Operating Procedure for recording
VEPs). They were recorded from the occipital scalp using three silver-silver-
chloride electrodes placed according to international 10:20 classification. VEPs
were recorded to single flashes of light and then to flicker stimuli. All
stimulation was binocular. Light stimuli were delivered using a hand held LED
stimulator. Stimulus generation, recording and data storage were carried out
using the Espion® evoked potential system (Photograph 1). Impedance was
recorded at the start and end of the recording and aimed to be < 10 kOhms.
3.8.1 Flash VEPs
A white pulse flash light stimulus was delivered at a frequency of 1 Hz, at two
different luminance: three candelas seconds per meter squared (cds/m2)
(standard flash) and 28 cds/m2 (bright flash) (Photograph 2). A minimum of 30
and up to 100 trials were undertaken and repeated to ensure reproducibility. All
VEPs which were described as non-detectable had 100 trials repeated twice. The
sample frequency was 1000 Hz. The standard flash (subsequently referred to as
dim flash) was chosen as it represented International Society for Clinical
Electrophysiology of Vision (ISCEV) standards for flash VEPs in adults (75). The
bright flash was selected based on data from Pilot study 1 which demonstrated
significant differences between groups when a bright flash stimulus was used
(Chapter 2.1).
3.8.2 Flicker VEPs
Pulse and sine wave flicker stimuli were presented at 4.64 Hz, 5.86 Hz, 7.32 Hz,
12.7 Hz and 18.55 Hz. These frequencies were chosen based on pilot normative
control data which demonstrated an optimal flicker response at a frequency of
4.64 Hz in newborn infants (Chapter 2.2). A bright luminance flicker stimuli was
used (500 cd/m2), also based on the pilot study. Each neonatal VEP recording
took approximately 45 minutes. Sleep state and eye-opening during recordings

Chapter 3 93
were noted. Sleep state was defined as awake, drowsy or asleep and eye
opening state as open, intermittent or closed.
3.9 Follow up assessment
All infants were invited to participate in assessment at six months of age.
Contact details were recorded at recruitment. When the infant was
approximately five months old an initial invitation to attend for follow up was
issued: if the parent was not contactable at this stage via the recorded details,
contact tracing was undertaken by contacting the general practitioner and/or
patient services. If the infant was no longer in the care of the biological parents,
social work was contacted to trace the infant‟s whereabouts. An appointment
was made over the telephone for follow-up attendance, with every effort made
to ensure that the timing suited the parents/carers‟ schedules and the child‟s
routine. Where applicable, follow-up was co-ordinated with existing scheduled
hospital out patient clinic appointments. A letter was sent as confirmation of the
agreed appointment date (Appendix 5 – Letter to parent/carer) and a reminder
telephone call was undertaken on the day prior to the appointment.
To facilitate attendance, a taxi was made available to transport the
parent/carer and child to the hospital. Follow-up was performed at the PRM and
included: 1) repeat VEP testing, 2) clinical visual assessment, 3) developmental
assessment and 4) growth parameter measurement.
3.9.1 VEP testing
VEP testing at six months of age was undertaken using pattern-onset stimuli
(Photograph 3). Pattern onset stimuli produce larger and clearer VEPs in patients
with nystagmus compared to pattern reversal stimuli (106) and pilot data
(Chapter 2.4) had demonstrated a high incidence of nystagmus in a drug-exposed
study group. VEPs were recorded using the standard clinical montage of three
electrodes as described in the SOP. Pattern-onset VEPs were recorded to the
appearance of 60‟ (one degree of arc) black and white checks alternating
between a diffuse grey background with equal overall luminance presented at
one reversal per second. The 60‟ check size was chosen to comply with ISCEV

Chapter 3 94
standards for clinical recordings of transient pattern VEPs (75). Depending on
response to the 60‟ check size, further responses were investigated at 15‟ (0.25
degree of arc) and 120‟ (2 degree of arc) checks (Figure 3-2). Six month old
infants with normal vision were expected to demonstrate a VEP response at the
small (15‟) check size (92). The infant‟s attention was maintained on the
computer screen by tapping the fixation screen and dangling rattles and bells;
the recording was paused if the infant lost fixation. As with flash VEPs, a
minimum of 30 and up to 100 trials were recorded and repeated to ensure
reproducibility for each check size.
As the follow up study progressed it became apparent that only a minority of
infants were presenting with nystagmus, and a publication subsequent to
determination of the study protocol demonstrated that the pattern-reversal VEP
was delayed in four month old infants who had been exposed to methadone in
utero (121). It was therefore decided to add pattern-reversal VEPs to the visual
electrophysiology testing protocol for infants who had not yet undergone follow
up. Pattern-reversal VEPs were recorded to a black and white checkerboard at
100% contrast with 60‟ check sizes (one minute of arc) and presented at one
reversal per second.

Chapter 3 95
Figure 3-2 Pattern VEP testing All 6 month old infants were tested with a 60’ check size. Infants with a VEP response were then tested with a smaller (15’) check size. Infants with no response at 60’ were tested with a larger (120’) check size. Infants who remained compliant and attentive had all three check size VEPs recorded.

Chapter 3 96
3.9.2 Clinical visual assessment
Clinical visual assessment used a modification of the Atkinson test battery of
child development for examining functional vision (Appendix 6 – Standard
Operating Procedure for visual assessment) (127). This test battery provides
normal data for basic visual capacities as well as specific visual functions in
perceptual, visuo-motor and spatio-cognitive domains. Vision tests used
included: pupil responses, diffuse light reaction, lateral tracking, corneal
reflexes, lateral field testing by peripheral refixation, convergence of eyes to an
approaching object, defensive blink to an approaching object, visual following of
a falling toy, batting and reaching, screening retinoscopy and Cardiff acuity
cards for preferential looking. The test battery provided criteria for a pass or fail
in each test and recommendations for ophthalmology referral.
Pilot work demonstrated that the most commonly identified visual abnormalities
in infants exposed to methadone and other drugs of misuse in utero were
reduced visual acuity, nystagmus, delayed visual maturation, strabismus and
refractive errors (Chapter 2.4) (125). These were all covered by the visual
screening test as follows:
Cardiff acuity test cards to assess acuity and screen for DVM (Photograph
4),
Observation (including covering each eye in turn) and lateral tracking to
observe for nystagmus,
Corneal reflexes to observe for strabismus,
Screening retinoscopy to screen for significant refractive errors.

Chapter 3 97
3.9.3 Neurodevelopmental assessment
Neurodevelopmental assessment was undertaken using the Griffiths Mental
Development Scales for babies from 0 to 2 years (1996 revision) (Appendix 7 -
Standard Operating Procedure for neurodevelopmental assessment). This
provided a general developmental quotient (GQ) plus five subscales (locomotor;
personal/social; hearing and language; eye and hand co-ordination;
performance) (Photographs 5 and 6). A fail was defined as a GQ <85.
3.9.4 Growth parameters
Infants who attended follow-up were weighed using professional paediatric
scales (BD-815 MA paediatric weighing scales, Tanita Corporation) and their OFC
was measured. Growth parameters were plotted on sex-appropriate growth
charts. Further data collected included infant feeding and details of any
illnesses and/or hospital visits.
All assessments had to be co-ordinated with the child‟s nap, feeding times and
limited periods of co-operation. Full assessment took approximately one to one
and a half hours. Priority was given to the clinical visual assessment and pattern
onset VEP testing in infants with limited co-operation.
Any babies who failed to reach required standards for visual or
neurodevelopmental progress were referred to an appropriate specialist
(consultant paediatric ophthalmologist or consultant neonatologist) for further
assessment.
All drug-exposed infants seen at the six month follow-up were offered a formal
ophthalmology out-patient clinic appointment irrespective of whether visual
concerns were identified (Appendix 8 - Letter to ophthalmology). This was done
at the request of the consultant ophthalmologist involved in the study who
judged that sufficient concern existed regarding long-term visual outcome in
these infants to warrant the offer of formal follow-up. It also offered
independent verification of findings at the six-month study visit. Since the
ophthalmology service was offered on clinical grounds, it was not offered to
comparison infants. Assessment at the ophthalmology clinic included cover tests,

Chapter 3 98
ocular motility, visual acuity, cycloplegic refraction and dilated fundoscopy and
was undertaken at the Royal Hospital for Sick Children, Glasgow.
3.10 Data analysis
3.10.1 VEPs
3.10.1.1 Flash VEPs
Flash VEPs were categorised as present or absent. When present, the amplitude
and latency of peaks and troughs were measured. Peaks and troughs were
defined as: P1= any positive component prior to P2, N2= any negative component
prior to P2, P2= positive component between 126-300ms and preceding N3 if
present, N3= negative component between 200-400ms following the P2 if
present, P3= positive component following the N3. Amplitudes were recorded
between peaks and troughs or from baseline if there was no preceding peak or
trough. The total sum amplitude was calculated as the sum of all recordable
peaks and troughs.
Each flash VEP was also placed into a descriptive category of waveform
morphology as defined in the pilot study of methadone exposed infants (Chapter
2.1) (122) and the pilot study of VEPs in moderately preterm infants (Chapter
2.3). A new category was included as it was recognised that many of the infants
had a more mature response with a P1 component in addition to a P2
component. Descriptive categories were: typical (predominant positivity near
200ms (P2), no P1 present), mature (P1 and P2 present), immature
(predominant negativity near 300ms (N3): either no P2 present or N3 amplitude
> 3 times P2 amplitude) and atypical (response present but unusual waveform
which did not meet criteria of other categories). Examples of VEPs from each
category are shown in Figures 3-3 to 3-7.

Chapter 3 99
Figure 3-3 Typical flash VEP response Predominant positivity (P2)
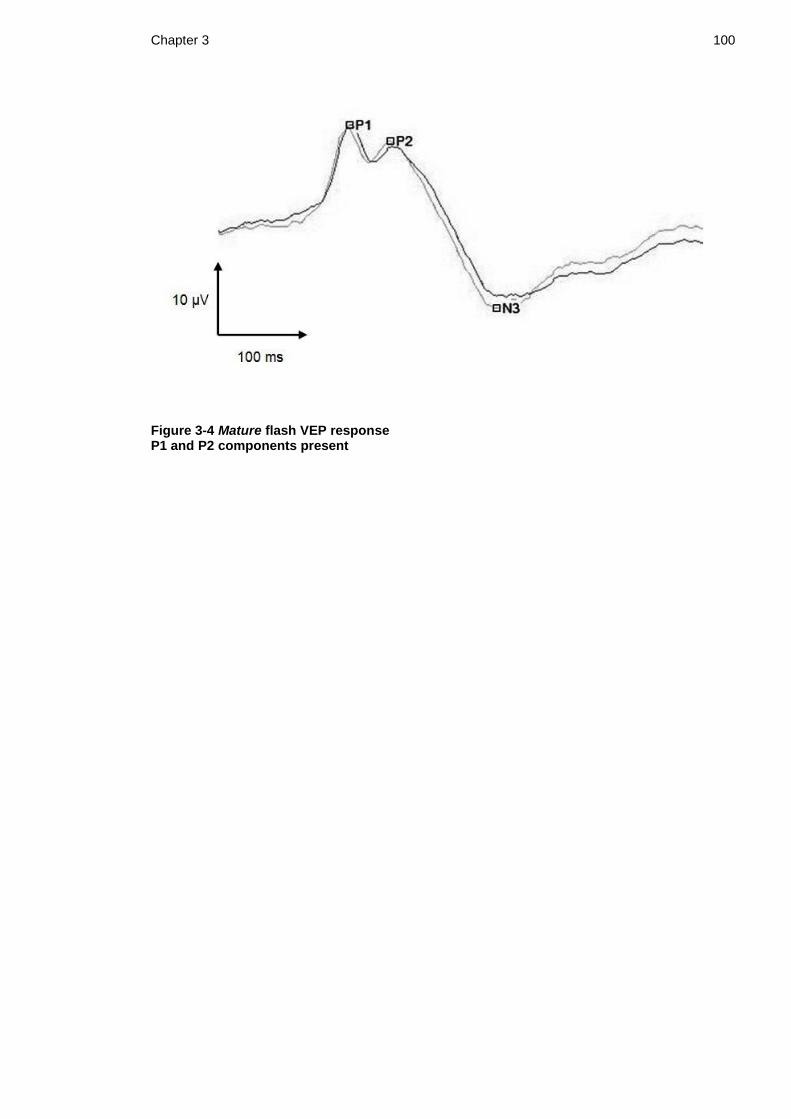
Chapter 3 100
Figure 3-4 Mature flash VEP response P1 and P2 components present

Chapter 3 101
Figure 3-5 Immature flash VEP response The waveforms were predominantly negative. When a P2 response was present, the N3 amplitude was greater than three times the amplitude of P2.

Chapter 3 102
Figure 3-6 Atypical flash VEP response Unusual waveform with a late positive response at 356ms (P3) and no preceding P1 or P2 component.
Figure 3-7 Non-detectable flash VEP response No reproducible VEP present

Chapter 3 103
3.10.1.2 Flicker VEPs
Each averaged flicker VEP was subjected to resampling and Fourier analysis. The
Meigan and Bach technique was employed to relate the statistical significance of
a response to the signal-to-noise ratio (84,85). This technique involved making
an estimation of the surrounding noise from the two neighbouring frequencies of
the stimulus frequency (one above and one below the response frequency).
Using this technique, the statistical significance of the response signal is related
to a specific signal-to-noise ratio (SNR): SNR= 2.82, p= 0.05; SNR= 4.55, p= 0.01;
SNR= 8.40, p= 0.001 (i.e. the response signal must be 2.82 times the surrounding
noise signal to be significant).
A significant response was defined as a signal to noise ratio (SNR) of > 2.82 which
corresponds to a p value < 0.05 (85). A significant response at each flicker
frequency was sought for the fundamental response (F1) and the F2 and F3
harmonic. When a response was present, its magnitude and SNR were measured.
The optimal stimulus frequency was described for each recording, defined as the
frequency that elicited the highest amplitude response at F1.
3.10.1.3 Pattern VEPs
Pattern onset VEPs were categorised as present or absent at each of the check
sizes tested (15‟, 60‟, 120‟). When present, the amplitude and latencies of C1
and C2 were recorded. It was recognised that most infants had a C2 peak
response but that the morphology of the peak varied in being a) single peak, b)
plateau, or c) bifid peak. For consistency, the latencies of the C2 response were
defined as follows: a) single peak response: C2 latency at highest point of peak,
b) plateau response: C2 latency at start of plateau, and c) bifid response: split
into C2a latency, first peak or shoulder and C2b latency, second peak or
shoulder (Figure 3-8).
Pattern reversal VEPs were categorised as present or absent at the 60‟ check
size. When present the latencies of N75 and P100 were recorded. Examples of
pattern VEPs in each category are shown in Figures 3-8 and 3-9.

Chapter 3 104
All VEPs were analysed by myself and independently by a second assessor (Dr R
Hamilton) with extensive experience in paediatric visual electrophysiology. The
second assessor was blinded to the infant‟s group and clinical progress. If there
was any discrepancy in analysis of the VEP a third independent assessor
(Professor DL McCulloch) reviewed the VEP, blinded to both infant group and
clinical progress.

Chapter 3 105
Figure 3-8 Infant pattern onset responses a) single peak, b) plateau, c) bifid peak
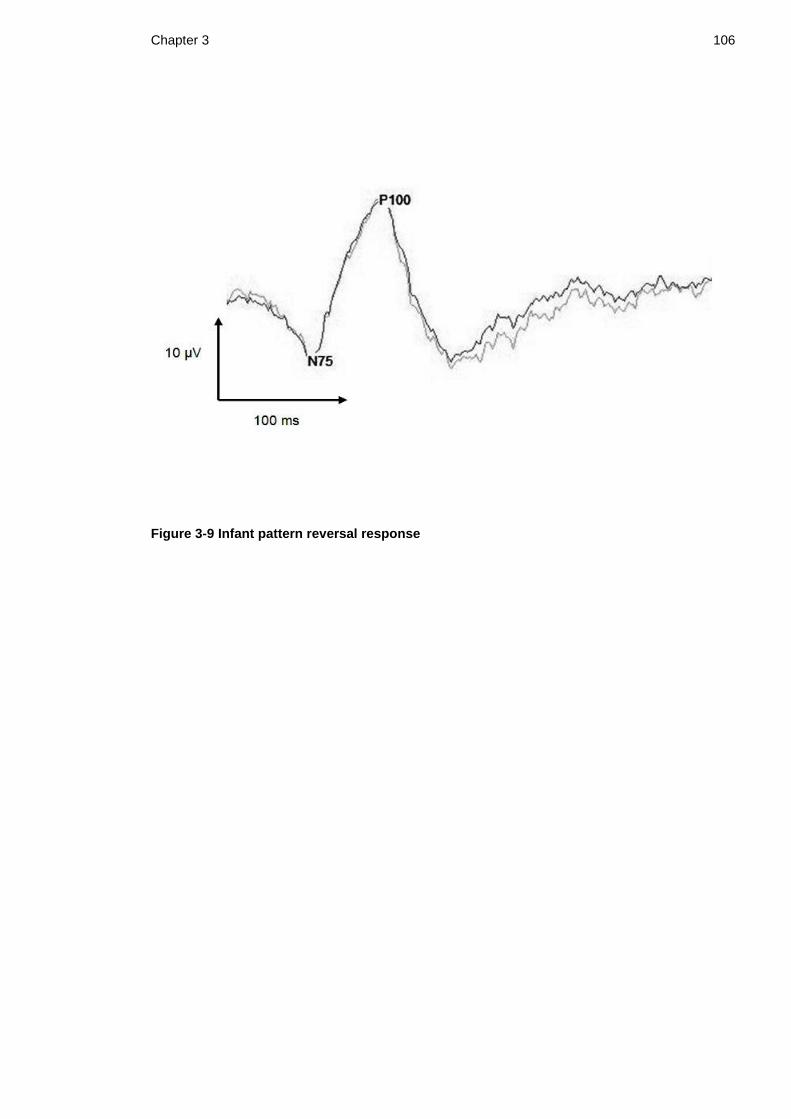
Chapter 3 106
Figure 3-9 Infant pattern reversal response

Chapter 3 107
3.10.2 Drug exposure
The dose of methadone prescribed to the mother at delivery was noted. For
other drugs of misuse, positive exposure was defined if either toxicology samples
or maternal history were positive. It was assumed for the purpose of the study
that toxicology samples could provide a false negative but not a false positive
result and therefore if any sample tested positive this confirmed exposure to the
drug under study. For example, if a mother denied cocaine use and mother and
infant urines were negative for cocaine but meconium was positive, this counted
as a positive exposure to cocaine. If a mother admitted amphetamine use but all
toxicology samples were negative for amphetamine, this counted as a positive
exposure to amphetamine. Drug exposure was then divided into the following
categories: group 1) opiate exposure alone, group 2) opiate and cannabinoid
exposure, group 3) opiate and benzodiazepine exposure (methadone + opiates +
benzodiazepines or methadone + benzodiazepines), group 4) opiate,
benzodiazepine and cannabis exposure, and group 5) other poly-drug exposure
which included stimulants (cocaine and/or amphetamines).
Excessive alcohol consumption during pregnancy was defined as a total FAEE
concentration in neonatal meconium greater than 10,000 nanograms/gram. The
group of infants who had been exposed to excessive alcohol during pregnancy
was compared to those infants not exposed, and excess alcohol exposure was
included in multivariate regression analysis.
3.10.3 NAS
NAS was categorised into four groups: 1) no NAS: infants with NAS scores ≤ 3 in
the first week of life and who did not require pharmacological treatment, 2)
mild NAS: infants with NAS scores > 3 in the first week of life and who did not
require pharmacological treatment, 3) moderate NAS: infants who required
standard treatment for NAS as per unit policy (maximum dose of 60
microgram/kg/dose oral morphine solution only) and 4) severe NAS: infants
requiring second line treatment for NAS (either increased dose of oral morphine
solution or addition of phenobarbital).

Chapter 3 108
3.11 Statistical analysis
Numerical data were described as means and standard deviations (SD) for
normally distributed data and medians and interquartile ranges (IQR: Q1, Q3) for
non-normally distributed data. Distribution of numerical data was determined
using Anderson-Darling tests for normality and data were also plotted on
histograms and boxplots.
Demographics:
Between group comparisons for normally distributed numerical data (birth
weight, OFC, maternal BMI) were analysed using 2 sample t-tests. Between
group comparisons for ordinal or ordered nominal categorical data (Apgar scores,
DEPCAT score, gestation) were analysed using Mann-Whitney tests. Between
group comparisons for nominal and binary categorical data (gender, method of
delivery, method of feeding, maternal smoking) were analysed using Chi-squared
tests.
VEPs:
VEP latencies and amplitudes were compared between drug-exposed and control
groups using 2 sample t-tests / Mann-Whitney tests depending on distribution of
data. VEP analysis involving proportions, such as presence of a response or
presence of individual components were undertaken using Z test for two
proportions or Chi-squared tests.
VEP morphology (mature, typical, immature) was compared between groups
using Chi-squared tests for nominal data.
Flicker VEP responses were compared between groups using Z tests for two
proportions. Flicker amplitudes were compared using Mann-Whitney tests. As
multiple flicker analysis was undertaken, a multivariate, repeated measures,
logistic regression model was applied to the flicker response data to compare
cases and controls.
Sub-group analysis:

Chapter 3 109
Data were divided into sub-groups depending on drug exposure (group 1-5
outlined above). Kruskal-Wallis tests were used for sub-group analysis of
numerical variables and Chi-squared tests were used to compare VEP morphology
between groups.
NAS:
VEP latencies and amplitudes were compared between infants who developed
NAS requiring pharmaceutical treatment and those who did not using 2 sample t-
tests / Mann-Whitney tests depending on distribution of data. VEP morphology
was compared between infants who developed NAS and those who did not using
Chi-squared tests.
NAS was further sub grouped into four categories as outlined above and Kruskal-
Wallis tests were used to investigate differences between sub groups.
Morphology between the four sub groups was compared using Chi-squared tests.
Potential confounders:
To assess for potential confounders, demographics were compared between
drug-exposed and control infants. Where there was any significant difference
identified between groups this predictor variable was entered into a multivariate
regression analysis model with each response variable.
Follow-up neurodevelopment:
Griffiths general quotient scores (GQ) were compared between drug-exposed
and control infants using Mann-Whitney tests for ordinal data. The sub-quotients
for each of the five sub-scales were also compared between groups. A GQ score
of <85 was classified as abnormal and the proportion of infants with abnormal
neurodevelopment was compared between groups using Z test for two
proportions. Linear regression models were used to correct for potential
confounders on developmental outcome.
Follow-up visual assessment:

Chapter 3 110
The proportion of infants who failed visual assessment in each group was
compared using Chi-squared tests (or Fisher‟s exact tests where group numbers
were small). Neonatal VEP amplitudes and latencies were compared between
drug-exposed infants with normal and abnormal visual screening using 2 sample
t-tests or Mann-Whitney tests depending on distribution of data. Neonatal VEP
morphology was compared between drug-exposed infants with normal and
abnormal visual screening using Chi-squared tests.
In addition, relative risk and attributable-risk percent were calculated for the
outcomes of abnormal VEP and abnormal clinical visual outcome.
All analyses were done using Minitab (versions 15 and 16) with a significance
level of 5%. Where available, 95% confidence intervals were quoted.

Chapter 3 111
Photograph 1: Espion evoked potential system (1= Espion recording system, 2=
hand held light stimulus for neonatal testing, 3= computer monitor for pattern
VEP testing)
Photograph 2: Neonatal flash VEP recording using hand held light stimulus

Chapter 3 112
Photograph 3: Pattern VEP recording in six month old infant (120‟ check size)
Photograph 4: Cardiff card visual acuity testing

Chapter 3 113
Photograph 5: Griffiths developmental assessment: eye and hand co-ordination
Photograph 6: Griffiths developmental assessment: locomotor skills
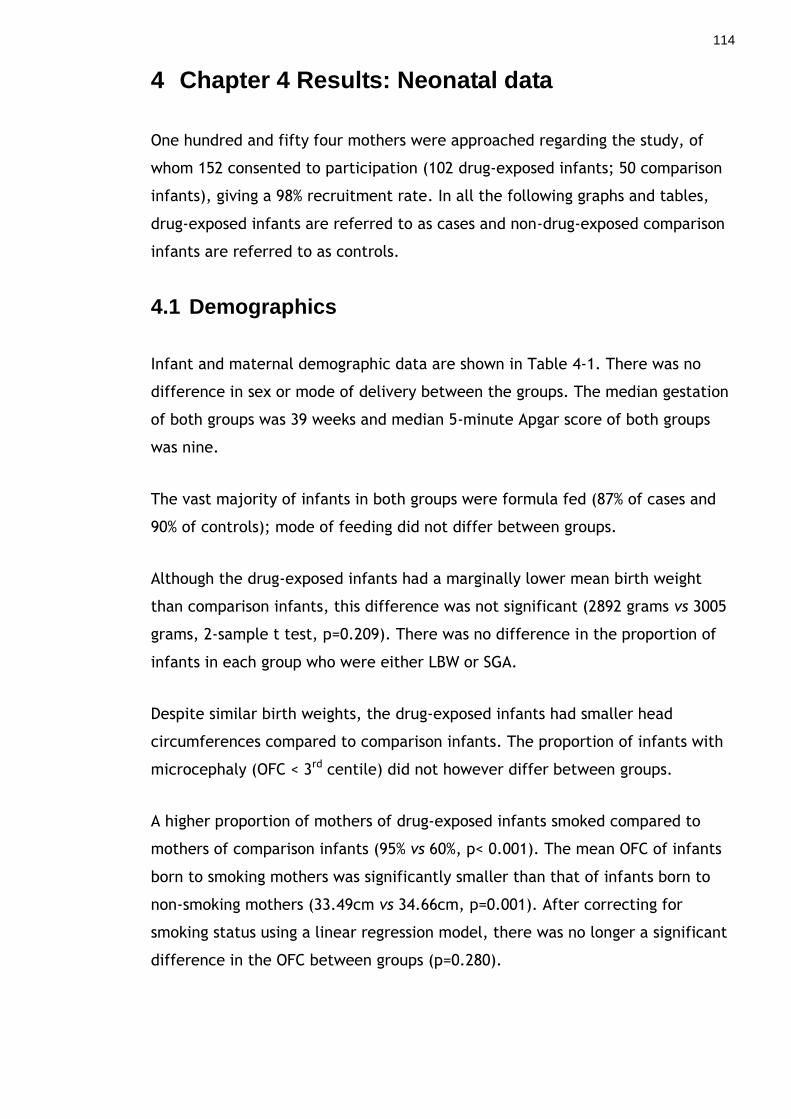
114
4 Chapter 4 Results: Neonatal data
One hundred and fifty four mothers were approached regarding the study, of
whom 152 consented to participation (102 drug-exposed infants; 50 comparison
infants), giving a 98% recruitment rate. In all the following graphs and tables,
drug-exposed infants are referred to as cases and non-drug-exposed comparison
infants are referred to as controls.
4.1 Demographics
Infant and maternal demographic data are shown in Table 4-1. There was no
difference in sex or mode of delivery between the groups. The median gestation
of both groups was 39 weeks and median 5-minute Apgar score of both groups
was nine.
The vast majority of infants in both groups were formula fed (87% of cases and
90% of controls); mode of feeding did not differ between groups.
Although the drug-exposed infants had a marginally lower mean birth weight
than comparison infants, this difference was not significant (2892 grams vs 3005
grams, 2-sample t test, p=0.209). There was no difference in the proportion of
infants in each group who were either LBW or SGA.
Despite similar birth weights, the drug-exposed infants had smaller head
circumferences compared to comparison infants. The proportion of infants with
microcephaly (OFC < 3rd centile) did not however differ between groups.
A higher proportion of mothers of drug-exposed infants smoked compared to
mothers of comparison infants (95% vs 60%, p< 0.001). The mean OFC of infants
born to smoking mothers was significantly smaller than that of infants born to
non-smoking mothers (33.49cm vs 34.66cm, p=0.001). After correcting for
smoking status using a linear regression model, there was no longer a significant
difference in the OFC between groups (p=0.280).

Chapter 4 115
Socioeconomic class tended to be marginally lower in the drug-exposed infants
(median DEPCAT 7) compared to the comparisons (median DEPCAT 6), but this
was not statistically significant. Maternal BMI did not differ between groups.
Fourteen of the methadone prescribed mothers were on antidepressant or
antipsychotic medication during pregnancy (ten on antidepressants alone, two
on antipsychotics alone, two on combined treatment), compared to none of the
comparison mothers (14/102 vs 0/50; Fisher‟s exact test p=0.005).
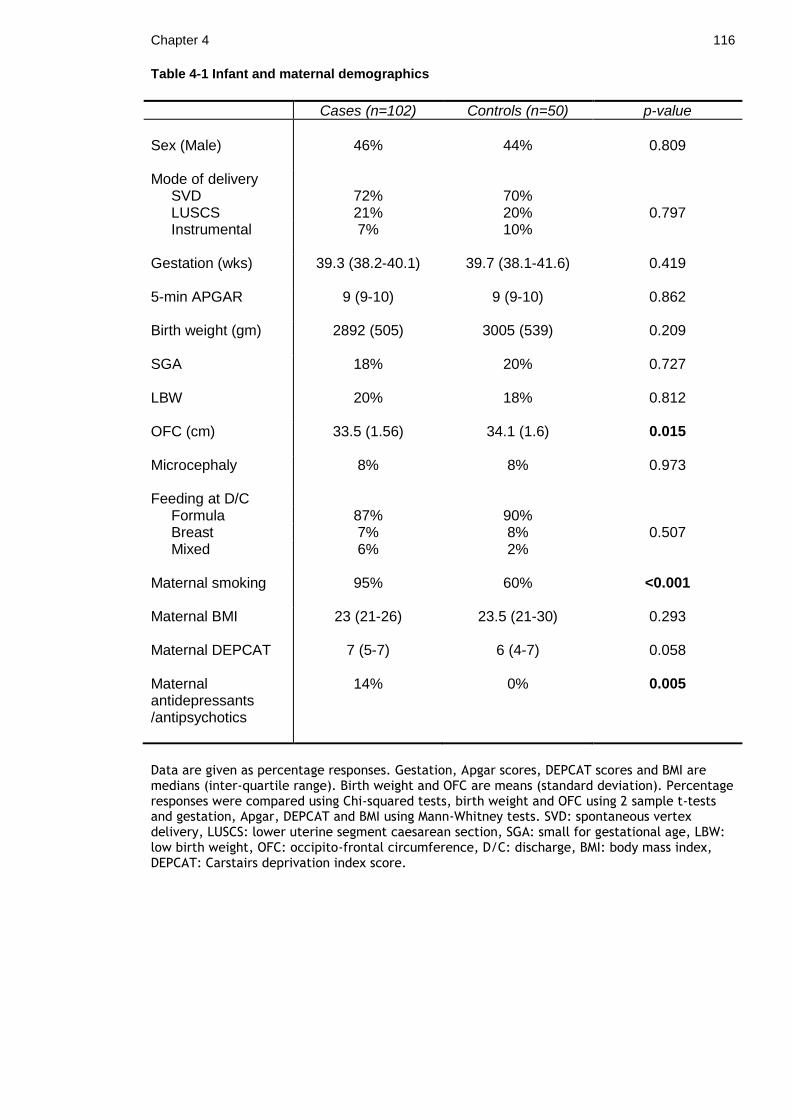
Chapter 4 116
Table 4-1 Infant and maternal demographics
Cases (n=102) Controls (n=50) p-value
Sex (Male)
46%
44%
0.809
Mode of delivery SVD LUSCS
72% 21%
70% 20%
0.797 Instrumental
7% 10%
Gestation (wks)
39.3 (38.2-40.1) 39.7 (38.1-41.6) 0.419
5-min APGAR
9 (9-10) 9 (9-10) 0.862
Birth weight (gm)
2892 (505) 3005 (539) 0.209
SGA
18% 20% 0.727
LBW
20% 18% 0.812
OFC (cm)
33.5 (1.56) 34.1 (1.6) 0.015
Microcephaly
8% 8% 0.973
Feeding at D/C Formula 87% 90% Breast 7% 8% 0.507 Mixed
6% 2%
Maternal smoking 95% 60% <0.001
Maternal BMI Maternal DEPCAT
23 (21-26)
7 (5-7)
23.5 (21-30)
6 (4-7)
0.293
0.058
Maternal antidepressants /antipsychotics
14% 0% 0.005
Data are given as percentage responses. Gestation, Apgar scores, DEPCAT scores and BMI are medians (inter-quartile range). Birth weight and OFC are means (standard deviation). Percentage responses were compared using Chi-squared tests, birth weight and OFC using 2 sample t-tests and gestation, Apgar, DEPCAT and BMI using Mann-Whitney tests. SVD: spontaneous vertex delivery, LUSCS: lower uterine segment caesarean section, SGA: small for gestational age, LBW: low birth weight, OFC: occipito-frontal circumference, D/C: discharge, BMI: body mass index, DEPCAT: Carstairs deprivation index score.

Chapter 4 117
4.2 Neonatal Abstinence Syndrome
Just under half of all drug-exposed infants developed NAS sufficiently severe as
to require pharmacological treatment (49/102, 48%). The proportion of infants in
each NAS severity group (no NAS, mild NAS, moderate NAS and severe NAS) is
shown in Table 4-2.
The median duration of oromorph treatment of the 49 infants treated with oral
morphine solution was nine days. 18 of these infants required additional
treatment with phenobarbital and the median duration of treatment of this
subgroup was 43 days. The median total treatment days were ten days (Table 4-
2). All babies treated with phenobarbital were discharged home on the drug with
weekly hospital follow-up.
The median hospital stay for the drug-exposed group (n=102) was 9.5 days.
Infants requiring pharmacological treatment had a significantly longer hospital
stay than infants not requiring treatment (median 13 days vs median 6 days,
p<0.001).
38/102 babies were admitted to NNU (37%). The median length of NNU stay was
ten days. The most common reason for NNU admission was ongoing or escalating
treatment for NAS (17 infants), however infants were also admitted for
respiratory distress (9 infants), poor weight gain or feeding (8 infants) and due
to social circumstances (4 infants). 47% of infants were offered a hospital out
patient clinic appointment following discharge.

Chapter 4 118
Table 4-2 NAS and admission details for drug-exposed infants
Cases (n=102)
Treated for NAS
48%
NAS severity
no NAS
24%
mild NAS
28%
moderate NAS
26%
severe NAS
22%
Oromorph days
9 (8-13)
Phenobarbital days
43 (38-57)
Total treatment days 10 (8-49)
Total hospital stay (days)
9.5 (6-13)
hosp stay with NAS (days)
13 (11-19)
hosp stay no NAS (days)
6 (6-8)
NNU admission
37%
NNU days
10 (5-17)
Data are given as percentage responses or medians (inter-quartile ranges). NAS: neonatal abstinence syndrome, NNU: neonatal unit. NNU days do not include days in post-natal wards.

Chapter 4 119
4.3 Neonatal flash VEPs
Neonatal flash VEP recording was undertaken in 152 infants (102 drug-exposed
infants, 50 comparison infants). Two sets of data were lost due to a computer
system failure, which left 150 sets of analysable data (100 cases, 50 controls).
Age at recording differed by a median of six hours between the drug-exposed
and comparison infants (median age of cases = 26 hr, median age of controls =
20.5 hr; p=0.006).
Both sleep state and eye opening state were compared between groups. The
sleep state did not differ significantly between groups (cases: 11% asleep, 49%
drowsy, 40% awake; controls: 6% asleep, 48% drowsy, 46% awake; Chi 2 =1.42,
p=0.470). There was also no significant difference in eye opening state between
groups with most infants in both groups having their eyes closed during recording
(cases: 10% open, 13% intermittent, 77% closed; controls: 14% open, 26%
intermittent, 60% closed; Chi 2 = 4.97, p=0.090).

Chapter 4 120
4.3.1 Normative control data
Neonatal flash VEPs were recorded in 50 comparison infants. Normative values
for these infants are shown in Table 4-3.
Table 4-3 Normative comparison flash VEP data
Dim Bright
P1 latency (ms) 117 (108-146) 137 (115-157)
P2 latency (ms) 215 (205-252) 206 (192-229)
N3 latency (ms) 335 (310-353) 321 (250-356)
Total amplitude (µV) 20.4 (11-31) 39.6 (28-67)
Data are medians (inter-quartile ranges).

Chapter 4 121
Associations were sought between VEP latency and amplitude and: gestation,
birth weight, OFC, sex and DEPCAT score in the comparison infants.
There was a significant negative correlation between both P1 and P2 latency and
gestation (P1 latency: Pearson‟s correlation coefficient= -0.61, p=0.001; P2
latency: Pearson‟s correlation coefficient= -0.45, p=0.001) (Figure 4-1). There
was no correlation between VEP amplitude and gestational age (Pearson‟s
correlation coefficient= 0.22, p=0.124).
There was no association between VEP latency or amplitude and sex, birth
weight, OFC or DEPCAT score.
Figure 4-1 Scatterplot of VEP latency and gestational age There was a significant negative correlation between flash VEP P2 latency and gestational age. R
2 = 20.3%, p=0.001.

Chapter 4 122
4.3.2 Data description and luminance comparison
One hundred and fifty infants underwent both dim and bright flash VEP recording
resulting in 300 VEPs for analysis. Prior to statistical analysis the VEP amplitude
and latency data were investigated for their distribution using histograms and
Anderson-Darling tests for normality. Both types of data appeared to have a
skewed distribution (Figure 4-2) and were therefore described as medians and
inter-quartile ranges.
The bright flash stimulus consistently produced more VEP components than the
dim stimulus. The median latencies were shorter with the bright stimulus
compared to the dim and this was statistically significant for the P2, N3 and P3
components (Table 4-4). The bright flash stimulus also produced larger
amplitude responses compared to dim: median dim flash amplitude 14.5 (IQR
6.4-28.6) vs median bright flash amplitude 31.2 (IQR 19.4-50.3); Mann-Whitney
test: 95% CI -20.4 to -12.7; p<0.001 (Figure 4-3). The morphology of the VEP
waveform differed between the dim and bright flash (Chi 2 = 50.4, p < 0.001)
(Figure 4-4) with the bright flash stimulus producing more mature responses and
fewer absent responses.
In summary, a bright flash stimulus produced larger amplitude VEP responses
with more components and shorter latencies compared to a dim light stimulus.
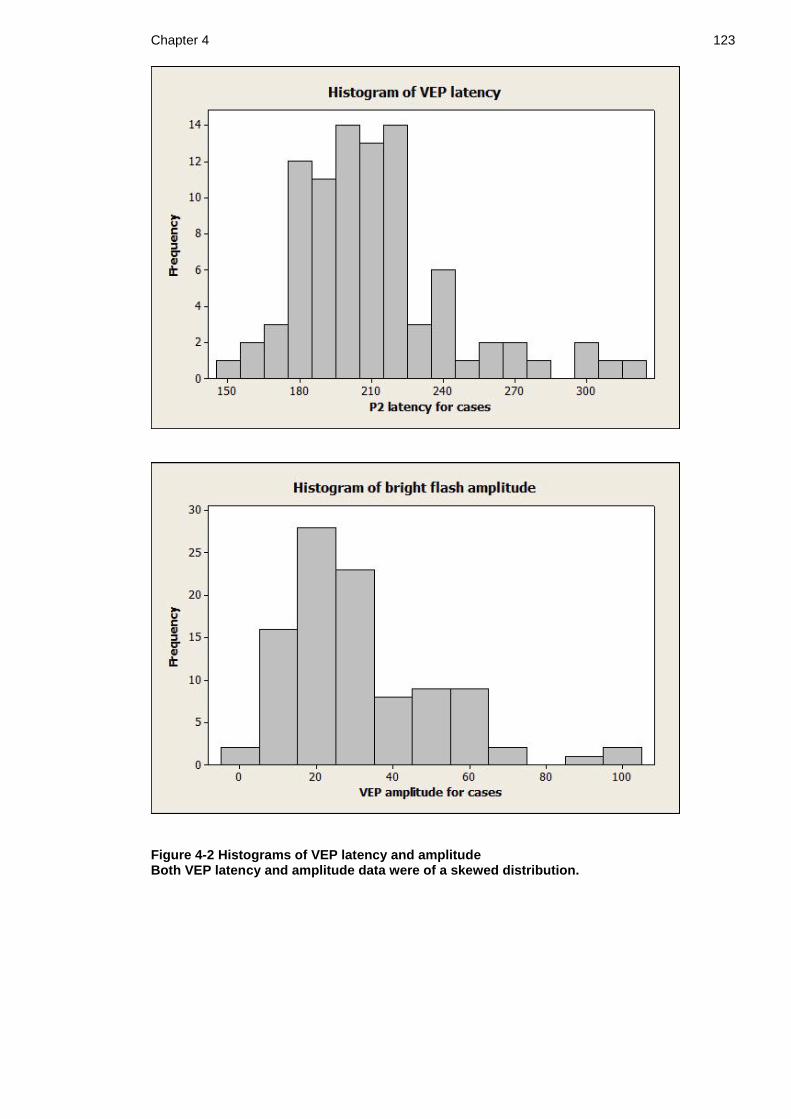
Chapter 4 123
Figure 4-2 Histograms of VEP latency and amplitude Both VEP latency and amplitude data were of a skewed distribution.

Chapter 4 124
Table 4-4 VEP data description and luminance comparison
DIM stimulus
(n=150)
BRIGHT stimulus
(n=150) p-value
P1 responses
10
45
<0.001
P1 latency (ms) 138.5 136 0.458
IQR 117-194 115-202
N2 responses 20 68 <0.001
N2 latency (ms) 170.5 167.5 0.640
IQR 157-200 149-193
P2 responses 96 138 <0.001
P2 latency (ms) 213.5 207 0.019
IQR 198-243 192-224
N3 responses 90 129 <0.001
N3 latency (ms) 325 305 0.004
IQR 298-354 249-339
P3 responses 28 60 <0.001
P3 latency (ms) 385 323 0.028
IQR 312-425 279-387
Data given are number of responses, medians for latencies and inter-quartile ranges (IQR). The data represents all babies in the study (cases and controls, n=150). Latencies were compared using Mann-Whitney tests and proportion of responses compared using Z test for 2-proportions.
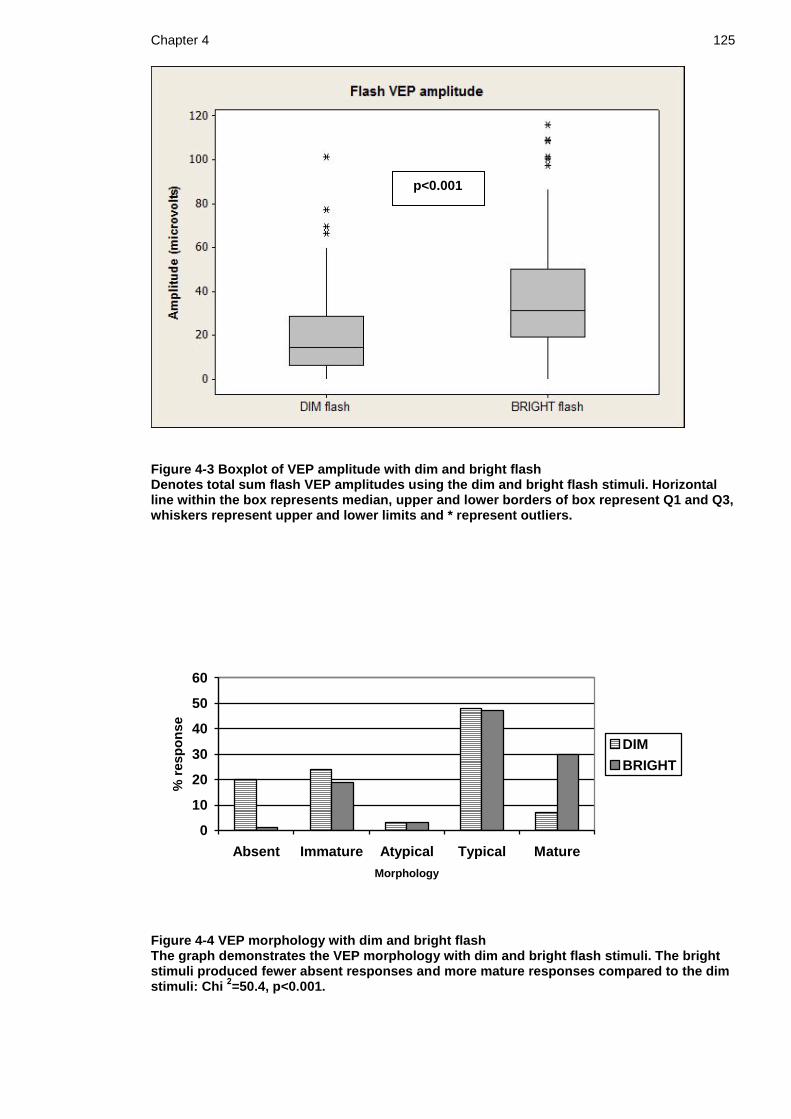
Chapter 4 125
Figure 4-3 Boxplot of VEP amplitude with dim and bright flash Denotes total sum flash VEP amplitudes using the dim and bright flash stimuli. Horizontal line within the box represents median, upper and lower borders of box represent Q1 and Q3, whiskers represent upper and lower limits and * represent outliers.
0
10
20
30
40
50
60
Absent Immature Atypical Typical Mature
Morphology
% r
esp
on
se
DIM
BRIGHT
Figure 4-4 VEP morphology with dim and bright flash The graph demonstrates the VEP morphology with dim and bright flash stimuli. The bright stimuli produced fewer absent responses and more mature responses compared to the dim stimuli: Chi
2=50.4, p<0.001.
p<0.001

Chapter 4 126
4.3.3 Drug-exposed and comparison VEPs
VEP components and latency
The drug-exposed infants had fewer P1 and P2 components present with both
the dim and bright flash. Only 53% of cases had a P2 present with the dim flash
compared to 86% of the controls (p<0.001). In addition, only 21% of the cases
demonstrated a P1 response with the bright flash compared to almost half of the
controls (48%) (p=0.001) (Table 4-5). Significantly fewer drug-exposed infants
had a N2 response present than comparisons with the bright flash stimulus: 38%
cases vs 60% controls, Chi2=6.523; p=0.011. Median latencies of the P1, P2, N2
and N3 components did not significantly differ between groups. To further
investigate any possible differences in VEP flash latency between groups, the P1
and P2 latency data were logarithm transformed to a normal distribution and
subjected to 2-sample t-tests. There was no significant difference in the mean
log P1 latency between groups (log P1 latency cases: 4.93 (SD 0.25), log P1
latency controls: 4.91 (SD 0.23), 95% confidence interval -0.119 to 0.168;
p=0.731). Similarly there was no difference in mean log P2 latencies (log P2
latency cases: 5.34 (SD 0.15), log P2 latency controls 5.33 (SD 0.16), 95%
confidence interval -0.052 to 0.054; p=0.960).
VEP amplitude
The drug-exposed infants had significantly smaller amplitude responses with
both the dim and bright flash compared to the comparisons. The median VEP
amplitude with the dim flash for the cases was 11.4 V (IQR 0-20.5) compared to
20.4 V (IQR 11.4-31.1) for the controls; Mann-Whitney p<0.001 (95% CI –14 to -
4.8). With the bright flash stimulus, the median amplitude was 27 V (IQR 17.1-
41.7) for the cases versus 39.5 V (IQR 28.1-66.6) for the controls; p<0.001 (95%
CI –20.2 to -6.4) (Figure 4-5).
Flash morphology
Dim flash: VEPs were classified as absent, atypical, immature, typical or mature
as defined in the methods section. 27% of drug-exposed infants had an absent
VEP compared to 6% of comparisons. For the purpose of statistical analysis,
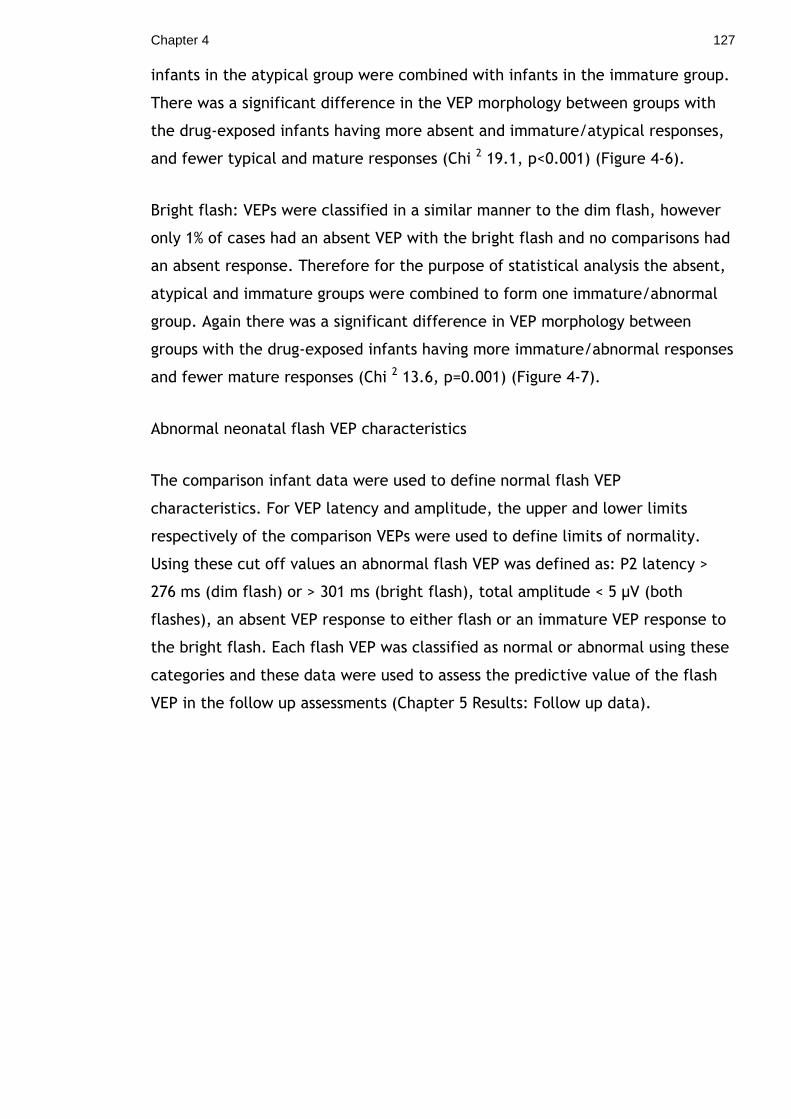
Chapter 4 127
infants in the atypical group were combined with infants in the immature group.
There was a significant difference in the VEP morphology between groups with
the drug-exposed infants having more absent and immature/atypical responses,
and fewer typical and mature responses (Chi 2 19.1, p<0.001) (Figure 4-6).
Bright flash: VEPs were classified in a similar manner to the dim flash, however
only 1% of cases had an absent VEP with the bright flash and no comparisons had
an absent response. Therefore for the purpose of statistical analysis the absent,
atypical and immature groups were combined to form one immature/abnormal
group. Again there was a significant difference in VEP morphology between
groups with the drug-exposed infants having more immature/abnormal responses
and fewer mature responses (Chi 2 13.6, p=0.001) (Figure 4-7).
Abnormal neonatal flash VEP characteristics
The comparison infant data were used to define normal flash VEP
characteristics. For VEP latency and amplitude, the upper and lower limits
respectively of the comparison VEPs were used to define limits of normality.
Using these cut off values an abnormal flash VEP was defined as: P2 latency >
276 ms (dim flash) or > 301 ms (bright flash), total amplitude < 5 µV (both
flashes), an absent VEP response to either flash or an immature VEP response to
the bright flash. Each flash VEP was classified as normal or abnormal using these
categories and these data were used to assess the predictive value of the flash
VEP in the follow up assessments (Chapter 5 Results: Follow up data).
Chapter 4 128
Relative risk of VEP abnormalities
VEP abnormalities in methadone-exposed and non-exposed infants can be
summarised as follows:
Abnormal VEP Normal VEP
Methadone-exposed 56 44
Non-exposed 5 45
Relative risk= 56/(56+44) / 5/(5+45) = 5.6.
Therefore, methadone-exposed infants were over five times more likely to have
an abnormal VEP than non-exposed infants.
The attributable risk percent was also calculated to estimate the proportion of
VEP abnormalities amongst the exposed group which was attributable to
methadone exposure.
% AR = incidence in exposed group-incidence in non exposed group/ incidence in
exposed group x 100 = 82%.
Therefore 82% of the VEP abnormalities demonstrated in the drug-exposed group
were attributable to methadone exposure. A population attributable risk percent
was not calculated as it is unlikely the comparison group recruited for this study
were representative of the general population. In summary, drug-exposed
infants had smaller amplitude VEP responses with fewer P1 components and
abnormal / immature waveform morphology compared to matched comparison
infants. Drug-exposed infants were over five times more likely to have an
abnormal neonatal VEP compared to non-exposed infants.

Chapter 4 129
Figure 4-5 Boxplot of VEP amplitude in drug-exposed and comparison infants The sum VEP amplitudes were significantly smaller in the drug-exposed infants compared to controls. This was statistically significant with both the dim and bright light stimuli.
p<0.001
p<0.001
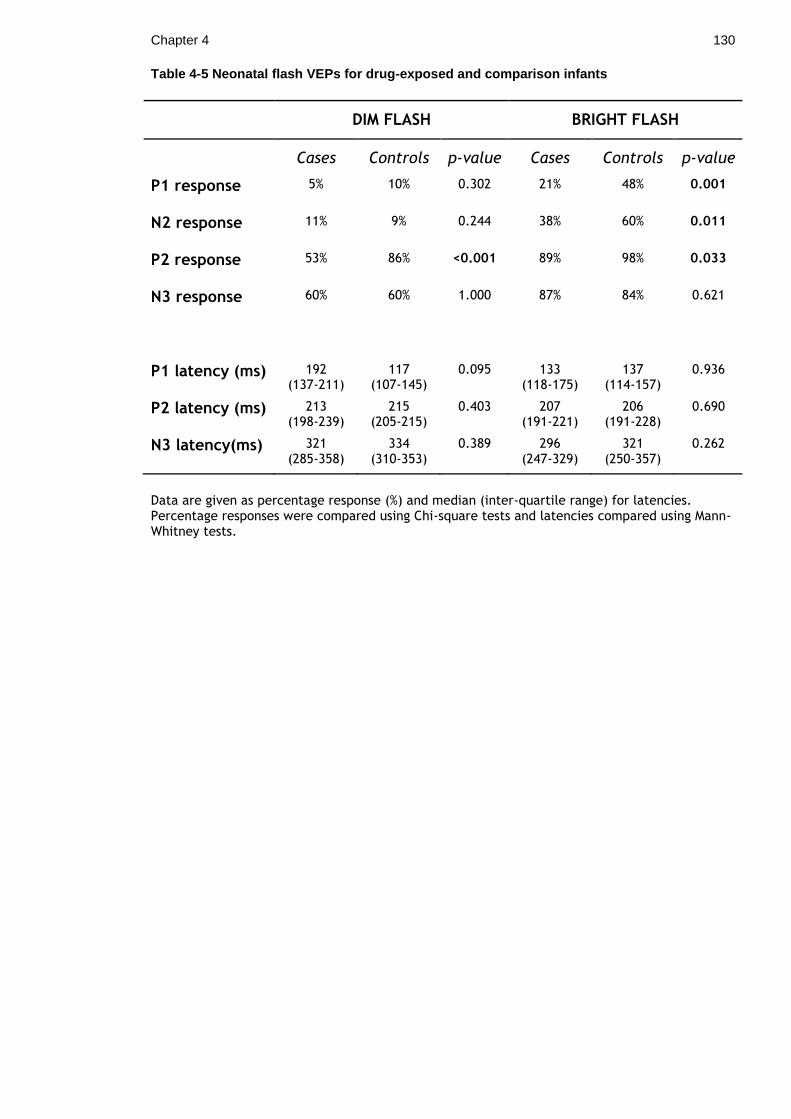
Chapter 4 130
Table 4-5 Neonatal flash VEPs for drug-exposed and comparison infants
DIM FLASH BRIGHT FLASH
Cases Controls p-value Cases Controls p-value
P1 response 5% 10% 0.302 21% 48% 0.001
N2 response 11% 9% 0.244 38% 60% 0.011
P2 response 53% 86% <0.001 89% 98% 0.033
N3 response 60% 60% 1.000 87% 84% 0.621
P1 latency (ms) 192 (137-211)
117 (107-145)
0.095 133 (118-175)
137 (114-157)
0.936
P2 latency (ms) 213 (198-239)
215 (205-215)
0.403 207 (191-221)
206 (191-228)
0.690
N3 latency(ms) 321 (285-358)
334 (310-353)
0.389 296 (247-329)
321 (250-357)
0.262
Data are given as percentage response (%) and median (inter-quartile range) for latencies. Percentage responses were compared using Chi-square tests and latencies compared using Mann-Whitney tests.

Chapter 4 131
Morphology Absent Immature/atypical Typical Mature
Cases (n=100)
27% 32% 36% 5%
Controls (n=50)
6% 16% 68% 10%
0
10
20
30
40
50
60
70
80
Absent Immature Typical Mature
Morphology
% r
es
po
ns
e
Cases
Controls
Figure 4-6 VEP morphology with dim flash stimulus. The cases had more absent and immature responses and fewer typical and mature responses compared to controls: Chi
2=19.1, p<0.001.

Chapter 4 132
Morphology Immature/abnormal Typical Mature
Cases (n=100)
28% 51% 21%
Controls (n=50)
10% 42% 48%
0
10
20
30
40
50
60
Immature Typical Mature
Morphology
% r
esp
on
se
Cases
Controls
Figure 4-7 VEP morphology with bright flash stimulus The cases had more immature/abnormal and fewer mature responses compared to controls: Chi
2 =13.6, p=0.001.

Chapter 4 133
4.3.4 Investigation of potential confounders
Potential confounders were considered as variables which differed between the
drug-exposed and comparison groups and which could have an independent
effect on the newborn flash VEP. From the comparison demographics (Table 4-
1), the infant OFC, maternal smoking status and proportion of mothers on
prescribed antidepressants differed significantly between groups. Associations
were therefore investigated between these variables and both VEP amplitude
and latency.
There did not appear to be any association between VEP amplitude or latency
and the infant OFC (VEP amplitude and OFC: Pearson‟s correlation coefficient=
0.11; p=0.193; VEP P2 latency and OFC: Pearson‟s correlation coefficient=-0.049;
p=0.570). This was further illustrated by a scatter plot and linear regression
analysis of the data (Figure 4-8).
The drug-exposed infants also had a higher proportion of mothers on prescribed
antidepressant and/or antipsychotic medication compared to the control infants.
To investigate any potential confounding effect of these maternal prescribed
drugs on the newborn infant VEP, VEP parameters were compared between
infants whose mothers were on medication and those not. The bright flash
amplitude did not differ significantly between groups: median amplitude 23 µV
antidepressant group vs 27.2 µV; Mann-Whitney test p = 0.345 (95% CI -5.2 to
13.6). There was no difference in bright flash P2 latency between groups:
median P2 latency 205.5 ms antidepressant group vs 207 ms; Mann-Whitney test
p=0.648. VEP morphology also did not differ (Chi 2 =0.56; p=0.761) between
groups.
Mann-Whitney tests were also used to compare the VEP amplitudes and latencies
of infants born to smoking mothers with infants born to non-smoking mothers.
Infants of smoking mothers were found to have significantly smaller amplitude
VEP responses compared to those of infants whose mothers did not smoke
(median amplitude non-smokers 37.2µV vs median amplitude smokers 29.8µV;
p=0.017; 95% CI 2.2 to 19.5) (Figure 4-9). The P2 latency did not significantly
differ between groups (non-smokers 209ms vs smokers 207ms; p=0.363; 95% CI
-7.01 to 20.00).

Chapter 4 134
Figure 4-8 Scatterplot of VEP amplitude and OFC There did not appear to be any significant correlation between VEP amplitude and infant OFC. Linear regression analysis: R
2 = 1.1%, p=0.19.

Chapter 4 135
Figure 4-9 Boxplot of VEP amplitude and smoking status VEP amplitudes were compared between infants born to smoking mothers and those born to non-smoking mothers. Infants born to smoking mothers had significantly smaller amplitude VEPs compared to non-smokers (Mann-Whitney test; p=0.017).

Chapter 4 136
It was therefore necessary to use a linear regression model to assess if maternal
smoking status was a potential confounder in the analysis of VEP amplitude and
drug-exposure status. Both status group (case/control) and smoking status
(smoker/non-smoker) were entered as predictor variables with VEP amplitude as
the response variable as follows:
Linear Regression model: VEP amplitude with status group and smoking group Predictor Coef SE Coef T P Constant 48.519 4.574 10.61 0.000 Status gp -14.714 4.337 -3.39 0.001 Smoking gp -2.111 5.486 -0.38 0.701
Using this model, only status group was independently associated with VEP
bright flash amplitude (p=0.001). Similarly, cases had significantly reduced VEP
amplitude with the dim flash after correcting for maternal smoking (p=0.002).
Previous analysis had also demonstrated that the drug-exposed infants had
significantly fewer P2 responses with the dim flash stimulus and fewer P1 and N2
responses with the bright flash stimulus compared to controls. Logistic
regression analysis was used to correct for the potential confounding effect of
smoking status on these binary outcomes.
Logistic Regression model: Bright P1 response with status group and smoking group Predictor Coef SE Coef Z P Constant -0.024855 0.417291 -0.06 0.953 Status gp -1.21275 0.414955 -2.92 0.003 Smoking gp -0.092042 0.511556 -0.18 0.857
Using a logistic regression model, after correcting for smoking status, the drug-
exposed infants were still significantly less likely to have a P1 response
compared to control infants: p=0.003. Drug-exposed infants were also
significantly less likely to have a bright flash N2 response than controls: p=0.008.

Chapter 4 137
Logistic Regression model: Dim P2 response with status group and smoking group Predictor Coef SE Coef Z P Constant 2.42099 0.661865 3.66 0.000 Status gp -1.44482 0.481440 -3.00 0.003 Smoking gp -0.897456 0.694675 -1.29 0.196
After correcting for smoking status, the drug-exposed infants were significantly
less likely to have a P2 response compared with control infants: p=0.003.

Chapter 4 138
4.3.5 Relationship with NAS
A relationship between the neonatal flash VEP and NAS was investigated in two
ways. Initially drug-exposed infants were classified as having NAS or not based
on a requirement for pharmacological treatment. VEP parameters were then
compared between the two groups. To further investigate possible differences
between infants with varying severity of NAS, NAS was classified into four
severity groups (1-4) as defined in the methods section (Chapter 3.10.3).
Statistical tests were undertaken to compare any differences between these four
groups.
Neonatal flash VEP parameters and their relationships to the presence of NAS are
illustrated in Table 4-6. There was no difference in the presence of VEP
components between infants who developed NAS and those who did not.
Similarly, the latency of the VEP components did not differ between groups and
the amplitude of the VEP responses did not significantly differ between those
infants developing NAS and those not. The VEP morphology also did not differ
between groups (dim flash stimulus: Chi 2 = 1.18, p=0.875; bright flash stimulus:
Chi 2 = 0.44, p=0.804).

Chapter 4 139
Table 4-6 Flash VEPs and NAS
DIM BRIGHT
No NAS NAS p-value No NAS NAS p-value
P1 response 6% 4% 1.000 19% 23% 0.579
P2 response 55% 51% 0.715 89% 89% 0.913
N3 response 58% 62% 0.743 92% 81% 0.083
P1 latency (ms) 198 165 0.773 141 130 0.259
IQR 136-224 - 124-189 102-173
P2 latency (ms) 216 208.5 0.837 208 203 0.122
IQR 198-240 195-242 192-240 190-217
N3 latency (ms) 322 314 0.437 307 293 0.614
IQR 283-345 288-378 246-331 250-324
Amplitude (µV) 10 12.4 0.653 27 28.8 0.771
IQR 0-20.4 0-27.8 17.1-38 17.1-44.5
Data are percentage response (%), medians and inter-quartile ranges (IQR) for latencies and amplitude. Data are compared using Chi
2 tests for percentage responses (Fisher’s exact test for
dim P1 responses due to small numbers) and Mann-Whitney tests for latencies and amplitudes.

Chapter 4 140
Kruskal-Wallis tests were used to investigate associations between the bright
flash VEP parameters and the four NAS severity groups. There was no evidence
of a difference between groups for VEP amplitude, P1 latency or P2 latency
(Table 4-7). In addition the VEP morphology did not differ significantly between
the four NAS groups (Chi 2 = 2.79, p=0.815).
In summary, there did not appear to be any evidence of a relationship between
the neonatal flash VEP and the subsequent development or severity of NAS.
Table 4-7 Flash VEPs and NAS severity
Group Amplitude (µV) P1 latency (ms) P2 latency (ms)
1) no NAS 29.8 (23.3-50.5) 133 (114-140) 206 (185-220)
2) mild NAS 23.2(13.9-35.4) 175 (127-191) 210 (195-254)
3) mod NAS 31.8 (16.1-47.2) 130 (100-173) 199 (190-216)
4) severe NAS 26.0 (18.2-44.5) 122 (107-177) 204 (187-223)
p-value 0.229 0.460 0.168
Data are median values (inter-quartile ranges). Kruskal-Wallis tests were used to compare data between groups.

Chapter 4 141
4.3.6 Relationship with drug and alcohol exposure
A review of the case notes of all mothers and babies and a confidential maternal
interview were undertaken. One hundred and thirty maternal urine samples
were collected during pregnancy from 84 drug misusing women. Seventy infant
urine samples were collected and 110 infant meconium samples (74 samples
from drug exposed infants, 36 samples from controls). The results were collated
as described in the methods section to provide a drug exposure status for each
study infant.
Drug exposure was compared between the different techniques of detection
(maternal history, maternal urine toxicology, infant urine toxicology, infant
meconium toxicology). Data from each of these four techniques were combined
to provide a pattern of overall exposure for each infant and these data were
used for classification into a drug exposure group. Drug exposure status is shown
in Table 4-8. Meconium was more sensitive at detecting in utero drug exposure
than postnatal infant urine for all the drugs of misuse investigated, and was also
more sensitive than maternal history and maternal urine for most drugs.
Most infants were exposed to poly-drug misuse as illustrated in Figure 4-10. Only
nine infants were exposed to methadone alone. A further eight infants were
exposed to other opiates in addition to methadone, giving a subgroup of 17
neonates exposed to opiates alone. The most commonly misused drugs in
addition to methadone were opiates (74%), benzodiazepines (66%) and cannabis
(62%). Twenty six infants were exposed to stimulants (cocaine and/or
amphetamines) in addition to other drugs. For the purpose of statistical analysis
babies were classified into one of five drug exposure groups: group 1 = opiates
alone (n=17), group 2 = opiates + cannabis (n=15), group 3 = opiates +
benzodiazepines (n=14), group 4 = opiates + benzodiazepines + cannabis (n=30)
and group 5 = other drug exposure including stimulants (n=26) (Figure 4-10).
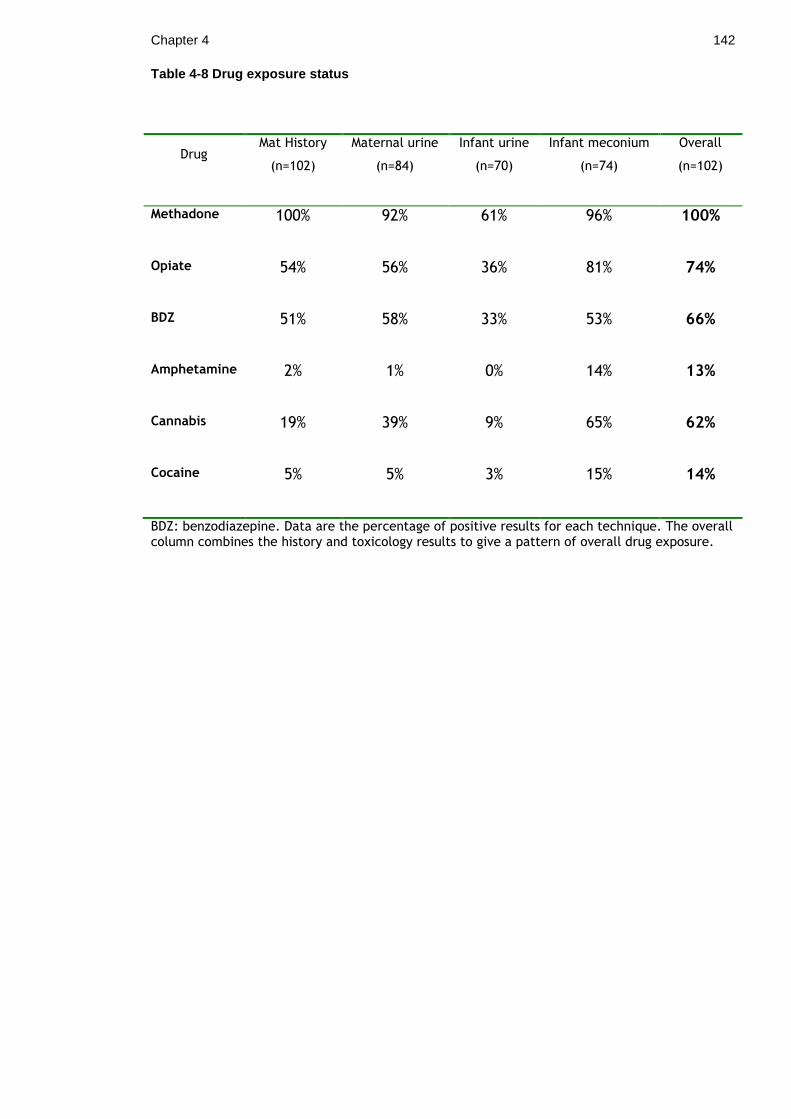
Chapter 4 142
Table 4-8 Drug exposure status
Drug Mat History
(n=102)
Maternal urine
(n=84)
Infant urine
(n=70)
Infant meconium
(n=74)
Overall
(n=102)
Methadone 100% 92% 61% 96% 100%
Opiate 54% 56% 36% 81% 74%
BDZ 51% 58% 33% 53% 66%
Amphetamine 2% 1% 0% 14% 13%
Cannabis 19% 39% 9% 65% 62%
Cocaine 5% 5% 3% 15% 14%
BDZ: benzodiazepine. Data are the percentage of positive results for each technique. The overall column combines the history and toxicology results to give a pattern of overall drug exposure.

Chapter 4 143
Drug exposure group Number of babies
1. Opiates only 17 2. Opiates + Cannabis 15 3. Opiates + Benzodiazepines 14 4. Opiates + Benzodiazepines + Cannabis 30 5. Other (stimulants) 26
Figure 4-10 Pattern of drug exposure in cases

Chapter 4 144
Infants who had been exposed to stimulants in utero had significantly lower birth
weights than those infants not exposed to stimulants: mean 2742 gm (SD 564) vs
mean 2971 gm (SD 449), 2 sample t-test p=0.039. They also had smaller head
circumferences but this was not statistically significant: mean 33.04 cm (SD
1.67) vs 33.67 cm (SD 1.47), 2 sample t-test p=0.072.
There was a positive correlation between NAS group and drug exposure group,
suggesting that increased in utero drug exposure was associated with increased
NAS severity (Pearson‟s correlation=0.243, p=0.014).
VEP amplitudes and latencies were compared between the five different drug
exposure groups using Kruskal-Wallis tests as the amplitude and latency data
were of skewed distribution. There were no significant differences in the VEP
parameters between groups (Table 4-9, Figure 4-11). VEP morphology was also
compared between groups using Chi-squared tests. For the purpose of statistical
analysis, the typical and mature responses were classified together as normal
responses and the absent, immature and atypical responses were classified
together as abnormal responses. There were no differences in morphology
between the five drug exposure groups (dim flash: Chi 2= 1.019, p= 0.907; bright
flash: Chi 2= 4.150, p=0.386).
VEP parameters were also compared between the nine infants who had been
exposed to methadone alone and the rest of the drug exposed cohort (n=91).
VEP amplitude did not differ between groups: dim flash 12.6 µV vs 10.6 µV,
Mann-Whitney test p=0.715; bright flash 23.7 µV vs 29.0 µV, Mann-Whitney test
p=0.142. Neither did the proportion of P1 and P2 responses (Fisher‟s exact tests
p=0.198 and p=0.167 respectively) and VEP morphology (Fisher‟s exact test
p=0.707) differ between groups.
To further investigate the effects of different drugs of misuse on the neonatal
VEP, regression analysis was undertaken. Drug exposure status for each of the
drugs of misuse was entered as a predictor variable and VEP parameters entered
as response variables (VEP amplitude in a linear regression model and P1 and P2
responses in binary logistic regression models). This allowed assessment of
methadone exposure alone on VEP parameters after correcting for additional
illicit drug use. Methadone exposed infants had significantly reduced amplitude
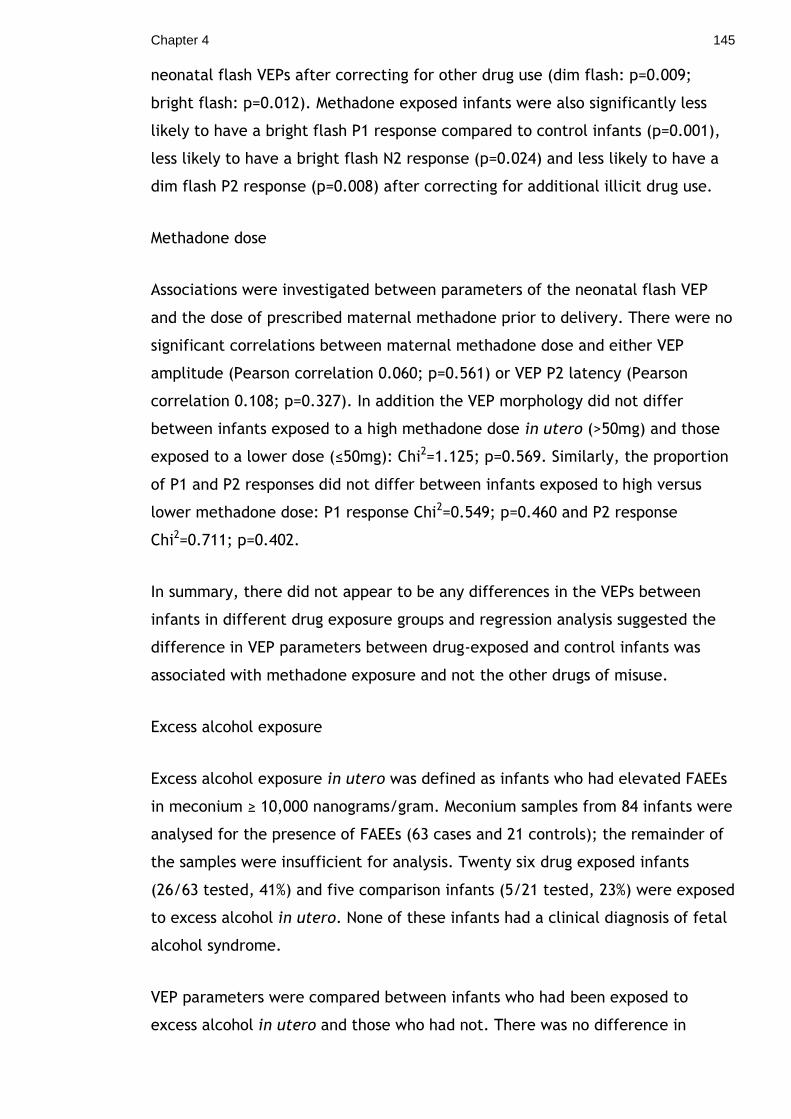
Chapter 4 145
neonatal flash VEPs after correcting for other drug use (dim flash: p=0.009;
bright flash: p=0.012). Methadone exposed infants were also significantly less
likely to have a bright flash P1 response compared to control infants (p=0.001),
less likely to have a bright flash N2 response (p=0.024) and less likely to have a
dim flash P2 response (p=0.008) after correcting for additional illicit drug use.
Methadone dose
Associations were investigated between parameters of the neonatal flash VEP
and the dose of prescribed maternal methadone prior to delivery. There were no
significant correlations between maternal methadone dose and either VEP
amplitude (Pearson correlation 0.060; p=0.561) or VEP P2 latency (Pearson
correlation 0.108; p=0.327). In addition the VEP morphology did not differ
between infants exposed to a high methadone dose in utero (>50mg) and those
exposed to a lower dose (≤50mg): Chi2=1.125; p=0.569. Similarly, the proportion
of P1 and P2 responses did not differ between infants exposed to high versus
lower methadone dose: P1 response Chi2=0.549; p=0.460 and P2 response
Chi2=0.711; p=0.402.
In summary, there did not appear to be any differences in the VEPs between
infants in different drug exposure groups and regression analysis suggested the
difference in VEP parameters between drug-exposed and control infants was
associated with methadone exposure and not the other drugs of misuse.
Excess alcohol exposure
Excess alcohol exposure in utero was defined as infants who had elevated FAEEs
in meconium ≥ 10,000 nanograms/gram. Meconium samples from 84 infants were
analysed for the presence of FAEEs (63 cases and 21 controls); the remainder of
the samples were insufficient for analysis. Twenty six drug exposed infants
(26/63 tested, 41%) and five comparison infants (5/21 tested, 23%) were exposed
to excess alcohol in utero. None of these infants had a clinical diagnosis of fetal
alcohol syndrome.
VEP parameters were compared between infants who had been exposed to
excess alcohol in utero and those who had not. There was no difference in

Chapter 4 146
median VEP amplitude (excess alcohol group = 30.6 µV vs no excess alcohol
group = 31.7 µV, Mann-Whitney test p = 0.827) or VEP morphology (Chi 2 = 0.195,
p = 0.907) between groups. The proportion of P1 and P2 components also did not
differ between groups (Chi 2 = 0.094, p = 0.759 and Chi 2 = 0.124, p = 0.725
respectively).
Regression models were used to correct for the effect of excess alcohol exposure
in utero on the neonatal flash VEP. Excess alcohol exposure was entered as a
predictor variable along with drug exposure status (case/control) in a linear
regression model for VEP amplitude and binary logistic regression models for P1
and P2 responses. Drug-exposed infants had smaller amplitude VEPs after
correcting for alcohol excess (bright flash amplitude p<0.001, dim flash
amplitude p<0.001): excess alcohol exposure had no independent effect on the
neonatal flash VEP amplitude (p=0.664). Drug-exposed infants were also less
likely to have a bright flash P1 response (p=0.001) and less likely to have a dim
flash P2 response (p<0.001) after correcting for excess alcohol exposure.
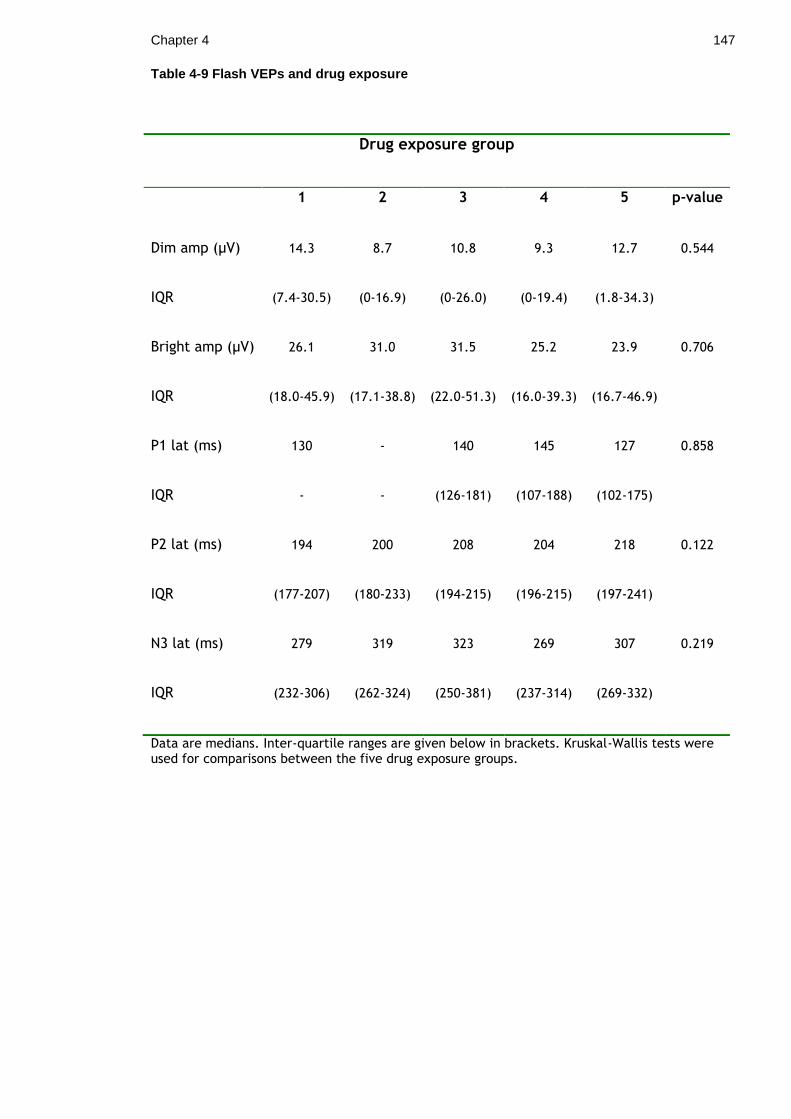
Chapter 4 147
Table 4-9 Flash VEPs and drug exposure
Drug exposure group
1 2 3 4 5 p-value
Dim amp (µV) 14.3 8.7 10.8 9.3 12.7 0.544
IQR (7.4-30.5) (0-16.9) (0-26.0) (0-19.4) (1.8-34.3)
Bright amp (µV) 26.1 31.0 31.5 25.2 23.9 0.706
IQR (18.0-45.9) (17.1-38.8) (22.0-51.3) (16.0-39.3) (16.7-46.9)
P1 lat (ms) 130 - 140 145 127 0.858
IQR - - (126-181) (107-188) (102-175)
P2 lat (ms) 194 200 208 204 218 0.122
IQR (177-207) (180-233) (194-215) (196-215) (197-241)
N3 lat (ms) 279 319 323 269 307 0.219
IQR (232-306) (262-324) (250-381) (237-314) (269-332)
Data are medians. Inter-quartile ranges are given below in brackets. Kruskal-Wallis tests were used for comparisons between the five drug exposure groups.

Chapter 4 148
Figure 4-11 Boxplot of VEP amplitudes and drug exposure Group 1: opiates alone, group 2: opiates + cannabis, group 3: opiates + benzodiazepines, group 4: opiates + benzodiazepines + cannabis, group 5: other drug exposure including stimulants. There were no differences in VEP amplitude between groups: Kruskal-Wallis test, p= 0.706.

Chapter 4 149
4.4 Neonatal flicker VEPs
Six sets of flicker data were lost due to a computer system failure and therefore
144 sets of flicker VEPs were available for analysis (99 drug-exposed infants and
45 comparison infants).
4.4.1 Flicker responses
Responses were defined as a signal to noise ratio (SNR) > 2.8 at the stimulus
frequency and were investigated at F1, F2 and F3 (fundamental response and
harmonic responses). Similar to the pilot work, the largest proportion of
responses at F1 was obtained with the 4.64 Hz stimulus for both drug-exposed
and comparison infants (Table 4-10). The proportion of responses present
reduced with increasing frequency of the stimulus.
The proportion of F1 responses at each frequency was compared between drug-
exposed infants and comparison infants for both the pulse wave and sine wave
stimuli. There was little difference between the groups although with the 5.86
Hz sine wave stimulus more drug-exposed infants had a response than
comparisons (62.6% cases vs 42.2% controls, p=0.021; 95% CI for difference 0.03,
0.38) (Table 4-10). Using a Bonferroni correction to account for the number of
statistical tests performed however, a p-value of < 0.005 would be considered
significant. A multivariate, repeated measures logistic regression model was
performed to test the overall difference between groups after correcting for
wave type and frequency. Using this model a p-value of 0.345 was obtained
suggesting there was no overall difference in the proportion of F1 responses
between drug-exposed infants and comparisons.
There was no difference in the proportion of F2 responses between groups at any
of the stimulus frequencies using either sine or pulse wave (Table 4-11). A
multivariate, repeated measures logistic regression model was used to compare
overall F2 responses between cases and controls and produced a p-value of
0.653.
As it is possible to have a harmonic response in the absence of a detectable
fundamental response, the response status was further classified as a positive

Chapter 4 150
response at any of F1, F2 or F3. Using this definition, the proportion of responses
increased with over 90% of comparison infants having a detectable response with
the 4.64 Hz sine wave stimulus (Table 4-12). Using this classification, there were
still few differences between groups with respect to response rate. The cases
had a higher proportion of responses with the 7.32 Hz sine stimulus compared to
controls (66.7% vs 48.9%, p=0.044) (Table 4-12). However, a multivariate
repeated measures, logistic regression model applied to investigate the overall
difference between groups found no statistically significant difference between
cases and controls (p=0.572).
In summary, there were no significant differences in the proportion of flicker
VEP responses between drug-exposed and comparison infants.

Chapter 4 151
Table 4-10 Proportion of F1 responses
PULSE SINE
Freq (Hz) Case Control p-value Case Control p-value
4.64 51/99 24/45 0.859 70/99 31/45 0.846
(51.5%) (53.3%) (-0.19, 0.16) (70.7%) (68.9%) (-0.14, 0.18)
5.86 37/99 15/45 0.636 62/99 19/45 0.021
(37.4%) (33.3%) (-0.13, 0.21) (62.6%) (42.2%) (0.03, 0.38)
7.32 37/99 13/45 0.308 53/99 20/45 0.309
(37.4%) (28.9%) (-0.08, 0.25) (53.5%) (44.4%) (-0.08, 0.27)
12.7 14/99 11/45 0.158 15/99 7/45 0.950
(14.1%) (24.4%) (-0.25, 0.04) (15.2%) (15.6%) (-0.13, 0.12)
18.55 14/99 10/45 0.256 17/99 5/45 0.315
(14.1%) (22.2%) (-0.22, 0.06) (17.2%) (11.1%) (-0.06, 0.18)
Data are the number of significant F1 responses as defined by SNR > 2.8. The percentage response is given in brackets below. Statistical analysis was done using Z tests for 2-proportions. The 95% confidence interval for the difference is given in brackets below the p-value. A multivariate, repeated measures, logistic regression model was applied to test the overall difference between cases and controls and found no significant difference between groups (p=0.345).

Chapter 4 152
Table 4-11 Proportion of F2 responses
PULSE SINE
Freq (Hz) Cases Controls p-value Cases Controls p-value
4.64 34/99 16/45 0.888 61/99 31/45 0.390
(34.3%) (35.6%) (-0.18, 0.16) (61.6%) (68.9%) (-0.24, 0.09)
5.86 24/99 6/45 0.101 43/99 18/45 0.698
(24.2%) (13.3%) (-0.02, 0.24) (43.4%) (40.0%) (-0.14, 0.21)
7.32 15/99 8/45 0.697 18/99 6/45 0.447
(15.2%) (17.8%) (-0.16, 0.11) (18.2%) (13.3%) (-0.08, 0.17)
12.7 12/99 4/45 0.547 7/99 3/45 0.929
(12.1%) (8.9%) (-0.07, 0.14) (7.1%) (6.7%) (-0.08, 0.09)
18.55 15/99 5/45 0.494 7/99 5/45 0.450
(15.2%) (11.1%) (-0.08, 0.16) (7.1%) (11.1%) (-0.15, 0.06)
Data are the number of significant F2 responses as defined by SNR > 2.8. The percentage response is given in brackets below. Statistical analysis was done using Z tests for 2-proportions. The 95% confidence interval for the difference is given in brackets below the p-value. A multivariate, repeated measures, logistic regression model was applied to test the overall difference between cases and controls and found no significant difference between groups (p=0.653).

Chapter 4 153
Table 4-12 Proportion of F1, F2 or F3 responses
PULSE SINE
Freq (Hz) Cases Controls p-value Cases Controls p-value
4.64 73/99 36/45 0.399 86/99 42/45 0.199
(73.7%) (80%) (-0.21, 0.08) (86.9%) (93.3%) (-0.16, 0.03)
5.86 62/99 24/46 0.296 81/99 32/45 0.169
(62.6%) (53.3%) (-0.08, 0.27) (81.8%) (71.1%) (-0.05, 0.26)
7.32 55/99 22/45 0.457 66/99 22/45 0.044
(55.6%) (48.9%) (-0.11, 0.24) (66.7%) (48.9%) (0.005, 0.35)
12.7 34/99 17/45 0.692 28/99 12/45 0.840
(34.3%) (37.8%) (-0.20, 0.14) (28.3%) (26.7%) (-0.14, 0.17)
18.55 31/99 18/45 0.316 28/99 14/45 0.732
(31.3%) (40.0%) (-0.26, 0.08) (28.3%) (31.1%) (-0.19, 0.13)
Data are the number of significant responses at F1, F2 or F3 (as defined by SNR > 2.8). The percentage response is given in brackets below. Statistical analysis was done using Z tests for 2-proportions. The 95% confidence interval for the difference is given in brackets below the p-value. A multivariate, repeated measures, logistic regression model was applied to test the overall difference between cases and controls and found no significant difference between groups (p=0.572).

Chapter 4 154
4.4.2 Flicker amplitudes
Flicker VEP F1 amplitudes were investigated between drug-exposed and
comparison infants. An Anderson-Darling test for normality demonstrated that
flicker VEP amplitude data were not normally distributed and data were
therefore described as medians and inter-quartile ranges.
Table 4-13 shows the median flicker VEP amplitudes for all infants. The drug-
exposed infants had larger median amplitude responses at all frequencies
tested, which was statistically significant at 4.64 Hz sine, 5.86 Hz sine, 7.32 Hz
sine, 12.7 Hz pulse and 18.55 Hz sine. The maximum amplitude difference
between groups was 0.7 µV. The optimal stimulus frequency was 4.64 Hz for
both cases and controls. A multivariate, repeated measures analysis of variance
model was performed to test the overall difference between groups after
correcting for the stimulus frequency and wave form. Due to the skewed
distribution of the flicker amplitude data, the data was logarithm transformed
for this statistical model. This produced a p-value of <0.001 suggesting that the
cases had overall significantly larger amplitude flicker responses compared to
controls.
Flicker F2 amplitudes were also compared between groups (Table 4-14). Again
there was a trend for the drug-exposed infants to have larger amplitude flicker
responses but using a multivariate, repeated measures analysis of variance
model, there was no statistically significant overall difference between groups
(p=0.090).
In summary, the proportion of flicker responses did not differ between drug-
exposed infants and comparison infants, and the optimum stimulus frequency
was identical for both groups (4.64 Hz). The drug-exposed infants had increased
amplitude F1 responses at all frequencies which reached statistical significance.

Chapter 4 155
Table 4-13 F1 amplitude
PULSE SINE
Freq (Hz) Cases Controls p-value Cases Controls p-value
4.64 2.46 2.16 0.313 3.28 2.5 0.049
(1.56-3.26) (1.39-3.08) (-0.21, 0.68) (2.23-5.06) (1.71-4.01) (0.001,1.21)
5.86 1.45 1.26 0.111 2.09 1.57 0.005
(1.15-1.89) (0.62-2.20) (-0.06,0.54) (1.42-2.99) (1.18-2.14) (0.17, 0,87)
7.32 1.54 1.20 0.176 1.84 1.43 0.016
(0.89-2.14) (0.81-1.87) (-0.09,0.46) (1.27-2.41) (0.94-2.01) (0.06,0.62)
12.7 0.86 0.71 0.028 0.74 0.72 0.734
(0.62-1.18) (0.45-0.97) (0.02,0.32) (0.54-1.02) (0.53-1.09) (-0.10,0.15)
18.55 0.61 0.54 0.526 0.59 0.47 0.029
(0.39-0.84) (0.41-0.79) (-0.07,0.15) (0.42-0.90) (0.35-0.73) (0.01,0.22)
Data are medians with inter-quartile ranges given below in brackets. Mann-Whitney tests were used for statistical analysis. The 95% confidence interval for difference is given below the p-value in brackets. A multivariate, repeated measures analysis of variance model was applied to test the overall difference between cases and controls and found the cases to have significantly larger amplitude F1 flicker amplitudes (p<0.001).

Chapter 4 156
Table 4-14 F2 amplitude
PULSE SINE
Freq (Hz) Cases Controls p-value Cases Controls p-value
4.64 0.72 0.69 0.990 1.32 1.19 0.786
(0.39-1.06) (0.38-1.15) (-0.16,0.17) (0.82-1.95) (0.84-1.97) (-0.25,0.31)
5.86 0.57 0.49 0.022 0.80 0.65 0.098
(0.37-0.86) (0.27-0.49) (0.02,0.25) (0.49-1.13) (0.42-1.00) (-0.23,0.27)
7.32 0.36 0.39 0.983 0.46 0.43 0.904
(0.27-0.57) (0.20-0.61) (-0.09,0.08) (0.24-0.66) (0.23-0.69) (-0.08,0.09)
12.7 0.24 0.23 0.786 0.22 0.20 0.359
(0.15-0.33) (0.15-0.36) (-0.06,0.04) (0.13-0.38) (0.13-0.34) (-0.03,0.07)
18.55 0.19 0.14 0.084 0.18 0.15 0.313
(0.11-0.26) (0.10-0.24) (-0.006,0.07) (0.11-0.26) (0.10-0.24) (-0.02,0.06)
Data are medians with inter-quartile ranges given below in brackets. Mann-Whitney tests were used for statistical analysis. The 95% confidence interval for difference is given below the p-value in brackets. A multivariate, repeated measures analysis of variance model was applied to test the overall difference between cases and controls and found no significant difference between groups (p=0.090).

Chapter 4 157
4.4.3 Neonatal flicker VEPs and NAS
The flicker F1 amplitude was compared between infants who developed NAS
(defined as requiring pharmacological treatment) and infants who did not
develop NAS.
There was little difference in the flicker F1 amplitude between groups (Table 4-
15). As there were few other differences in the flicker VEP between cases and
controls, further investigative statistics relating to the development of NAS were
not undertaken.

Chapter 4 158
Table 4-15 Flicker amplitudes and NAS
PULSE SINE
Freq (Hz) No NAS NAS p-value No NAS NAS p-value
4.64 2.41 2.45 0.369 3.36 3.13 0.761
(1.75-3.3) (1.47-3.1) (-0.31,0.77) (1.98-4.67) (2.23-5.15) (-0.91,0.69)
5.86 1.59 1.36 0.049 2.25 1.99 0.214
(1.23-2.16) (1.13-1.65) (0.007,0.48) (1.58-3.03) (1.39-2.99) (-0.17,0.75)
7.32 1.56 1.57 0.621 1.72 1.76 0.401
(0.82-2.16) (0.97-2.01) (-0.41,0.29) (1.28-2.23) (1.21-2.66) (-0.49,0.20)
12.7 0.83 0.94 0.117 0.73 0.75 0.722
(0.49-1.17) (0.71-1.22) (-0.32,0.04) (0.53-1.01) (0.54-1.03) (-0.17,0.12)
18.55 0.52 0.67 0.270 0.55 0.62 0.148
(0.37-0.83) (0.40-0.85) (-0.23,0.07) (0.37-0.77) (0.48-0.91) (-0.20,0.04)
Data are medians with inter-quartile ranges given below in brackets. Mann-Whitney tests were used for statistical analysis. The 95% confidence interval for difference is given below the p-value in brackets

159
5 Chapter 5 Results: Follow up data
One hundred and seven infants were reviewed at six months: 81 of 102 (79%)
drug-exposed infants and 26 of 50 (52%) comparison infants recruited. Overall
study retention was 70%. Reasons for non attendance (45 infants) included:
parent/carer uncontactable (25 infants: 56%), did not attend a pre-arranged
appointment on two or more occasions (11 infants: 24%), geographically unable
to attend (three infants: 7%) and declined follow up participation (six infants:
13%). All infants attending for follow up completed both clinical visual and
developmental assessment.
5.1 Growth parameters and general health
Median age at six month assessment was 27 weeks (IQR 26-28) for both groups
(no significant difference; Mann-Whitney test p=0.231). There were no
significant differences between groups in terms of weight or OFC at six month
follow up: mean weight cases 7.52 kg (SD 1.05) vs mean weight controls 7.94 kg
(SD 1.09) , 2-sample t test p=0.110; mean OFC cases 43.26 cm (SD 1.54) vs mean
OFC controls 43.83 cm (SD 1.88), 2-sample t test p=0.146.
In addition, in view of the relatively high drop-out rate of comparison infants,
the demographic characteristics of comparison infants who were followed up
were compared to those of comparison infants who were not followed up. There
were no significant differences in birth weight (2 sample t-test p=0.445), OFC (2
sample t-test p=0.712, gestation (Mann-Whitney test p=0.984), 5-minute Apgar
score (Mann-Whitney test p=0.263) or DEPCAT score (Mann-Whitney test
p=0.258) between groups.
Fourteen of the drug-exposed cohort had been admitted to hospital following
discharge (17%). Reasons for admission were: bronchiolitis (five infants), gastro-
oesophageal reflux disease (two infants), non-specific viral illness (two infants),
hernia repair (three infants), urinary tract infection (one infant) and pyloric
stenosis (one infant). Three of the comparison infants (12%) had been admitted

Chapter 5 160
to hospital: two with a non-specific viral illness and one with viral meningitis. All
infants had been commenced on a weaning diet when seen for follow up and no
infants were breast fed at six months of age. All infants were on term
commercial formula milk.
All comparison infants were in the care of their parents. Sixty-one drug exposed
infants were in the care of their parents, 14 infants were in foster care (17%)
and six infants were accommodated with a family member (7%). Overall 24% of
the drug exposed cohort was accommodated at six months of age.
5.2 Infant Pattern VEPs
Pattern onset VEPs were recorded in 105/107 infants at the six month
assessment (79 cases, 26 controls). One infant did not undergo testing due to a
computer system failure and one infant was too unsettled for recording.
Ninety two infants underwent 120 minute check size VEP recording (67 cases, 25
controls), 103 infants underwent 60 minute check size recording (77 cases, 26
controls) and 94 infants underwent 15 minute check size recording (70 cases, 24
controls). 40 infants underwent 60 minute pattern reversal VEP recording (26
cases, 14 controls).
5.2.1 Pattern VEP responses
Comparison infants
All comparison infants tested had reproducible VEP responses at all three check
sizes: 25/25 responses at 120 minute check size, 26/26 responses at 60 minute
check size, 24/24 responses at 15 minute check size.
Drug- exposed infants
All cases tested (67/67) had responses present at the large (120 minute) check
size. Three drug-exposed infants had an absent VEP response at the medium (60
minute) check size and only 51/70 drug-exposed infants had a response at the
small (15 minute) check size. Compared to controls, drug-exposed infants were

Chapter 5 161
significantly less likely to have a pattern VEP response present at the small
check size; Fisher‟s exact test p=0.003.
5.2.2 Pattern VEP latencies
VEP latency data were of a skewed distribution and were therefore described as
medians and inter-quartile ranges. Statistical tests were done using Mann-
Whitney tests.
Amplitudes and latencies were compared between drug-exposed infants and
comparisons for the C2 peak response (C2a) at each check size. The cases had
significantly delayed latencies at the 120 minute and 15 minute check sizes
(Table 5-1, Figure 5-1). At the 60 minute check size the cases had delayed
latency C2 responses but this did not quite reach statistical significance using a
non-parametric test (p=0.063 with Mann-Whitney test). When 60 minute C2
latency data were logarithm transformed to a normal distribution and tested
with a 2-sample t test, the p-value was 0.050. C1 latency data did not differ
significantly between groups although the numbers of C1 responses were low.

Chapter 5 162
Table 5-1 Pattern VEP latencies
Check size C2 latency (ms) p-value
Cases Controls
120 minute 115.0 99.0 0.019
(94-136) (93-142)
60 minute 110.0 106.0
0.063 (0.050*)
(96-126) (94-112)
15 minute 122.0 108.0 0.028
(109-130) (92-125)
Data are medians with inter-quartile ranges given in brackets below. Statistical tests were done using Mann-Whitney tests and (*) 2-sample t test for logarithm transformed 60 minute data.

Chapter 5 163
Figure 5-1 Boxplot of pattern VEP latency The drug exposed infants had delayed latency C2 peak responses at the large (120 minute) check size: median latency 115 ms cases vs 99 ms controls; Mann-Whitney test p=0.019.
Chapter 5 164
5.2.3 Pattern VEP amplitudes
Pattern VEP amplitude data were of a skewed distribution and were therefore
described as medians and inter-quartile ranges. The drug-exposed infants had
significantly reduced amplitude responses at the 60 minute check size and a
trend to reduced amplitude responses at the other check sizes (Table 5-2, Figure
5-2).
Table 5-2 Pattern VEP amplitudes
Check size C2 amplitude (μV) p-value
Cases Controls
120 minute 24.0 26.0 0.091
(15-33) (17-43)
60 minute 25.0 34.0 0.005
(19-34) (28-39)
15 minute 13.0 17.0 0.191
(10-20) (10-25)
Data are medians with inter-quartile ranges given in brackets below. Statistical tests were done with Mann-Whitney tests.

Chapter 5 165
Figure 5-2 Boxplot of pattern VEP amplitude The drug exposed infants had smaller amplitude responses at the medium (60 minute) check size; median amplitude 25 µV cases vs 34 µV controls; Mann-Whitney test p=0.005.

Chapter 5 166
The comparison infant pattern VEPs were used to define limits of normality to
enable drug-exposed infant pattern VEPs to be classified as normal or abnormal.
An absent VEP response at any check size was classified as abnormal. The upper
limit values for VEP latency and lower limit values for VEP amplitude were used
as cut off values for normality and are demonstrated below:
Check size Latency upper limit (ms)
Amplitude lower limit (μV)
120 minute
142 8
60 minute
127 12
15minute
157 2
Using these definitions 34/79 (43%) drug-exposed infants had an abnormal
pattern VEP: cases 34/79 abnormal pattern VEPs vs controls 0/26 abnormal
pattern VEPs; Fisher‟s exact test p<0.001.

Chapter 5 167
5.2.4 Pattern VEPs and NAS
C2 amplitudes and latencies were compared between drug exposed infants who
developed NAS (defined as requiring pharmacological treatment) and those who
did not. There were no significant differences or trends in the VEP parameters
between groups, suggesting that NAS and/or its pharmacological treatment does
not account for the changes demonstrated in visual electrophysiology (Table 5-
3).
Table 5-3 Pattern VEP parameters and NAS
NAS No NAS p-value
120 minute
C2 latency (ms) 105.0 126.0 0.525
(92.0-139.0) (100.3-135.7)
C2 amplitude (μV) 20.0 25.0 0.095
(14.0-28.0) (18.5-35.5)
60 minute
C2 latency (ms) 106.0 118.0 0.410
(95.0-125.0) (98.0-127.0)
C2 amplitude (μV) 26.0 23.0 0.392
(20.0-37.0) (17.0-31.0)
15 minute
C2 latency (ms) 122.5 118.0 0.412
(116.0-130.5) (98.5-130.5)
C2 amplitude (μV) 13.5 13.0 0.199
(10.0-23.3) (8.0-17.5)
Data are medians with inter-quartile ranges given below in brackets. Statistical tests were done using Mann-Whitney tests.

Chapter 5 168
5.2.5 Pattern VEPs and drug exposure
Pattern VEP parameters were compared between infants in the five different
drug exposure groups. There were no significant differences between groups
suggesting the effect shown was secondary to opiate exposure and not other
substances of misuse (Table 5-4).
Table 5-4 Pattern VEP parameters and drug exposure
VEP parameter
Drug exposure group
1 2 3 4 5 p-value
120 minute
C2 lat (ms) 115.0 132.5 132.0 101.0 113.5 0.356
(97-135) (105-146) (97-142) (91-131) (92-138)
C2 amp (µV) 26.5 18.0 24.0 20.0 22.5 0.330
(24-35) (12-30) (14-32) (14-28) (17-39)
60 minute
C2 lat (ms) 104.5 119.5 98.0 110.5 114.5 0.613
(97-127) (104-134) (94-123) (97-125) (94-130)
C2 amp (µV) 22.0 31.5 25.0 22.0 28.5 0.340
(18-28) (20-37) (19-45) (15-32) (20-35)
15 minute
C2 lat (ms) 123.0 121.0 122.0 118.0 126.0 0.787
(88-132) (103-162) (111-124) (116-131) (115-131)
C2 amp (µV) 15.0 9.5 12.0 13.0 14.5 0.429
(11-20) (8-19) (7-13) (9-19) (10-22)
Data are medians with inter-quartile ranges given in brackets below. Statistics were done using Kruskall-Wallis tests. C2 lat: latency, C2 amp: amplitude.

Chapter 5 169
5.2.6 Pattern reversal VEPs
Forty infants underwent pattern reversal VEP recording (26 cases and 14
controls). All comparison infants had a pattern reversal response present
(14/14). Four drug-exposed infants had an absent response; two of these infants
had nystagmus present. These two infants had recordable 60 min pattern onset
VEPs supporting the evidence that pattern onset VEPs are more reliable in
infants with nystagmus compared to pattern reversal (106).
There was a trend to delayed VEP latencies in the drug-exposed group but this
was not significant: median P100 latency cases (n=22) 113 ms vs median latency
controls (n=14) 107 ms; Mann-Whitney test p = 0.167 and median N75 latency
cases (n=13) 76 ms vs median latency controls (n=7) 73 ms; Mann-Whitney test p
= 0.381.

Chapter 5 170
5.3 Visual outcomes
All infants underwent a clinical visual assessment. A fail was defined as the
presence of strabismus, nystagmus, delayed visual maturation, reduced visual
acuity or a refractive error which was confirmed by ophthalmology on
cycloplegic refraction and required correction with glasses. Visual acuity (VA)
from the comparison group was used to define normal acuity for this age group:
the poorest VA amongst the control infants was 6/48 (one infant), and so this
was defined as the limit of normality. Thus reduced VA was poorer than 6/48. A
borderline assessment was defined as 1) minor visual abnormalities, 2) refractive
error which was not confirmed by ophthalmology due to failure to attend
following referral, or 3) moderate refractive error confirmed by ophthalmology,
but not prescribed glasses and remaining under follow up.
Overall 40% of drug-exposed infants failed the visual test battery (32 infants). A
further nine infants (11%) were described as borderline: these were infants with
possible refractive errors not assessed by ophthalmology (two infants), moderate
refractive errors not prescribed glasses (three infants), exophoria (two infants),
anisocoria (one infant) and absent blink response (one infant). 2/26 (8%) of the
comparison group failed the visual assessment: one infant had an intermittent
strabismus (esotropia) and one had a refractive error (myopia). Significantly
more drug-exposed infants failed the visual test battery than comparison
infants: 32/81 cases failed vs 2/26 controls failed; Fisher‟s exact test p=0.003.
Clinical visual outcomes are summarised as follows:
Abnormal vision Normal vision
Methadone exposed 32 49
Non-exposed 2 24

Chapter 5 171
The relative risk of an abnormal visual assessment was:
RR= 32/(32+49) / 2/(2+24) = 5.1.
Therefore infants exposed to methadone in utero were five times more likely to
have an abnormal visual assessment than matched infants not exposed to
methadone.
The attributable risk percent was also calculated to estimate the proportion of
disease amongst the exposed group which was attributable to methadone
exposure.
% AR = incidence in exposed group-incidence in non exposed group/ incidence in
exposed group x 100 = 80%.
Therefore 80% of the visual abnormalities demonstrated in the drug-exposed
group were attributable to methadone exposure. A population attributable risk
percent was not calculated as it is unlikely the comparison group recruited for
this study were representative of the general population.
Nystagmus was present in nine of the drug-exposed cohort (11%). No control
infant demonstrated nystagmus. The nystagmus was horizontal in all cases and
varied in being manifest (four infants), latent (three infants) and manifest latent
(one infant). Of the nine infants with nystagmus, six had been treated for NAS in
the neonatal period (66%) and eight (89%) were known to have been exposed to
benzodiazepines in addition to opiates in utero. There was no significant
difference in the incidence of NAS between infants with nystagmus and without
nystagmus: 6/9 (66%) infants with nystagmus vs 35/72 (49%) infants without
nystagmus; Fisher‟s exact test p=0.347. There was also no significant difference
in the incidence of benzodiazepine exposure between infants with nystagmus
and without nystagmus: 8/9 (89%) infants with nystagmus vs 49/72 (68%) infants
without nystagmus; Fisher‟s exact test p=0.268.
Strabismus was detected in 20 drug-exposed infants (25%). 12 infants had an
exotropia and eight infants had an esotropia.

Chapter 5 172
Reduced VA (defined as VA poorer than 6/48) was detected in 18 drug-exposed
infants (22%). The reduced acuity was associated with other ophthalmic
abnormalities in 11 of these infants. Delayed visual maturation was diagnosed in
infants who had reduced VA or visual inattentiveness, but who subsequently
showed catch up in visual development: 11 infants (14%) demonstrated DVM.
Forty nine drug exposed infants were seen by ophthalmology in addition to
having a six month study assessment. Age at ophthalmology assessment varied
from eight months to 14 months. Discrepancies between study visual assessment
and ophthalmology assessment were: five infants had a strabismus noted at the
study assessment and no strabismus when seen by ophthalmology; four infants
had strabismus noted by ophthalmology which had not been present when seen
for the study assessment.
Visual outcomes were compared between infants who had NAS in the neonatal
period (defined as requiring pharmacological treatment) and infants who did not
have NAS. There was no significant association between six month visual
outcome and NAS: Chi 2 test; p=0.239.
NAS No NAS
Pass 21 28
Fail 20 12

Chapter 5 173
Visual outcomes were also compared between infants in the five different drug
exposure groups. There was no significant association between six month visual
outcome and drug exposure group: Chi 2 test; p=0.528.
Gp 1 Gp 2 Gp 3 Gp 4 Gp 5
Pass 9 9 6 14 11
Fail 3 3 5 11 10
Binary logistic regression was performed to account for the potential
confounding effect of excess alcohol exposure on six month visual outcome.
Excess alcohol was defined as significantly elevated FAEEs on meconium analysis
as described in the methods section. After correcting for excess alcohol
exposure, drug-exposed infants were significantly less likely to pass the six
month visual assessment (p=0.007). There was also no significant difference in
the proportion of infants failing the six month visual assessment between infants
exposed to excess alcohol in utero and those not exposed: Chi 2 = 0.035;
p=0.852. There was no independent effect of in utero alcohol exposure on visual
outcome (p=0.790).
Visual outcomes were compared between infants exposed to high dose
methadone (>50mg) and those exposed to lower dose methadone (≤50mg) to
assess for a dose-response relationship. Although a greater proportion of infants
exposed to the higher dose failed the visual assessment compared to the lower
dose (65% versus 44%), this did not quite reach statistical significance: Chi-
squared test p=0.055.
In summary, drug-exposed infants were at significantly greater risk of visual
abnormalities at six months of age than non drug-exposed matched infants after
correcting for excess alcohol exposure in utero. There was no significant
association between six month visual outcome and NAS or drug exposure group
suggesting that all drug exposed infants were at risk.

Chapter 5 174
5.4 Developmental outcomes
All infants underwent a full Griffiths developmental assessment. A fail was
defined as a GQ < 85: all of these infants were referred for further assessment to
either hospital or community follow up clinics. All comparison infants passed the
developmental assessment; in contrast eight drug-exposed infants failed (26/26
controls pass vs 73/81 cases pass; Z test for 2-proportions, p=0.003).
The GQ and sub-quotient scores were not normally distributed; data were
therefore described as medians and comparisons done with Mann-Whitney tests.
Developmental outcomes for each sub-quotient and overall GQ scores are shown
in Table 5-5. The drug-exposed infants had significantly reduced development
quotients for all sub scales and reduced GQ scores compared to comparison
infants (Figure 5-3). Two drug exposed infants had abnormalities of tone: one
infant had generalised hypotonia and one had unequal tone of the upper limbs.
Potential confounders for developmental outcome were maternal smoking,
antidepressant use and excess alcohol intake during pregnancy. A linear
regression model was used to assess if these factors confounded the
developmental outcome as follows:
Regression equation GQ = 106 - 8.06 Status no - 2.18 Smoker + 0.05 Antidepressant - 1.17 Alcohol Predictor Coef SE Coef T P Constant 105.873 1.791 59.10 0.000 Status -8.056 2.024 -3.98 0.000 Smoker -2.184 2.283 -0.96 0.341 Antidepressant 0.052 2.600 0.02 0.984 Alcohol -1.165 1.722 -0.68 0.500
Therefore, the drug-exposed infants had significantly poorer developmental GQ
scores after correcting for maternal smoking status, antidepressant use and
excessive alcohol intake during pregnancy. Adjusted p-values after correcting for
maternal smoking status, antidepressant use and excessive alcohol intake in
pregnancy are shown in Table 5-5.

Chapter 5 175
Of the eight drug-exposed infants who failed the developmental assessment, six
infants (75%) had concurrent significant visual problems which included reduced
visual acuity in all cases. Four of the eight infants who failed the developmental
assessment had abnormal pattern VEPs (absent response to 60 minute check size
in three, delayed response to 15 minute check size in one).
Infants who failed the visual assessment performed poorer on their
developmental scales than infants who passed the visual assessment: median GQ
infants who failed = 95 vs median GQ infants who passed = 100; Mann-Whitney
test p <0.001. A linear regression model was used to assess the independent
effect of visual impairment on developmental outcome (outcome variable: GQ
score, predictor variables: group, smoking status, alcohol excess status, visual
impairment). Using this model, visual impairment was found to be independently
associated with lower developmental scores (p<0.001).
Developmental sub-quotients and GQ scores were compared between drug-
exposed infants who received pharmacological treatment for NAS and those who
did not. Infants treated for NAS performed significantly poorer in their
locomotor, personal-social and language subscales, as well as having a
significantly reduced overall GQ score (Table 5-6).
Developmental outcomes were also compared between infants who were
accommodated (n=20) and infants who were in the care of their biological
parents (n=61). Accommodated infants performed poorer on their developmental
scales than infants not accommodated: median GQ accommodated infants = 92
vs median GQ not accommodated = 97; Mann-Whitney test p = 0.003. However,
infants who were accommodated were more likely to have been treated for NAS
in the newborn period (accommodated infants 70% NAS vs non accommodated
43%; Chi 2 test p = 0.039) and were more likely to have been exposed to
benzodiazepines and stimulants in utero (accommodated infants 90% poly-drug
exposure vs non accommodated 63%; Chi 2 test p = 0.015).

Chapter 5 176
Table 5-5 Developmental outcome of cases and controls
Development Cases (n=81)
Controls (n=26)
p-value
Adjusted p-
value
Locomotor 102
(93-107) 111
(101-111) <0.001 0.006
Personal-social 94
(88-96) 99
(94-103) <0.001 0.001
Language-hearing
105 (105-109)
109 (105-109)
<0.001 0.007
Eye-hand 94
(86-99) 104
(99-104) <0.001 0.001
Performance 96
(86-100) 101
(101-111) <0.001 0.002
GQ 97
(93-100) 105
(101-108) <0.001 <0.001
Data are medians (inter-quartile ranges). Statistical analysis was done using Mann-Whitney tests. Adjusted p-values are after correcting for maternal smoking status, antidepressant use and excess alcohol consumption in pregnancy using linear regression models.

Chapter 5 177
Table 5-6 Developmental outcome and NAS
Development NAS (n=40) No NAS (n=41) p-value
Locomotor 98 (87-102) 102 (94-107) 0.012
Personal-social 89 (84-94) 94 (89-99) 0.016
Language-hearing 105 (100-105) 105 (105-109) 0.011
Eye-hand 94 (84-99) 94 (90-99) 0.137
Performance 96 (86-100) 96 (91-101) 0.329
GQ 95 (91-99) 99 (94-102) 0.008
Data are medians (inter-quartile ranges). Statistical analysis was done using Mann-Whitney tests.
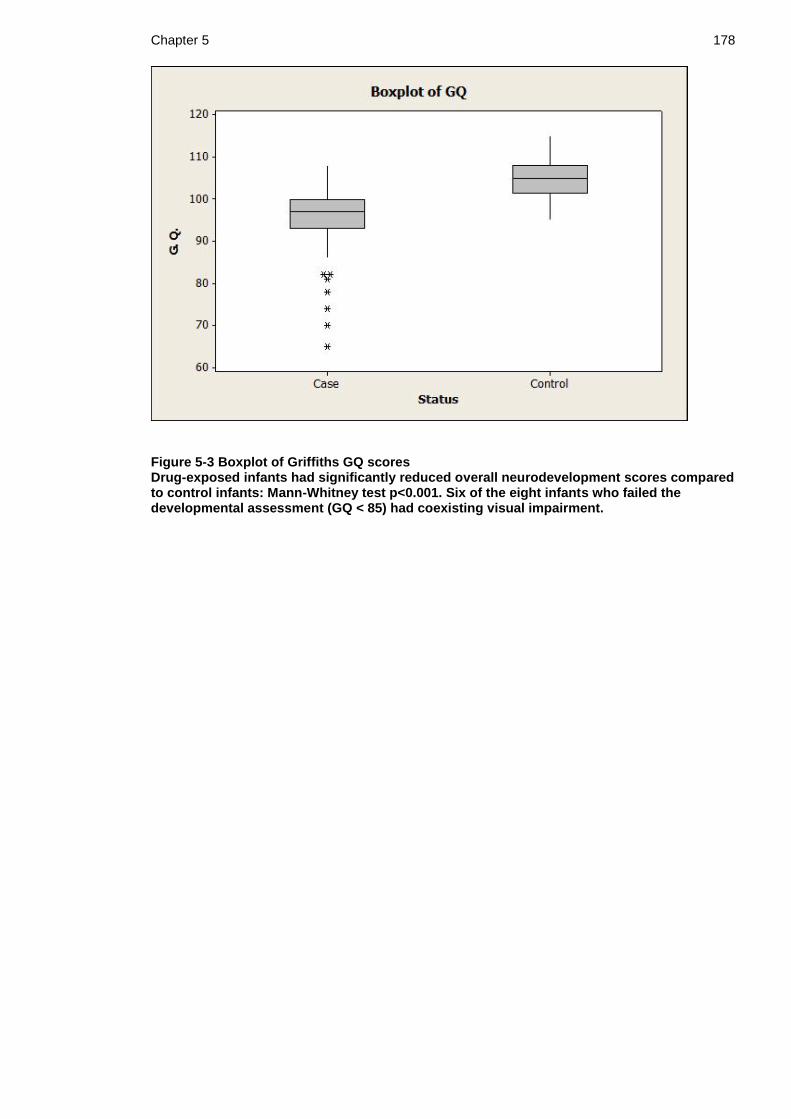
Chapter 5 178
Figure 5-3 Boxplot of Griffiths GQ scores Drug-exposed infants had significantly reduced overall neurodevelopment scores compared to control infants: Mann-Whitney test p<0.001. Six of the eight infants who failed the developmental assessment (GQ < 85) had coexisting visual impairment.

Chapter 5 179
5.4.1 Development and drug exposure group
Developmental quotients were compared between infants in the five different
drug exposure groups. There were significant differences between groups with
infants exposed to increasing in utero poly drug exposure having lower
development quotients (Table 5-7, Figure 5-4).
An association was sought between the dose of prescribed maternal methadone
prior to delivery and six month neurodevelopmental outcomes. The median
methadone dose did not differ between infants who passed and failed the
developmental assessment: median dose of infants who failed = 52.5 vs median
dose of infants who passed = 50.0; Mann-Whitney test p = 0.923. In addition
there was no correlation between prescribed maternal methadone dose and
Griffiths GQ score: Pearson‟s correlation p = 0.175.

Chapter 5 180
Table 5-7 Developmental outcome and drug exposure
Development Drug exposure group
1 2 3 4 5 p-value
Locomotor 104.5 102.0 102.0 98.0 93.0 0.020
(98-118) (95-107) (98-107) (93-102) (84-102)
Personal-social
96.5 94.0 94.0 89.0 89.0 0.062
(94-103) (90-98) (89-94) (84-94) (84-97)
Language 107.0 109.0 105.0 105.0 105.0 0.115
(101-109) (105-109) (105-109) (105-105) (98-105)
Eye-hand 94.0 99.0 94.0 94.0 94.0 0.039
(94-99) (94-104) (89-99) (82-99) (84-97)
Performance 96.0 96.0 96.0 96.0 91.0 0.092
(91-101) (91-101) (91-101) (86-96) (82-96)
GQ 100 99.5 99.0 95.0 93.0 0.002
(97-103) (98-103) (94-100) (93-97) (89-98)
Data are medians with inter-quartile ranges given in brackets below. Statistical tests were done using Kruskal-Wallis tests.
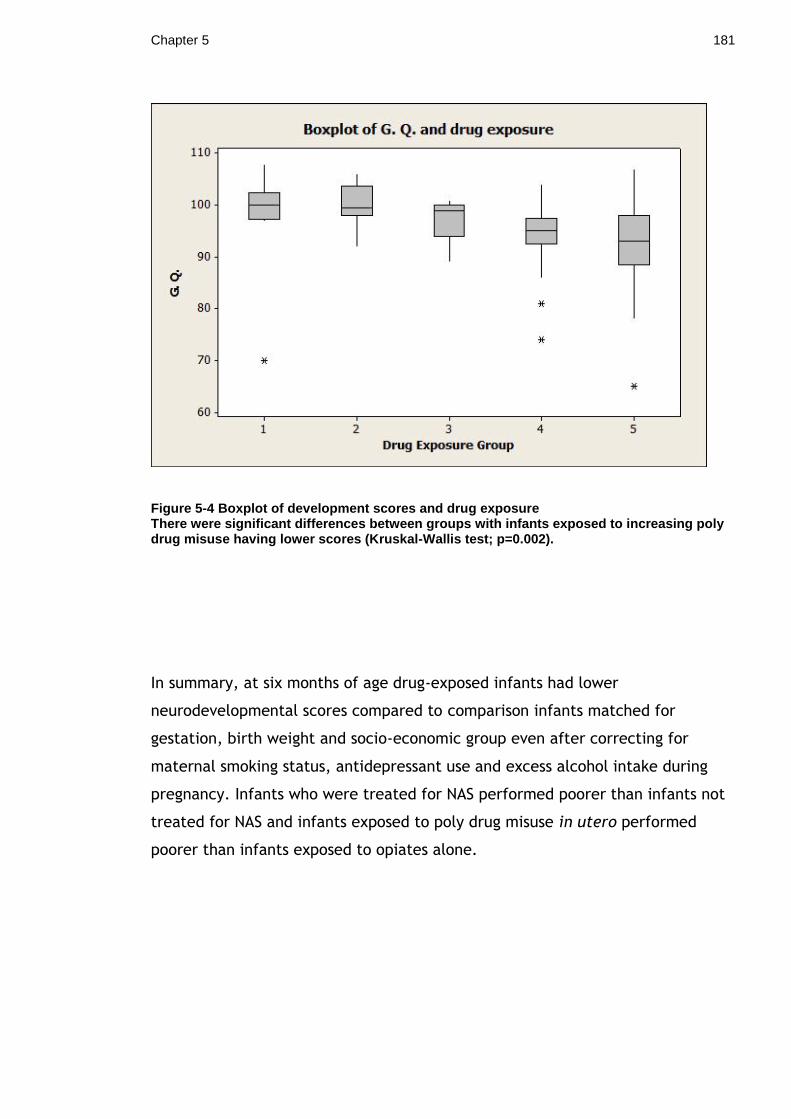
Chapter 5 181
Figure 5-4 Boxplot of development scores and drug exposure There were significant differences between groups with infants exposed to increasing poly drug misuse having lower scores (Kruskal-Wallis test; p=0.002).
In summary, at six months of age drug-exposed infants had lower
neurodevelopmental scores compared to comparison infants matched for
gestation, birth weight and socio-economic group even after correcting for
maternal smoking status, antidepressant use and excess alcohol intake during
pregnancy. Infants who were treated for NAS performed poorer than infants not
treated for NAS and infants exposed to poly drug misuse in utero performed
poorer than infants exposed to opiates alone.

Chapter 5 182
5.5 Neonatal VEPs and outcomes
5.5.1 Neonatal flash VEPs and visual outcome
Seventy nine drug-exposed infants underwent both neonatal flash VEP recording
and six month clinical visual assessment. Neonatal flash VEPs were compared
between infants who passed and failed the clinical visual assessment at six
months of age. For the purpose of analysis infants in the borderline category
were defined as normal. There were no differences in morphology (Chi 2 test;
p=0.329), presence of P1 components (Chi 2 test; p=0.596) or presence of P2
components (Chi 2 test; p=0.466) between groups. Median VEP amplitude did not
differ between groups with either the bright flash (pass 29 µV vs fail 22.4 µV;
Mann-Whitney test p=0.159) or the dim flash (pass 11 µV vs fail 9.6 µv; Mann-
Whitney test p=0.927). Similarly, median P1 and P2 latencies did not differ
between groups: P1 latency pass 130 ms vs fail 149 ms, Mann-Whitney test
p=0.751; P2 latency pass 207 ms vs fail 207 ms, Mann-Whitney test p=0.547.
The association between the neonatal flash VEP and six month clinical visual
outcome is shown in Table 5-8. Neonatal flash VEPs were classified as normal /
abnormal as previously described (Chapter 4.3.3). The sensitivity of an abnormal
neonatal VEP at detecting an abnormal visual outcome was 60% (18/ 18+12).
Specificity was 51% (25/ 24+25). Positive and negative predictive values of the
neonatal flash VEP were 43% and 68% respectively.
Table 5-8 Neonatal flash VEPs and visual outcome
Visual outcome
Abnormal (Fail) Normal (Pass)
Neonatal flash VEP
Abnormal 18 24
Normal 12 25
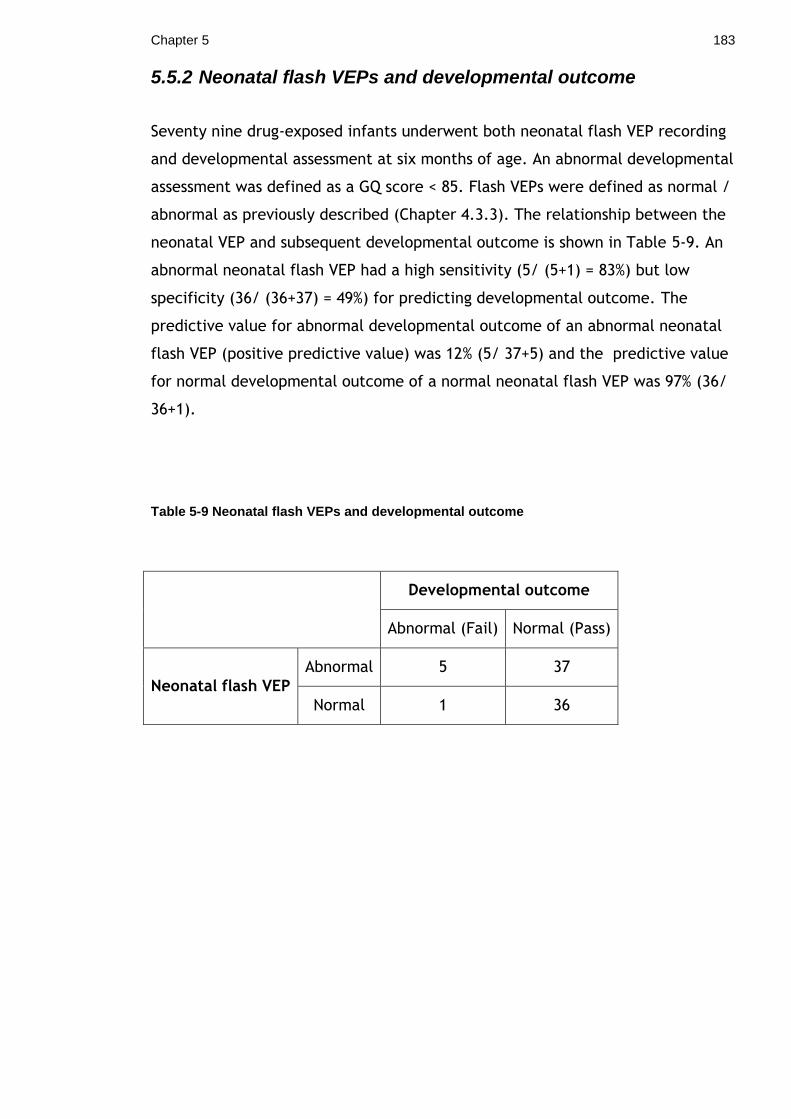
Chapter 5 183
5.5.2 Neonatal flash VEPs and developmental outcome
Seventy nine drug-exposed infants underwent both neonatal flash VEP recording
and developmental assessment at six months of age. An abnormal developmental
assessment was defined as a GQ score < 85. Flash VEPs were defined as normal /
abnormal as previously described (Chapter 4.3.3). The relationship between the
neonatal VEP and subsequent developmental outcome is shown in Table 5-9. An
abnormal neonatal flash VEP had a high sensitivity (5/ (5+1) = 83%) but low
specificity (36/ (36+37) = 49%) for predicting developmental outcome. The
predictive value for abnormal developmental outcome of an abnormal neonatal
flash VEP (positive predictive value) was 12% (5/ 37+5) and the predictive value
for normal developmental outcome of a normal neonatal flash VEP was 97% (36/
36+1).
Table 5-9 Neonatal flash VEPs and developmental outcome
Developmental outcome
Abnormal (Fail) Normal (Pass)
Neonatal flash VEP
Abnormal 5 37
Normal 1 36

Chapter 5 184
5.5.3 Neonatal flash VEPs and six month pattern VEPs
Seventy seven drug-exposed infants underwent both neonatal flash VEP
recording and six month pattern VEP recording. Flash and pattern VEPs were
designated as normal / abnormal as previously described. Table 5-10
demonstrates the association between the newborn flash VEP and six month
pattern follow up VEP. There was little correlation between the newborn flash
VEP and the six month pattern VEP: the sensitivity and specificity of an
abnormal neonatal flash VEP at predicting an abnormal pattern VEP at 6 months
were 39% and 39% respectively (positive predictive value = 33% and negative
predictive value = 46%).
Table 5-10 Neonatal flash VEPs and infant pattern VEPs
Six month pattern VEP
Normal Abnormal
Neonatal flash VEP
Normal 17 20
Abnormal 27 13
Chapter 5 185
5.6 Summary of six month assessment
At six months of age methadone-exposed infants were more likely to have visual
abnormalities than comparison infants, even after correcting for excess in utero
alcohol exposure (40% vs 8%; adjusted p=0.007). The attributable risk was 80%
suggesting that 80% of visual abnormalities seen in the drug-exposed cohort were
attributable to methadone exposure. Abnormalities in the methadone-exposed
cohort included nystagmus (11%), strabismus (25%) and reduced VA (22%).
Electrophysiological abnormalities persisted at six months of age: methadone-
exposed infants had smaller amplitude pattern VEPs (25 μV vs 34 μV; p=0.005)
with delayed peak latencies (115ms vs 99ms; p=0.019) and fewer responses at
the small check size (p=0.003), compared to controls.
Methadone-exposed infants had significantly lower neurodevelopmental scores
compared to comparison infants (GQ 97 for cases vs 105 for controls; p<0.001),
even after correcting for maternal smoking, antidepressant treatment and
excess alcohol consumption during pregnancy. Infants exposed to poly-drug
misuse and treated for NAS in the newborn period performed particularly poorly
on their neurodevelopmental scores. Visual impairment was independently
associated with poor neurodevelopmental outcome.
The neonatal VEP had a low positive predictive value for six month visual and
neurodevelopmental outcome and would therefore seem to be of limited value
in predicting which infants warrant follow-up assessment.
186
6 Chapter 6 Discussion
This study was prompted by awareness that a growing number of patients
referred to the local paediatric ophthalmology and visual electrophysiology
departments with visual problems had a history of methadone exposure, and by
increasing evidence of opiate related visual problems, as outlined in Chapter 1.
Substitute methadone is the currently recommended treatment for pregnant
opiate-dependent women, with advantages for mother and baby, including
stabilisation of maternal lifestyle and reduced incidence of IUGR (5,129). The
disadvantages of methadone use during pregnancy include an increased
incidence of NAS and possible detrimental effects on infant visual and
neurological development. The latter are variably reported in the literature, and
have not been properly quantified to date. This study sought to explore the
effects of in utero methadone exposure upon early infant visual development
and also to assess the use of the VEP in predicting infant outcomes including NAS
and subsequent visual and neurological development.
6.1 Subject demographic characteristics
Mothers:
Women who misuse drugs in pregnancy commonly suffer other consequences of
social deprivation such as physical and mental ill health and poor nutritional
status. The vast majority of drug-misusing mothers in this study were from the
lower socioeconomic groups (median DEPCAT 7). They did however have a
normal BMI (median 23), and this did not differ significantly from that of the
comparison mothers. Cigarette smoking was more common in the drug-misusing
population than the population as a whole: 95% of drug-misusing mothers in the
study cohort smoked compared to 60% of the comparison mothers. It is
recognised that self reporting significantly underestimates the number of
pregnant smokers and therefore the incidence of smoking in both groups may
have been higher than reported (130). Mental health problems requiring
pharmacological treatment were present in 14% of drug-misusing mothers – this
is comparable to the 12% described in a large local cohort of drug-misusing
mothers by Dryden et al (8).

Chapter 6 187
Infants:
It is well recognised that infants of drug-misusing mothers are more likely to be
born prematurely and to suffer IUGR compared to infants of non-drug-misusing
mothers (10,11). It was therefore very important to match drug exposed infants
with comparison infants for gestation and birth weight, and this objective was
achieved. As anticipated, the mean birth weight of the drug-exposed cohort was
below the 50th centile (2892 grams; 25th centile). Despite matching for birth
weight, the drug-exposed infants had significantly smaller head sizes compared
to comparisons. This effect appeared to be due to the higher proportion of
smoking mothers in the drug-exposed group: after correcting for smoking status
there was no longer any significant difference in head sizes. This finding is in
contrast to those of Shipton et al who found significantly smaller head
circumferences in a much larger cohort of methadone exposed infants compared
to gestation and social deprivation matched non-methadone exposed infants of
smoking mothers (131). Breast feeding rates were similarly poor in both groups,
denying infants the many advantages of breast feeding.
Drug exposure:
In common with other authors, and consistent with the pilot data, a high
incidence of poly-drug misuse was found in the study cohort (8,32,122). The
most commonly misused substances were illicit opiates and benzodiazepines.
Exposure to poly pharmacy makes interpretation of study results complicated
and necessitated the recruitment of a large number of infants. The sample size
calculation estimated that 100 infants would require to be recruited to provide a
cohort of 20 infants exposed to methadone alone, but in reality only nine infants
in the drug-exposed cohort were exposed to methadone alone. It is likely that
the comprehensive collection of toxicology samples, including infant meconium,
provided more accurate information than was available in the pilot study. The
vast majority of women on the methadone programme continued to use illicit
opiates during pregnancy and it should be noted that that there is evidence that
the beneficial effects of substitute methadone on infant birth weight are lost
with concurrent illicit opiate use (14). Identifying the substances used by the
mother is crucial if appropriate recommendations are to be made about
substitute treatment.

Chapter 6 188
Alcohol exposure:
Meconium analysis was undertaken to assess for excess alcohol consumption in
pregnancy. Overall 41% of the drug-exposed cohort and 23% of comparisons
tested had elevated FAEEs on meconium analysis suggestive of heavy alcohol
intake during pregnancy although no infant had a clinical diagnosis of fetal
alcohol syndrome. Regression models were used to correct for the potential
confounding effect of excess alcohol exposure on both visual and developmental
outcomes: this has not previously been documented in the published literature.
Neonatal abstinence syndrome:
Forty eight percent of the drug-exposed cohort received treatment for NAS;
which is comparable with the 40-80% reported in other studies and consistent
with previous local audit (4,8). First line treatment was oral morphine solution
and second line treatment was phenobarbital (30), similar to practice in other
units in the UK (132). Predictably infants requiring treatment for NAS had a
significantly longer hospital stay than infants not treated, but even untreated
infants stayed in hospital three times longer than comparisons. These data
underline the significant resources which these infants utilise within the health
care setting.
6.2 Neonatal visual electrophysiology
6.2.1 Neonatal VEPs
In the neonatal period, there were significant differences between the flash
VEPs of drug-exposed infants and those of matched comparison infants. The
most common flash VEP abnormalities detected in the drug-exposed cohort were
reduced amplitudes, immature waveforms and an absence of P1 components. In
comparison the control infants‟ VEPs were of larger amplitude and of mature
waveform with a greater proportion of both P1 and P2 components. Infants
exposed to methadone in utero were over five times more likely to have an
abnormal neonatal VEP than non-exposed infants (relative risk of 5.6).The pilot
study finding of delayed VEP latencies in drug-exposed infants was not replicated

Chapter 6 189
in the larger study: this may reflect better matching of gestational age between
cases and controls.
Prenatal substance misuse appears to result in an immaturity in the evolution of
normal cortical visual pathways: this electrophysiological finding accords with
the clinical finding of delayed visual maturation described in Pilot Study 4 and by
other authors (64,125). All drug exposed infants‟ neonatal VEPs were recorded
prior to commencement of oral morphine or phenobarbital treatment, so this
was not a confounding factor.
There was no relationship between the neonatal VEP and the onset or severity of
NAS, suggesting that the electrophysiological abnormalities described in
association with maternal drug misuse were not reflective of the temporary
cortical upset caused by neonatal withdrawal. This is an important negative
finding, as infants with no NAS who tend to be discharged early from hospital
with no follow up demonstrate the same abnormalities in their neonatal visual
electrophysiology as those infants kept under close follow up.
Similarly, there were no differences in VEPs between infants in different sub-
groups of illicit drug exposure. Regression analysis was used to investigate
further the independent effects of different drugs of misuse on the newborn VEP
and suggested that the differences in flash VEPs demonstrated between drug-
exposed and comparison infants were associated with in utero methadone
exposure and not the other drugs of misuse. It is possible that the other drugs of
misuse may have had an independent effect on the newborn infant VEP but the
sub-groups were too small to provide sufficient power to detect a difference. It
is also possible that any differences were masked by the effect of methadone
exposure. As all the study infants had been exposed to methadone in utero we
were unable to determine the effects of other illicit drug use alone on the infant
VEP.
A change in the flash luminance resulted in significant differences in flash VEPs
with a brighter light stimulus producing larger amplitude responses with reduced
latencies and more mature waveform morphology. This highlights the
importance of standardising flash stimuli for research trials. Data are not
Chapter 6 190
comparable between laboratories unless equipment has been calibrated to
exactly the same standards.
In contrast to the flash VEP, there were only minor differences in flicker VEPs
between drug-exposed and comparison infants. The flicker VEP is a novel
technique and little normative data are available for the newborn period.
Studies suggest that the optimal flicker frequency increases with increasing
postnatal age and maturity; however the significance of the flicker VEP
amplitude is not yet understood. It is therefore not possible to explain the
differences demonstrated in the flicker VEP amplitude, which although of
statistical significance, may not be of clinical significance.
6.2.2 Proposed mechanism for alteration in VEPs
The VEP is a cortically generated visual response and therefore any adverse
effect of opiates or other drugs of misuse on either the eye or brain may result
in an alteration of visual electrophysiology.
There is evidence from animal studies that methadone accumulates in the eye in
the developing fetus. Pertschuk et al (1977) used an immunofluorescence
technique to compare the eyes of adult rats exposed to methadone with
neonatal rats that had been exposed to methadone in utero. 32% of the neonatal
rats who had been exposed to methadone prenatally demonstrated positive
immunofluorescence localised to the retina; by contrast no adult rats showed
evidence of methadone staining in the eye (133). Similarly, Davis et al (1979)
found that postnatal methadone administration to both rats and frogs led to an
accumulation of methadone and its metabolites in the eye tissue at a
concentration 100 times greater than that in the blood (134).
Immunofluorescence studies have also demonstrated neuronal staining for
methadone in the brain tissue of methadone addicts who had died of an
overdose and in rats administered methadone (135,136). In both studies,
methadone-staining was seen in the hypothalamus, thalamus, hippocampus,
amygdale, cerebellum and brain stem.
Methadone exposure also leads to an alteration of neurotransmitters within the
brain. Guo et al (1990) investigated the effect of prenatal methadone exposure

Chapter 6 191
on acetylcholine levels in the brains of neonatal rat pups and found reduced
acetylcholine content in the striatum (137). Robinson et al (1996) demonstrated
increased acetylcholine turnover in rat pups exposed to methadone in utero
compared to controls (138) and choline acetyltransferase expression (the
synthesising enzyme for acetylcholine) was reduced in the brains of rat pups
exposed to methadone in utero compared to controls (139). The combined or
individual effects of reduced acetylcholine content, increased turnover and
reduced choline acetyltransferase activity may lead to a depletion of
acetylcholine in the brain with a resultant alteration in visual electrophysiology.
In a follow-on study Wu et al (2001) found methadone exposed rat pups to have
a 40-50% reduction in neurotrophic nerve growth factor compared to controls,
suggesting a mechanism for the alteration in cholinergic neurons shown in other
studies (140).
Methadone and morphine exposure have an adverse effect on opiate receptor
binding in animal models (141,142): prenatal exposure to methadone resulted in
reduced µ-opioid binding affinity in the neonatal rat pup (141) and prenatal
morphine administration significantly altered regional development of opiate
receptors in the brains of the rat pups (142). Perinatal morphine administration
also causes a reduction in neuronal packing density in the somatosensory cortex
and preoptic area of the hypothalamus with morphine-induced reduction of
basilar dendritic growth in cortical pyramidal neurones (143).
Although no similar studies exist in human neonates exposed to methadone in
utero, any combination of the mechanisms described above could lead to an
alteration in visual electrophysiology in the human newborn infant.
6.3 Six month follow up
6.3.1 Growth parameters
There were no significant differences in weight or head circumference between
drug-exposed and comparison infants when seen for assessment at six months of
age, reflecting normal postnatal growth. Importantly, drug exposed infants had
demonstrated catch up head growth. A previous study also documented catch up

Chapter 6 192
weight and head growth by 18 months of age in children who had been exposed
to opiates in utero (38): that study found that children did not demonstrate
catch up in longitudinal growth; length was not recorded as part of the current
study protocol.
6.3.2 VEPs
Six month follow-up demonstrated that VEP abnormalities persisted beyond the
neonatal period, with drug-exposed infants having smaller amplitude pattern
responses with delayed latencies. Drug-exposed infants also had significantly
fewer VEP responses to the small check size in keeping with the clinical picture
of reduced visual acuity and delayed visual maturation.
The fact that VEP abnormalities persisted to six months of age suggests that the
effect is not due to residual circulating opiate and is consistent with a
permanent teratogenic effect of prenatal drug exposure on the developing visual
system. By six months of age no infants were on treatment for or had symptoms
of NAS.
6.3.3 Visual outcome
A significant proportion (40%) of the drug-exposed cohort failed the clinical
visual assessment at six months of age, even after correcting for excess alcohol
exposure in utero. Infants exposed to methadone in utero were over five times
more likely to have a clinical visual abnormality at six months of age than non-
exposed infants (relative risk of 5.1). There was no association between visual
outcome and either NAS or drug exposure group, suggesting that all infants born
to mothers on the methadone programme during pregnancy are at risk of visual
problems, regardless of maternal illicit drug use.
Nystagmus
The overall incidence of nystagmus in infants who had been exposed to
methadone in utero was 11%. By comparison, Lloyd et al (2006) found an
incidence of nystagmus of 5% in a population of opiate exposed infants (4).
Infantile nystagmus is extremely rare in the general population: the

Chapter 6 193
Leicestershire nystagmus survey found an incidence of 0.24% (24 cases per
10,000 population) (144). The incidence of nystagmus in infants who had been
exposed to methadone in utero was therefore 50 fold that of the general
population.
Pilot Study 4 found that significantly more infants who had a history of NAS
demonstrated nystagmus compared to those without a history of NAS (92% versus
38%, p=0.017) (125); this finding was not replicated in the main study (p=0.482),
possibly due to the smaller number of infants in the main study with nystagmus
(n=9).
It has been proposed that infantile nystagmus may be caused by visual
deprivation, resulting in oculomotor development outpacing sensory
development (145). A developmental model of infantile nystagmus suggests that
it develops as a response to reduced contrast sensitivity in an early “critical
period”. An alternative explanation may be abnormal µ-opioid receptor binding
in the cerebellum of the developing brain (64). Animal studies and post-mortem
human studies have demonstrated neuronal staining for methadone in the
cerebellum (135,136). Administration of opioids to healthy human subjects leads
to a temporary disruption of ocular fixation, resulting in nystagmus, possibly due
to an effect on opioid receptors within the cerebellum (146).
Strabismus
Disruption of coordinated binocular vision early in life leads to strabismus and
varying degrees of amblyopia, with the extent of impairment dependent on the
time of onset, duration and type of visual deprivation (147). Twenty-five percent
of the methadone-exposed cohort had strabismus, which is in close agreement
with findings reported elsewhere (61,62). This is much higher than in a similarly-
aged general population: screening of 38,000 infants showed a prevalence of
strabismus of 1.3% (71). The proportion of children in the main study with
strabismus who had NAS or not did not differ: 13/41 versus 7/40, Fisher‟s exact
test, p=0.138, supporting the finding by Gill that strabismus does not appear to
be related directly with NAS (61).
Delayed visual maturation
Chapter 6 194
DVM was diagnosed in 14% of infants exposed to methadone in utero. DVM is
generally a retrospective diagnosis made in infants who show delayed visual
development for their postnatal age but then demonstrate catch up. Since the
follow up assessment did not take place until six months of age, it is possible
that some cases of DVM could have been missed. Both the clinical diagnosis of
DVM and immature VEP morphology demonstrated in the neonatal period suggest
that prenatal exposure to methadone and other drugs of misuse causes a delay in
the development of normal visual processing during the fetal and/or early
neonatal period.
Fundal findings
Only two children in the retrospective case series (Pilot study 4) demonstrated
fundal abnormalities. Since dilating eye drops were not used in the six month
follow-up visual assessment, only infants who were seen by colleagues in
ophthalmology had dilated fundoscopy undertaken, of whom only one had an
abnormal examination documented (hyperplastic optic nerves). This is very
much in contrast to the ophthalmic manifestations of fetal alcohol syndrome,
where over half of children demonstrate optic nerve hypoplasia.
Cerebral visual impairment
CVI was diagnosed in 25% of children in the retrospective case-series. CVI causes
problems with processing of complex visual scenes and visually guided movement
(72-74). This results in children having difficulties in picking out objects from a
visually crowded scene, recognising faces and emotions, reading and copying,
and difficulty with steps, curbs and floor boundaries. These difficulties can
affect performance and behaviour and could be one mechanism for the reported
developmental delay and behavioural problems recognised in these children.
This was the first time that CVI had been reported in association with prenatal
opiate exposure and is likely to be an underestimate as CVI is commonly
diagnosed around school entry age (125). The cohort of infants in the main study
was too young at the six month follow-up to assess for CVI, highlighting the
importance of longer term follow up of this cohort.
Effects of different drugs of misuse

Chapter 6 195
Mulvihill et al (2007) suggested that infants exposed to a combination of opiates
and benzodiazepines may be at higher risk for visual abnormalities (64). They
proposed that concurrent use of benzodiazepines may prevent the up regulation
of µ-opioid receptors in the brain where opiates commonly bind. In this study
89% of infants who developed nystagmus were know to have been exposed to
benzodiazepines in addition to opiates in utero, this was higher than the
proportion of infants exposed to benzodiazepines in utero who did not develop
nystagmus (89% vs 68%), but the difference was not significant (p=0.268).
6.3.4 Neurodevelopmental outcome
Infants exposed to methadone in utero demonstrated reduced
neurodevelopment quotients compared to control infants matched for birth
weight, gestation and socio-economic group, even after correcting for maternal
smoking, antidepressant use and excess alcohol consumption during pregnancy.
This was a global delay with significant differences between all developmental
sub groups. Neurodevelopmental delay has been widely reported in the
literature in association with maternal opiate misuse and may be secondary to
many different factors.
Social circumstances: Neurodevelopmental outcome in these infants may be
confounded by social circumstances. Factors associated with drug misuse such as
smoking, alcohol misuse, poor nutrition, housing and education all have
potential adverse effects on infant development. To try to correct for these
factors the controls were matched to cases for socioeconomic group and
regression models used to correct for the potential confounding effects of
maternal smoking, maternal antidepressant use and excess alcohol use in
pregnancy. We cannot however rule out a specific impact of parental addictive
behaviour on the neurodevelopmental outcome of these children. By six months
of age 76% of drug-exposed infants were in the care of their biological parents
and 24% were accommodated (17% in foster care and 7% accommodated with a
family member). No infant had been adopted. Interestingly, infants who were
accommodated performed poorer on their neurodevelopmental scores than
infants living with their biological parents: these infants were, however, more

Chapter 6 196
likely to have been treated for NAS in the newborn period and to have been
exposed to poly-drug misuse including benzodiazepines and stimulants in utero.
Visual problems: Visual impairment may cause delay of developmental
milestones, particularly eye-hand co-ordination, and correction of visual
abnormalities may lead to a subsequent improvement in development. Visual
impairment was found to be an independent predictor of poor
neurodevelopmental outcome and will therefore have contributed to reduced
neurodevelopmental scores in these infants.
Direct effect of drug exposure: Post mortem studies in narcotic addicts who died
from a methadone overdose show uptake of methadone in the hypothalamic
nuclei, sensory-motor cortex, cerebellum, hippocampus and thalamic nuclei
(135). There may therefore be a direct effect of prenatal exposure to
methadone on the developing brain which contributes to the
neurodevelopmental problems seen.
6.3.5 Proposed overall aetiology
The nature of the abnormalities described in this study (abnormal VEPs at birth
and six months of age, reduced visual acuity, DVM, nystagmus, strabismus, and
neurodevelopmental delay) suggests a detrimental effect of in utero drug
exposure on the brain rather than an effect on the eye per se. Although ERGs
were not recorded as part of the main study protocol, the majority of children in
Pilot Study 4 had normal ERGs, suggesting that retinal function in these children
is likely to be normal. A general toxic effect of methadone and other drugs of
misuse on the brain could result in acetylcholine and neurotrophic nerve growth
factor depletion and cause the VEP abnormalities demonstrated with associated
poor vision from birth. Since good vision is required to develop binocularity and
regulate gaze stabilising mechanisms, poor vision from birth could explain the
clinical visual abnormalities described at follow up. This mechanism is well
demonstrated in animal studies: newborn monkeys with normal vision develop
nystagmus and strabismus after a period of forced blindness secondary to having
their eye lids sutured closed for a period of time. Similarly in kitten models,
binocular visual deprivation via surgical or optical strabismus resulted in a severe
loss of cortical binocularity (148,149).

Chapter 6 197
6.4 Study strengths
Pilot study and sample size calculation:
A major strength of this study was the undertaking of appropriate pilot work. A
preliminary pilot study demonstrated the feasibility of measuring flash VEPs in
newborn infants exposed to methadone in utero (122). This pilot work
demonstrated the poly-drug exposure of these infants and provided data to
inform the sample size calculation for the study. The pilot work undertaken to
inform the follow-up phase of the study (Pilot study 4) ensured that the visual
assessment protocol used was appropriate for the population under investigation
(125). The large sample size of 100 infants for the main study allowed the
assessment of individual drugs on the outcome measures and in particular
allowed analysis of a subgroup of infants exposed to opiate alone.
Data collection and drug exposure:
Another strength of the study was the prospective nature of data collection and
the comprehensive pattern of drug exposure obtained from maternal interview,
maternal notes and toxicology samples. This is especially relevant for the follow-
up phase of the study as the vast majority of studies investigating longer term
outcomes in infants exposed to drug misuse in utero rely on retrospective
collection of drug-exposure data.
Recruitment rate:
The high recruitment rate of 98% ensured that the study population was
representative of the general drug-misusing population as a whole.
Control population:
To try to correct for potential confounders, the comparison infants were
matched to the drug-exposed infants for birth weight, gestation and socio-
economic group. To ensure that the comparison population was not exposed to
excess alcohol in utero, meconium samples were collected for FAEE analysis.

Chapter 6 198
Blinding:
Where possible, assessments were undertaken blinded to exposure status. As the
chief study researcher it was not possible for the author to be blinded to the
infant‟s exposure status but repeat VEP analysis (both flash and pattern VEPs)
was undertaken by a second individual who was blinded to the infant‟s exposure
status. Any discrepancy in opinion was referred to a third party who was also
blinded. This should have ensured there was no bias in interpretation of the VEP
results. Six month visual follow-up was undertaken in conjunction with an
optician who was blinded to the infant‟s exposure status, thereby reducing bias
for the visual follow up.
6.5 Study limitations
Confounders:
Children who have been exposed to methadone in utero are also commonly
exposed to other adverse consequences associated with maternal drug misuse,
such as maternal physical and mental ill health, poor nutritional status, smoking
and alcohol consumption (1,6). Despite matching successfully for DEPCAT scores
and using regression models to correct for maternal smoking and excess alcohol
intake it is possible that there remain differences other than pre-natal drug
exposure which could account for the differences seen between groups.
Blinding:
The Griffiths neurodevelopmental assessment was undertaken by the author
alone and it was not possible for her to be blinded to the infant‟s exposure
status as she was responsible for recruitment, data collection and follow-up
organisation. It is therefore possible there could have been some bias in
interpretation of the developmental assessment. To minimise this, a well
validated developmental scale for the assessment was used.
Follow-up:
Chapter 6 199
Retaining subjects from poor and disadvantaged backgrounds to follow-up
studies is recognised to be challenging due to their chaotic lifestyles and
frequent change of address. A 40% drop-out rate was predicted for the follow-up
phase of the study to allow for this: actual drop-out rate was 21% in the cases
and 48% in the controls, overall 30%. This compared favourably with other
studies: Hunt et al (2008) had a drop out rate of 50% in their study of 133 opiate-
exposed infants (38). Every effort was made to optimise study retention
including telephone calls to parents, reminder letters sent in the post, reminder
telephone calls regarding visits and taxi transportation to the study hospital. A
high loss to follow-up may introduce bias as the results of those infants lost to
follow-up may significantly alter the final results: in this case it is proposed that
infants whose family life is so chaotic that they are uncontactable for follow up
are unlikely to perform better than infants who attend for follow up.
Timing of follow-up:
Six months was chosen for the follow up visit as the majority of visual problems
could be diagnosed by this age and it was early enough to allow intervention if
required in children with problems such as significant refractive errors. The six
month appointment also allowed completion of follow up within the two year
time duration of the study. The retrospective case series identified a subgroup
of children with CVI which is usually not diagnosed until childhood (72,73) and so
the proportion of children with visual problems may be higher if these children
were to be followed up for a longer period of time.
Six months of age is generally recognised as being too young to make an
accurate assessment of neurodevelopmental outcome. Full assessment of
neurodevelopment should ideally be made at approximately two years of age
and in the pre-school year. It is possible that some children may develop
neurodevelopmental problems not apparent at six months of age and in addition
six months of age is too young to assess for behavioural problems which have
been reported to be more common in drug-exposed children. It is therefore
likely that the six month follow-up under represents the full scale of visual,
developmental and behavioural problems affecting children of drug-misusing
mothers.
Chapter 6 200
As the study progressed it became apparent that it would be useful to follow-up
this cohort of infants for longer term assessment and an Ethics Committee
amendment was made to collect consent for future follow-up at the time of
initial consent.
Drug-exposure status:
Maternal history is often unreliable as a method of detecting prenatal drug
exposure. This study used a prospective five-point technique to determine drug
exposure in the study infants (maternal case notes, maternal interview,
maternal urine toxicology, infant urine toxicology, infant meconium toxicology).
This provided a comprehensive assessment of drug exposure and compares
favourably with other studies. There are however no toxicology samples which
can be obtained from an infant which reflect first trimester drug exposure, and
drug-misusing women often present late for obstetric care due to chaotic
lifestyle and a reluctance to have involvement with social services. It is
therefore possible that an infant could have been exposed to an illicit drug
which was not detected, particularly in the first trimester of pregnancy.
6.6 Clinical recommendations
Infants who have been exposed to methadone in utero should be referred for a
programme of visual assessment. Referral should be made from the neonatal
unit to the local ophthalmology service.
Neonatologists and paediatricians should be made aware of the risks of visual
problems in infants exposed to methadone in utero and should enquire about
and screen for these opportunistically when seeing children in clinic.
Dissemination of the results of this study has been undertaken via presentation
of the findings at national meetings and publication in peer-reviewed journals. A
Press Release was circulated secondary to one of the publications and this has
generated more widespread media attention (Appendix 9).
Infants and children with proven ophthalmologic abnormalities should be
referred for visual electrophysiology. There does not appear to be a role for VEP
testing in the newborn period to help predict visual or developmental outcome.

Chapter 6 201
All children who have been exposed to methadone in utero with developmental
delay should be referred to ophthalmology, and assessment should include a
structured questionnaire to assess for CVI.
6.7 Future research and controversies
The cohort of infants recruited for this study has prospectively collected data
including neonatal and maternal demographics and drug exposure status and so
would therefore be ideally suited to longer-term visual and developmental
follow-up.
Longer term visual follow up should include assessment for CVI. Developmental
assessment should also be undertaken to determine how many children with
developmental delay have associated CVI. Future research should also address
whether a developmental programme could improve outcome in children with
developmental delay and CVI. Longer term follow up would also allow an
assessment of how accommodation status impacts on the child‟s
neurodevelopmental and behavioural outcomes.
Methadone is widely prescribed to pregnant opiate-dependent women. Use of
methadone in pregnancy conveys various advantages to mother and infant
including stabilisation of maternal lifestyle and reduced incidence of both
preterm delivery and IUGR (5,10,11). However infants born to methadone-
maintained mothers have a significant incidence of NAS and longer term adverse
visual outcomes. Provision of optimal health care is always a balance of the risks
and benefits of any therapy but we also have a duty to “first do no harm”.
Prescription of a substance that has been shown to have potential long-term
teratogenic effects on the developing fetus must be critically reviewed.
Further study should therefore investigate alternatives to methadone treatment
for pregnant opiate-dependent women. Acute detoxification may be unsafe in
pregnancy and relapse rates are high. Buprenorphine is a synthetic opiate which
is used worldwide for opiate dependence with theoretical advantages over
methadone in the treatment of opiate addiction in pregnancy due to reduced
placental transfer (150). Limited published data on the use of buprenorphine in
pregnancy suggest a good safety profile, a trend towards a shorter hospital stay

Chapter 6 202
and reduced incidence of NAS for the newborn infant as well as potential
advantage in terms of infant neural development (121,151). Future studies
should investigate the role of buprenorphine versus methadone on both short
and longer term infant outcomes.

203
7 Chapter 7 Appendices
7.1 Appendix 1: Parent information sheet
Visual and brain function in infants born to drug-using mothers
Parental information sheet: Version 4 (Sept 2008)
You are being invited to allow your baby to take part in a research study. Before
you decide, it is important for you to understand why the research is being done
and what it will involve. Please read the following information carefully and
discuss it with others if you wish. Ask us if anything is unclear or if you would
like more information. Take time to decide whether or not you wish your baby to
take part.
What is the purpose of the study?
Methadone is given to pregnant mums to help to stabilise their drug habit and
improve their health in pregnancy. The benefit of taking methadone in
pregnancy is that the baby is less likely to be born prematurely; the downside is
that he/she may develop withdrawal symptoms after birth. At present we
cannot tell which babies will get withdrawals, which is why we are planning this
study. We believe that measuring vision and brain-wave activity (using tests
which will not hurt the baby) will help to explain why some babies develop
withdrawal symptoms, and may tell in advance which babies will be affected.
This might help us to care better for babies in the future. Because drugs in
pregnancy may affect babies‟ longer term vision and development, we would
like to follow up your baby when he/she is 6 months old to check his/her vision
and development.
Why has my baby been chosen?
We are asking all pregnant mums who are receiving methadone treatment
and/or using other drugs in pregnancy and whose babies are born no more than
four weeks early if their baby can take part in this study.

Chapter 7 204
Does my baby need to take part?
No. It is entirely up to you. If you do decide that your baby can take part you
will be given this information sheet to keep and be asked to sign a consent form.
You will be free to withdraw from the study at any time and you won‟t have to
give a reason. If you decide not to take part or to withdraw, this will not affect
the standard of care that your baby will receive.
What will happen to my baby and myself if he/she takes part?
While your baby is less than four days old, we will record their VEP (visual
evoked potential) and their EEG (electroencephalogram). Small pads with leads
will be placed on their head using paste which is like Vaseline. More pads on
their chest will measure their heart rate and breathing. We will record the EEG,
which is brain wave activity, for about an hour and video your baby so we know
when he/she is asleep or awake. We will then record more brain wave activity
while showing your baby flashes of light (the VEP). The tests are completely
painless. No needles are involved. It will take about 1½ hours and you will be
welcome to stay with your baby.
From your baby: we will collect samples of urine and meconium (faeces) during
the first few days after he/she is born. The baby‟s urine sample will be collected
from a small bag stuck onto his/her bottom which is painless. The meconium will
be collected directly from the nappy.
From you: we will collect a urine sample when you come into hospital in labour
and a blood sample from the placenta (afterbirth) afterwards. We know that lots
of mums take extra drugs in pregnancy besides the methadone; the results of
these tests will be kept confidential and will not be given to anyone else: they
will not affect the care that you receive.
These tests will help us to know which drugs are in your system and whether
they reached your baby.

Chapter 7 205
We will make an appointment to follow up your baby at 6 months of age to
check their vision and development. This will usually be done at the Princess
Royal Maternity but if you are unable to attend we will ask your permission to
come and visit you. Follow up will involve a repeat VEP test and we will also
check how well your baby sees. If there are any concerns about your baby‟s
vision or development he/she will be referred to one of the specialists at
Yorkhill Hospital.
What are the possible risks of taking part?
There are no risks to either yourself or your baby from taking part in this study.
What are the possible benefits of taking part in this study?
There is not expected to be any direct benefit to either yourself or your baby
from taking part in this study. There is a possibility that we may identify a
problem with your baby‟s vision or development which would not otherwise have
been detected until later, in which case we will refer you to a specialist. Taking
part in the study may help future babies if the results allow us to improve the
way we look after pregnant drug using mums and their babies.
Suggestions and complaints
If taking part in this research project harms your baby, there are no special
compensation arrangements. If your baby is harmed due to someone‟s
negligence, then you may have grounds for a legal action but you may have to
pay for it. Regardless of this, if you wish to complain about any aspect of the
way you have been treated during the course of this study, the normal National
Health Service complaints mechanism may be available to you. You can put any
complaint in writing to Mrs. Anne Snape, Patient Liaison Manager, North Glasgow
University Hospitals Division, 84 Castle Street, Glasgow G4 0SF (telephone 0141
211 5112). If you have any suggestions to make regarding the study, please
contact Dr. Helen Mactier (telephone 0141 211 5304).

Chapter 7 206
Will my baby‟s taking part in this study be kept confidential?
Unless you have any objections, we will inform your GP that your baby has taken
part in this study. Otherwise, all information collected about your baby during
the course of this research will be kept strictly confidential.
What will happen to the results of the research study?
Information gathered from this study will be analysed and the results submitted
for publication in a medical journal. Information may also be presented at
scientific meetings. Your baby will not be identified in any presentation or
written document.
Who is funding this research?
The equipment required to record the VEP has been purchased for the Princess
Royal Maternity by the Glasgow Royal Infirmary Appeals Trust. None of the
persons involved receives any money when a baby joins the study.
Who has reviewed this study?
This study has been approved by the Glasgow Royal Infirmary Ethics Committee.
Contact for further information
Dr Helen Mactier, Consultant Neonatal Paediatrician, can be contacted on 0141
211 5304 or via Glasgow Royal Infirmary switchboard (0141 211 4000). If you
have any questions or concerns - please simply ask the midwife who is looking
after your baby. Her name will be on a card on your baby‟s incubator.
Thank you for taking time to consider this research study.
Dr Helen Mactier and Dr Laura McGlone

Chapter 7 207
7.2 Appendix 2: Letter to G.P.
Neonatal Unit,
Princess Royal Maternity,
8-16 Alexandra Parade, Glasgow.
Visual and brain function in infants born to drug-using mothers.
GP information Sheet Version 1, June 2008
Dear Dr.
Please be advised that your patient (name)……………………………………………..
Date of birth…………………………………………..
Hospital number………………………………………
Address………………………………………………………………………………….
Is participating in the above study. This is a study of visual and cortical function
in newborn infants exposed to methadone +/- other drugs in pregnancy. The
infant underwent EEG and VEP recordings during the first week of life, and will
be recalled for visual function testing at the age of 6 months.
If you have any queries, please contact Dr. Helen Mactier, Consultant
Neonatologist at Princess Royal Maternity (telephone 0141 211 5249/5304) who
will be happy to discuss them with you.
Yours faithfully,
Dr. Helen Mactier
Chapter 7 208
7.3 Appendix 3: PRM neonatal abstinence syndrome
guidelines
Introduction to the NAS policy
Neonatal Abstinence Syndrome (NAS) is a constellation of symptoms occurring in
a baby as a result of withdrawal from physically addictive substances taken by
the mother. These substances include methadone, benzodiazepines, opiates,
cocaine and amphetamines as well as caffeine, nicotine and some antidepressant
agents. The majority of infants with NAS in Glasgow will be withdrawing from
opiates or opioids ± benzodiazepines. Almost all drug misusing mothers smoke in
pregnancy; it is not known how much nicotine withdrawal contributes to
symptoms.
Diagnosing NAS
Signs and symptoms of NAS include excessive irritability, in-coordinate sucking,
vomiting, diarrhoea and poor weight gain. Rarely, convulsions may occur. The
diagnosis of severity of NAS (and the need for pharmaceutical treatment) is
largely subjective, but various scoring systems have been used in an attempt to
standardise treatment. The scoring system currently used in Glasgow is the
modified Lipsitz tool. The aim of treatment is to control symptoms to allow oral
feeding, tolerable irritability and adequate weight gain. NAS is the likely
diagnosis in an infant who demonstrates the signs and symptoms listed above
and whose mother was known to have used addictive substances in pregnancy.
Other common causes of excessive irritability can generally be excluded by
careful history taking, clinical examination and measurement of blood sugar,
calcium and magnesium.

Chapter 7 209
Lipsitz Score Tool
Signs 0 1 2 3
Tremors (muscle
activity of limbs)
Normal Minimally
increased when
hungry or
disturbed
Moderate or
marked increase
when undisturbed;
subside when fed
or held snugly
Marked increase
or continuous
even when
undisturbed,
progressing to
seizure-like
movements
Irritability
(excessive crying)
None Slightly
increased
Moderate to
severe when
disturbed or
hungry
Marked even
when
undisturbed
Reflexes Normal Increased Markedly
increased
Stools Normal Explosive, but
normal
frequency
Explosive, more
than 8 per day
Muscle tone Normal Increased Rigidity
Skin abrasions No Redness of knees
and elbows
Breaking of skin
Respiratory rate
/ minute
< 55 55-75 76-95
Repetitive
sneezing
No Yes
Repetitive
yawning
No Yes
Vomiting No Yes
Fever No Yes

Chapter 7 210
Management of NAS
Simple measures to control symptoms of NAS include swaddling, the use of
dummies and prolonged nursing. The pharmaceutical treatment of choice is the
substance from which the infant is withdrawing.
Treatment should be started if the Lipsitz score > 5 on two occasions 12 hours
apart despite efforts to console the infant by nursing/carrying. Treatment may
also be required if the symptoms are sufficient to cause poor feeding/ongoing
weight loss after 5 days.
Pharmaceutical treatment:
This will depend upon the mother‟s drug use during pregnancy. Mothers will fall
into 3 groups:
A. Opiate/opioid use only
B. Opiate/opioid plus benzodiazepine
C. Non-opiate/opioid drugs only
Groups A and B (Opiate/Opioid users)
Initial therapy - oral morphine solution 60micrograms/kg four hourly.
Escalating treatment - if symptoms are not controlled within 24 hours
Increase oral morphine daily by 10micrograms/kg per dose to a maximum of
80micrograms/kg/dose.
If symptoms are not controlled after 48 hours on the maximum dose of oral
morphine add phenobarbital (dose as below).
Group C. (Non- Opiate/Opioid users)

Chapter 7 211
Initial therapy - Start oral phenobarbital – loading dose 15mg/kg, followed by
maintenance dose 8mg/kg once daily.
Weaning treatment: This should be commenced when the symptoms of NAS are
adequately controlled. This may be defined as a Lipsitz score of < 5 on at least
one occasion in the past 24 hours. Also the symptoms may be considered
controlled if the infant is able to be consoled if nursed and they are sleeping for
periods of at least two hours between feeds. This latter approach is helpful if a
baby is being weaned in the community without Lipsitz scoring.
Babies on Oral Morphine only
Each day, wean the oral morphine by 10micrograms/kg per dose. If symptoms
worsen (Scores >5) during the weaning process, review the maternal drug history
and consider addition of oral Phenobarbital rather than stopping or reversing the
weaning of the morphine therapy. The aim is to reduce and stop the morphine
therapy within the 1st 10 days of life as a delay beyond this time will necessitate
a potentially avoidable admission to the SCBU.
Babies on Oral Morphine and Phenobarbital
Each day, if scores remain < 5, wean the oral morphine by 10micrograms/kg per
dose. Oral Morphine should be weaned completely before reducing the
Phenobarbital therapy. Once the morphine has been discontinued the
Phenobarbital may be weaned in hospital or, if the there are no other reasons
for the baby to remain in hospital, as an out-patient.

Chapter 7 212
7.4 Appendix 4: Standard Operating Procedure for
recording VEPs
Check eligibility of infant:
> 36 weeks gestation
no congenital ocular abnormality
no signs of neonatal encephalopathy
infant clinically well
signed informed consent obtained
Infant care management:
Check infant‟s feeding schedule: VEP should be commenced shortly after
completion of a feed. VEPs will be recorded in the consulting room in the Special
Care Baby Unit (SCBU) in Princess Royal Maternity. Discuss planned recording
session with SCBU staff and ensure that room is vacant. Affix “do not disturb”
notice to consulting room door.
Invite parents to attend during the recording session. Avoid visiting period unless
by discussion with mother (no visitors expected). Ensure that postnatal ward or
SCBU midwifery staff (as applicable) are aware of the procedure.
Transport infant to SCBU consulting room in a cot. Take a bottle of infant
formula unless mother is breast feeding. Ensure nappy clean and infant
reasonably content. Offer additional feed if required.
Infants will be either placed supine in a cot or held by the parent or researcher
during the recording.

Chapter 7 213
Preparation of infant:
Examine electrodes for evidence of silver chloride coating and absence of visible
scratches. Test electrodes by connecting together with conducting paste and
performing impedance test.
Place scalp electrodes: The scalp electrodes will be placed relative to bony
landmarks, in proportion to the size of the head, according to the international
10/20 system 1, 2 (Figure 1): The recording electrode will be positioned at a
distance of 10% of the total nasion-inion distance above the inion in the midline
(Oz position). The reference electrode will be positioned at a distance of 30% of
the total nasion-inion distance above the nasion in the midline (Fz position). The
ground electrode will be positioned on the mastoid bone below the ear.
Measure nasion-inion distance with a disposable measuring tape and note correct
position for electrodes. Cleanse skin at electrode sites gently with a clean cotton
bud and exfoliating paste. Apply conducting paste to electrodes and fix to the
scalp with medical adhesive tape.
Scalp-electrode impedance will be measured prior to each recording and should
be approximately equal with target levels of below 5 kOhms. If the impedance is
greater than 10 kOhms, the electrodes will be repositioned and/or scalp gently
recleaned. Overhead room lights should be switched off and the room
illuminated by the wall-mounted angle poise lamp, turned towards the wall. The
X-ray viewing box should be switched off.
VEP recording:
Switch on Espion® recording system and check that hand-held flash is plugged in
and operating. Enter patient details including name, date of birth and hospital
number.
The hand-held integrating sphere will be presented to the infant‟s eyes in the
midline held against the infant‟s forehead. VIDI protocol Version 1.0 will be run
which will deliver standard flash, bright flash and pulse wave and sine wave
flicker. The protocol will be run twice to ensure reproducibility.

Chapter 7 214
Documentation:
Awake/sleep state and degree of eye opening will be documented for each step
of recording. Record relevant maternal and infant data on the case report form
/ database.
Completion of procedure:
Once recording has been completed the adhesive tape will be gently removed by
the application of warm water and the electrodes removed from the scalp.
Residual conducting paste will be removed with warm water. The recording
session will be summarised with parents/carers. The infant will then be returned
to the postnatal ward or SCBU.
Electrodes will be cleaned after each recording by soaking in cold water and
gently rubbing off residual conducting paste. Electrodes will be sterilised after
use by soaking in Milton® solution for 15 minutes. Electrodes will be soaked
overnight in Milton® solution on a weekly basis to ensure re-chlorination.
VEPs will be stored in a password locked computer and data regularly backed up
after each recording. The Espion recording system will be kept in a locked room
within the PRM.

Chapter 7 215
Figure 1:
References:
1. Harding G, Odom J, Spileers W, Spekreijse H. Standard for visual evoked
potentials 1995. Vision Research. 1996; 36(21): 3567-72.
2. Odom J, Bach M, Barber C et al. Visual evoked potentials standard.
Documenta Ophthalmologica. 2004; 108: 115-123.

Chapter 7 216
7.5 Appendix 5: Letter to parent
Neonatal Unit,
Level 4,
Princess Royal Maternity,
8-16 Alexandra Parade,
Glasgow.
Date: …………………….
Dear
Thank you for agreeing to bring …………………………….. for a vision and
development check as discussed on the telephone.
We look forward to seeing you on
……………………………………………………………………………………………….
Please come to the Neonatal Unit on Level 4 of the Princess Royal Maternity.
We will arrange a taxi to pick you up and take you home again as discussed on
the telephone.
Kind regards
Dr Laura McGlone
Neonatal Specialist Registrar
Tel: 0141 211 5388

Chapter 7 217
7.6 Appendix 6: Standard Operating Procedure for visual
assessment
Parents will be invited to attend the Princess Royal Maternity for assessment.
Assessments will be undertaken as close to six months (26 weeks) corrected
gestational age as possible. Two professionals will be involved in assessment
(research fellow and optician).
Tests will be carried out in a well lit room with the infant sitting on the
parent/carers knee and will be timed to co-ordinate with the infant‟s feeding
regime.
Eleven tests will be carried out in total subject to the child‟s co-operation. Each
test has pass/fail criteria.
Symmetrical corneal reflexes: *
Lighted pen torch held 30cm from child‟s eyes. Attention gained on testers face.
Corneal reflections should be symmetrical. Fail if constant asymmetry.
Pupil response:
Dim room. Cover each eye in turn and observe pupil constriction in response to a
lighted pen torch. Allow 5 sec for response. Fail if no response.
Lateral tracking: *
Present a small toy in the centre of the field of vision 20-30 cm from the child‟s
nose. Move toy at 10cm / second laterally to one side and note angle at which
child stops tracking object. Repeat on other side. Can be repeated up to 3
times. Pass = 1/1 or 2/3 positive responses tracking to >20 degrees. Note type of
eye movements and presence of NYSTAGMUS.
In addition, cover each eye in turn and observe for LATENT NYSTAGMUS.

Chapter 7 218
Lateral field testing:
Tester kneels 60 cm in front of child so at same height as child. Use small high
contrast toy on a stick. Move object from peripheral field inward, along an arc,
towards the midline at a rate of 5 cm/sec and distance of 25cm from child‟s
face. Note the angle from midline at which child looks to object. Repeat 2-3
times. Fail if complete absence of response either side.
Convergence to approaching object:
Present small toy 30cms from child‟s eyes. Bring toy towards nose at 2-5 cm/sec
and watch for eyes converging. Fail if persistent lack of convergence.
Visual following of falling toy:
Attract attention to a large, colourful toy held by tester 60-90 cm away with
outstretched arm. Observe whether child makes eye or head movement to
ground as toy falls or immediately after toy has fallen. Can repeat up to 3 times.
Pass is response on 1/1 or 2/3.
Batting/reaching:
A large colourful toy is held at arms length from child. Observe for attempts to
bat / reach for toy. Fail is no attempt to obtain toy.
Acuity cards: *
Use Cardiff Acuity Test cards with pattern on one side and luminance matched
grey field on other side. Present card 50cms from child‟s eyes. For each acuity
level shuffle three cards then present card at child‟s eye level with the centre of
the card at the tester‟s eye level. Observe infants‟ eye movements to estimate
the position (top/bottom) of the pattern. If two correct estimates are made
proceed to the next acuity level. The end point is taken as the highest level at
which 2/3 cards are scored correctly and the equivalent Snellen acuity recorded.

Chapter 7 219
Screening retinoscopy: *
Non-dilated retinoscopy is performed to screen for media opacities and gross
refractive errors.
View retinoscopy reflexes in slightly dimmed room and note whether there are
clear retinal reflexes in each eye (Fail = evidence of media opacity).
With the infant fixating the retinoscope, compare the speed of the reflexes
between the eyes and between perpendicular meridians in each eye. Expected
result is quick „with‟ reflexes in all meridians showing a small lag of
accommodation.
Engage the infant‟s interest in a fixation target (toy on stick). Move the target in
front of the retinoscope towards the child‟s face and observe the reflexes using
a retinoscopy working distance in the range of 50-67 cm. (Accommodation should
neutralise and then reverse the reflexes ‟against‟ movement.). Pass =Neutral
achieved with the target 10-20 cm in front of the retinoscope and equal between
the eyes (no significant anisometropia) and between perpendicular meridians in
each eye (no significant astigmatism).
Diffuse light reaction:
Sit child in darkened room. Shine a light source on the wall within child‟s field of
vision. Observe for head turn / eye movements towards light (5-10 sec for
response). Repeat with light source on other side.
Defensive blink:
Tester sits facing child. Attract attention with wriggling fingers which are
withdrawn until level with testers shoulder. Then move hand with fingers
extended and palm forward rapidly (10cm/sec) towards child to 10cm from nose.
Observe for rapid eyelid blink response. Can repeat up to 3 times. Pass is
response on 1/1 or 2/3.

Chapter 7 220
Tests highlighted with a * are to screen for the most commonly identified
abnormalities detected in this population and should be prioritised if the infant
has a limited attention span.
A fail in any test will result in prompt referral for formal ophthalmology
assessment.

Chapter 7 221
7.7 Appendix 7: Standard Operating Procedure for
neurodevelopmental assessment.
Parents will be invited to attend the Princess Royal Maternity for assessment.
Assessments will be undertaken as close to six months (26 weeks) corrected
gestational age as possible. Two professionals will be involved in assessment
(research fellow and optician).
Assessment will include:
Measurement of O.F.C.: Measured 3 times with a disposable tape measure,
largest diameter recorded and plotted on appropriate growth chart.
Assess muscle tone and posture: Tone normal, hypotonic or hypertonic. Posture
normal or abnormal.
Developmental assessment will be carried out using the Griffiths Mental
Development Scales (Birth to 2 years) using the appropriate manual and
recording sheets.
Locomotor development:
Examination prone (lifts chin, head, shoulders)
Examination supine (lifts head, shoulders, anticipates pull to sit)
Rolling (side to back, side to side, back to stomach)
Sitting with support (back firm, slight support, alone)
Crawling reaction (draws up knees, pivoting, tries to crawl, progress forwards or backwards)
Stepping reaction (dancing, one foot in front of other)
Playing with toes
Personal-social:
Smiles

Chapter 7 222
Vocalises when talked to
Expresses emotions (2+)
Turns to person talking
Looks at mirror image
Spoon (holds, manipulates in play)
Awareness of strangers
Hearing/language:
Startles / listens to bell
Searches for sounds with head movements
Turns head deliberately to bell
Listens to tuning fork
Listens to conversations
Number of different sounds
Babble (two syllables)
Eye/hand:
Follows moving bell-ring (horizontally, vertically, in a circle)
Reaction to Ring (grasps, reaches for, grasps when dangling, secures when dangling, secures by string, dangles by string)
Looks for fallen object
Strikes objects together
Forefinger and thumb partially specialized
Performance:
Hand (to mouth, plays with fingers)
Reaction to Rod (holds, resists withdrawal)

Chapter 7 223
Reaction to Cube (grasps, takes from table, holds two, manipulates, passes hand to hand, drops one cube for third)
Tissue paper (pulls, reaches for, plays with)
Lifts cup inverted over toy
A sub-quotient score will be calculated for each of the developmental sub-
scales. A total general quotient score (G.Q.) will also be calculated using the
Griffiths manual. Infants with abnormalities or developmental delay will be
referred via the paediatric consultant to the appropriate hospital clinic
(neonatal OPC, developmental clinic or neurology OPC). After completion of the
Griffiths assessment all test material will be cleaned by wiping with sterilising
alcohol wipes.

Chapter 7 224
7.8 Appendix 8: Letter to ophthalmology
Neonatal Unit,
Princess Royal Maternity,
8-16 Alexandra Parade,
Glasgow.
Date: ……………
Dear Jane,
The following baby was exposed to methadone in utero and was recruited to the
VIDI study.
Name:
D.O.B.:
Address:
Tel. no:
Findings at the 6 month vision screening assessment were:
I would be grateful if you could arrange out-patient clinic follow-up for them.
Kind regards
Dr Laura McGlone
Neonatal Specialist Registrar

Chapter 7 225
7.9 Appendix 9: Press release and media clip

Chapter 7 226
7.10 Appendix 10: Further reflections on methodology
and future research
This was a cohort study as the exposure status was known definitively at the
time of study recruitment. In the neonatal part of the study, infants who had
already been exposed in utero to methadone were recruited and investigated for
abnormalities of the VEP in the newborn period. These infants‟ demonstrated
VEP abnormalities which were present at the time of study recruitment and a
matched non-exposed group were recruited for comparison purposes.
In the follow-up study, the same cohort of methadone exposed and non-exposed
infants were followed up prospectively to assess for clinical visual and
developmental abnormalities. Therefore at the time of study recruitment the
infants had a defined exposure status but were free of disease.
Validity of neonatal results:
The validity of the neonatal results can be considered under the headings of
chance, bias and confounding. Chance was minimised by the large sample size
recruited and the high significance level of the p-values obtained (p<0.001 for
VEP amplitude and morphology).
Bias was minimised by the high recruitment rate of study participants,
recruitment within a single hospital and matching of drug-exposed and
comparison infants. In addition bias was further minimised as infants had an
exposure status defined prior to study recruitment.
Confounding was minimised by the matching of drug-exposed and comparison
infants. In addition, we explored for potential confounders and undertook
regression analysis to correct for the effect of confounders on study outcomes.
Validity of follow-up results:
Bias was minimised in the follow-up study as exposure status was defined both
prior to study recruitment and to occurrence of the disease, suggesting a
temporal sequence between exposure and the disease. There was minimal error

Chapter 7 227
in classification of exposure status (misclassification) as a result of the extensive
toxicology undertaken in addition to history. The bias of non participation was
minimised by the high recruitment rate of both drug-exposed and comparison
infants. The bias of loss to follow-up is often a factor in prospective cohort
studies and was minimised by the high retention rate of drug-exposed infants.
Although there was a higher loss of comparison infants, there were no significant
differences in demographic characteristics between comparison infants followed
up and those not followed up, suggesting the groups were similar. In addition,
published data suggest the incidence of visual abnormalities described in our
comparison population to be representative of the larger population.
Confounding was minimised by matching of drug exposed and comparison infants
and by restriction of study participants (to exclude the confounding effects of
prematurity, congenital anomalies and illness). In addition, regression analysis
allowed correction of other identified potential confounders.
Judgement of cause-effect relationship:
The above discussion highlights that it is unlikely that chance, bias and
confounding are responsible for the statistical associations demonstrated in this
study. We propose a cause-effect relationship between in utero methadone
exposure and infant visual abnormalities. This is supported by the strength of
association between methadone exposure and both abnormal VEPs and visual
impairment: the relative risk of over five for both of these outcomes and
attributable risk percent of over 80% makes it unlikely that another unidentified
factor could account for the findings. The cause-effect relationship is also
biologically credible: several animal studies have demonstrated a detrimental
effect of prenatal methadone exposure on cerebral neurotransmitters and nerve
growth factor which could have an adverse effect on early visual processing – it
is entirely likely this effect also applies to human newborns. These findings are
also consistent with other published studies in the literature, using alternative
methodology in different geographic settings and populations‟, contributing to
the growing body of evidence that prenatal methadone exposure is harmful to
the developing fetus. In addition, the time sequence of the association supports
a cause-effect relationship: in utero exposure definitively predated the onset of
symptoms. Finally, there is evidence of a dose-response relationship as more

Chapter 7 228
infants exposed to high dose methadone failed the clinical visual assessment
than infants exposed to low dose; although this did not quite reach statistical
significance. Assuming this causal effect of methadone exposure, over 80% of
VEP abnormalities and clinical visual abnormalities could be attributed to
methadone and therefore be eliminated if infants were not prenatally exposed.
Outline of future trial:
As our study has suggested a causal relationship between in utero methadone
exposure and infant visual impairment, future studies should investigate
alternatives to substitute methadone during pregnancy. Although 80% of the
difference in outcome seems to be related to methadone exposure, it is possible
some other unidentified confounders related to the lifestyle of drug misusing
mothers could be partly responsible. This could be addressed by conducting a
randomised, controlled trial programme to compare substitute buprenorphine
treatment during pregnancy with substitute methadone. The primary outcome of
this trial programme should be the incidence of clinical visual impairment and it
should be powered to detect a reduction in the incidence of clinical visual
abnormalities at six months of age in the buprenorphine-exposed group. A
secondary outcome should be VEP abnormalities at six months of age. This trial
programme would involve recruitment and randomisation in early pregnancy of
opiate dependant women. Although the main outcome would be infant visual
impairment, comparisons would also be made of pregnancy outcomes, neonatal
outcomes (including birth weight, OFC, gestational age and development of NAS)
and longer term developmental outcomes. Assessors should be blinded to the in
utero drug exposure group. Such a study should ideally involve follow-up until
school age to assess the natural history of visual and developmental
abnormalities and assessment of CVI. A study of this nature would involve
collaboration between obstetricians, neonatologists, ophthalmologists and
developmental paediatricians. It would involve detailed data collection during
pregnancy relating to smoking, alcohol use and additional illicit drug use and
utilise urine and meconium toxicology collection to facilitate this.

229
8 References
(1) Johnson K, Gerada C, Greenough A. Substance misuse during pregnancy. Br J Psychiatry 2003 Sep;183:187-189.
(2) Bell J, Harvey-Dodds L. Pregnancy and injecting drug use. BMJ 2008 Jun 7;336(7656):1303-1305.
(3) Sharp C, Baker P, Goulden C, Ramsay M, Sondhi A. Drug misuse declared in 2000: key results from the British Crime Survey. Home office report. 2001.
(4) Lloyd D, Myserscough E. Substance misuse research. Neonatal abstinence syndrome. A new intervention: A community based, structured health visitor assessment. Scottish executive social research substance misuse research programme 2006 (web only publication).
(5) Mactier H. The management of heroin misuse in pregnancy: time for a rethink? Arch Dis Child Fetal Neonatal Ed 2010 Jun 28.
(6) Hidden Harm. The report of the Inquiry by the Advisory Council on the Misuse of Drugs. London: UK Home Office, 2003.
(7) Sherwood RA, Keating J, Kavvadia V, Greenough A, Peters TJ. Substance misuse in early pregnancy and relationship to fetal outcome. Eur J Pediatr 1999 Jun;158(6):488-492.
(8) Dryden C, Young D, Hepburn M, Mactier H. Maternal methadone use in pregnancy: factors associated with the development of neonatal abstinence syndrome and implications for healthcare resources. BJOG 2009 Apr;116(5):665-671.
(9) Johnson K, Greenough A, Gerada C. Maternal drug use and length of neonatal unit stay. Addiction 2003 Jun;98(6):785-789.
(10) Arlettaz R, Kashiwagi M, Das-Kundu S, Fauchere JC, Lang A, Bucher HU. Methadone maintenance program in pregnancy in a Swiss perinatal center (II): neonatal outcome and social resources. Acta Obstet Gynecol Scand 2005 Feb;84(2):145-150.
(11) Burns L, Mattick RP, Lim K, Wallace C. Methadone in pregnancy: treatment retention and neonatal outcomes. Addiction 2007 Feb;102(2):264-270.
(12) McCarthy JJ, Leamon MH, Parr MS, Anania B. High-dose methadone maintenance in pregnancy: maternal and neonatal outcomes. Am J Obstet Gynecol 2005 Sep;193(3 Pt 1):606-610.
(13) Finnegan L, Kandall S. Maternal and neonatal effects of drugs. In: Lowinson JH, Ruiz P, Millman RB, Langrod JG, editors. Substance abuse: a comprehensive textbook Baltimore, MD: Baltimore, MD:Williams and Wilkins.; 1997.

230
(14) Hulse GK, Milne E, English DR, Holman CD. The relationship between maternal use of heroin and methadone and infant birth weight. Addiction 1997 Nov;92(11):1571-1579.
(15) Kiernan J. Methadone more legal than heroin. Sunday Independent (Ireland) 2008 Jan.
(16) Ostrea EM,Jr, Knapp DK, Tannenbaum L, et al. Estimates of illicit drug use during pregnancy by maternal interview, hair analysis, and meconium analysis. J Pediatr 2001 Mar;138(3):344-348.
(17) Bar-Oz B, Klein J, Karaskov T, Koren G. Comparison of meconium and neonatal hair analysis for detection of gestational exposure to drugs of abuse. Arch Dis Child Fetal Neonatal Ed 2003 Mar;88(2):F98-F100.
(18) Koren G, Hutson J, Gareri J. Novel methods for the detection of drug and alcohol exposure during pregnancy: implications for maternal and child health. Clin Pharmacol Ther 2008 Apr;83(4):631-634.
(19) Gareri J, Lynn H, Handley M, Rao C, Koren G. Prevalence of fetal ethanol exposure in a regional population-based sample by meconium analysis of fatty acid ethyl esters. Ther Drug Monit 2008 Apr;30(2):239-245.
(20) Hutson JR, Aleksa K, Pragst F, Koren G. Detection and quantification of fatty acid ethyl esters in meconium by headspace-solid-phase microextraction and gas chromatography-mass spectrometry. J Chromatogr B Analyt Technol Biomed Life Sci 2009 Jan 1;877(1-2):8-12.
(21) Dashe JS, Sheffield JS, Olscher DA, Todd SJ, Jackson GL, Wendel GD. Relationship between maternal methadone dosage and neonatal withdrawal. Obstet Gynecol 2002 Dec;100(6):1244-1249.
(22) Berghella V, Lim PJ, Hill MK, Cherpes J, Chennat J, Kaltenbach K. Maternal methadone dose and neonatal withdrawal. Am J Obstet Gynecol 2003 Aug;189(2):312-317.
(23) Choo RE, Huestis MA, Schroeder JR, Shin AS, Jones HE. Neonatal abstinence syndrome in methadone-exposed infants is altered by level of prenatal tobacco exposure. Drug Alcohol Depend 2004 Sep 6;75(3):253-260.
(24) Rosen TS, Pippenger CE. Pharmacologic observations on the neonatal withdrawal syndrome. J Pediatr 1976 Jun;88(6):1044-1048.
(25) Philipp BL, Merewood A, O'Brien S. Methadone and breastfeeding: new horizons. Pediatrics 2003 Jun;111(6 Pt 1):1429-1430.
(26) Abdel-Latif ME, Pinner J, Clews S, Cooke F, Lui K, Oei J. Effects of breast milk on the severity and outcome of neonatal abstinence syndrome among infants of drug-dependent mothers. Pediatrics 2006 Jun;117(6):e1163-9.
(27) Gray L, Miller LW, Philipp BL, Blass EM. Breastfeeding is analgesic in healthy newborns. Pediatrics 2002 Apr;109(4):590-593.
231
(28) Lipsitz PJ. A proposed narcotic withdrawal score for use with newborn infants. A pragmatic evaluation of its efficacy. Clin Pediatr (Phila) 1975 Jun;14(6):592-594.
(29) Finnegan LP, Connaughton JF,Jr, Kron RE, Emich JP. Neonatal abstinence syndrome: assessment and management. Addict Dis 1975;2(1-2):141-158.
(30) Osborn DA, Jeffery HE, Cole M. Opiate treatment for opiate withdrawal in newborn infants. Cochrane Database Syst Rev 2005 Jul 20;(3)(3):CD002059.
(31) Osborn DA, Jeffery HE, Cole MJ. Sedatives for opiate withdrawal in newborn infants. Cochrane Database Syst Rev 2005 Jul 20;(3)(3):CD002053.
(32) Jackson L, Ting A, McKay S, Galea P, Skeoch C. A randomised controlled trial of morphine versus phenobarbitone for neonatal abstinence syndrome. Arch Dis Child Fetal Neonatal Ed 2004 Jul;89(4):F300-4.
(33) Coyle MG, Ferguson A, Lagasse L, Oh W, Lester B. Diluted tincture of opium (DTO) and phenobarbital versus DTO alone for neonatal opiate withdrawal in term infants. J Pediatr 2002 May;140(5):561-564.
(34) Bunikowski R, Grimmer I, Heiser A, Metze B, Schafer A, Obladen M. Neurodevelopmental outcome after prenatal exposure to opiates. Eur J Pediatr 1998 Sep;157(9):724-730.
(35) de Cubas MM, Field T. Children of methadone-dependent women: developmental outcomes. Am J Orthopsychiatry 1993 Apr;63(2):266-276.
(36) Hans SL. Developmental consequences of prenatal exposure to methadone. Ann N Y Acad Sci 1989;562:195-207.
(37) Hayford SM, Epps RP, Dahl-Regis M. Behavior and development patterns in children born to heroin-addicted and methadone-addicted mothers. J Natl Med Assoc 1988 Nov;80(11):1197-1200.
(38) Hunt RW, Tzioumi D, Collins E, Jeffery HE. Adverse neurodevelopmental outcome of infants exposed to opiate in-utero. Early Hum Dev 2008 Jan;84(1):29-35.
(39) Johnson HL, Glassman MB, Fiks KB, Rosen TS. Resilient children: individual differences in developmental outcome of children born to drug abusers. J Genet Psychol 1990 Dec;151(4):523-539.
(40) Kaltenbach K, Finnegan LP. Perinatal and developmental outcome of infants exposed to methadone in-utero. Neurotoxicol Teratol 1987 Jul-Aug;9(4):311-313.
(41) Kaltenbach K, Finnegan LP. Neonatal abstinence syndrome, pharmacotherapy and developmental outcome. Neurobehav Toxicol Teratol 1986 Jul-Aug;8(4):353-355.
(42) Kaltenbach K, Finnegan LP. Developmental outcome of children born to methadone maintained women: a review of longitudinal studies. Neurobehav Toxicol Teratol 1984 Jul-Aug;6(4):271-275.

232
(43) Lifschitz MH, Wilson GS, Smith EO, Desmond MM. Factors affecting head growth and intellectual function in children of drug addicts. Pediatrics 1985 Feb;75(2):269-274.
(44) Olofsson M, Buckley W, Andersen GE, Friis-Hansen B. Investigation of 89 children born by drug-dependent mothers. II. Follow-up 1-10 years after birth. Acta Paediatr Scand 1983 May;72(3):407-410.
(45) Ornoy A, Michailevskaya V, Lukashov I, Bar-Hamburger R, Harel S. The developmental outcome of children born to heroin-dependent mothers, raised at home or adopted. Child Abuse Negl 1996 May;20(5):385-396.
(46) Ornoy A, Segal J, Bar-Hamburger R, Greenbaum C. Developmental outcome of school-age children born to mothers with heroin dependency: importance of environmental factors. Dev Med Child Neurol 2001 Oct;43(10):668-675.
(47) Rosen TS, Johnson HL. Children of methadone-maintained mothers: follow-up to 18 months of age. J Pediatr 1982 Aug;101(2):192-196.
(48) Topley J, Windsor D, Williams R. Behavioural, developmental and child protection outcomes following exposure to Class A drugs in pregnancy. Child Care Health Dev 2008 Jan;34(1):71-76.
(49) van Baar AL, Soepatmi S, Gunning WB, Akkerhuis GW. Development after prenatal exposure to cocaine, heroin and methadone. Acta Paediatr Suppl 1994 Nov;404:40-46.
(50) Wilson GS, McCreary R, Kean J, Baxter JC. The development of preschool children of heroin-addicted mothers: a controlled study. Pediatrics 1979 Jan;63(1):135-141.
(51) Geromanos K, Sunkle SN, Mauer MB, et al. Successful techniques for retaining a cohort of infants and children born to HIV-infected women: the prospective P2C2 HIV study. J Assoc Nurses AIDS Care 2004 Jul-Aug;15(4):48-57.
(52) Tandon A, Mulvihill A. Ocular teratogens: old acquaintances and new dangers. Eye (Lond) 2009 Jun;23(6):1269-1274.
(53) Dominguez R, Aguirre Vila-Coro A, Slopis JM, Bohan TP. Brain and ocular abnormalities in infants with in utero exposure to cocaine and other street drugs. Am J Dis Child 1991 Jun;145(6):688-695.
(54) Good WV, Ferriero DM, Golabi M, Kobori JA. Abnormalities of the visual system in infants exposed to cocaine. Ophthalmology 1992 Mar;99(3):341-346.
(55) Block SS, Moore BD, Scharre JE. Visual anomalies in young children exposed to cocaine. Optom Vis Sci 1997 Jan;74(1):28-36.
(56) Bruce BB, Biousse V, Dean AL, Newman NJ. Neurologic and ophthalmic manifestations of fetal alcohol syndrome. Rev Neurol Dis 2009 Winter;6(1):13-20.
(57) Chan T, Bowell R, O'Keefe M, Lanigan B. Ocular manifestations in fetal alcohol syndrome. Br J Ophthalmol 1991 Sep;75(9):524-526.

233
(58) Ribeiro IM, Vale PJ, Tenedorio PA, Rodrigues PA, Bilhoto MA, Pereira HC. Ocular manifestations in fetal alcohol syndrome. Eur J Ophthalmol 2007 Jan-Feb;17(1):104-109.
(59) Stromland K, Pinazo-Duran MD. Ophthalmic involvement in the fetal alcohol syndrome: clinical and animal model studies. Alcohol Alcohol 2002 Jan-Feb;37(1):2-8.
(60) Stromland K, Pinazo-Duran MD. Optic nerve hypoplasia: comparative effects in children and rats exposed to alcohol during pregnancy. Teratology 1994 Aug;50(2):100-111.
(61) Gill A, Oei J, Lewis N, Younan N, Kennedy I, Lui K. Strabismus in infants of opiate-dependent mothers. Acta Paediatrica 2003;92(3):379-385.
(62) Nelson L, Ehrlich S, Calhoun J, Matteucci T, Finnegan L. Occurrence of strabismus in infants born to drug-dependent women. Archives of Pediatrics and Adolescent Medicine 1987;141(2):175-178.
(63) Gaillard MC, Borruat FX. New finding: transitory horizontal pendular nystagmus secondary to neonatal abstinence syndrome. Klin Monatsbl Augenheilkd 2002 Apr;219(4):317-319.
(64) Mulvihill AO, Cackett PD, George ND, Fleck BW. Nystagmus secondary to drug exposure in utero. Br J Ophthalmol 2007 May;91(5):613-615.
(65) Gupta M, Mulvihill AO, Lascaratos G, Fleck BW, George ND. Nystagmus and Reduced Visual Acuity Secondary to Drug Exposure in Utero: Long-Term Follow-up. J Pediatr Ophthalmol Strabismus 2011 Mar 15:1-6.
(66) Mohn G, van Hof-van Duin J, Fetter WP, de Groot L, Hage M. Acuity assessment of non-verbal infants and children: clinical experience with the acuity card procedure. Dev Med Child Neurol 1988 Apr;30(2):232-244.
(67) Hoyt CS, Jastrzebski G, Marg E. Delayed visual maturation in infancy. Br J Ophthalmol 1983 Feb;67(2):127-130.
(68) Harel S, Holtzman M, Feinsod M. Delayed visual maturation. Arch Dis Child 1983 Apr;58(4):298-299.
(69) Robb RM, McKeown CA, Fricker SJ, Fulton AB. Section 12. Paediatric ophthalmology. In: Robb RM, Walton DS, editors. Principles and Practice of Ophthalmology USA: W.B. Saunders Company; 1994. p. 2715-2845.
(70) Koklanis K, Abel LA, Aroni R. Psychosocial impact of amblyopia and its treatment: a multidisciplinary study. Clin Experiment Ophthalmol 2006 Nov;34(8):743-750.
(71) Friedman Z, Neumann E, Hyams SW, Peleg B. Ophthalmic screening of 38,000 children, age 1 to 2 1/2 years, in child welfare clinics. J Pediatr Ophthalmol Strabismus 1980 Jul-Aug;17(4):261-267.

234
(72) Dutton GN. 'Dorsal stream dysfunction' and 'dorsal stream dysfunction plus': a potential classification for perceptual visual impairment in the context of cerebral visual impairment? Dev Med Child Neurol 2009 Mar;51(3):170-172.
(73) Dutton GN, Jacobson LK. Cerebral visual impairment in children. Semin Neonatol 2001 Dec;6(6):477-485.
(74) Dutton GN, Saaed A, Fahad B, et al. Association of binocular lower visual field impairment, impaired simultaneous perception, disordered visually guided motion and inaccurate saccades in children with cerebral visual dysfunction-a retrospective observational study. Eye 2004 Jan;18(1):27-34.
(75) Odom JV, Bach M, Barber C, et al. Visual evoked potentials standard (2004). Doc Ophthalmol 2004 Mar;108(2):115-123.
(76) Taylor MJ, McCulloch DL. Visual evoked potentials in infants and children. J Clin Neurophysiol 1992 Jul;9(3):357-372.
(77) Kato T, Watanabe K. Visual evoked potential in the newborn: does it have predictive value? Semin Fetal Neonatal Med 2006 Dec;11(6):459-463.
(78) Shepherd AJ, Saunders KJ, McCulloch DL, Dutton GN. Prognostic value of flash visual evoked potentials in preterm infants. Dev Med Child Neurol 1999 Jan;41(1):9-15.
(79) Whyte HE, Taylor MJ, Menzies R, Chin KC, MacMillan LJ. Prognostic utility of visual evoked potentials in term asphyxiated neonates. Pediatr Neurol 1986 Jul-Aug;2(4):220-223.
(80) McCulloch DL, Taylor MJ, Whyte HE. Visual evoked potentials and visual prognosis following perinatal asphyxia. Arch Ophthalmol 1991 Feb;109(2):229-233.
(81) Taylor MJ, McCulloch DL. Prognostic value of VEPs in young children with acute onset of cortical blindness. Pediatr Neurol 1991 Mar-Apr;7(2):111-115.
(82) Benavente I, Tamargo P, Tajada N, Yuste V, Olivan MJ. Flash visually evoked potentials in the newborn and their maturation during the first six months of life. Doc Ophthalmol 2005 Mar-May;110(2-3):255-263.
(83) Kraemer M, Abrahamsson M, Sjostrom A. The neonatal development of the light flash visual evoked potential. Doc Ophthalmol 1999;99(1):21-39.
(84) Bach M, Meigen T. Do's and don'ts in Fourier analysis of steady-state potentials. Doc Ophthalmol 1999;99(1):69-82.
(85) Meigen T, Bach M. On the statistical significance of electrophysiological steady-state responses. Doc Ophthalmol 1999;98(3):207-232.
(86) Apkarian P. Temporal frequency responsivity shows multiple maturational phases: state-dependent visual evoked potential luminance flicker fusion from birth to 9 months. Vis Neurosci 1993 Nov-Dec;10(6):1007-1018.
235
(87) Ellingson RJ. Development of visual evoked potentials and photic driving responses in normal full term, low risk premature, and Trisomy-21 infants during the first year of life. Electroencephalogr Clin Neurophysiol 1986 Apr;63(4):309-316.
(88) Pieh C, McCulloch DL, Shahani U, Mactier H, Bach M. Maturation of steady-state flicker VEPs in infants: fundamental and harmonic temporal response frequencies. Doc Ophthalmol 2009 Apr;118(2):109-119.
(89) Harding GF, Grose J, Wilton A, Bissenden JG. The pattern reversal VEP in short-gestation infants. Electroencephalogr Clin Neurophysiol 1989 Jan-Feb;74(1):76-80.
(90) Crognale MA, Kelly JP, Chang S, Weiss AH, Teller DY. Development of pattern visual evoked potentials: longitudinal measurements in human infants. Optom Vis Sci 1997 Oct;74(10):808-815.
(91) Malcolm CA, McCulloch DL, Shepherd AJ. Pattern-reversal visual evoked potentials in infants: gender differences during early visual maturation. Dev Med Child Neurol 2002 May;44(5):345-351.
(92) McCulloch DL, Skarf B. Development of the human visual system: monocular and binocular pattern VEP latency. Invest Ophthalmol Vis Sci 1991 Jul;32(8):2372-2381.
(93) Pike AA, Marlow N, Reber C. Maturation of the flash visual evoked potential in preterm infants. Early Hum Dev 1999 Apr;54(3):215-222.
(94) Beverley DW, Smith IS, Beesley P, Jones J, Rhodes N. Relationship of cranial ultrasonography, visual and auditory evoked responses with neurodevelopmental outcome. Dev Med Child Neurol 1990 Mar;32(3):210-222.
(95) Ekert PG, Keenan NK, Whyte HE, Boulton J, Taylor MJ. Visual evoked potentials for prediction of neurodevelopmental outcome in preterm infants. Biol Neonate 1997;71(3):148-155.
(96) Kato T, Okumura A, Hayakawa F, Kuno K, Watanabe K. The evolutionary change of flash visual evoked potentials in preterm infants with periventricular leukomalacia. Clin Neurophysiol 2005 Mar;116(3):690-695.
(97) Pike AA, Marlow N. The role of cortical evoked responses in predicting neuromotor outcome in very preterm infants. Early Hum Dev 2000 Feb;57(2):123-135.
(98) Whyte HE. Visual-evoked potentials in neonates following asphyxia. Clin Perinatol 1993 Jun;20(2):451-461.
(99) Muttitt SC, Taylor MJ, Kobayashi JS, MacMillan L, Whyte HE. Serial visual evoked potentials and outcome in term birth asphyxia. Pediatr Neurol 1991 Mar-Apr;7(2):86-90.

236
(100) Taylor MJ, Murphy WJ, Whyte HE. Prognostic reliability of somatosensory and visual evoked potentials of asphyxiated term infants. Dev Med Child Neurol 1992 Jun;34(6):507-515.
(101) Atkinson J, Anker S, Rae S, Weeks F, Braddick O, Rennie J. Cortical visual evoked potentials in very low birthweight premature infants. Arch Dis Child Fetal Neonatal Ed 2002 Jan;86(1):F28-31.
(102) Atkinson J, Braddick O, Anker S, et al. Cortical vision, MRI and developmental outcome in preterm infants. Arch Dis Child Fetal Neonatal Ed 2008 Jul;93(4):F292-7.
(103) Mercuri E, Haataja L, Guzzetta A, et al. Visual function in term infants with hypoxic-ischaemic insults: correlation with neurodevelopment at 2 years of age. Arch Dis Child Fetal Neonatal Ed 1999 Mar;80(2):F99-104.
(104) Mackie RT, McCulloch DL. Assessment of visual acuity in multiply handicapped children. Br J Ophthalmol 1995 Mar;79(3):290-296.
(105) Kraemer M, Sjostrom A. Lack of short-latency-potentials in the VEP reflects immature extra geniculate visual function in delayed visual maturation (DVM). Doc Ophthalmol 1998 -1999;97(2):189-201.
(106) Saunders KJ, Brown G, McCulloch DL. Pattern-onset visual evoked potentials: more useful than reversal for patients with nystagmus. Doc Ophthalmol 1997 -1998;94(3):265-274.
(107) Creel D, Spekreijse H, Reits D. Evoked potentials in albinos: efficacy of pattern stimuli in detecting misrouted optic fibers. Electroencephalogr Clin Neurophysiol 1981 Dec;52(6):595-603.
(108) Zubcov AA, Fendick MG, Gottlob I, Wizov SS, Reinecke RD. Visual-evoked cortical potentials in dissociated vertical deviation. Am J Ophthalmol 1991 Dec 15;112(6):714-722.
(109) Mercuri E, von Siebenthal K, Tutuncuoglu S, Guzzetta F, Casaer P. The effect of behavioural states on visual evoked responses in preterm and full-term newborns. Neuropediatrics 1995 Aug;26(4):211-213.
(110) Whyte HE, Pearce JM, Taylor MJ. Changes in the VEP in preterm neonates with arousal states, as assessed by EEG monitoring. Electroencephalogr Clin Neurophysiol 1987 May;68(3):223-225.
(111) Apkarian P, Mirmiran M, Tijssen R. Effects of behavioural state on visual processing in neonates. Neuropediatrics 1991 May;22(2):85-91.
(112) Prechtl HF. The behavioural states of the newborn infant (a review). Brain Res 1974 Aug 16;76(2):185-212.
(113) Stanley OH, Fleming PJ, Morgan MH. Development of visual evoked potentials following intrauterine growth retardation. Early Hum Dev 1991 Nov;27(1-2):79-91.
237
(114) Gregori B, Pro S, Bombelli F, La Riccia M, Accornero N. Vep latency: sex and head size. Clin Neurophysiol 2006 May;117(5):1154-1157.
(115) Bauer LO. Effects of chronic opioid dependence and HIV-1 infection on pattern shift visual evoked potentials. Drug Alcohol Depend 1998 Apr 1;50(2):147-155.
(116) Bauer LO, Easton C. Pattern shift visual evoked potentials in abstinent cocaine-dependent, alcohol-dependent, and cross-dependent patients. Drug Alcohol Depend 1996 Mar;40(3):203-209.
(117) Kremlacek J, Hosak L, Kuba M, Libiger J, Cizek J. Visual information processing in recently abstaining methamphetamine-dependent individuals: evoked potentials study. Doc Ophthalmol 2008 Nov;117(3):245-255.
(118) Meinck HM, Adler L, Rader K, Conrad B. Delayed visual evoked potentials in chronic alcoholism. J Neurol 1986 Jun;233(3):161-163.
(119) Pinto F, Onofrj M, Pola P, Tempesta E, Torrioli MG. Fetal addiction to methadone: postnatal abstinence syndrome and development of visual evoked potentials. Drug Alcohol Depend 1986 Sep;18(1):1-10.
(120) Posthuma J, Visser SL, de Rijke W. Peripheral nerve conduction, visual evoked potentials and vitamin B1 serum level in chronic alcoholics. Clin Neurol Neurosurg 1983;85(4):267-272.
(121) Whitham JN, Spurrier NJ, Sawyer MG, et al. The effects of prenatal exposure to buprenorphine or methadone on infant visual evoked potentials. Neurotoxicol Teratol 2010 Mar-Apr;32(2):280-288.
(122) McGlone L, Mactier H, Hamilton R, et al. Visual evoked potentials in infants exposed to methadone in utero. Arch Dis Child 2008 Sep;93(9):784-786.
(123) McLoone P. Carstairs scores for Scottish postcode sectors from the 2001 census. 2004 (Access online at http://www.sphsu.mrc.ac.uk/publications/carstairs-scores.html).
(124) Mackay AM, Bradnam MS, Hamilton R, Elliot AT, Dutton GN. Real-time rapid acuity assessment using VEPs: development and validation of the step VEP technique. Invest Ophthalmol Vis Sci 2008 Jan;49(1):438-441.
(125) Hamilton R, McGlone L, MacKinnon JR, Russell HC, Bradnam MS, Mactier H. Ophthalmic, clinical and visual electrophysiological findings in children born to mothers prescribed substitute methadone in pregnancy. Br J Ophthalmol 2010 Jun;94(6):696-700.
(126) Dryden C, Young D, Hepburn M, Mactier H. Maternal methadone use in pregnancy: factors associated with the development of neonatal abstinence syndrome and implications for healthcare resources. BJOG 2009 Apr;116(5):665-671.

238
(127) Atkinson J, Anker S, Rae S, Hughes C, Braddick O. A test battery of child development for examining functional vision (ABCDEFV). Strabismus 2002 Dec;10(4):245-269.
(128) Williamson S, Jackson L, Skeoch C, Azzim G, Anderson R. Determination of the prevalence of drug misuse by meconium analysis. Arch Dis Child Fetal Neonatal Ed 2006 Jul;91(4):F291-2.
(129) UK Guidelines 2007. Department of Health (England), The Scottish Government, Welsh Assembly Government, Northern Ireland Executive, Drug misuse and dependence: UK Guideline on Clinical Management. 2007; Available at: www.smmgp.org.uk.
(130) Shipton D, Tappin DM, Vadiveloo T, Crossley JA, Aitken DA, Chalmers J. Reliability of self reported smoking status by pregnant women for estimating smoking prevalence: a retrospective, cross sectional study. BMJ 2009 Oct 29;339:b4347.
(131) Shipton D, Mactier H, Dryden C, Tappin D. Substitute methadone prescribing in pregnancy is associated with impaired fetal head growth. Arch Dis Child Fetal Neonatal Ed 2011;96:Fa45.
(132) O'Grady MJ, Hopewell J, White MJ. Management of neonatal abstinence syndrome: a national survey and review of practice. Arch Dis Child Fetal Neonatal Ed 2009 Jul;94(4):F249-52.
(133) Pertschuk LP, Ford DH, Rainford EA. Localization of methadone in fetal rat eye by the immunofluorescence technic. Exp Eye Res 1977 Jun;24(6):547-552.
(134) Davis CM, Fenimore DC, Meyer CJ, Schoolar JC. Methadone accumulation in ocular tissue. Life Sci 1979 Jan 29;24(5):449-455.
(135) Pertschuk LP, Sher JH. Demonstration of methadone in the human brain by immunofluorescence. Res Commun Chem Pathol Pharmacol 1975 Jun;11(2):319-322.
(136) Pertschuk LP, Sher JH, Ford DH. A morphological comparison of the regional distribution of methadone in human and rat brain as demonstrated by immunofluorescence. Drug Alcohol Depend 1976 Apr;1(4):247-254.
(137) Guo HZ, Enters EK, McDowell KP, Robinson SE. The effect of prenatal exposure to methadone on neurotransmitters in neonatal rats. Brain Res Dev Brain Res 1990 Dec 15;57(2):296-298.
(138) Robinson SE, Mo Q, Maher JR, Wallace MJ, Kunko PM. Perinatal exposure to methadone affects central cholinergic activity in the weanling rat. Drug Alcohol Depend 1996 Jun;41(2):119-126.
(139) Robinson SE, Guo H, Spencer RF. Prenatal exposure to methadone delays the development of striatal cholinergic neurons. Brain Res Dev Brain Res 1993 Dec 17;76(2):239-248.

239
(140) Wu VW, Mo Q, Yabe T, Schwartz JP, Robinson SE. Perinatal opioids reduce striatal nerve growth factor content in rat striatum. Eur J Pharmacol 2001 Mar 2;414(2-3):211-214.
(141) Darmani NA, Schnoll SH, Pandey U, Martin BR. Chronic prenatal methadone exposure alters central opioid mu-receptor affinity in both fetal and maternal brain. Neurotoxicol Teratol 1992 Jul-Aug;14(4):265-271.
(142) Tsang D, Ng SC. Effect of antenatal exposure to opiates on the development of opiate receptors in rat brain. Brain Res 1980 Apr 21;188(1):199-206.
(143) Hammer RP,Jr, Ricalde AA, Seatriz JV. Effects of opiates on brain development. Neurotoxicology 1989 Fall;10(3):475-483.
(144) Sarvananthan N, Surendran M, Roberts EO, et al. The prevalence of nystagmus: the Leicestershire nystagmus survey. Invest Ophthalmol Vis Sci 2009 Nov;50(11):5201-5206.
(145) Harris C, Berry D. A developmental model of infantile nystagmus. Semin Ophthalmol 2006 Apr-Jun;21(2):63-69.
(146) Rottach KG, Wohlgemuth WA, Dzaja AE, Eggert T, Straube A. Effects of intravenous opioids on eye movements in humans: possible mechanisms. J Neurol 2002 Sep;249(9):1200-1205.
(147) Mustari MJ, Ono S, Vitorello KC. How disturbed visual processing early in life leads to disorders of gaze-holding and smooth pursuit. Prog Brain Res 2008;171:487-495.
(148) Hubel DH, Wiesel TN. Binocular interaction in striate cortex of kittens reared with artificial squint. J Neurophysiol 1965 Nov;28(6):1041-1059.
(149) Van Sluyters RC, Levitt FB. Experimental strabismus in the kitten. J Neurophysiol 1980 Mar;43(3):686-699.
(150) Farid WO, Dunlop SA, Tait RJ, Hulse GK. The effects of maternally administered methadone, buprenorphine and naltrexone on offspring: review of human and animal data. Curr Neuropharmacol 2008 Jun;6(2):125-150.
(151) Fischer G, Ortner R, Rohrmeister K, et al. Methadone versus buprenorphine in pregnant addicts: a double-blind, double-dummy comparison study. Addiction 2006 Feb;101(2):275-281.