5 year reportfinal - ccber
TRANSCRIPT

5 Year Performance Criteria Monitoring Report for Restored Wetlands at Manzanita Village
University of California, Santa Barbara, Cheadle Center for Biodiversity and Ecological Restoration 1
EXECUTIVE SUMMARY
Following the restoration of adjacent slopes and completion of the lower bioswale system in August 2001, the Manzanita Village Restoration Project began in August of 2002 as mitigation for the 188,000 sq. ft student housing complex that impacted the vernal wetland habitat on the site and removed significant portions of Coulter’s saltbush, southern tarplant and long-leaf plantain populations – all special status species. (See Figure 1 for site location.) Non-native annual grasses and other ruderal species interspersed with coyote brush dominated the site with low lying depressions supporting native wetland species during the rainy season. The implementation phase of the project took five years and employed over five full time staff as well as numerous student interns and volunteers. Six acres of coastal mesa were successfully restored including 0.86 acres of enlarged and re-created wetlands, coastal sage scrub and coastal prairie. Additional funding from the Department of Housing and Residential Services allowed for the restoration of an additional four acres of oak woodland. Appendix A shows a complete list of all CCBER staff involved in the Manzanita Village Ecological Restoration Project.
According to the 1999 Notice of Impending Development, the California Coastal Commission (CCC) required 3:1 replacement of any specimens of southern tarplant (Centromadia parryi ssp. australis), long-leaf plantain (Plantago elongata), Coulter’s saltbush (Atriplex coulterii) or any other sensitive plant species removed in conjunction with the proposed development and for the enhancement of approximately 0.80 acres of wetland areas. The program also required restoration of buffer areas and installation of informational and educational signs.
The Housing and Residential Services Department at the University of California, Santa Barbara (UCSB) employed Padre Associates, Inc. to prepare the Habitat Restoration, Wetland Enhancement and Monitoring Program and the Cheadle Center for Biodiversity and Ecological Restoration (CCBER) to implement the program.
Southern tarplant, long-leaf plantain and Coulter’s saltbush continue to thrive at the site, with southern tarplant prevalent in all of the upland areas around the vernal pools and marshes.
The 0.86 acres of enlarged and re-created existing wetlands at Manzanita Village are comprised of five vernal pools, four vernal marshes and associated meadow and drainage swales. Vegetation monitoring was conducted twice a year and data on percent native cover and species richness were collected. Hydrology data (depth and duration of inundation) were collected on a weekly basis from the time the pools and marshes were saturated until they dried out, typically in June. In comparison with local reference vernal pools, data collected in the implementation phase of the project indicates that the created vernal pools have a significantly higher percentage native cover and species richness and retain water for slightly longer time periods. Figure 2 shows the locations and names of the vernal pools, marshes, meadows, bioswales and demonstration garden at Manzanita Village.

5 Year Performance Criteria Monitoring Report for Restored Wetlands at Manzanita Village
University of California, Santa Barbara, Cheadle Center for Biodiversity and Ecological Restoration 2
Buffer areas were successfully created in the surrounding upland areas around the vernal pools and marshes. Larger shrubs were planted next to the trail system and once established acted as a green fence. The green fence provides a visual and physical barrier, preventing any disruption in the natural areas. Over 80,000 native plants and 100 different species were planted throughout the site.
A small demonstration garden was installed to the northeast of Manzanita Lake, which serves as an outdoor classroom for all who visit the site. Six permanent informational signs were installed with a description of the various plant communities that can be viewed throughout the site. See Table 1 for a list of additional permanent signs that are scheduled to be installed in 2009. Temporary signs are installed throughout the site with information on the various plant communities, bioswales, vernal pools and marshes, and weeding techniques in use such as green flame weeding, until additional permanent signs are installed.
A system of bioswales (1300 linear feet) was designed to convey and filter rooftop stormwater and any surface water runoff from manicured and irrigated green areas close to the dorms. Water quality was tested on a regular basis to determine what pollutants entered the system and were filtered out of the water before it reached the lagoon and ultimately the Pacific Ocean. Results from several small experiments indicated that the swales did improve the quality of retained water over a three-day period by reducing nutrient levels.
The project received the Goleta Valley Beautiful annual award for 2005-2006 for contributions to the beauty of Goleta Valley, special recognition from the Regional Water Quality Control Board and the American Society of Landscape Architects 2008 Professional Award. (See Appendix F)
The Manzanita Village Ecological Restoration Project successfully enlarged and re-created existing wetlands and significantly increased the species diversity and functional value of the site, which now offers increased habitat value for birds, animals, reptiles and amphibians due to the larger wetlands and surrounding upland areas. The educational value has also increased and the wetlands are now used as an outdoor classroom for numerous UCSB courses as well as providing study sites for graduate students and children from local schools. The aesthetic value of the re-created and enlarged wetlands has also increased and an area that was once brown for the majority of the year is now infused with color and life.

5 Year Performance Criteria Monitoring Report for Restored Wetlands at Manzanita Village
University of California, Santa Barbara, Cheadle Center for Biodiversity and Ecological Restoration 3
Figure 1. Manzanita Village site location
UCSB Campus
Campus Lagoon
ManzanitaVillage

5 Year Performance Criteria Monitoring Report for Restored Wetlands at Manzanita Village
University of California, Santa Barbara, Cheadle Center for Biodiversity and Ecological Restoration 4
Figure 2. Location of wetlands, bioswales, and demonstration garden
San MiguelVernal Pool
Santa RosaVernal Pool Santa Cruz
Vernal PoolAnacapa
Vernal Marsh SantaBarbara
Vernal Pool
SantaCatalina
Vernal Pool
ChumashVernal Marsh
Manzanita Lake Vernal Marsh
South Drain Vernal Meadow
Bluff Vernal Meadow
DemonstrationGarden
Main Biosw
ale
Rattlesn
ake Biosw
ale
San Jo
se Bio
swale
Sycamo
re Bio
swale
Cold Springs Bioswale
N
5 Year Performance Criteria Monitoring Report for Restored Wetlands at Manzanita Village
University of California, Santa Barbara, Cheadle Center for Biodiversity and Ecological Restoration 5
Table of Contents 1 Introduction.............................................................................................................6
1.1 Site Conditions ................................................................................................6 1.2 Project Partners................................................................................................7
2 Project Description ..................................................................................................7 2.1 Program Specifications ....................................................................................8
3 Process, Materials and Methods...............................................................................9 3.1 Grading and Construction ................................................................................9 3.2 Erosion Control ...............................................................................................9 3.3 Planting Plan....................................................................................................9
3.3.1 Vernal Pools .............................................................................................. 10 3.3.2 Vernal Marshes and Vernal Meadows ........................................................ 10
3.4 Maintenance .................................................................................................. 10 4 Monitoring Methods .............................................................................................. 11
4.1 Vegetation ..................................................................................................... 11 4.1.1 Vegetation Cover ....................................................................................... 11 4.1.2 Plant Species Richness............................................................................... 11
4.2 Hydrology ..................................................................................................... 12 4.3 Photo Documentation..................................................................................... 12
5 Monitoring Results and Discussion........................................................................ 12 5.1 Vernal Pools .................................................................................................. 12
5.1.1 Vernal Pool Percent Native Vegetation Cover............................................ 12 5.1.2 Vernal Pool Native Plant Species Richness ................................................ 14 5.1.3 Vernal Pool Hydrology .............................................................................. 15 5.1.4 Photo Documentation................................................................................. 16
5.2 Vernal Marsh................................................................................................. 16 5.2.1 Vernal Marsh Percent Native Vegetation Cover ......................................... 16 5.2.2 Vernal Marsh Native Plant Species Richness ............................................. 17 5.2.3 Vernal Marsh Hydrology ........................................................................... 18 5.2.4 Photo Documentation................................................................................. 20
5.3 Vernal Meadow ............................................................................................. 20 5.3.1 Vernal Meadow Percent Native Vegetation Cover...................................... 20 5.3.2 Vernal Meadow Native Plant Species Richness.......................................... 21 5.3.3 Vernal Meadow Hydrology........................................................................ 21 5.3.4 Photo Documentation................................................................................. 22
6 Overall Results ...................................................................................................... 22 7 Current Project Activities and Ancillary Benefits................................................... 23 8 Tables.................................................................................................................... 24 9 Figures .................................................................................................................. 46 10 Appendix A: Project Staff...................................................................................... 58 11 Appendix B: Photo Documentation........................................................................ 59 12 Appendix C: Planting Palettes ............................................................................... 68 13 Appendix D: Informational and Educational Signage............................................. 71 14 Appendix E: Grading Plans.................................................................................... 73 15 Appendix F: Awards.............................................................................................. 74 16 Literature And References Cited............................................................................ 76

5 Year Performance Criteria Monitoring Report for Restored Wetlands at Manzanita Village
University of California, Santa Barbara, Cheadle Center for Biodiversity and Ecological Restoration 6
1 INTRODUCTION
1.1 Site Conditions
The Manzanita Village (San Rafael Student Housing) Ecological Restoration Project occupies a ten-acre portion of an uplifted coastal mesa on the University of California, Santa Barbara (UC Santa Barbara) campus in southern Santa Barbara County, California. The project site is characterized by a typically Mediterranean regional climate influenced by maritime winds and summer fog moisture inputs, consistently mild air temperatures with little seasonal range, and variable rainfall mostly occurring during November-April. Annual precipitation at a weather station in Santa Barbara averaged 17.7 inches for the period 1867 to 1979 (Ferren and Thomas 1995). Annual precipitation between 2002 and 2007 was 17.03 inches, although individual years ranged from 13.74 inches in 2005 to 26.69 inches in 2004 (see Figure 3 below). Average temperature for the duration of the project was 68.5 degrees Fahrenheit. Rainfall and temperature data courtesy of Santa Barbara Airport.
Figure 3. Monthly rainfall data from Santa Barbara Airport over the five year period of the Manzanita Village Ecological Restoration Project
In the 1930’s during the military era, a majority of topsoil was removed from the area, leaving a denuded landscape that was quickly dominated by non-native annual grasses and other ruderal (weedy) vegetation, interspersed with coyote brush (Baccharis pilularis) that could survive on the poor soils. During the rainy winter months, low-lying depressions in the landscape supported several native obligate wetland plant species, including least spikerush (Eleocharis acicularis), and common spikerush (Eleocharis macrostachya), several facultative wetland plant species, including, meadow barley (Hordeum brachyantherum ssp. brachyantherum), saltgrass (Distichlis spicata) and brown-headed rush (Juncus phaeocephalus) (Reed 1988). Sensitive species, southern Tarplant (Centromadia parryi ssp. Australis), long-leaf plantain (Plantago elongata) and Coulter’s saltbush (Atriplex Coulterii) were also present on the site.

5 Year Performance Criteria Monitoring Report for Restored Wetlands at Manzanita Village
University of California, Santa Barbara, Cheadle Center for Biodiversity and Ecological Restoration 7
1.2 Project Partners
The Manzanita Village Ecological Restoration Project was a collaborative design effort that included landscape architects and civil engineers, environmental consultants, planners, and biologists. Padre Associates, Inc. (Ventura, CA) developed the Habitat Restoration, Wetland Enhancement and Monitoring Program for the project. DesignARC architecture firm (Santa Barbara, CA) designed the construction and grading plans, and Van Atta Associates Landscape Architecture Planning (Santa Barbara, CA) developed the landscape concept plan. The staff from the Cheadle Center for Biodiversity and Ecological Restoration (CCBER), formerly the Museum of Systematics and Ecology implemented the program and assisted with the design process by developing planting palettes, plant inventories, temporary signage and the project timeline.
2 PROJECT DESCRIPTION
The Manzanita Village Restoration Project came about as a result of the construction of the San Rafael student housing addition. The 188,000 sq. ft. housing development is located at the south-west end of main campus. The housing addition required the removal of significant portions of three different special status plant species located on the site: Coulter’s saltbush, southern tarplant and long-leaf plantain.
Consequently, the California Coastal Commission required the university to mitigate for this loss with the re-creation and restoration of six acres of vernal wetlands with buffer areas no less than 100 ft. The site was graded to enhance the function of the wetland areas. Five vernal pools (Santa Rosa, San Miguel, Santa Cruz, Santa Barbara and Santa Catalina), four vernal marshes Anacapa East and West, Manzanita Lake and Chumash), three vernal swales (Bluff and South drain vernal meadows) with vernal meadow vegetation were re-created and restored along with the associated buffer areas.
Additional topsoil was imported to a depth of approximately 3 ft with additional native clay added to Manzanita and Chumash vernal marshes. Coconut and jute fiber cloth, rock check dams and rice straw wattle were used to control erosion. Vernal wetlands were inoculated with seed bank material from local vernal pools; buffer areas with locally native seeds and plants from the CCBER native plant nursery. Maintenance activities such as weeding and additional plantings began after the first rains in November or 2002.
A variety of monitoring techniques were used to monitor the progress and success of the project. Vegetation percent cover and species richness in the vernal pools, marshes and meadows were monitored twice a year, in spring and summer. Hydro period and wetland water depth were measured on a weekly basis once the wetlands were inundated with water and continued until the pools dried out. Photo documentation was also used to visually record wetland vegetation and hydrologic change through time.
5 Year Performance Criteria Monitoring Report for Restored Wetlands at Manzanita Village
University of California, Santa Barbara, Cheadle Center for Biodiversity and Ecological Restoration 8
2.1 Program Specifications
Prior to construction of Manzanita Village, the CCC required UCSB to prepare a Habitat Restoration, Wetland Enhancement and Monitoring Program. The program required “the 3:1 replacement of any specimens of southern tarplant, long-leaf plantain, Coulter’s saltbush or any other sensitive plant species removed in conjunction with the proposed development and for the enhancement of the approximately 0.80 acres of wetland areas identified in the Wetland and Special-Status Plant Species Impact Report by Padre Associates, Inc. dated August 1998”. The program also required the “restoration of all buffer areas with native plants compatible with the surrounding ESHA and wetland areas” (page 3, Notice of Impending Development 1-98, 1999).
Technical specifications as stated in the Notice of Impending Development 1-98, 1999 required:
• detailed documentation of existing site conditions, restoration enhancement goals and specific performance standards to judge the success of the restoration and enhancement effort
• a detailed description of process, materials and methods
• adequate buffer areas of no less than 100 ft. surrounding all ESHA and wetland areas be established
• a restoration and enhancement planting plan that provided for the removal of exotic species
• a list of all species to be planted, sources of seeds and/or plants, timing of planting, and plant locations
• an engineered grading plan if grading was necessary
• controlled public access through or around all ESHA and wetland areas located on the project site
• informational and educational signs regarding the wetland and other ESHA resources on site be installed
• a monitoring program implemented to monitor the project for compliance with the specified guideline and performance standards indicating the success or failure of the restoration project
• a final detailed report at the end of the five year period submitted for the review and approval of the Executive Director (and annual progress reports)

5 Year Performance Criteria Monitoring Report for Restored Wetlands at Manzanita Village
University of California, Santa Barbara, Cheadle Center for Biodiversity and Ecological Restoration 9
3 PROCESS, MATERIALS AND METHODS
3.1 Grading and Construction
Grading activities for the Manzanita Restoration Project began in August 2002. Site topography grading followed the grading plans provided by the DesignARC project plans (see Appendix E). The site was surveyed to locate proposed wetland perimeters. Machinery and hand tools were used to excavate and shape wetland features. Grading equipment, operated by contractors from Valley Crest Landscape Development Company (Calabasas, CA) under the supervision of CCBER staff, was used to excavate the wetlands to appropriate depths. After the wetlands were excavated, the CCBER staff used rakes and shovels to make fine grading adjustments to shape and depth. The vernal pools were graded so maximum depth did not exceed 15-18 inches. Vernal meadows did not exceed eight inches in depth and vernal marshes did not exceed 24 inches in depth.
In the Chumash and Manzanita wetland basins, native clay was added on top of exposed Sisquoc shale to decrease water percolation rates, thus supporting obligate wetland plant species better. Imported topsoil was added to the majority of the upland areas of the site since much of the topsoil was transported offsite during the military era in the 1930’s. Topsoil was added to the adjacent upland to provide the native plants with a suitable growing medium.
3.2 Erosion Control
After the grading was complete, jute fiber cloth, coconut fiber cloth, rock check dams, and rice straw wattle were used to control sedimentation and soil erosion during the first year of the project. During the first storm event in November of 2002, CCBER staff monitored potential erosion on site and rectified any erosion control failures. As the CCBER staff monitored water flow on site throughout the 2002-2003 rainy season, small drainage channels and rock check dams were constructed to better manage potentially erosion-prone areas. Prevention measures, active monitoring, and adaptive management reduced erosion on site.
3.3 Planting Plan
The vernal wetlands and adjacent uplands were planted and inoculated with locally native plants and seeds. Locally native plant species are defined for this project as species naturally occurring within a fifteen-mile radius of Goleta, CA. All native plants for the project were grown at the CCBER organic native plant nursery and greenhouse, located on the UCSB campus. Over 80,000 native plants were installed at the site.

5 Year Performance Criteria Monitoring Report for Restored Wetlands at Manzanita Village
University of California, Santa Barbara, Cheadle Center for Biodiversity and Ecological Restoration 10
3.3.1 Vernal Pools
The vernal pool basins were vegetated primarily from seed (inoculum) while the edges and adjacent upland were planted. Native vernal pool seed was collected from Del Sol and Camino Corto Vernal Pool Reserve in Isla Vista. The inoculum contained seeds and resting stages of micro invertebrates. Seeds were also collected from individual plants of four species (Eryngium vaseyii, Psilocarphus brevissimus, Plagiobothrys undulates and Phalaris lemmonii).
The bottom and sides of the pools were raked using a rock rake to loosen clay soil on the surface. Once the pools were raked, pre-weighed vernal pool seeds were spread into the pools and raked into the area to lightly cover the seeds with soil. The pool surface was moistened and compressed with a sod or lawn roller filled with water to imprint the seeds into the pool. In addition to spreading seeds, plugs of two rhizomatous plants, Eleocharis acicularis and Eleocharis machrostachya were planted into the bottom of the pools. The pools and marshes received no additional water prior to the first storm event in November 2002 of the 2002-2003 rainy season.
3.3.2 Vernal Marshes and Vernal Meadows
The vernal marshes and vernal meadows were primarily planted with nursery stock from the CCBER organic greenhouse and nursery, including rushes (Juncus spp.) and sedges (Carex sp., Isolepis sp., Bolboshoenus sp., Eleocharis spp. and Schoenoplectus spp.). Rhizomatous (spreading growth form) plants, such as bulrushes (Schoenoplectus spp.) were planted in the bottoms of the vernal marshes and caespitose (bunching growth form) species, such as yard rush (Juncus occidentalis) and common rush (Juncus patens), were planted at the edges of all of the vernal wetlands (marshes, pools and meadows). The vernal marshes and vernal meadows were also seeded with several sedge species, as well as Bolboschoenus maritimus (alkali bulrush) collected from the UCSB campus area. Edges and upland areas were also planted with native species (see Appendix C for planting palettes). Irrigation was used throughout the winter of 2002 and spring of 2003 due to lack of consistent rainfall. The planting palette used for the bioswales was based upon the palette used for the vernal meadows and marshes, with sedges and rushes chosen as the dominant cover type.
3.4 Maintenance
Maintenance activities began following the first rains. These activities included weeding, additional planting around the edges of the wetlands and erosion control. Weeding consumed the majority of the work and continued throughout the implementation phase (years 1 through 5) of the project and into the maintenance phase of the project (year 6). Bioswales are trimmed on an annual basis, which encourages a new flush of growth and limits the remobilization of nutrients at the end of the growing season. A team of five

5 Year Performance Criteria Monitoring Report for Restored Wetlands at Manzanita Village
University of California, Santa Barbara, Cheadle Center for Biodiversity and Ecological Restoration 11
full-time restoration staff as well as volunteers and interns worked on the implementation phase of the project contributing approximately 60,000 hours.
4 MONITORING METHODS
A monitoring program was designed and implemented to monitor the success of the project and to ensure compliance with guidelines based upon results from Del Sol Open Space Vernal Pool Reserve (DSOSVPR) and outlined in the Habitat Restoration, Wetland Enhancement and Monitoring Program prepared by Padre Associates, Inc. Three reference pools were selected from DSOSVPR – Del Sol (Small), Del Sol (Large) and Camino Corto. An additional pool was selected from Ellwood Mesa referred to as Ellwood vernal pool. No vernal marshes or meadows were found for comparison. Data on vegetation (percent cover and species richness) and hydrology (hydro period and water depth) were collected from the created and enlarged vernal pools and compared with data collected from the reference pools.
4.1 Vegetation
Vegetation was monitored in all of the wetlands to determine percent native cover and native species richness. The CCBER staff (Appendix A) monitored the wetlands twice a year, once in the spring and again in the summer. Data collected on an annual basis was incorporated into ongoing management practices.
4.1.1 Vegetation Cover
Vegetation cover was monitored by placing a one meter square quadrat with 100 ten by ten centimeter cells at every odd meter along a transect through each wetland. Two transects were placed across the vernal pools and vernal marshes, crossing through the center of each wetland. The transects extended five meters beyond the wetland edge into the adjacent upland, in order to capture native species located on the edges. To monitor the vernal meadows, single transects were placed perpendicularly through the wetlands at several locales. Percent cover was determined by estimating how many cells were filled with each species present. If a species occurred only once in the quadrat, it was noted as occupying 1% of the quadrat and received a cover of 1%. Using this method, we often had cover exceeding 100%. Bare ground and thatch were also recorded.
4.1.2 Plant Species Richness
Species richness in the wetlands was monitored when the vegetation cover monitoring occurred. In addition to including species found along the transects, each wetland and adjacent upland was surveyed to find additional species that may have been missed.

5 Year Performance Criteria Monitoring Report for Restored Wetlands at Manzanita Village
University of California, Santa Barbara, Cheadle Center for Biodiversity and Ecological Restoration 12
4.2 Hydrology
Hydro period and wetland water depth of the project wetlands and four nearby reference vernal pools were monitored each week during each wet season. No reference vernal meadows or vernal marshes were identified at the beginning of the project since there are no appropriate local examples. Each monitored wetland received a staff gauge (three foot metal t-post with an attached quarter-inch graduated ruler) in the center of the wetland in September 2002. The staff gauges were read weekly (to an accuracy of a quarter of an inch) after the first rain of the 2002-2003 wet season until the vernal pools became dry. The weekly monitoring continued during each rainy season from 2002 through 2007. The vernal pools had water present for between seven and eight months annually with the exception of 2006-2007 when very little rain fell. Consequently, the pools were dry by the end of March, whereas in previous years, standing water was present until May or June. After the data were assembled, standard values were graphed in Microsoft Excel. Data were analyzed to determine the flooding frequency and duration for each project wetland and reference wetland. In addition, water depth across wetlands was also examined.
4.3 Photo Documentation
Photo points were set up at Manzanita Village wetlands and several nearby reference wetlands in September 2002. The photo points were set up to correspond with vegetation transect endpoints at each wetland giving each wetland four photo points. At each photo point, one wide-angle photo and one telephoto were taken each week to visually catalog wetland vegetation and hydrologic change through time. After the first year, photos were taken on a monthly basis once the pools were inundated with water, and the photo documentation continued until there was no standing water in the pools. Compass directions were also taken for each photo point.
5 MONITORING RESULTS AND DISCUSSION
5.1 Vernal Pools
Santa Rosa, San Miguel, Santa Cruz, Santa Barbara and Santa Catalina
5.1.1 Vernal Pool Percent Native Vegetation Cover
Over the first four years of the implementation phase of the restoration project, the vernal pools met or exceeded the recommended performance criteria set by the California Coastal Commission of 20% cover after the first year and 50% in subsequent years with the exception of Santa Rosa pool in year one (13%) and Santa Catalina in year three

5 Year Performance Criteria Monitoring Report for Restored Wetlands at Manzanita Village
University of California, Santa Barbara, Cheadle Center for Biodiversity and Ecological Restoration 13
(47.2). The performance criterion of 75% in the fifth year was not met and the average percent cover was 61.08%. This shortfall in year five was most probably due to unusually low rainfall leading to poor germination and survival. The reference pools on average had considerably lower percent native cover than the created pools over the five year period of the project. Data for this section are presented in Tables 2 and 10 and Figures 4 and 11.
Year One (2002-2003)
Percent native vegetation cover for the spring survey (taken in May) averaged 4.95% and the summer survey (taken in August) averaged 21.94%. The summer survey exceeded the permit requirement of at least 20% cover after the first year of planting/seeding. Individually, every vernal pool with the exception of the Santa Rosa pool (13%) reached 20% cover. Seagulls heavily used Santa Rosa pool during the winter time. The gulls ate and ripped up some of the native plants such as Juncus occidentalis and Eleocharis macrostachya. In addition, the gulls increased the turbidity of the water, which may have reduced germination and growth of native vernal pool plant species. The average percent native cover for the reference pools was 54.05%.
Year Two (2003-2004)
Percent native vegetation cover after the second wet season averaged 48.98%, just less than the performance criteria measurement of 50%, but significantly greater than the average percent native cover of the reference pools of 28.85%. Every vernal pool individually exceeded the 50% recommendation with the exception of Santa Catalina which, over the duration of the five years, has a consistently lower percent cover than the other pools. The soil at Santa Catalina has a chalky texture and pale color, which might suggest an overabundance of calcium present in the soil, and this in turn could have a direct impact on mortality of plant species at this pool.
Year Three (2004-2005)
Percent native vegetation cover after the third wet season averaged 79.18%, significantly higher than the performance criteria measurement of 50%. Every vernal pool exceeded the 50% recommendation with the exception of Santa Catalina at 47.2%. The reference pools averaged 43.05 % native cover, once again, significantly less than the percent cover of the created pools.
Year Four (2005-2006)
Percent native vegetation cover after the fourth wet season averaged 85.46%, once again, significantly higher than the performance criteria measurement of 50%. Every vernal pool exceeded the 50% including Santa Catalina, with a percent cover of 56.4%. Percent native cover averaged 68.75% for the reference pools.
Year Five (2006-2007)
Percent native vegetation cover after the fifth season averaged 61.08%, somewhat less than the performance criteria recommendation of 75%. Only two pools (Santa Cruz and

5 Year Performance Criteria Monitoring Report for Restored Wetlands at Manzanita Village
University of California, Santa Barbara, Cheadle Center for Biodiversity and Ecological Restoration 14
Santa Rosa) exceeded the 75% recommendation. Santa Catalina once again had a significantly lower percent cover than any of the other pools. The pools received very little rainfall during the fifth wet season, and by the end of March, the pools were completely dry, which had a direct negative impact on the percent cover at each pool. The lack of rainfall had the same result at the reference pools where the percent cover was only 37.7%
5.1.2 Vernal Pool Native Plant Species Richness
All of the vernal pools collectively and individually far exceeded the California Coastal Commission species richness requirements of eight native vernal pool species after the first year and ten vernal pool species in subsequent years. Native plant species richness for the reference pools remained consistent for the five year period of the project and on average 13 native species were present in the reference pools. Combined native species present in and around the reference pools was on average 25 species. Data for this section is presented in Tables 3 and 4 and Figures 5 and 12.
Year One (2002-2003)
Combined native species richness of the vernal pools was 26 species in the spring survey and 21 species in the summer survey. All of the five pools both individually and collectively exceeded the permit requirement of eight native vernal pool species in both the spring and summer surveys.
Year Two (2003-2004)
Combined native species richness of the vernal pools was approximately 26 species in the spring survey and approximately 28 species in the summer survey. All of the five pools both individually and collectively exceeded the permit requirement of ten native vernal pool species in both the spring and summer surveys. Combined native species present in and around the reference pools were 27.
Year Three (2004-2005)
Combined native species richness of the vernal pools was 24 species in the spring survey and 24 species in the summer survey. All of the five pools both individually and collectively exceeded the permit requirement of ten native vernal pool species in both the spring and summer surveys. Combined native species present in and around the reference pools were 24.
Year Four (2005-2006)
Combined native species richness of the vernal pools was approximately 25 species in the spring survey and approximately 24 species in the summer survey. All of the five pools both individually and collectively exceeded the permit requirement of ten native vernal pool species in both the spring and summer surveys. Combined native species present in and around the reference pools were 26.

5 Year Performance Criteria Monitoring Report for Restored Wetlands at Manzanita Village
University of California, Santa Barbara, Cheadle Center for Biodiversity and Ecological Restoration 15
Year Five (2006-2007)
Native species richness of the vernal pools was approximately 26 species in the spring survey, with no data available for the summer. All of the five pools both individually and collectively exceeded the permit requirement of ten native vernal pool species. Combined native species present in and around the reference pools were 28.
5.1.3 Vernal Pool Hydrology
On average, the created vernal pools at Manzanita Village became inundated with water earlier than the naturally occurring reference pools, sometimes as much as three months earlier, and retained water up to two months longer than the reference pools.
Year One (2002-2003)
All of the vernal pools at Manzanita Village and the reference vernal pools filled up during the same week (4 November, 2002). All of the reference pools were empty from December 2 through December 13, 2002 as were Santa Barbara and Santa Catalina pools at Manzanita Village. By the week of 26 May, 2003, all of the reference pools were empty as was Santa Cruz vernal pool at Manzanita Village. Santa Catalina was empty by June 16, 2003 and the other three pools were empty by 23 June, 2003. Data for this section is presented in Tables 5 and 13 and Figures 6 and 13.
Year Two (2003-2004)
All of the vernal pools at Manzanita Village restoration site filled up by the third week in December of 2003, with a high reading of 13.75 inches at Santa Barbara and a low of 7 inches at Santa Cruz. Each of the pools dried during a different month. Santa Rosa contained standing water for the greatest duration, through the second week of May and Santa Rosa dried out earlier, by the third week in March. In comparison, the reference pools did not contain standing water until the third week in March and were all dry by the end of March, with Del Sol (large) containing water for the longest duration. Data for this section is presented in Tables 6 and 14 and Figures 7 and 14.
Year Three (2004-2005)
Approximately 2 inches of rain was received in the last week of October and the first week of November and this was enough rain to register at three of the vernal pools. Without continued rain, the pools dried up by the second week in November. Continued intermittent rainfall from December through March kept the pools wet for another four months with water gauge levels peaking in most pools in December. The reference vernal pools did not register any standing water until the second rain of the season. By the last week in December, all of the reference pools contained water with a low of 4.5 inches in Camino Corto pool and a high of 10 inches in Del Sol (Small) pool. By the end of May, all of the pools at Manzanita Village as well as the reference pools were dry. Data for this section is presented in Tables 7 and 15 and Figures 8 and 15.

5 Year Performance Criteria Monitoring Report for Restored Wetlands at Manzanita Village
University of California, Santa Barbara, Cheadle Center for Biodiversity and Ecological Restoration 16
Year Four (2005-2006)
None of the vernal pools contained standing water during 2005-2006 rainy season until the first week in January. All of the other pools contained standing water from the first week in January through the first week in June with the exception of Santa Cruz vernal pool, which dried out for the month of February. The reference pools contained between 3 and 5 inches of standing water in the first two weeks of January and had dried out by the third week. Continued rainfall filled the reference pools up once again by the first week in March with a low of 2 inches in Camino Corto and a high of 6.50 inches in Ellwood. The reference pools all dried out by the first week in June. Data for this section is presented in Tables 8 and 16 and Figures 9 and 16.
Year Five (2006-2007)
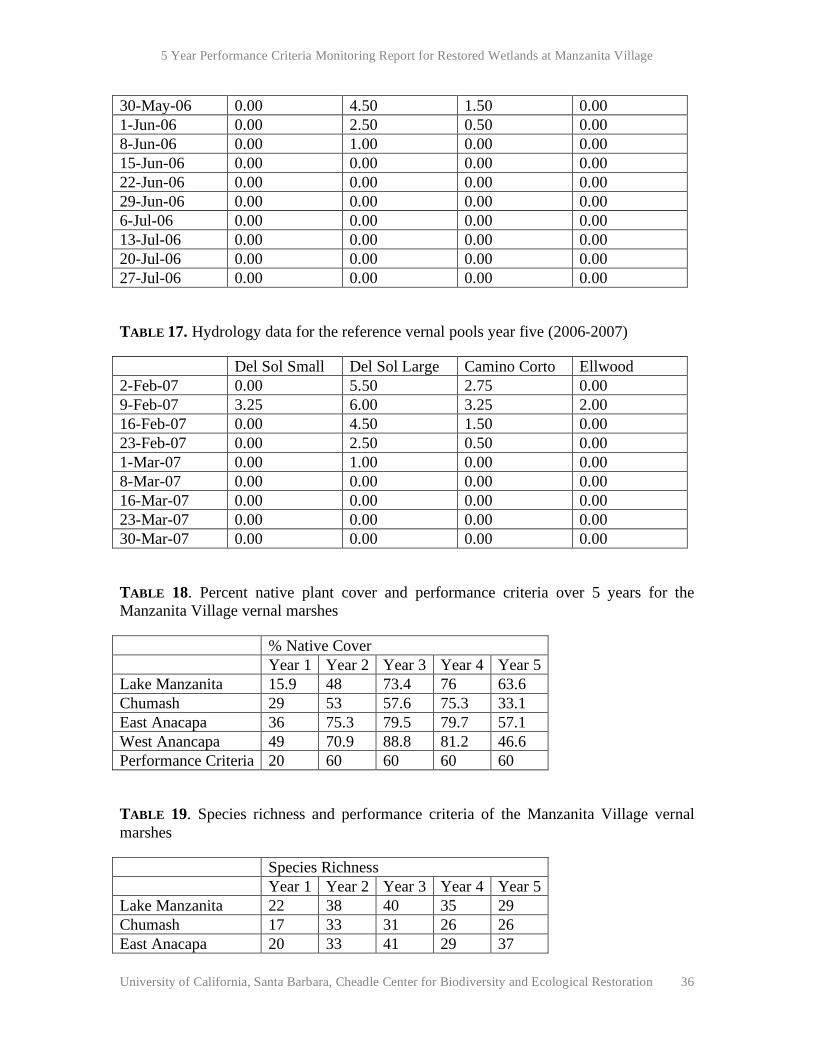
With an extremely low level of precipitation during the 2006-2007 rainy season, the vernal pools barely registered standing water. By the first week in February, only two vernal pools contained any water. Santa Rosa and Catalina vernal pools contained 1.5 inches and 2 inches respectively. By the fourth week in February, all of the pools contained some standing water with a high of 5 inches in Santa Catalina and a low of 1.7 inches in Santa Cruz vernal pool. All of the pools were dry by the last week in March. With the exception of the Del Sol (Small) reference pool, all of the other reference pools contained no standing water for the entire 2006-2007 rainy season. Del Sol (small) reference pool contained 2 inches of standing water in the third week of February and the pool was completely dry by the second week in March. Data for this section is presented in Tables 9 and 17 and Figures 10 and 17.
5.1.4 Photo Documentation
See Appendix C
5.2 Vernal Marsh
Anacapa East, Anacapa West, Chumash and Manzanita Lake
5.2.1 Vernal Marsh Percent Native Vegetation Cover
For the first three years of the project, all of the marshes exceeded the performance criteria with the exception of Manzanita Lake in the first year, Manzanita Lake and Chumash Marsh in year two and Chumash Marsh in year three. Year four saw all of the marshes far exceed the performance criteria. In year five, only Manzanita Lake exceeded the performance criteria and this was most probably a result of extremely low rainfall Data for this section is presented in Table 18 and Figure 18.
Year One (2002-2003)

5 Year Performance Criteria Monitoring Report for Restored Wetlands at Manzanita Village
University of California, Santa Barbara, Cheadle Center for Biodiversity and Ecological Restoration 17
All of the Manzanita Village vernal marshes, except one, exceeded native vegetation cover permit requirements (20% native species cover) after the first year of implementation. The spring 2003 vegetation survey averaged 4.67% native vegetation cover across the four project vernal marshes. The summer 2003 vegetation survey of the project vernal marshes averaged 32% native vegetation cover. The only vernal marsh that did not meet permit criteria, Manzanita Marsh, had 16% native vegetation cover at the summer 2003 survey.
Year Two (2003-2004)
Anacapa East and Anacapa West vernal marshes at Manzanita Village significantly exceeded native vegetation cover performance criteria (60% native species cover) after the second year of implementation, whereas Lake Manzanita and Chumash vernal marshes were considerably less. The combined percent native vegetation cover for year two averaged 61.71% native vegetation cover across the four project vernal marshes.
Year Three (2004-2005)
During year three, no data was collected during the spring of 2005. However, based on the percent cover data collected during the summer months, all but one of the Manzanita Village vernal marshes exceeded native vegetation cover performance criteria (60% native species cover). The summer 2004 vegetation survey of the project vernal marshes averaged 74.83% native vegetation cover. The only vernal marsh that did not meet the performance criteria was Chumash vernal marsh.
Year Four (2005-2006)
All of the Manzanita Village vernal marshes significantly exceeded the native vegetation cover performance criteria recommendation of 60 % native species cover after the fourth year of implementation. The percent vegetation survey averaged 78.02% native vegetation cover across the four project vernal marshes, approximately 18% greater than the performance criteria recommendation.
Year Five (2006-2007)
A significant drop in the amount of rainfall received during 2006-2007 was directly reflected in a low percent native vegetation cover across all four vernal marshes with an average 50.09% cover and an average drop of 29.91%.
5.2.2 Vernal Marsh Native Plant Species Richness
All of the vernal marshes far exceeded the performance criteria set by the California Coastal Commission during the implementation phase of the project. Data for this section is presented in Tables 19 and 20 and Figure 19.
Year One (2002-2003)

5 Year Performance Criteria Monitoring Report for Restored Wetlands at Manzanita Village
University of California, Santa Barbara, Cheadle Center for Biodiversity and Ecological Restoration 18
All of the project vernal marshes exceeded native species richness performance criteria recommendations (five native species) after the first year of implementation. The spring 2003 vegetation survey totaled 31 native species across the four project vernal marshes. The summer 2003 vegetation survey of the project vernal marshes totaled 42 native species.
Year Two (2003-2004)
All of the project vernal marshes exceeded native species richness performance criteria recommendations (seven native species) after the second year of implementation. The spring 2004 vegetation survey totaled approximately 39 native species across the four project vernal marshes. The summer 2004 vegetation survey of the project vernal marshes totaled 29 native species.
Year Three (2004-2005)
All of the project vernal marshes exceeded native species richness performance criteria recommendations (seven native species) after the third year of implementation. The summer 2005 vegetation survey totaled 30 native species across the four project vernal marshes. No spring data for the 2004 vegetation survey was available.
Year Four (2005-2006)
All of the project vernal marshes exceeded native species richness performance criteria recommendations (seven native species) after the fourth year of implementation. The spring 2006 vegetation survey totaled approximately 29 native species across the four project vernal marshes. The summer 2006 vegetation survey of the project vernal marshes totaled 27 native species.
Year Five (2006-2007)
All of the project vernal marshes exceeded native species richness performance criteria recommendations (seven native species) after the fifth year of implementation. The spring 2003 vegetation survey totaled approximately 30 native species across the four project vernal marshes. No data was available for the summer 2007 vegetation survey of the project vernal marshes.
5.2.3 Vernal Marsh Hydrology
For the first four years of the project, the vernal marshes were inundated with water for at least five months of the year with a high of seven months in year one. The fifth year of the project saw a sharp drop in the inundation period, with water present for only one month. Adequate reference marshes were not found.

5 Year Performance Criteria Monitoring Report for Restored Wetlands at Manzanita Village
University of California, Santa Barbara, Cheadle Center for Biodiversity and Ecological Restoration 19
Year One (2002-2003)
All of the vernal marshes at Manzanita Village had filled up by 22 November, 2002, with a high of 21 inches at Manzanita Lake and a low of 9.5 inches at West Anacapa. The marshes contained water through the months from November 2002 to the middle of June 2003. Data for this section is presented in Table 21 and Figure 20.
Year Two (2003-2004)
All of the vernal marshes at Manzanita Village had filled up by 15 December 2003 and contained standing water for 17 weeks (East Anacapa) and 24 weeks (Manzanita Lake). Peak water levels during the week of 22 December ranged from a high of 24 inches at Manzanita Lake to a low of 11 inches at West Anacapa. All of the vernal marshes had dried out by the second week in June. Data for this section is presented in Table 22 and Figure 21.
Year Three (2004-2005)
Approximately 2 inches of rain was received in the last week of October and the first week of November and this was enough rain to register in three of the vernal marshes. Without continued rain, the marshes dried up by the second week in November. Continued intermittent rainfall from December through March kept the marshes wet for another four months with water gauge levels peaking in most marshes in December. By the end of May, all of the marshes at Manzanita Village were dry. Data for this section is presented in Table 23 and Figure 22.
Year Four (2005-2006)
For the 2005-2006 rainy season, the vernal marshes did not contain standing water until the first week in January with the exception of Manzanita Lake vernal marsh, which had standing water to a depth of 21.75 inches on 6 December, 2005. This high reading may be due to a combination of factors, such as a larger catchment area, so that the marsh receives runoff from a larger number of dorms and irrigated green areas as well as being at a low point within Manzanita Village restoration site itself. All of the other marshes contained standing water from the first week in January through the first week in June with the exception of Chumash vernal marsh, which was dry for the last two weeks in February. Data for this section is presented in Table 24 and Figure 23.
Year Five (2006-2007)
With an extremely low level of precipitation during the 2006-2007 rainy season, the vernal marshes barely registered standing water. By the fourth week in February, all of the marshes contained some standing water with a high of 6.8 inches in East Anacapa marsh and a low of 4.8 inches at West Anacapa. No measurements were taken at Manzanita Lake vernal marsh after the third week in February due to presence of red-winged blackbirds and the possibility that they may be nesting. Data for this section is presented in Table 25 and Figure 24.

5 Year Performance Criteria Monitoring Report for Restored Wetlands at Manzanita Village
University of California, Santa Barbara, Cheadle Center for Biodiversity and Ecological Restoration 20
5.2.4 Photo Documentation
See Appendix C
5.3 Vernal Meadow
Bluff and South Drain
5.3.1 Vernal Meadow Percent Native Vegetation Cover
Over the five year implementation phase of the project, the vernal meadows exceeded the performance criteria with the exception of the south drain, which had slightly less (< 5%) native vegetation cover than the performance criteria. Data for this section is presented in Table 26 and Figure 25.
Year One (2002-2003)
Vegetation percent cover for the spring survey averaged 40.1% and the summer survey averaged 35.74%. Both vernal meadows exceeded the performance criteria of 20%.
Year Two (2003-2004)
Vegetation percent cover for the spring survey averaged 61.06 % and the summer survey averaged 71.33%. Both vernal meadows exceeded the performance criteria of 50 %.
Year Three (2004-2005)
Vegetation percent cover for the spring survey averaged 74.84 % and the summer survey averaged 69.63%. Both vernal meadows exceeded the performance criteria of 50% cover.
Year Four (2005-2006)
Vegetation percent cover for the spring survey averaged 70.05% and the summer survey averaged 83.36%. Both vernal meadows exceeded the performance criteria of 50%.
Year Five (2006-2007)
Based on spring data, vegetation percent cover for the fifth year averaged 75%. No summer data was available. The bluff wetland drain exceeded the performance criteria by 9% and the south drain was slightly less than the recommendation with 70.21%.

5 Year Performance Criteria Monitoring Report for Restored Wetlands at Manzanita Village
University of California, Santa Barbara, Cheadle Center for Biodiversity and Ecological Restoration 21
5.3.2 Vernal Meadow Native Plant Species Richness
Both vernal meadows met and exceeded the recommended performance criteria for native plant species richness. Data for this section is presented in Tables 27 and 28 and Figure 26.
Year One (2002-2003)
Combined native species richness of the two vernal meadows was eight in the spring survey and approximately 17 in the summer survey. The two vernal meadows individually and collectively exceeded the performance criteria recommendation of five native vernal meadow species in both the spring and summer surveys.
Year Two (2003-2004)
Combined native species richness of the two vernal meadows was 22 in the spring survey and 19 in the summer survey. The two vernal meadows individually and collectively exceeded the performance criteria recommendation of five native vernal meadow species in both the spring and summer surveys.
Year Three (2004-2005)
Combined native species richness of the two vernal meadows was approximately 22 in the spring survey and approximately 21 in the summer survey. The two vernal meadows individually and collectively exceeded the performance criteria recommendation of seven native vernal meadow species in both the spring and summer surveys.
Year Four (2005-2006)
Combined native species richness of the two vernal meadows was approximately 19 in the spring survey and 19 in the summer survey. The two vernal meadows individually and collectively exceeded the performance criteria recommendation of seven native vernal meadow species in both the spring and summer surveys.
Year Five (2006-2007)
Combined native species richness of the two vernal meadows was approximately 13 in the spring survey and no data was available for the summer survey. The bluff wetland and south drain respectively reached and exceeded the performance criteria recommendation of seven native vernal meadow species.
5.3.3 Vernal Meadow Hydrology
No hydrology data was taken for the vernal meadows as it was not necessary.

5 Year Performance Criteria Monitoring Report for Restored Wetlands at Manzanita Village
University of California, Santa Barbara, Cheadle Center for Biodiversity and Ecological Restoration 22
5.3.4 Photo Documentation
See Appendix B
6 OVERALL RESULTS
The Manzanita Village Ecological Restoration Project was a success. All of the specifications required by the CCC were met. Southern tarplant has spread throughout the whole site and with continued maintenance of upland areas should maintain a healthy presence. Coulter’s saltbush and long-leaf plantain found at Santa Catalina vernal pool also continue to expand within close proximity to the original populations.
The 0.86 acres of created wetlands and surrounding upland areas provide valuable habitat for sensitive plants, birds, small mammals, amphibians and reptiles as well as aesthetic benefits. A list of animals observed at the site and using the site for breeding or breeding support is presented in Table 29. The natural areas are also a successful example of the integration of native habitat and student housing on a university campus.
Public access to the site was initially controlled by temporary fencing and once the green fencing or shrub border was well established, the temporary fencing was removed. Permanent fencing was installed around the vernal pool and upland areas where sensitive species were present.
A project artist was employed to produce the initial six signs installed in the demonstration garden and an additional five signs that will be installed throughout the rest of the site. Temporary informational signs are in place until the permanent signs are installed. (See Appendix E)
The project received the Goleta Valley Beautiful annual award for 2005-2006 for contributions to the beauty of Goleta Valley, special recognition from the Regional Water Quality Control Board and the American Society of Landscape Architects 2008 Professional Award. (See Appendix F)
Results from the monitoring program not only met the performance criteria in most cases, but often surpassed them. These results were incorporated into the restoration plans for subsequent years as well as being used for scientific research by graduate students.
Pedestrian and bicycle trails located within the 100 ft. buffer areas were improved using decomposed granite. Trex boardwalk, made from a combination of materials such as wood flour and recycled plastics was installed where necessary as well as reduced profile, low intensity light fixtures. This portion of the project was completed by the Department of Housing and Residential Services.

5 Year Performance Criteria Monitoring Report for Restored Wetlands at Manzanita Village
University of California, Santa Barbara, Cheadle Center for Biodiversity and Ecological Restoration 23
7 CURRENT PROJECT ACTIVITIES AND ANCILLARY BENEFITS
With the implementation phase complete, we are currently in the maintenance phase of the Manzanita Village Ecological Restoration Project and our seventh year. The maintenance phase of the project requires the majority of the time be spent on weed control using a variety of techniques from green flame weeding to hand pulling and scraping up deposits of weed seeds. Two full-time restoration staff along with numerous volunteers and interns contributes approximately 4,300 hours annually to the upkeep of the site.
Vegetation and hydrological monitoring continue in and around the vernal pools as well as at our off-campus reference sites. The bioswales and trails are trimmed once a year and research is conducted to keep abreast of new management techniques that might be applicable to the project. Not all ecological processes can be conducted in an urban landscape. In the absence of fire, we have found it necessary to remove encroaching native shrubs from our native bunch grassland. This revitalizes and diversifies the grassland while also removing potential fire fuels
Manzanita Village is a unique example of habitat restoration in an urban landscape and provides countless opportunities for outdoor education. Children from local elementary schools visit the site to learn about nature through hands on activities from bird-watching to water testing. Our comprehensive internship program offers UCSB students the opportunity to learn about a variety of different topics pertaining to ecological restoration projects from site preparation to monitoring techniques. Graduate students can conduct research projects on the site and numerous departments from Biological Sciences to the College of Creative Studies incorporate Manzanita Village into their lesson plans.
The signage posted throughout the site provides information on the history of the restoration project, local plant communities and contact details should they wish to get involved or learn more about the project.
The Manzanita Village Ecological Restoration Project was a success and there are still opportunities to grow and learn from the experiences and knowledge gained. For instance, one native plant (Isocoma menziesii) proved so successful that for subsequent projects, it may be excluded from the planting palette when lower statured grasslands are the restoration goal.

5 Year Performance Criteria Monitoring Report for Restored Wetlands at Manzanita Village
University of California, Santa Barbara, Cheadle Center for Biodiversity and Ecological Restoration 24
8 TABLES
TABLE 1. Future Signs
Type of Sign Sign Description Vernal Pool Seasonality of organisms Coastal Sage Scrub Adaptations to the coast Whale Whale migration Manzanita Village The restoration story of the site Grassland Restoration Features of coastal prairie
TABLE 2. Percent native plant cover and performance criteria over 5 years for the Manzanita Village vernal pools
% Native Cover Year 1 Year 2 Year 3 Year 4 Year 5 San Miguel 21.7 53.6 87.5 86.7 60 Santa Rosa 13 56.1 83.7 96.6 79 Santa Cruz 33.2 54 98 105 75.9 Santa Barbara 20 54.4 79.5 82.6 47.7 Santa Catalina 21.8 26.9 47.2 56.4 42.8 Performance Criteria 20 50 50 50 75
TABLE 3. Species richness and performance criteria for Manzanita Village vernal pools
Species Richness Year 1 Year 2 Year 3 Year 4 Year 5 San Miguel 15 23 23 22 26 Santa Rosa 16 22 23 24 27 Santa Cruz 14 22 23 22 20 Santa Barbara 17 26 24 28 25 Santa Catalina 16 26 32 30 30 Performance Criteria 8 10 10 10 10

5 Year Performance Criteria Monitoring Report for Restored Wetlands at Manzanita Village
University of California, Santa Barbara, Cheadle Center for Biodiversity and Ecological Restoration 25
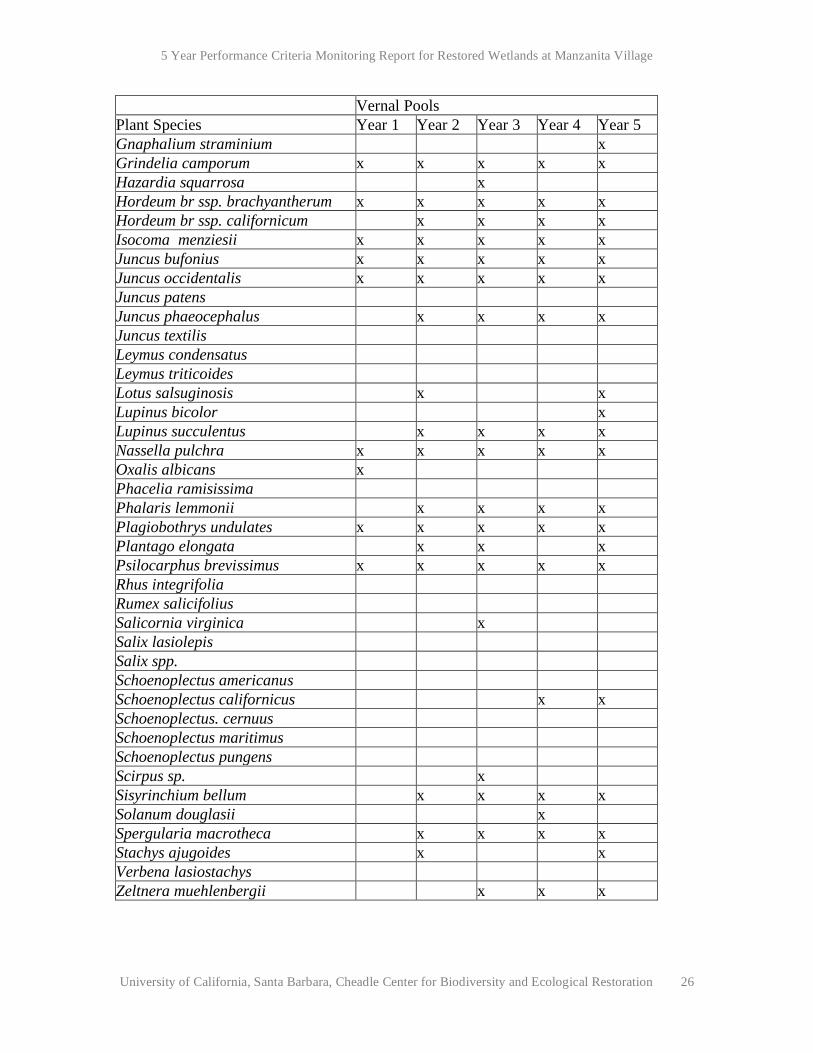
TABLE 4. Native plant species found in the vernal pools and surrounding upland at the Manzanita Village
Vernal Pools Plant Species Year 1 Year 2 Year 3 Year 4 Year 5 Alopecurus saccatus x x x Ambrosia psilostachya x x x x x Anemopsis californica Artemesia californica x Artemesia douglasiana x x Aster subulatus x x x Atriplex californica Atriplex coulteri x x x x Atriplex lentiformis x x Baccharis douglasii Baccharis pilularis x x x x x Baccharis salicifolia x Bolboschoenus maritimus x x x Brodiea jolonensis x x Bromus carinatus x Calystegia macrostegia Camissonia micrantha x x x x Carex praegracilis Castillja exserta x x Centromadia parryi ssp. australis x x x x Centunculus minimus x Conyza coulteri x x Corethrogyne filaginifolia x Crassula aquatuca x x x x Datura wrightii Deinandra fasciculata x x x x Distichlis spicata x x x x x Eleocharis acicularis x x x x x Eleocharis macrostachya x x x x x Eleocharis montevidensis Encelia californica Eriogonum parvifolium x x Eryngium armatum x x x x x Eryngium vaseyi x x x x Eschscholzia californica x Euthamia occidentalis x x x x x Frankenia salina x x x x x
Gnaphalium californicum x
5 Year Performance Criteria Monitoring Report for Restored Wetlands at Manzanita Village
University of California, Santa Barbara, Cheadle Center for Biodiversity and Ecological Restoration 26
Vernal Pools Plant Species Year 1 Year 2 Year 3 Year 4 Year 5 Gnaphalium straminium x Grindelia camporum x x x x x Hazardia squarrosa x Hordeum br ssp. brachyantherum x x x x x Hordeum br ssp. californicum x x x x Isocoma menziesii x x x x x Juncus bufonius x x x x x Juncus occidentalis x x x x x Juncus patens Juncus phaeocephalus x x x x Juncus textilis Leymus condensatus Leymus triticoides Lotus salsuginosis x x Lupinus bicolor x Lupinus succulentus x x x x Nassella pulchra x x x x x Oxalis albicans x Phacelia ramisissima Phalaris lemmonii x x x x Plagiobothrys undulates x x x x x Plantago elongata x x x Psilocarphus brevissimus x x x x x Rhus integrifolia Rumex salicifolius Salicornia virginica x Salix lasiolepis Salix spp. Schoenoplectus americanus Schoenoplectus californicus x x Schoenoplectus. cernuus Schoenoplectus maritimus Schoenoplectus pungens Scirpus sp. x Sisyrinchium bellum x x x x Solanum douglasii x Spergularia macrotheca x x x x Stachys ajugoides x x Verbena lasiostachys Zeltnera muehlenbergii x x x
5 Year Performance Criteria Monitoring Report for Restored Wetlands at Manzanita Village
University of California, Santa Barbara, Cheadle Center for Biodiversity and Ecological Restoration 27
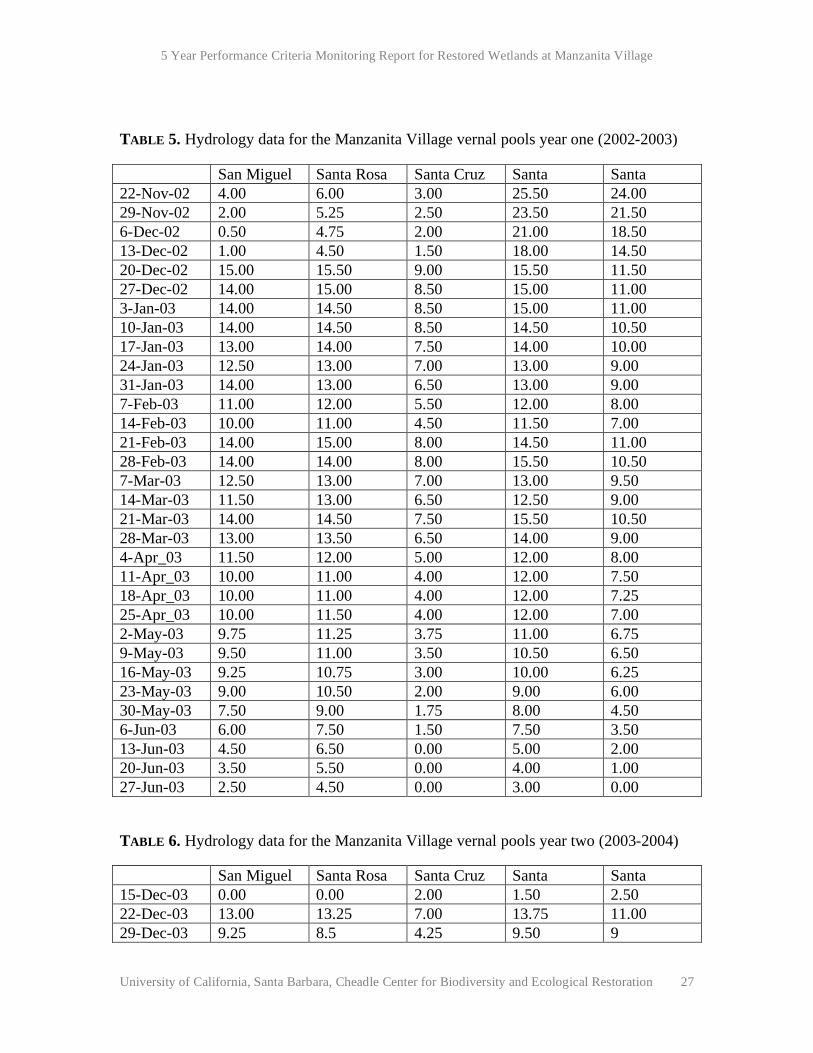
TABLE 5. Hydrology data for the Manzanita Village vernal pools year one (2002-2003)
San Miguel Santa Rosa Santa Cruz Santa Barbara
Santa Catalina 22-Nov-02 4.00 6.00 3.00 25.50 24.00
29-Nov-02 2.00 5.25 2.50 23.50 21.50 6-Dec-02 0.50 4.75 2.00 21.00 18.50 13-Dec-02 1.00 4.50 1.50 18.00 14.50 20-Dec-02 15.00 15.50 9.00 15.50 11.50 27-Dec-02 14.00 15.00 8.50 15.00 11.00 3-Jan-03 14.00 14.50 8.50 15.00 11.00 10-Jan-03 14.00 14.50 8.50 14.50 10.50 17-Jan-03 13.00 14.00 7.50 14.00 10.00 24-Jan-03 12.50 13.00 7.00 13.00 9.00 31-Jan-03 14.00 13.00 6.50 13.00 9.00 7-Feb-03 11.00 12.00 5.50 12.00 8.00 14-Feb-03 10.00 11.00 4.50 11.50 7.00 21-Feb-03 14.00 15.00 8.00 14.50 11.00 28-Feb-03 14.00 14.00 8.00 15.50 10.50 7-Mar-03 12.50 13.00 7.00 13.00 9.50 14-Mar-03 11.50 13.00 6.50 12.50 9.00 21-Mar-03 14.00 14.50 7.50 15.50 10.50 28-Mar-03 13.00 13.50 6.50 14.00 9.00 4-Apr_03 11.50 12.00 5.00 12.00 8.00 11-Apr_03 10.00 11.00 4.00 12.00 7.50 18-Apr_03 10.00 11.00 4.00 12.00 7.25 25-Apr_03 10.00 11.50 4.00 12.00 7.00 2-May-03 9.75 11.25 3.75 11.00 6.75 9-May-03 9.50 11.00 3.50 10.50 6.50 16-May-03 9.25 10.75 3.00 10.00 6.25 23-May-03 9.00 10.50 2.00 9.00 6.00 30-May-03 7.50 9.00 1.75 8.00 4.50 6-Jun-03 6.00 7.50 1.50 7.50 3.50 13-Jun-03 4.50 6.50 0.00 5.00 2.00 20-Jun-03 3.50 5.50 0.00 4.00 1.00 27-Jun-03 2.50 4.50 0.00 3.00 0.00
TABLE 6. Hydrology data for the Manzanita Village vernal pools year two (2003-2004)
San Miguel Santa Rosa Santa Cruz Santa Barbara
Santa Catalina 15-Dec-03 0.00 0.00 2.00 1.50 2.50
22-Dec-03 13.00 13.25 7.00 13.75 11.00 29-Dec-03 9.25 8.5 4.25 9.50 9

5 Year Performance Criteria Monitoring Report for Restored Wetlands at Manzanita Village
University of California, Santa Barbara, Cheadle Center for Biodiversity and Ecological Restoration 28
5-Jan-04 7.00 7.00 2.00 7.00 8.50 12-Jan-04 6.00 6.00 0.00 6.00 7.00 19-Jan-04 5.00 4.00 0.00 5.00 4.00 26-Jan-04 3.00 2.50 0.00 3.00 3.50 2-Feb-04 3.00 2.50 0.00 3.00 4.00 9-Feb-04 2.50 2.50 0.00 2.50 3.50 16-Feb-04 3.00 3.00 2.00 3.00 4.00 23-Feb-04 13.00 12.00 6.00 11.50 9.00 1-Mar-04 13.50 12.50 6.50 12.00 9.50 8-Mar-04 13.25 12.00 5.00 13.00 8.00 15-Mar-04 12.50 11.00 3.50 10.00 8.00 22-Mar-04 11.00 10.00 2.50 8.00 7.00 29-Mar-04 8.50 9.00 0.00 6.00 5.50 5-Apr-04 7.00 7.25 0.00 5.50 4.50 12-Apr-04 5.75 6.00 0.00 4.50 3.75 19-Mar-04 4.00 4.75 0.00 3.00 2.00 26-Apr-04 2.00 3.25 0.00 1.25 0.00 3-May-04 1.25 2.25 0.00 0.00 0.00 10-May-04 0.00 1.50 0.00 0.00 0.00 17-May-04 0.00 0.00 0.00 0.00 0.00 24-May-04 0.00 0.00 0.00 0.00 0.00 31-May-04 0.00 0.00 0.00 0.00 0.00 7-Jun-04 0.00 0.00 0.00 0.00 0.00 14-Jun-04 0.00 0.00 0.00 0.00 0.00 21-Jun-04 0.00 0.00 0.00 0.00 0.00
TABLE 7. Hydrology data for the Manzanita Village vernal pools year three (2004-2005)
San Miguel Santa Rosa Santa Cruz Santa Barbara
Santa Catalina 11-Oct-04 0.00 0.00 0.00 0.00 0.00
18-Oct-04 0.00 0.00 0.00 0.00 0.00 25-Oct-04 2.00 0.00 0.00 0.00 2.00 1-Nov-04 2.25 2.50 0.00 0.00 1.00 8-Nov-04 0.00 0.00 0.00 0.00 0.00 15-Nov-04 0.00 0.00 0.00 0.00 0.00 22-Nov-04 0.00 0.00 0.00 0.00 0.00 29-Nov-04 0.00 0.00 0.00 0.00 0.00 6-Dec-04 0.00 0.00 0.00 0.00 0.00 13-Dec-04 0.00 0.00 0.00 0.00 0.00 20-Dec-04 0.00 0.00 0.00 0.00 0.00 27-Dec-04 15.00 15.5 9.50 14.50 11.00 3-Jan-05 15.00 15.50 9.50 15.00 11.00 10-Jan-05 14.50 14.00 8.00 14.50 10.25 17-Jan-05 13.00 14.00 7.50 12.50 9.00

5 Year Performance Criteria Monitoring Report for Restored Wetlands at Manzanita Village
University of California, Santa Barbara, Cheadle Center for Biodiversity and Ecological Restoration 29
24-Jan-05 13.00 13.00 6.75 13.00 9.00 31-Jan-05 12.50 13.00 6.25 13.00 8.75 7-Feb-05 11.50 12.00 5.00 12.00 8.00 14-Feb-05 12.00 12.75 5.75 13.75 8.75 21-Feb-05 15.25 15.50 9.00 15.75 10.25 28-Feb-05 14.50 14.75 8.25 15.00 9.75 7-Mar-05 14.50 14.75 8.00 15.00 9.75 14-Mar-05 13.00 13.75 7.00 13.50 9.00 21-Mar-05 15.00 15.75 8.75 15.75 10.75 28-Mar-05 12.50 13.75 7.00 13.75 9.75 4-Apr-05 11.50 13.00 3.75 12.00 8.75 11-Apr-05 9.75 12.50 3.75 10.75 7.75 18-Apr-05 11.75 13.00 5.75 12.50 8.00 25-Apr-05 8.00 9.75 2.25 9.00 5.25 2-May-05 6.50 8.75 0.00 8.00 0.00
TABLE 8. Hydrology data for the Manzanita Village vernal pools year four (2005-2006)
San Miguel Santa Rosa Santa Cruz Santa Barbara
Santa Catalina 6-Dec-05 0.00 0.00 0.00 0.00 0.00
13-Dec-05 0.00 0.00 0.00 0.00 0.00 20-Dec-05 0.00 0.00 0.00 0.00 0.00 29-Dec-05 0.00 0.00 0.00 0.00 0.00 5-Jan-06 10.50 11.50 7.00 9.00 9.75 12-Jan-06 9.50 10.50 5.75 8.50 9.00 19-Jan-06 8.50 9.50 4.25 7.50 8.75 26-Jan-06 7.50 8.00 2.25 6.75 8.00 2-Feb-06 6.25 7.00 0.00 5.50 7.00 9-Feb-06 5.00 6.25 0.00 5.00 6.25 16-Feb-06 3.75 4.75 0.00 4.00 5.00 23-Feb-06 4.00 5.75 0.00 4.00 5.00 1-Mar-06 8.00 9.00 4.50 7.75 8.75 8-Mar-06 8.00 9.00 4.50 7.75 8.75 16-Mar-06 8.75 9.00 4.75 8.00 9.25 23-Mar-06 8.00 9.00 3.50 7.50 8.75 30-Mar-06 9.75 11.00 6.00 9.50 10.00 6-Apr_06 14.75 16.00 9.00 14.75 10.00 13-Apr_06 13.25 15.00 7.50 13.50 9.50 20-Apr_06 12.75 14.00 7.00 12.50 9.00 27-Apr_06 11.75 13.50 5.50 11.75 9.50 4-May-06 10.25 12.00 4.00 11.00 8.00 11-May-06 10.50 11.50 2.50 9.50 8.00 18-May-06 8.50 10.50 1.00 8.50 6.50 25-May-06 9.50 11.50 3.00 9.50 7.50

5 Year Performance Criteria Monitoring Report for Restored Wetlands at Manzanita Village
University of California, Santa Barbara, Cheadle Center for Biodiversity and Ecological Restoration 30
30-May-06 7.75 10.00 1.00 8.00 6.25 1-Jun-06 6.25 8.00 0.00 5.75 4.00 8-Jun-06 4.00 5.75 0.00 2.75 2.00 15-Jun-06 2.00 2.75 0.00 1.75 1.00 22-Jun-06 2.00 0.75 0.00 0.00 0.00 29-Jun-06 0.00 0.00 0.00 0.00 0.00 6-Jul-06 0.00 0.00 0.00 0.00 0.00 13-Jul-06 0.00 0.00 0.00 0.00 0.00 20-Jul-06 0.00 0.00 0.00 0.00 0.00 27-Jul-06 0.00 0.00 0.00 0.00 0.00
TABLE 9. Hydrology data for the Manzanita Village vernal pools year five (2006-2007)
San Miguel Santa Rosa Santa Cruz Santa Barbara
Santa Catalina 2-Feb-07 0.00 1.50 0.00 0.00 2.00
9-Feb-07 0.00 0.00 0.00 0.00 0.00 16-Feb-07 0.00 2.00 0.00 0.00 2.70 23-Feb-07 4.00 4.50 1.70 4.10 5.00 1-Mar-07 2.00 3.00 0.00 2.50 4.70 8-Mar-07 0.00 1.00 0.00 1.50 3.50 16-Mar-07 0.00 0.00 0.00 0.00 2.90 23-Mar-07 0.00 0.00 0.00 0.00 1.50 30-Mar-07 0.00 0.00 0.00 0.00 0.00
TABLE 10. Percent native plant cover over 5 years for the reference vernal pools
% Native Cover Year 1 Year 2 Year 3 Year 4 Year 5 Del Sol Large 51.2 29.2 54 73.1 34.5 Del Sol Small 42.4 13.6 36.5 56.9 35.1 Camino Corto 74.8 57.1 30 82.1 45.4 Ellwood 47.8 15.5 51.7 62.9 35.8
TABLE 11. Species richness for the reference vernal pools
Species Richness Year 1 Year 2 Year 3 Year 4 Year 5 Del Sol Large 12 10 11 13 9 Del Sol Small 18 16 18 12 9 Camino Corto 14 15 12 14 9 Ellwood 12 10 20 9 11

5 Year Performance Criteria Monitoring Report for Restored Wetlands at Manzanita Village
University of California, Santa Barbara, Cheadle Center for Biodiversity and Ecological Restoration 31
TABLE 12. Native plant species found in the reference vernal pools and surrounding upland
Vernal Pools Plant Species Year 1 Year 2 Year 3 Year 4 Year 5 Alopecurus saccatus x x x x Ambrosia psilostachya x x x x x Anemopsis californica Artemesia californica Artemesia douglasiana Aster subulatus x Atriplex californica Atriplex coulteri Atriplex lentiformis Baccharis douglasii Baccharis pilularis x x x x x Baccharis salicifolia Bolboschoenus maritimus Brodiea jolonensis x x x x x Bromus carinatus Calystegia macrostegia x x x Camissonia micrantha Carex praegracilis Castillja exserta x x x x x Centromadia parryi ssp. australis x x x x x Centunculus minimus x x x x x Conyza coulteri Corethrogyne filaginifolia Crassula aquatuca x x x x x Datura wrightii Deinandra fasciculata x x Distichlis spicata x x x x x Eleocharis acicularis x x x x x Eleocharis macrostachya x x x x Eleocharis montevidensis Encelia californica Eremocarpus setigerus x x x x x Eriogonum parvifolium Eryngium armatum x x x x x Eryngium vaseyi x x x x x Eschscholzia californica Euthamia occidentalis Frankenia salina x x Gnaphalium californicum
Gnaphalium straminium

5 Year Performance Criteria Monitoring Report for Restored Wetlands at Manzanita Village
University of California, Santa Barbara, Cheadle Center for Biodiversity and Ecological Restoration 32
Vernal Pools Plant Species Year 1 Year 2 Year 3 Year 4 Year 5 Grindelia camporum x x x x x Hazardia squarrosa Hordeum br ssp. brachyantherum x x x x x Hordeum br ssp. californicum Isocoma menziesii x x x x Juncus bufonius x x x x x Juncus occidentalis x x x x x Juncus patens Juncus phaeocephalus x x x x x Juncus textilis Leymus condensatus Leymus triticoides Lotus salsuginosis Lupinus bicolor x x x x Lupinus succulentus Nassella pulchra x x x x x Oxalis albicans Phacelia ramisissima Phalaris lemmonii x x Plagiobothrys undulates x x x x x Plantago elongata Psilocarphus brevissimus x x x x Rhus integrifolia Rumex salicifolius Salicornia virginica Salix lasiolepis Salix spp. Schoenoplectus americanus Schoenoplectus californicus Schoenoplectus cernuus Schoenoplectus maritimus Schoenoplectus pungens Scirpus sp. Sisyrinchium bellum x x x x x Solanum douglasii Spergularia macrotheca Stachys ajugoides Verbena lasiostachys Zeltnera muehlenbergii

5 Year Performance Criteria Monitoring Report for Restored Wetlands at Manzanita Village
University of California, Santa Barbara, Cheadle Center for Biodiversity and Ecological Restoration 33
TABLE 13. Hydrology data for the reference vernal pools year one (2002-2003)
Del Sol Small Del Sol Large Camino Corto Ellwood 22-Nov-02 1.50 0.00 0.50 4.00 29-Nov-02 1.25 0.00 0.00 0.00 6-Dec-02 1.00 0.00 0.00 0.00 13-Dec-02 0.00 0.00 0.00 0.00 20-Dec-02 8.00 6.50 13.00 8.00 27-Dec-02 8.00 7.00 12.00 6.00 3-Jan-03 7.50 4.00 11.00 6.00 10-Jan-03 6.00 5.00 9.00 4.50 17-Jan-03 5.75 4.50 7.50 4.50 24-Jan-03 4.75 3.50 5.00 4.00 31-Jan-03 4.25 2.00 3.00 3.50 7-Feb-03 3.00 0.00 1.50 3.00 14-Feb-03 5.25 4.25 9.00 2.50 21-Feb-03 4.50 3.00 7.00 2.00 28-Feb-03 4.25 2.75 6.50 1.50 7-Mar-03 3.00 0.00 3.75 1.00 14-Mar-03 2.00 0.00 1.75 0.50 21-Mar-03 7.75 8.25 11.00 0.00 28-Mar-03 6.50 7.00 9.00 0.00 4-Apr_03 4.50 7.00 4.50 0.00 11-Apr_03 4.00 5.00 4.25 0.00 18-Apr_03 3.50 3.00 4.00 0.00 25-Apr_03 2.00 0.00 0.00 0.00 2-May-03 0.00 0.00 0.00 0.00 9-May-03 2.00 0.00 0.00 0.00 16-May-03 0.00 0.00 0.00 0.00 23-May-03 0.00 0.00 0.00 0.00 30-May-03 0.00 0.00 0.00 0.00 6-Jun-03 0.00 0.00 0.00 0.00 13-Jun-03 0.00 0.00 0.00 0.00 20-Jun-03 0.00 0.00 0.00 0.00 27-Jun-03 0.00 0.00 0.00 0.00
TABLE 14. Hydrology data for the reference vernal pools year two (2003-2004)
Del Sol Small Del Sol Large Camino Corto Ellwood 15-Dec-03 0.00 0.00 0.00 0.00 22-Dec-03 0.00 0.00 0.00 0.00 29-Dec-03 0.00 0.00 0.00 0.00

5 Year Performance Criteria Monitoring Report for Restored Wetlands at Manzanita Village
University of California, Santa Barbara, Cheadle Center for Biodiversity and Ecological Restoration 34
5-Jan-04 0.00 0.00 0.00 0.00 12-Jan-04 0.00 0.00 0.00 0.00 19-Jan-04 0.00 0.00 0.00 0.00 26-Jan-04 0.00 0.00 0.00 0.00 2-Feb-04 0.00 0.00 0.00 0.00 9-Feb-04 0.00 0.00 0.00 0.00 16-Feb-04 0.00 0.00 0.00 0.00 23-Feb-04 2.00 4.00 3.00 4.00 1-Mar-04 1.00 2.50 2.50 2.50 8-Mar-04 0.50 2.00 1.00 1.00 15-Mar-04 0.00 1.50 1.00 0.00 22-Mar-04 0.00 1.00 0.50 0.00 29-Mar-04 0.00 1.00 0.00 0.00 5-Apr-04 0.00 0.00 0.00 0.00 12-Apr-04 0.00 0.00 0.00 0.00 19-Mar-04 0.00 0.00 0.00 0.00 26-Apr-04 0.00 0.00 0.00 0.00 3-May-04 0.00 0.00 0.00 0.00 10-May-04 0.00 0.00 0.00 0.00 17-May-04 0.00 0.00 0.00 0.00 24-May-04 0.00 0.00 0.00 0.00 31-May-04 0.00 0.00 0.00 0.00 7-Jun-04 0.00 0.00 0.00 0.00 14-Jun-04 0.00 0.00 0.00 0.00 21-Jun-04 0.00 0.00 0.00 0.00
TABLE 15. Hydrology data for the reference vernal pools year three (2004-2005)
Del Sol Small Del Sol Large Camino Corto Ellwood 11-Oct-04 0.00 0.00 0.00 0.00 18-Oct-04 0.00 0.00 0.00 0.00 25-Oct-04 0.00 0.00 0.00 0.00 1-Nov-04 0.00 0.00 0.00 0.00 8-Nov-04 0.00 0.00 0.00 0.00 15-Nov-04 0.00 0.00 0.00 0.00 22-Nov-04 0.00 0.00 0.00 0.00 29-Nov-04 0.00 0.00 0.00 0.00 6-Dec-04 0.00 0.00 0.00 0.00 13-Dec-04 0.00 0.00 0.00 0.00 20-Dec-04 0.00 0.00 0.00 0.00 27-Dec-04 10.00 6.00 4.50 5.00 3-Jan-05 11.75 15.00 6.00 5.00 10-Jan-05 11.25 8.00 7.00 4.75 17-Jan-05 10.00 6.00 6.00 4.50

5 Year Performance Criteria Monitoring Report for Restored Wetlands at Manzanita Village
University of California, Santa Barbara, Cheadle Center for Biodiversity and Ecological Restoration 35
24-Jan-05 7.00 8.25 6.00 3.00 31-Jan-05 7.00 10.50 5.00 2.50 7-Feb-05 4.50 9.75 4.50 0.50 14-Feb-05 5.75 10.00 4.75 0.00 21-Feb-05 11.75 15.00 9.25 4.75 28-Feb-05 10.25 13.50 8.00 3.25 7-Mar-05 10.25 13.00 8.00 4.00 14-Mar-05 7.00 11.50 5.75 2.50 21-Mar-05 11.50 14.50 9.00 4.75 28-Mar-05 10.50 14.50 5.75 2.50 4-Apr-05 7.00 11.50 4.75 1.00 11-Apr-05 4.50 8.25 4.75 0.50 18-Apr-05 0.00 10.75 5.75 0.25 25-Apr-05 0.00 0.00 2.50 0.00 2-May-05 0.00 0.00 0.00 0.00
TABLE 16. Hydrology data for the reference vernal pools year four (2005-2006)
Del Sol Small Del Sol Large Camino Corto Ellwood 6-Dec-05 0.00 0.00 0.00 0.00 13-Dec-05 0.00 0.00 0.00 0.00 20-Dec-05 0.00 0.00 0.00 0.00 29-Dec-05 0.00 0.00 0.00 0.00 5-Jan-06 6.75 4.25 3.00 5.00 12-Jan-06 3.50 2.75 2.00 1.75 19-Jan-06 0.00 1.00 1.00 0.00 26-Jan-06 0.00 0.00 1.00 0.00 2-Feb-06 0.00 0.00 0.00 0.00 9-Feb-06 0.00 0.00 0.00 0.00 16-Feb-06 0.00 0.00 0.00 0.00 23-Feb-06 0.00 0.00 0.00 0.00 1-Mar-06 6.00 2.25 2.00 6.50 8-Mar-06 6.00 2.25 2.00 6.50 16-Mar-06 6.00 3.75 2.75 6.25 23-Mar-06 4.75 2.00 1.50 5.25 30-Mar-06 9.00 4.75 3.00 7.00 6-Apr_06 10.50 11.50 8.75 7.00 13-Apr_06 8.75 10.50 7.00 6.00 20-Apr_06 7.50 9.50 6.25 6.50 27-Apr_06 6.00 8.50 5.75 5.25 4-May-06 4.25 8.00 5.00 2.50 11-May-06 1.00 6.25 3.75 0.00 18-May-06 0.00 5.50 2.75 0.00 25-May-06 3.25 6.00 3.25 2.00
5 Year Performance Criteria Monitoring Report for Restored Wetlands at Manzanita Village
University of California, Santa Barbara, Cheadle Center for Biodiversity and Ecological Restoration 36
30-May-06 0.00 4.50 1.50 0.00 1-Jun-06 0.00 2.50 0.50 0.00 8-Jun-06 0.00 1.00 0.00 0.00 15-Jun-06 0.00 0.00 0.00 0.00 22-Jun-06 0.00 0.00 0.00 0.00 29-Jun-06 0.00 0.00 0.00 0.00 6-Jul-06 0.00 0.00 0.00 0.00 13-Jul-06 0.00 0.00 0.00 0.00 20-Jul-06 0.00 0.00 0.00 0.00 27-Jul-06 0.00 0.00 0.00 0.00
TABLE 17. Hydrology data for the reference vernal pools year five (2006-2007)
Del Sol Small Del Sol Large Camino Corto Ellwood 2-Feb-07 0.00 5.50 2.75 0.00 9-Feb-07 3.25 6.00 3.25 2.00 16-Feb-07 0.00 4.50 1.50 0.00 23-Feb-07 0.00 2.50 0.50 0.00 1-Mar-07 0.00 1.00 0.00 0.00 8-Mar-07 0.00 0.00 0.00 0.00 16-Mar-07 0.00 0.00 0.00 0.00 23-Mar-07 0.00 0.00 0.00 0.00 30-Mar-07 0.00 0.00 0.00 0.00
TABLE 18. Percent native plant cover and performance criteria over 5 years for the Manzanita Village vernal marshes
% Native Cover Year 1 Year 2 Year 3 Year 4 Year 5 Lake Manzanita 15.9 48 73.4 76 63.6 Chumash 29 53 57.6 75.3 33.1 East Anacapa 36 75.3 79.5 79.7 57.1 West Anancapa 49 70.9 88.8 81.2 46.6 Performance Criteria 20 60 60 60 60
TABLE 19. Species richness and performance criteria of the Manzanita Village vernal marshes
Species Richness Year 1 Year 2 Year 3 Year 4 Year 5 Lake Manzanita 22 38 40 35 29 Chumash 17 33 31 26 26 East Anacapa 20 33 41 29 37
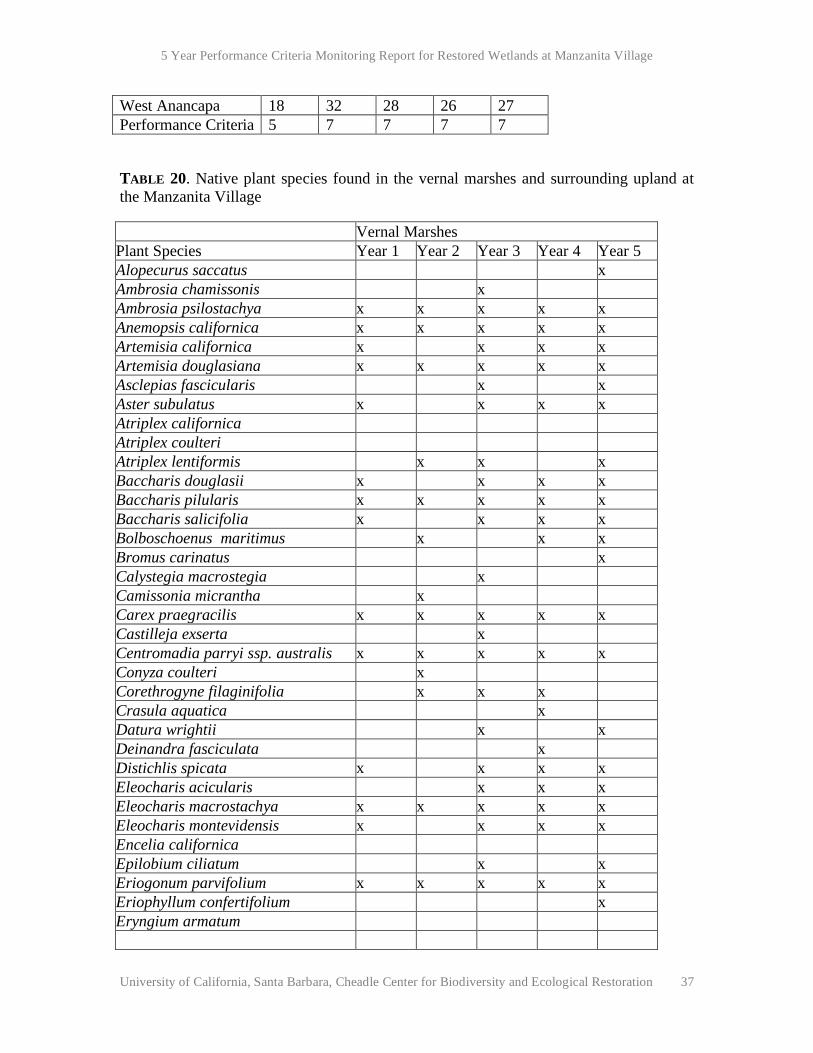
5 Year Performance Criteria Monitoring Report for Restored Wetlands at Manzanita Village
University of California, Santa Barbara, Cheadle Center for Biodiversity and Ecological Restoration 37
West Anancapa 18 32 28 26 27 Performance Criteria 5 7 7 7 7
TABLE 20. Native plant species found in the vernal marshes and surrounding upland at the Manzanita Village
Vernal Marshes Plant Species Year 1 Year 2 Year 3 Year 4 Year 5 Alopecurus saccatus x Ambrosia chamissonis x Ambrosia psilostachya x x x x x Anemopsis californica x x x x x Artemisia californica x x x x Artemisia douglasiana x x x x x Asclepias fascicularis x x Aster subulatus x x x x Atriplex californica Atriplex coulteri Atriplex lentiformis x x x Baccharis douglasii x x x x Baccharis pilularis x x x x x Baccharis salicifolia x x x x Bolboschoenus maritimus x x x Bromus carinatus x Calystegia macrostegia x Camissonia micrantha x Carex praegracilis x x x x x Castilleja exserta x Centromadia parryi ssp. australis x x x x x Conyza coulteri x Corethrogyne filaginifolia x x x Crasula aquatica x Datura wrightii x x Deinandra fasciculata x Distichlis spicata x x x x Eleocharis acicularis x x x Eleocharis macrostachya x x x x x Eleocharis montevidensis x x x x Encelia californica Epilobium ciliatum x x Eriogonum parvifolium x x x x x Eriophyllum confertifolium x Eryngium armatum
Eryngium vaseyi x x x x x

5 Year Performance Criteria Monitoring Report for Restored Wetlands at Manzanita Village
University of California, Santa Barbara, Cheadle Center for Biodiversity and Ecological Restoration 38
Vernal Marshes Plant Species Year 1 Year 2 Year 3 Year 4 Year 5 Eschscholzia californica x x x x Euthamia occidentalis x x x x x Frankenia salina x x x x x Gnaphalium californicum x Gnaphalium straminium x x Grindelia camporum x x x Hordeum br ssp. brachyantherum x x x x x Hordeum br ssp. californicum x x x Isocoma menziesii x x x x x Isolepis cernua x x Juncus acutus x x x Juncus bufonius x x x x x Juncus occidentalis x x x x x Juncus patens x x x x x Juncus phaeocephalus x x x x x Juncus textilis x x x x Lessingia filaginifolia x x Leymus condensatus x x x x Leymus triticoides x x x x Lotus salsuginosis x x Lotus scoparius x x Lupinus bicolor x Lupinus succulentus x x x Mimulus aurantiacus x x Nassella pulchra x x x x x Oxalis albicans x x Phacelia ramisissima Phalaris lemmonii x Plagiobothrys undulates x x Plantago elongata x Psilocarphus brevissimus x Rhus integrifolia Rosa californica x x x Rumex salicifolia x x x x Salicornia virginica x x x x Salix lasiolepis x x x x Schoenoplectus americanus x x x x x Schoenoplectus californicus x x x x x Schoenoplectus cernuus x x Schoenoplectus microcarpus x Schoenoplectus pungens x x x x Sisyrinchium bellum x x

5 Year Performance Criteria Monitoring Report for Restored Wetlands at Manzanita Village
University of California, Santa Barbara, Cheadle Center for Biodiversity and Ecological Restoration 39
Vernal Marshes Plant Species Year 1 Year 2 Year 3 Year 4 Year 5 Stachys ajugoides x x x Symphiotrichum chilense x x Typha domingensis x x Verbena lasiostachys x x x Zeltnera muehlenbergii x x x
TABLE 21. Hydrology data Manzanita Village vernal marshes year one (2002-2003)
West Anacapa East Anacapa Chumash Lake Manzanita 22-Nov-02 9.50 13.00 31.00 21.00
29-Nov-02 9.00 12.50 30.00 20.50 6-Dec-02 8.50 12.00 28.50 20.00 13-Dec-02 8.00 8.00 26.50 24.00 20-Dec-02 11.00 15.00 25.00 23.00 27-Dec-02 11.00 14.00 14.50 22.50 3-Jan-03 11.00 14.00 14.50 22.50 10-Jan-03 10.50 14.00 14.50 22.00 17-Jan-03 10.00 13.50 13.50 21.00 24-Jan-03 9.50 13.00 12.50 21.00 31-Jan-03 10.50 14.00 15.00 20.50 7-Feb-03 10.00 13.00 14.00 20.00 14-Feb-03 9.50 12.50 13.50 19.50 21-Feb-03 11.00 14.00 14.50 21.00 28-Feb-03 10.50 14.00 14.50 32.50 7-Mar-03 10.00 13.00 13.50 21.50 14-Mar-03 10.00 13.00 12.50 21.00 21-Mar-03 10.50 14.00 13.50 22.00 28-Mar-03 9.50 13.00 13.00 21.00 4-Apr_03 9.00 12.00 12.50 20.00 11-Apr_03 10.00 13.00 11.50 19.00 18-Apr_03 10.00 13.00 11.00 18.50 25-Apr_03 10.00 13.50 12.50 21.00 2-May-03 9.75 13.25 12.25 20.75 9-May-03 9.50 13.00 12.00 20.50 16-May-03 9.25 12.75 12.00 20.75 23-May-03 11.00 14.00 12.50 20.00 30-May-03 10.00 13.50 11.50 19.50 6-Jun-03 9.00 12.50 10.50 19.00 13-Jun-03 8.50 12.00 9.50 21.50 20-Jun-03 7.50 10.00 8.50 20.50 27-Jun-03 6.50 8.00 7.00 19.00
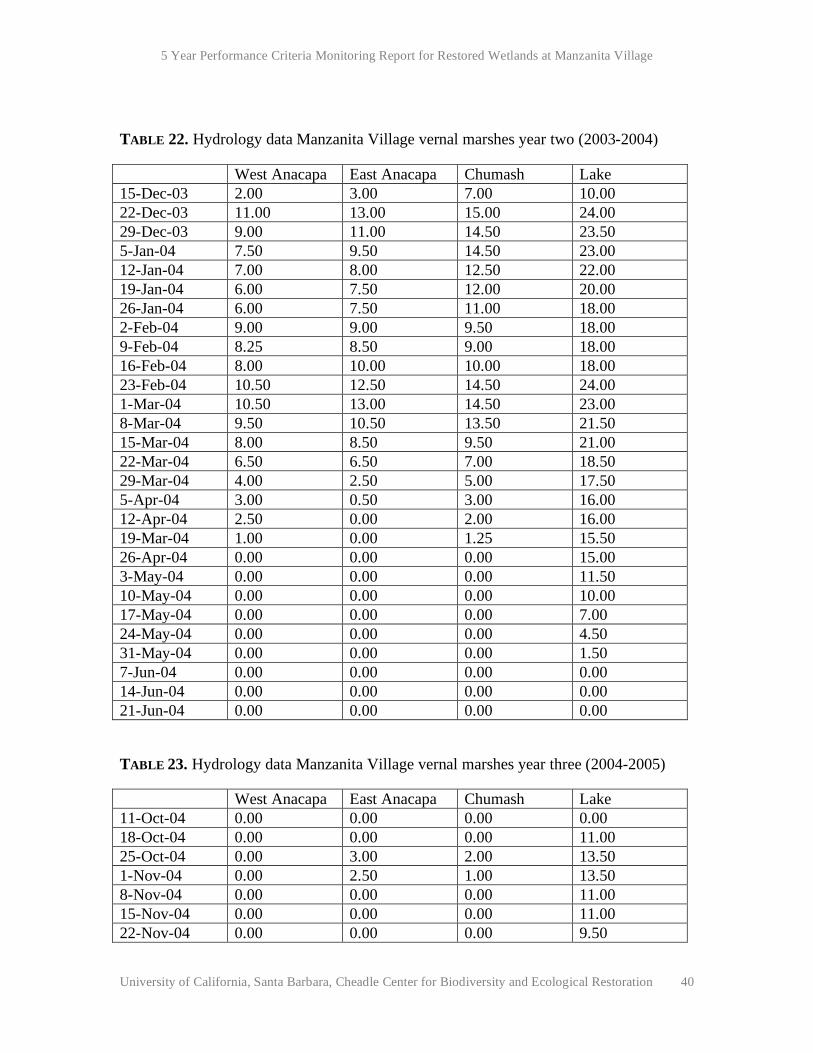
5 Year Performance Criteria Monitoring Report for Restored Wetlands at Manzanita Village
University of California, Santa Barbara, Cheadle Center for Biodiversity and Ecological Restoration 40
TABLE 22. Hydrology data Manzanita Village vernal marshes year two (2003-2004)
West Anacapa East Anacapa Chumash Lake Manzanita 15-Dec-03 2.00 3.00 7.00 10.00
22-Dec-03 11.00 13.00 15.00 24.00 29-Dec-03 9.00 11.00 14.50 23.50 5-Jan-04 7.50 9.50 14.50 23.00 12-Jan-04 7.00 8.00 12.50 22.00 19-Jan-04 6.00 7.50 12.00 20.00 26-Jan-04 6.00 7.50 11.00 18.00 2-Feb-04 9.00 9.00 9.50 18.00 9-Feb-04 8.25 8.50 9.00 18.00 16-Feb-04 8.00 10.00 10.00 18.00 23-Feb-04 10.50 12.50 14.50 24.00 1-Mar-04 10.50 13.00 14.50 23.00 8-Mar-04 9.50 10.50 13.50 21.50 15-Mar-04 8.00 8.50 9.50 21.00 22-Mar-04 6.50 6.50 7.00 18.50 29-Mar-04 4.00 2.50 5.00 17.50 5-Apr-04 3.00 0.50 3.00 16.00 12-Apr-04 2.50 0.00 2.00 16.00 19-Mar-04 1.00 0.00 1.25 15.50 26-Apr-04 0.00 0.00 0.00 15.00 3-May-04 0.00 0.00 0.00 11.50 10-May-04 0.00 0.00 0.00 10.00 17-May-04 0.00 0.00 0.00 7.00 24-May-04 0.00 0.00 0.00 4.50 31-May-04 0.00 0.00 0.00 1.50 7-Jun-04 0.00 0.00 0.00 0.00 14-Jun-04 0.00 0.00 0.00 0.00 21-Jun-04 0.00 0.00 0.00 0.00
TABLE 23. Hydrology data Manzanita Village vernal marshes year three (2004-2005)
West Anacapa East Anacapa Chumash Lake Manzanita 11-Oct-04 0.00 0.00 0.00 0.00
18-Oct-04 0.00 0.00 0.00 11.00 25-Oct-04 0.00 3.00 2.00 13.50 1-Nov-04 0.00 2.50 1.00 13.50 8-Nov-04 0.00 0.00 0.00 11.00 15-Nov-04 0.00 0.00 0.00 11.00 22-Nov-04 0.00 0.00 0.00 9.50

5 Year Performance Criteria Monitoring Report for Restored Wetlands at Manzanita Village
University of California, Santa Barbara, Cheadle Center for Biodiversity and Ecological Restoration 41
29-Nov-04 0.00 0.00 0.00 5.50 6-Dec-04 0.00 0.00 0.00 5.50 13-Dec-04 0.00 0.00 0.00 5.50 20-Dec-04 0.00 0.00 0.00 5.50 27-Dec-04 11.00 13.00 11.00 23.00 3-Jan-05 11.00 13.00 11.00 23.00 10-Jan-05 10.50 12.50 10.25 21.50 17-Jan-05 10.00 12.00 9.00 20.75 24-Jan-05 9.00 9.75 9.00 20.00 31-Jan-05 8.00 9.75 8.75 18.00 7-Feb-05 7.00 9.00 8.00 17.00 14-Feb-05 8.00 10.00 8.75 17.50 21-Feb-05 10.50 12.50 10.25 20.50 28-Feb-05 10.00 11.75 9.75 20.00 7-Mar-05 10.00 11.50 9.75 19.75 14-Mar-05 9.00 10.50 9.00 18.75 21-Mar-05 10.50 12.00 10.75 20.75 28-Mar-05 9.00 12.00 9.75 20.00 4-Apr-05 8.00 10.50 8.75 18.75 11-Apr-05 6.50 9.00 7.75 16.75 18-Apr-05 8.00 9.75 8.00 17.50 25-Apr-05 4.75 8.50 5.25 16.00 2-May-05 0.00 0.00 0.00 0.00
TABLE 24. Hydrology data Manzanita Village vernal marshes year four (2005-2006)
West Anacapa East Anacapa Chumash Lake Manzanita 6-Dec-05 0.00 0.00 0.00 21.75
13-Dec-05 0.00 0.00 0.00 20.75 20-Dec-05 0.00 0.00 0.00 18.00 29-Dec-05 0.00 0.00 0.00 16.00 5-Jan-06 9.00 11.25 15.00 19.00 12-Jan-06 8.00 10.50 12.50 18.00 19-Jan-06 7.50 9.75 10.00 17.00 26-Jan-06 6.50 8.50 8.00 16.00 2-Feb-06 5.75 7.50 6.00 15.00 9-Feb-06 4.75 6.75 3.50 15.00 16-Feb-06 4.00 5.50 0.00 12.50 23-Feb-06 3.75 5.50 0.00 13.25 1-Mar-06 7.50 9.75 9.75 21.75 8-Mar-06 7.50 9.75 9.50 20.50 16-Mar-06 8.00 10.50 9.25 19.00 23-Mar-06 7.50 10.00 9.75 19.00 30-Mar-06 9.00 11.25 12.00 19.50

5 Year Performance Criteria Monitoring Report for Restored Wetlands at Manzanita Village
University of California, Santa Barbara, Cheadle Center for Biodiversity and Ecological Restoration 42
6-Apr_06 10.00 12.25 16.50 20.00 13-Apr_06 9.00 11.50 13.25 19.00 20-Apr_06 9.00 11.00 11.00 19.00 27-Apr_06 8.50 11.00 8.50 18.50 4-May-06 7.50 9.50 5.50 17.50 11-May-06 6.50 8.75 1.50 17.00 18-May-06 6.00 7.75 0.00 16.75 25-May-06 7.00 9.50 3.50 16.25 30-May-06 5.75 7.75 0.00 16.00 1-Jun-06 3.50 5.00 0.00 14.00 8-Jun-06 1.50 2.50 0.00 12.00 15-Jun-06 0.50 1.00 0.00 10.00 22-Jun-06 0.00 0.00 0.00 8.00 29-Jun-06 0.00 0.00 0.00 6.00 6-Jul-06 0.00 0.00 0.00 4.00 13-Jul-06 0.00 0.00 0.00 2.00 20-Jul-06 0.00 0.00 0.00 0.00 27-Jul-06 0.00 0.00 0.00 0.00
TABLE 25. Hydrology data Manzanita Village vernal marshes year five (2006-2007)
West Anacapa East Anacapa Chumash Lake Manzanita 2-Feb-07 0.00 0.00 0.00 10.50
9-Feb-07 0.00 0.00 0.00 10.00 16-Feb-07 2.00 3.50 0.00 12.50 23-Feb-07 4.80 6.80 6.50 10.00 1-Mar-07 3.50 5.00 2.50 8.00 8-Mar-07 2.20 4.00 0.00 5.50 16-Mar-07 1.60 2.80 0.00 3.00 23-Mar-07 0.00 0.50 0.00 1.50 30-Mar-07 0.00 0.00 0.00 1.00
TABLE 26. Percent native plant cover and performance criteria over 5 years for the Manzanita Village vernal meadows
% Native Cover Year 1 Year 2 Year 3 Year 4 Year 5 South Drain 20.9 90.2 79.4 79.5 84 Bluff Wetland 50.6 52.5 59.8 85.2 70.2 Performance Criteria 20 50 50 50 75

5 Year Performance Criteria Monitoring Report for Restored Wetlands at Manzanita Village
University of California, Santa Barbara, Cheadle Center for Biodiversity and Ecological Restoration 43
TABLE 27. Species richness and performance criteria of the Manzanita Village vernal meadows
Species Richness Year 1 Year 2 Year 3 Year 4 Year 5 South Drain 17 31 35 30 18 Bluff Wetland 9 11 8 8 7 Performance Criteria 5 7 7 7 7
TABLE 28. Native plant species found in the vernal meadows and surrounding upland at the Manzanita Village
Vernal Meadows Plant Species Year 1 Year 2 Year 3 Year 4 Year 5 Ambrosia psilostachya x x x x x Anemopsis californica x x x x Artemisia californica x x Artemesia douglasiana x x x x Aster subulatus x Atriplex californica x x x Atriplex coulteri Atriplex lentiformis x x x x x Baccharis douglasii Baccharis pilularis x x x x x Baccharis salicifolia Calystegia macrostegia Carex praegracilis Centromadia parryi ssp. australis x x x x Corethrogyne filaginifolia x x Cyperus esculentus x x Datura wrightii x Distichlis spicata x x x x Eleocharis acicularis Eleocharis macrostachya x x x x Eleocharis montevidensis Encelia californica x x x x x Eriogonum parvifolium x x x x Eryngium armatum Eryngium vaseyi x x x x Eschscholzia californica x x x Euthamia occidentalis x x x x x Frankenia salina x x x x

5 Year Performance Criteria Monitoring Report for Restored Wetlands at Manzanita Village
University of California, Santa Barbara, Cheadle Center for Biodiversity and Ecological Restoration 44
Vernal Meadows Plant Species Year 1 Year 2 Year 3 Year 4 Year 5 Grindelia camporum x x x x Hordeum br ssp. brachyantherum x x x x Hordeum br ssp. californicum x x Isocoma menziesii x x x x x Juncus bufonius x x Juncus occidentalis x x Juncus patens x x x x x Juncus phaeocephalus x x x x x Juncus textilis Lessingia filaginifolia x x Leymus condensatus x x x x Leymus triticoides x x x x x Lotus salsuginosis Lupinus succulentus x x Malacothrix saxatilis x Mimulus aurantiacus x Nassella pulchra x x x x Oxalis albicans Phacelia ramosissima x Phalaris lemmonii Plagiobothrys undulates Psilocarphus brevissimus Rhus integrifolia x x x x x Rumex salicifolius Salicornia virginica x Salix lasiolepis x x Schoenoplectus americanus Schoenoplectus californicus Schoenoplectus cernuus Schoenoplectus maritimus Schoenoplectus pungens x x x Sisyrinchium bellum x x x x Spergularia macrotheca x x Stachys ajugoides x Symphyotrichum chilense x x x x Verbena lasiostachys x x x Zeltnera muehlenbergii x x
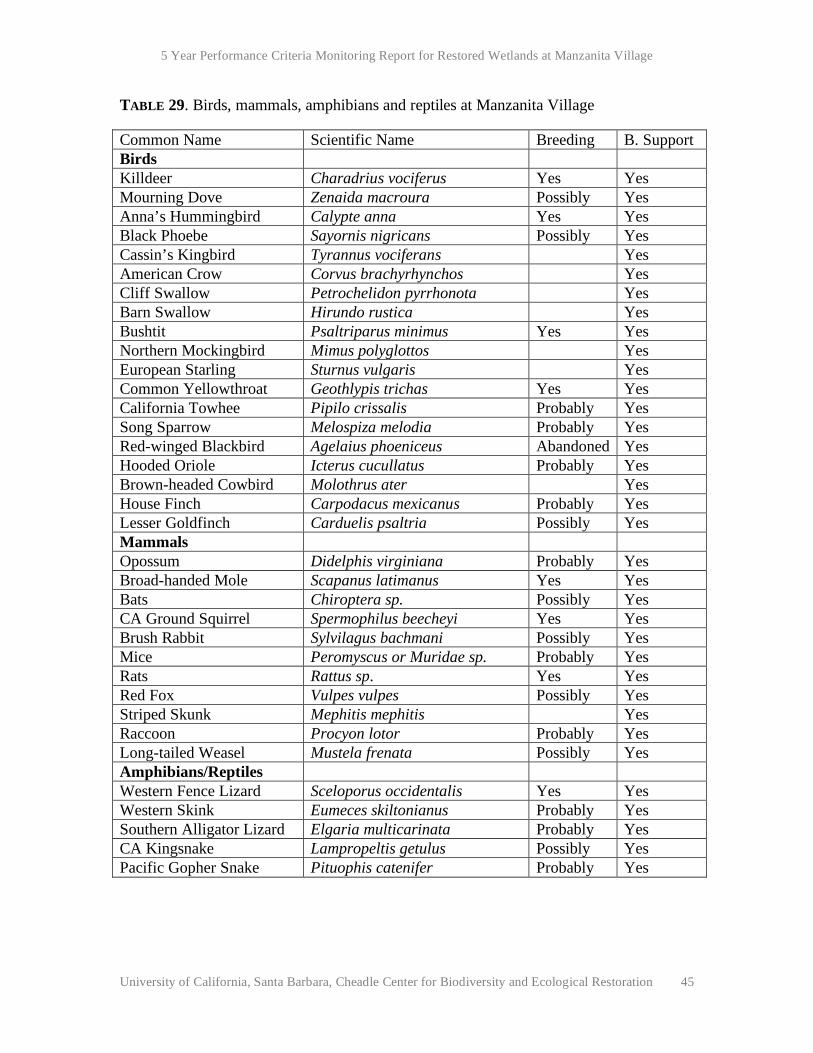
5 Year Performance Criteria Monitoring Report for Restored Wetlands at Manzanita Village
University of California, Santa Barbara, Cheadle Center for Biodiversity and Ecological Restoration 45
TABLE 29. Birds, mammals, amphibians and reptiles at Manzanita Village
Common Name Scientific Name Breeding B. Support Birds Killdeer Charadrius vociferus Yes Yes Mourning Dove Zenaida macroura Possibly Yes Anna’s Hummingbird Calypte anna Yes Yes Black Phoebe Sayornis nigricans Possibly Yes Cassin’s Kingbird Tyrannus vociferans Yes American Crow Corvus brachyrhynchos Yes Cliff Swallow Petrochelidon pyrrhonota Yes Barn Swallow Hirundo rustica Yes Bushtit Psaltriparus minimus Yes Yes Northern Mockingbird Mimus polyglottos Yes European Starling Sturnus vulgaris Yes Common Yellowthroat Geothlypis trichas Yes Yes California Towhee Pipilo crissalis Probably Yes Song Sparrow Melospiza melodia Probably Yes Red-winged Blackbird Agelaius phoeniceus Abandoned Yes Hooded Oriole Icterus cucullatus Probably Yes Brown-headed Cowbird Molothrus ater Yes House Finch Carpodacus mexicanus Probably Yes Lesser Goldfinch Carduelis psaltria Possibly Yes Mammals Opossum Didelphis virginiana Probably Yes Broad-handed Mole Scapanus latimanus Yes Yes Bats Chiroptera sp. Possibly Yes CA Ground Squirrel Spermophilus beecheyi Yes Yes Brush Rabbit Sylvilagus bachmani Possibly Yes Mice Peromyscus or Muridae sp. Probably Yes Rats Rattus sp. Yes Yes Red Fox Vulpes vulpes Possibly Yes Striped Skunk Mephitis mephitis Yes Raccoon Procyon lotor Probably Yes Long-tailed Weasel Mustela frenata Possibly Yes Amphibians/Reptiles Western Fence Lizard Sceloporus occidentalis Yes Yes Western Skink Eumeces skiltonianus Probably Yes Southern Alligator Lizard Elgaria multicarinata Probably Yes CA Kingsnake Lampropeltis getulus Possibly Yes Pacific Gopher Snake Pituophis catenifer Probably Yes
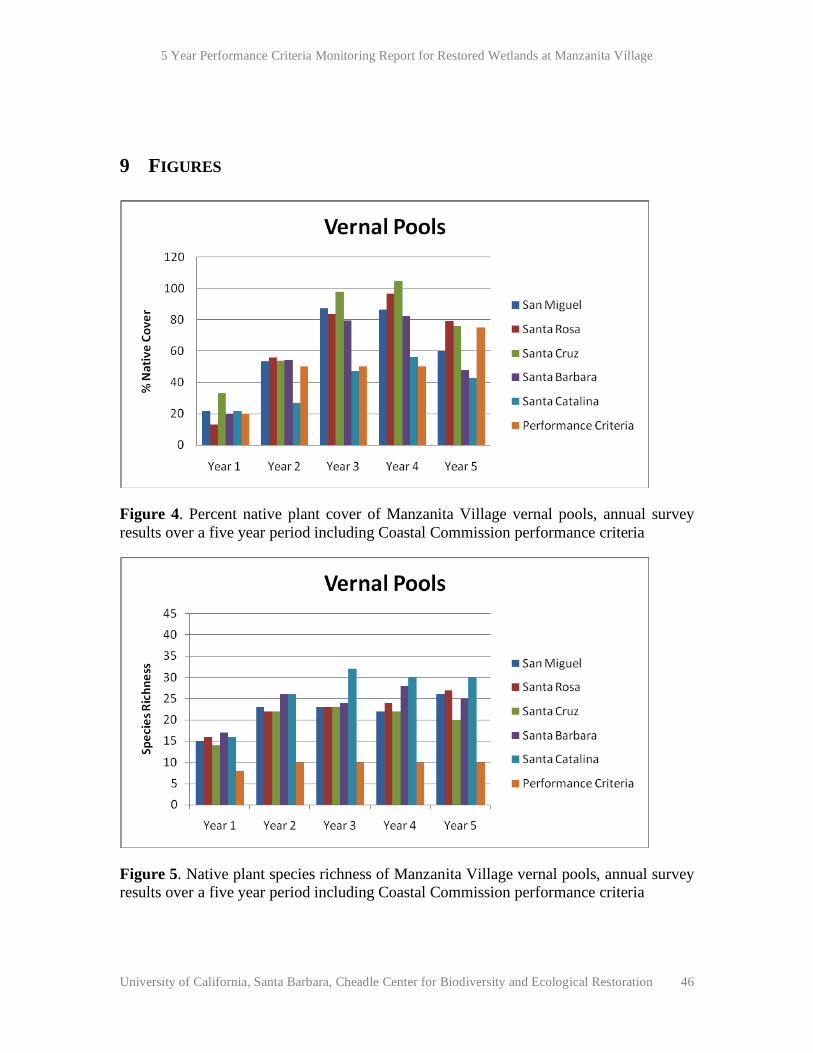
5 Year Performance Criteria Monitoring Report for Restored Wetlands at Manzanita Village
University of California, Santa Barbara, Cheadle Center for Biodiversity and Ecological Restoration 46
9 FIGURES
Figure 4. Percent native plant cover of Manzanita Village vernal pools, annual survey results over a five year period including Coastal Commission performance criteria
Figure 5. Native plant species richness of Manzanita Village vernal pools, annual survey results over a five year period including Coastal Commission performance criteria

5 Year Performance Criteria Monitoring Report for Restored Wetlands at Manzanita Village
University of California, Santa Barbara, Cheadle Center for Biodiversity and Ecological Restoration 47
Figure 6. Hydrology data for Manzanita Village vernal pools, annual survey results for year one 2002-2003
Figure 7. Hydrology data for Manzanita Village vernal pools, annual survey results for year two 2003-2004

5 Year Performance Criteria Monitoring Report for Restored Wetlands at Manzanita Village
University of California, Santa Barbara, Cheadle Center for Biodiversity and Ecological Restoration 48
Figure 8. Hydrology data for Manzanita Village vernal pools, annual survey results for year three 2004-2005
Figure 9. Hydrology data for Manzanita Village vernal pools, annual survey results for year four 2005-2006
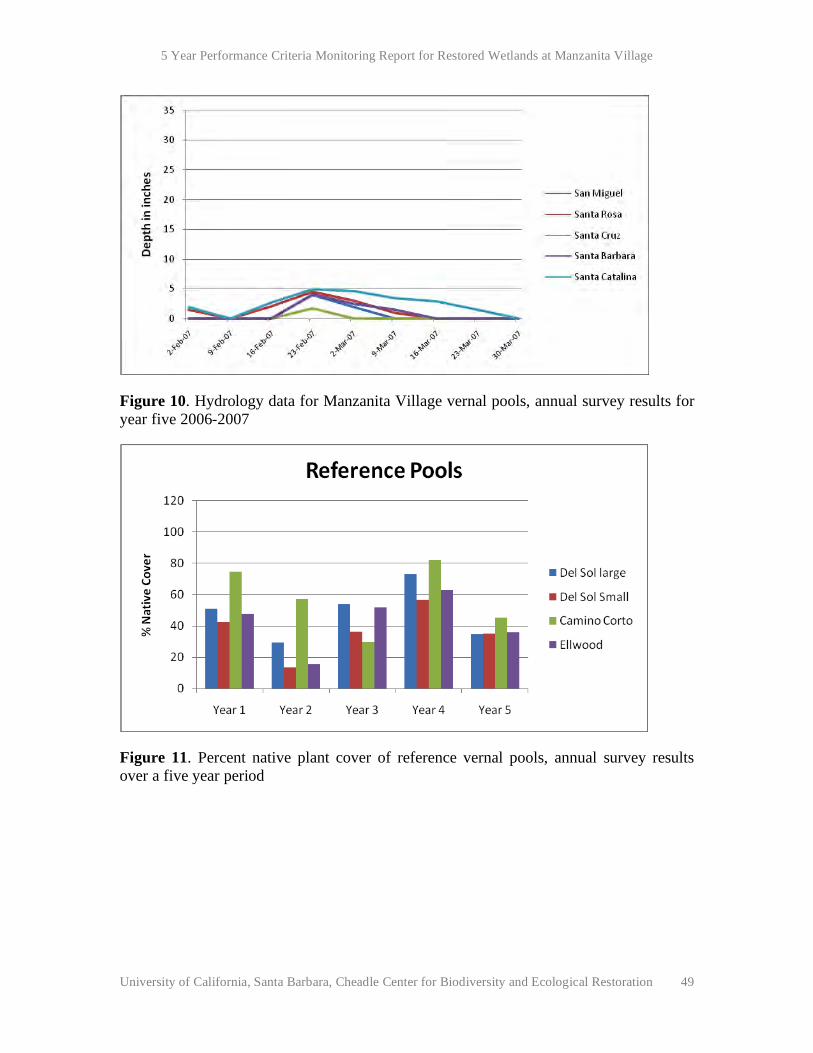
5 Year Performance Criteria Monitoring Report for Restored Wetlands at Manzanita Village
University of California, Santa Barbara, Cheadle Center for Biodiversity and Ecological Restoration 49
Figure 10. Hydrology data for Manzanita Village vernal pools, annual survey results for year five 2006-2007
Figure 11. Percent native plant cover of reference vernal pools, annual survey results over a five year period

5 Year Performance Criteria Monitoring Report for Restored Wetlands at Manzanita Village
University of California, Santa Barbara, Cheadle Center for Biodiversity and Ecological Restoration 50
Figure 12. Native plant species richness of reference vernal pools, annual survey results over a five year period
Figure 13. Hydrology data for reference vernal pools, annual survey results for year one 2002-2003

5 Year Performance Criteria Monitoring Report for Restored Wetlands at Manzanita Village
University of California, Santa Barbara, Cheadle Center for Biodiversity and Ecological Restoration 51
Figure 14. Hydrology data for reference vernal pools, annual survey results for year two 2003-2004
Figure 15. Hydrology data for reference vernal pools, annual survey results for year three 2004-2005

5 Year Performance Criteria Monitoring Report for Restored Wetlands at Manzanita Village
University of California, Santa Barbara, Cheadle Center for Biodiversity and Ecological Restoration 52
Figure 16. Hydrology data for reference vernal pools, annual survey results for year four 2005-2006
Figure 17. Hydrology data for reference vernal pools, annual survey results for year five 2006-2007
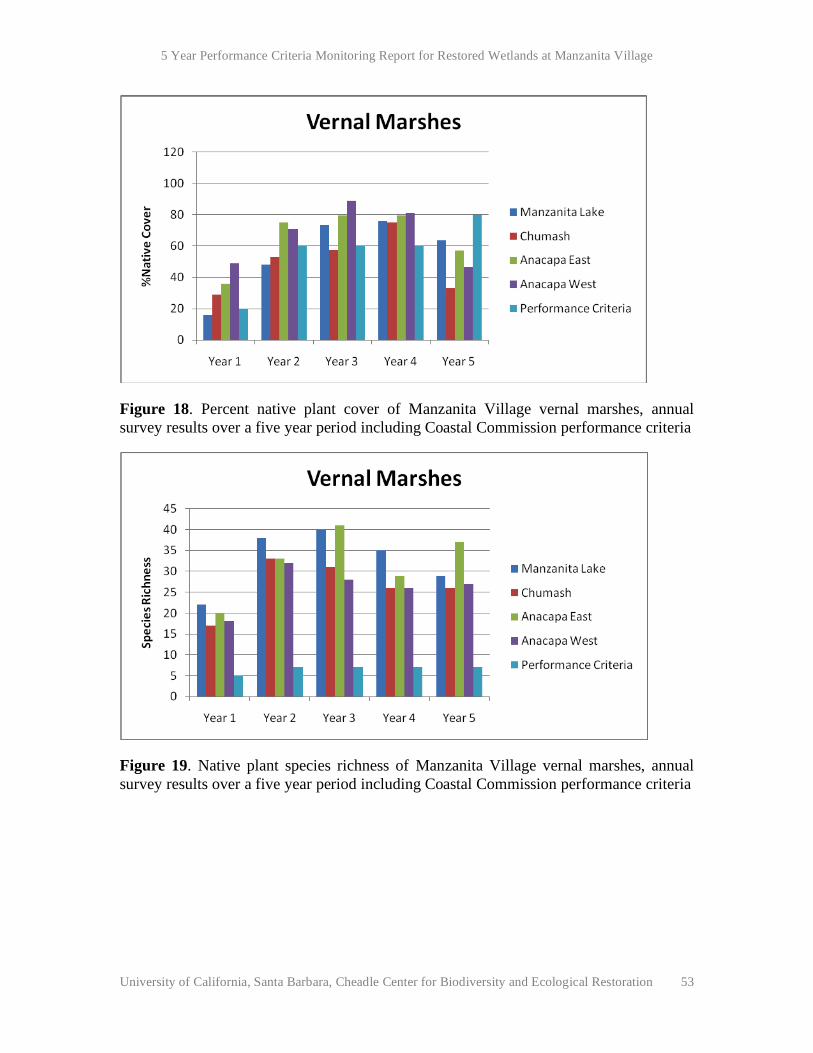
5 Year Performance Criteria Monitoring Report for Restored Wetlands at Manzanita Village
University of California, Santa Barbara, Cheadle Center for Biodiversity and Ecological Restoration 53
Figure 18. Percent native plant cover of Manzanita Village vernal marshes, annual survey results over a five year period including Coastal Commission performance criteria
Figure 19. Native plant species richness of Manzanita Village vernal marshes, annual survey results over a five year period including Coastal Commission performance criteria

5 Year Performance Criteria Monitoring Report for Restored Wetlands at Manzanita Village
University of California, Santa Barbara, Cheadle Center for Biodiversity and Ecological Restoration 54
Figure 20. Hydrology data for Manzanita Village vernal marshes, annual survey results for year one 2002-2003
Figure 21. Hydrology data for Manzanita Village vernal marshes, annual survey results for year two 2003-2004

5 Year Performance Criteria Monitoring Report for Restored Wetlands at Manzanita Village
University of California, Santa Barbara, Cheadle Center for Biodiversity and Ecological Restoration 55
Figure 22. Hydrology data for Manzanita Village vernal marshes, annual survey results for year three 2004-2005
Figure 23. Hydrology data for Manzanita Village vernal marshes, annual survey results for year four 2005-2006

5 Year Performance Criteria Monitoring Report for Restored Wetlands at Manzanita Village
University of California, Santa Barbara, Cheadle Center for Biodiversity and Ecological Restoration 56
Figure 24. Hydrology data for Manzanita Village vernal marshes, annual survey results for year five 2006-2007
Figure 25. Percent native plant cover of Manzanita Village vernal meadows, annual survey results over a five year period including Coastal Commission performance criteria

5 Year Performance Criteria Monitoring Report for Restored Wetlands at Manzanita Village
University of California, Santa Barbara, Cheadle Center for Biodiversity and Ecological Restoration 57
Figure 26. Native plant species richness of Manzanita Village vernal meadows, annual survey results over a five year period including Coastal Commission performance criteria

5 Year Performance Criteria Monitoring Report for Restored Wetlands at Manzanita Village
University of California, Santa Barbara, Cheadle Center for Biodiversity and Ecological Restoration 58
10 APPENDIX A: PROJECT STAFF
Bree Belyea, Manzanita Village Restoration Coordinator (2004-2007)
Alison Breazeale, Manzanita Village Restoration Coordinator (2002-2004)
Kelly Campbell, Interpretation Coordinator (2004-2007)
Wayne Chapman, Greenhouse and Nursery Manager (2002-2007)
Melanie Dunbar, Manzanita Village Restoration Project Manager (2002-2007)
Wayne Ferren, Manzanita Village Restoration Director (2002-2004)
Mauricio Gomez, Manzanita Village Restoration Coordinator (2002-2004)
Dave Harris, Manzanita Village Restoration Coordinator (2005-2007)
Hideyo Hattori, Manzanita Village Restoration Coordinator (2002-2003)
Matthew James, Manzanita Village Restoration Coordinator (2002-2003)
Johanna LaClaire, Manzanita Village Restoration Coordinator (2002-2004)
Jan Myers, Manzanita Village Restoration Assistant and Site Manager (2006-2007)
Ben Reder, Manzanita Village Restoration Assistant (2002-2007)
Megan Snover, Manzanita Village Restoration Coordinator (2002-2004)
George Thomson, Manzanita Village Restoration Coordinator (2002-2007)
Megan Webb, Manzanita Village Restoration Assistant (2003-2004)
Andrew Webster, Manzanita Village Restoration Assistant (2003-2005)
FIGURE 6. Native plant species richness of

5 Year Performance Criteria Monitoring Report for Restored Wetlands at Manzanita Village
University of California, Santa Barbara, Cheadle Center for Biodiversity and Ecological Restoration 59
11 APPENDIX B: PHOTO DOCUMENTATION
San Miguel vernal pool (Spring 2003)
San Miguel vernal pool (Spring 2007)
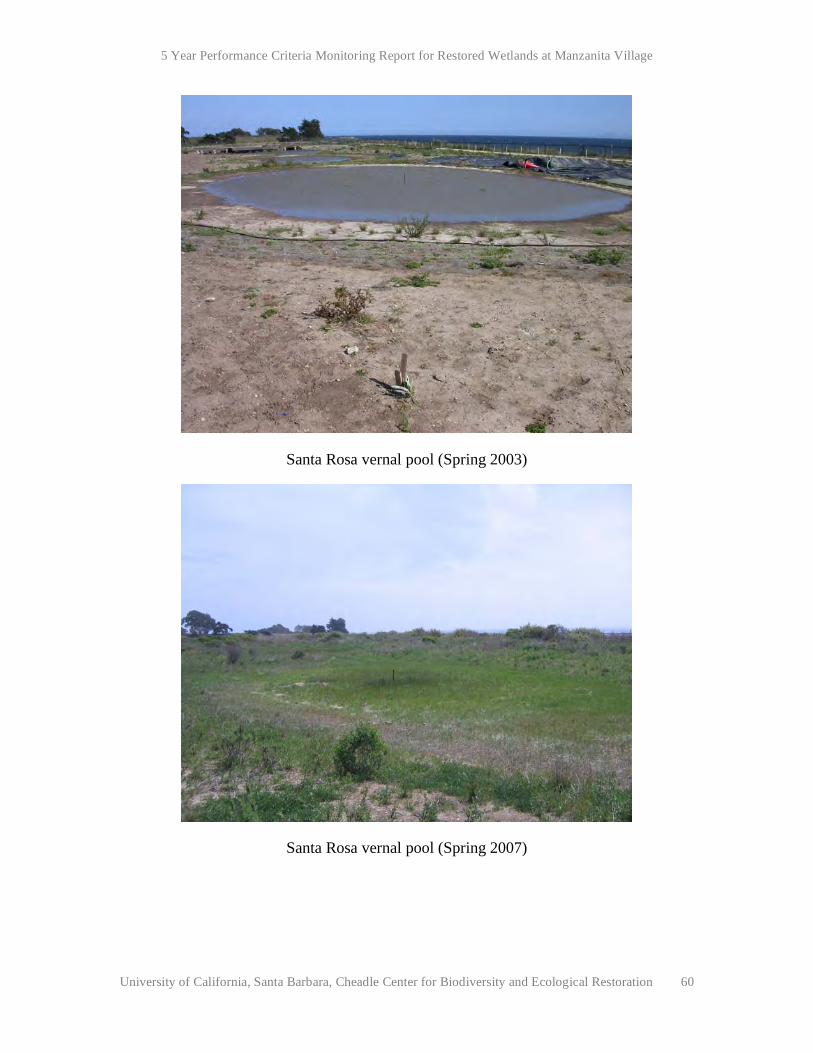
5 Year Performance Criteria Monitoring Report for Restored Wetlands at Manzanita Village
University of California, Santa Barbara, Cheadle Center for Biodiversity and Ecological Restoration 60
Santa Rosa vernal pool (Spring 2003)
Santa Rosa vernal pool (Spring 2007)

5 Year Performance Criteria Monitoring Report for Restored Wetlands at Manzanita Village
University of California, Santa Barbara, Cheadle Center for Biodiversity and Ecological Restoration 61
Santa Cruz vernal pool (Spring 2003)
Santa Cruz vernal pool (Spring 2007)

5 Year Performance Criteria Monitoring Report for Restored Wetlands at Manzanita Village
University of California, Santa Barbara, Cheadle Center for Biodiversity and Ecological Restoration 62
West Anacapa vernal marsh (Spring 2003)
West Anacapa vernal marsh (Spring 2007)
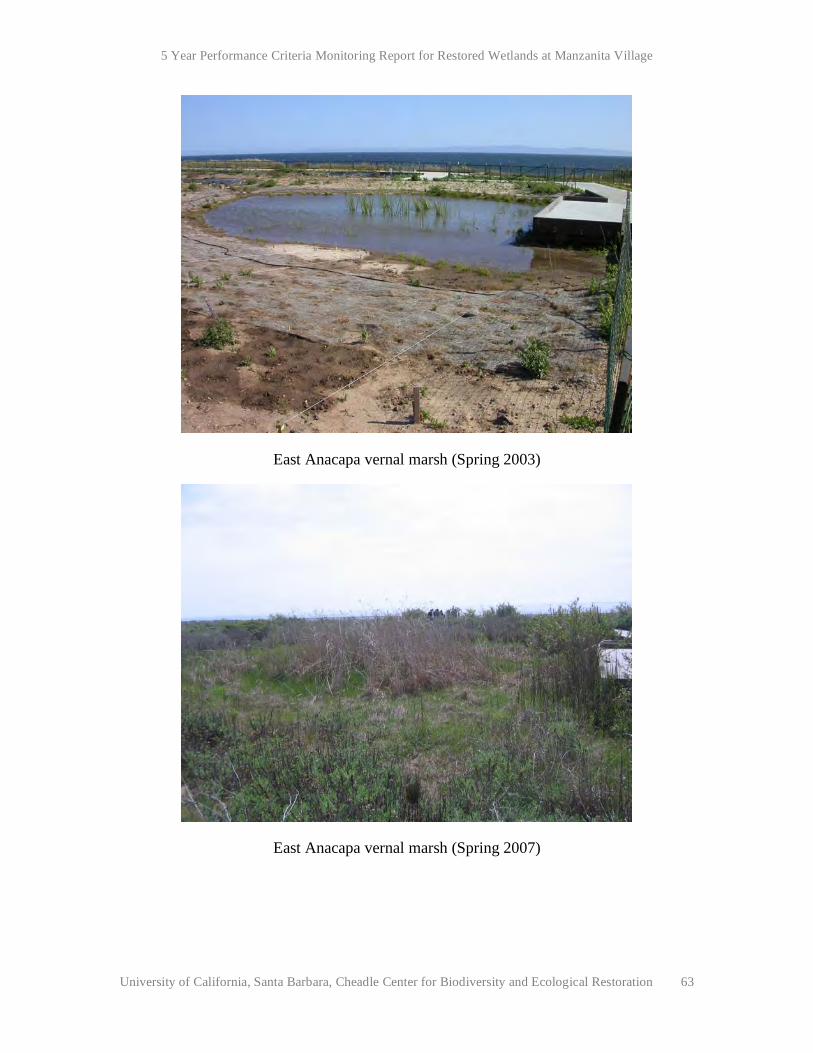
5 Year Performance Criteria Monitoring Report for Restored Wetlands at Manzanita Village
University of California, Santa Barbara, Cheadle Center for Biodiversity and Ecological Restoration 63
East Anacapa vernal marsh (Spring 2003)
East Anacapa vernal marsh (Spring 2007)
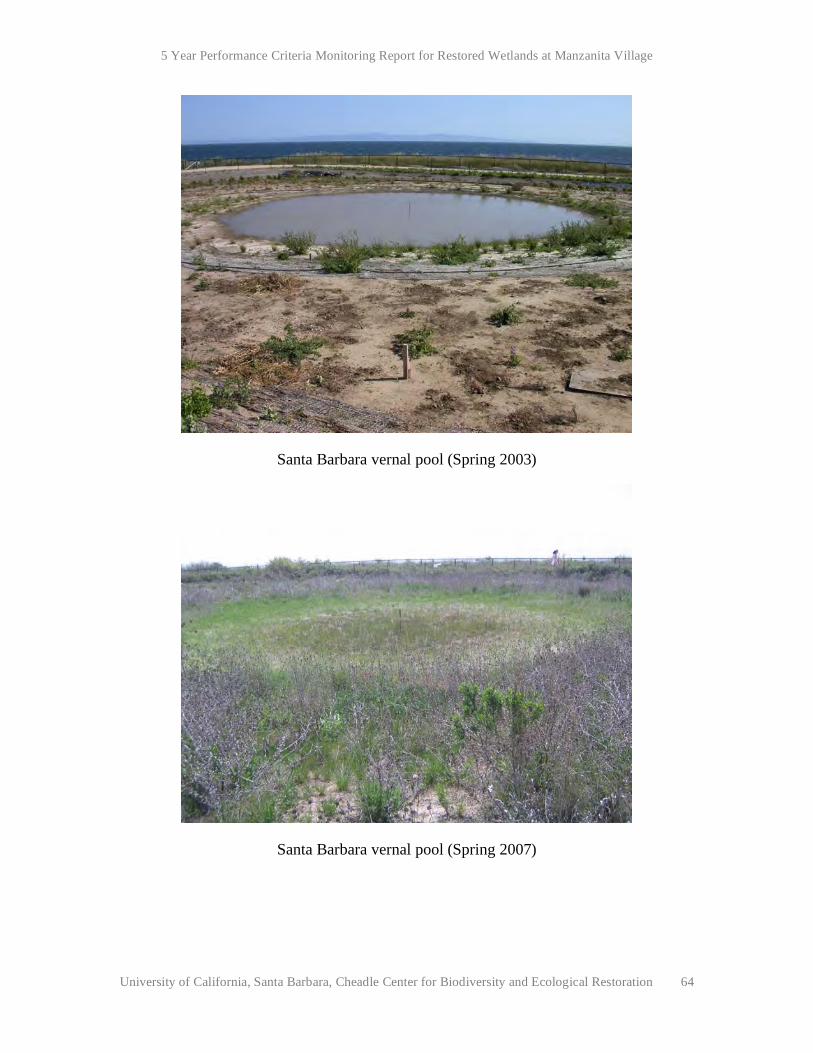
5 Year Performance Criteria Monitoring Report for Restored Wetlands at Manzanita Village
University of California, Santa Barbara, Cheadle Center for Biodiversity and Ecological Restoration 64
Santa Barbara vernal pool (Spring 2003)
Santa Barbara vernal pool (Spring 2007)

5 Year Performance Criteria Monitoring Report for Restored Wetlands at Manzanita Village
University of California, Santa Barbara, Cheadle Center for Biodiversity and Ecological Restoration 65
Santa Catalina vernal pool (Spring 2003)
Santa Catalina vernal pool (Spring 2007)
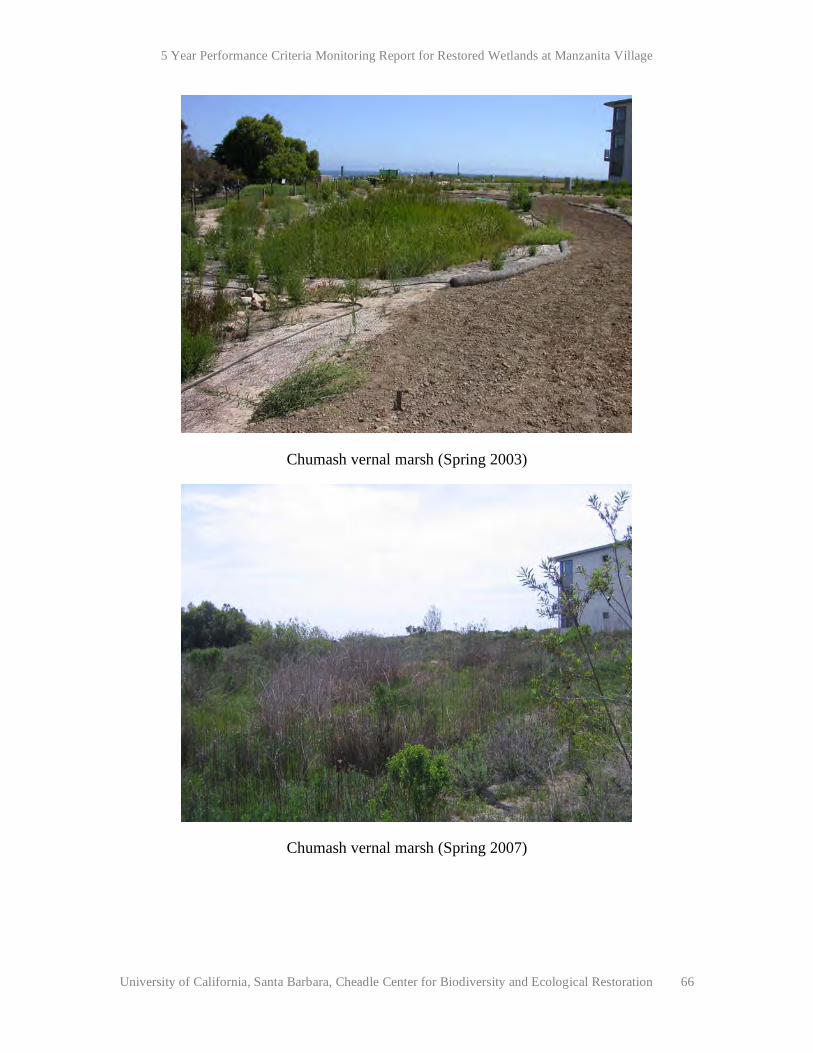
5 Year Performance Criteria Monitoring Report for Restored Wetlands at Manzanita Village
University of California, Santa Barbara, Cheadle Center for Biodiversity and Ecological Restoration 66
Chumash vernal marsh (Spring 2003)
Chumash vernal marsh (Spring 2007)

5 Year Performance Criteria Monitoring Report for Restored Wetlands at Manzanita Village
University of California, Santa Barbara, Cheadle Center for Biodiversity and Ecological Restoration 67
Manzanita Lake vernal marsh (Spring 2003)
Manzanita Lake vernal marsh (Spring 2003)
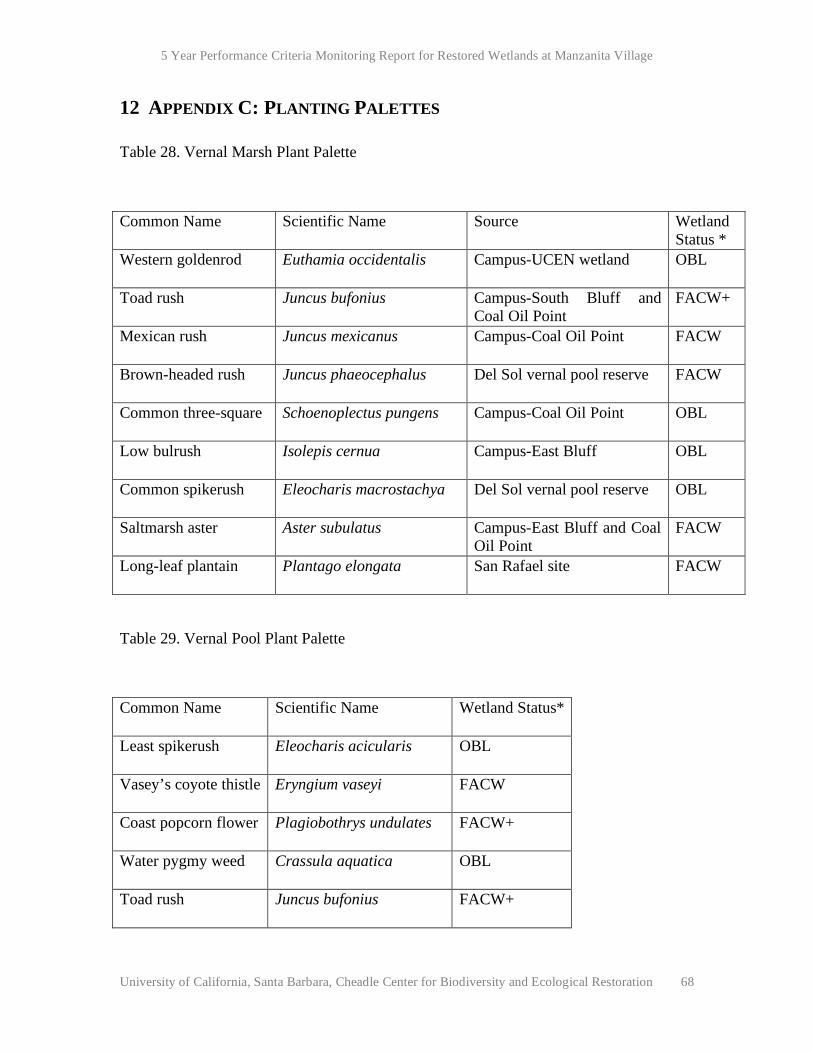
5 Year Performance Criteria Monitoring Report for Restored Wetlands at Manzanita Village
University of California, Santa Barbara, Cheadle Center for Biodiversity and Ecological Restoration 68
12 APPENDIX C: PLANTING PALETTES
Table 28. Vernal Marsh Plant Palette
Common Name Scientific Name Source Wetland Status *
Western goldenrod Euthamia occidentalis Campus-UCEN wetland OBL
Toad rush Juncus bufonius Campus-South Bluff and Coal Oil Point
FACW+
Mexican rush Juncus mexicanus Campus-Coal Oil Point FACW
Brown-headed rush Juncus phaeocephalus Del Sol vernal pool reserve FACW
Common three-square Schoenoplectus pungens Campus-Coal Oil Point OBL
Low bulrush Isolepis cernua Campus-East Bluff OBL
Common spikerush Eleocharis macrostachya Del Sol vernal pool reserve OBL
Saltmarsh aster Aster subulatus Campus-East Bluff and Coal Oil Point
FACW
Long-leaf plantain Plantago elongata San Rafael site FACW
Table 29. Vernal Pool Plant Palette
Common Name Scientific Name Wetland Status*
Least spikerush Eleocharis acicularis OBL
Vasey’s coyote thistle Eryngium vaseyi FACW
Coast popcorn flower Plagiobothrys undulates FACW+
Water pygmy weed Crassula aquatica OBL
Toad rush Juncus bufonius FACW+

5 Year Performance Criteria Monitoring Report for Restored Wetlands at Manzanita Village
University of California, Santa Barbara, Cheadle Center for Biodiversity and Ecological Restoration 69
Meadow barley Hordeum brachyantherum FACW
Common spikerush Eleocharis macrostachya OBL
Slender rush Juncus occidentalis FACW
Water wort Elatine brachysperma FACW
Dwarf wooly heads Psilocarphus brevissimus OBL
Table 30. Buffer Area Plant Palette
Common Name Scientific Name Source Wetland Status *
Southern Tarplant Centromadia parryi ssp. australis
San Rafael site FAC
Saltgrass Distichlis spicata San Rafael site FACW
Alkali rye-grass Leymus triticoides Campus-Coal Oil Point, S&S Seeds
FAC+
Gumplant Grindelia camporum Del Sol vernal pool reserve FACU
California brome Bromus carinatus Campus-North Bluss, S&S Seeds
UPL
Meadow barley Hordeum brachyantherum Campus-Lagoon area and Storke Campus
FACW
Blue-eyed grass Sisyrinchium bellum Campus-Northern Slough Finger, S&S Seeds
FAC
Purple needlegrass Nassella pulchra Campus-Coal Oil Point, Del Sol vernal pool reserve
UPL
Coastal goldenbush Isocoma menziesii Campus-Lagoon and Coal Oil Point, S&S Seeds
FACW
Bush Lupine Lupinus arboreus Campus-Lagoon and Coal Oil Point, S&S Seeds
UPL
Seacliff buckwheat Eriogonum parvifolium Campus-East Bluff and Coal Oil Point, S&S Seeds
UPL

5 Year Performance Criteria Monitoring Report for Restored Wetlands at Manzanita Village
University of California, Santa Barbara, Cheadle Center for Biodiversity and Ecological Restoration 70
*UPL: Upland, not commonly found in wetlands
FACU: Facultative upland, occasionally found in wetlands (1 to 33 percent of the time)
FAC: Facultative, occurs in wetlands 33 to 66 percent of the time
FACW: Facultative wetland, occurs in wetlands 67 to 99 percent of the time
OBL: Obligate wetland, occurs in wetlands greater than 99 percent of the time

12 Appendix d: informAtionAl And educAtionAl SignAge
Manzanita Permanent Signage
at Manzanita Village
Welcome to the
The Native Habitat Garden at Manzanita Village features five habitats that were once abundant on the UCSB Campus. The plants growing in this garden dominated our landscape hundreds of years ago, before the influence of modern civilization. Today, buildings, roads, and non-native plants cover most of the campus.
This garden, along with the Manzanita Village Restoration Project, provides opportunities for native plants to grow and reproduce. The area also serves as habitat for native animals such as birds, reptiles, and insects. Learn about our local ecology and discover the amazing surprises around you.
Coastal Sage Scrub Oak Woodland Grassland Coastal Dune Vernal Wetland
Look. Listen. What birds can you hear? Gulls squawking, a red-tail hawk screeching, sparrows and warblers singing? Do you see insects visiting flowers and lizards sunbathing on rocks?
Habitat Garden
Cheadle Center for Biodiversity and Ecological Restoration • http://ccber.lifesci.ucsb.edu • University of California santa BarBara
This garden is part of the Manzanita Village Restoration Project that began in 2002. It serves as an outdoor classroom that provides:
• Information about native plants, animals, and habitats• Inspiration and ideas for landscapers, naturalists, and artists • A quiet place to observe, think, learn, and enjoy
Featured Habitats
5 Year Performance Criteria Monitoring Report for Restored Wetlands at Manzanita Village
Vernal wetlands are shallow depressions, underlain with thick clay, that collect rain during the winter. The clay layer allows water to remain at the surface, instead of draining away. As spring changes to summer the water in the vernal wetlands evaporates directly to the atmosphere or is used by plants for growth and internal temperature regulation. Vernal wetlands fill up with water again the following winter, completing the annual drying-wetting cycle that make these habitats unique. There are two main types of vernal wetlands on campus, vernal marshes and vernal pools.Vernal marshes tend to be deeper than vernal pools and usually hold water for longer periods into the spring and summer, allowing larger plants to survive.
In Southern California over 90% of historic wetlands have been destroyed, reducing the important life-sustaining functions wetlands provide. Approximately 43% of federally threatened and endangered species depend on wetlands for their survival, highlighting the importance of protecting and restoring these habitats. Both vernal pools and vernal marshes have been created at the Manzanita Village Restoration Project. Can you find both types of vernal wetlands?
UplandWaterline
WetlandVernal Wetlands
Common SpikerushEleocharis macrostachya
Vasey’s Coyote ThistleEryngium vaseyi
Popcorn FlowerPlagiobothrys undulatus
Dwarf Woolly-headsPsilocarphus brevissimus
Needle SpikerushEleocharis acicularis
Lemmon’s Canary GrassPhalaris lemmonii
Manzanita Village Habitat Garden
Cheadle Center for Biodiversity and Ecological Restoration • http://ccber.lifesci.ucsb.edu • University of California santa BarBara
Manzanita Village
Vernal Wetland Species
University of California, Santa Barbara, Cheadle Center for Biodiversity and Ecological Restoration 71

Manzanita Temporary Signage
Bioswales
Clustered Field Sedge Carex praegracilis
Brown-headed RushJuncus phaeocephalus
Yerba Mansa Anemopsis californica
Basket RushJuncus textilis
Bioswales are constructed wetlands designed to aid the natural filtration of urban runoff water.
Bioswales provide:Storm water retention Water conveyanceImproved water quality Natural aesthetics
Ecosystem support for wildlife Sediment retention
To learn more about bioswale construction and native habitat restoration please contactthe Cheadle Center for Biodiverstiy and Ecological Restoration, UCSB at 893-2506
Western Goldenrod Euthamia occidentalis
Native Plants found in Manzanita Village Bioswales
5 Year Performance Criteria Monitoring Report for Restored Wetlands at Manzanita Village
University of California, Santa Barbara, Cheadle Center for Biodiversity and Ecological Restoration 72

5 Year Performance Criteria Monitoring Report for Restored Wetlands at Manzanita Village
University of California, Santa Barbara, Cheadle Center for Biodiversity and Ecological Restoration 73
13 Appendix e: grAding plAnS
Santa Barbara and Santa Catalina Vernal Pools
San Miguel, Santa Rosa, and Santa Cruz Vernal Pools, Anacapa East and Anacapa West Vernal Marshes
Lake Manzanita Vernal Marsh Chumash Vernal Marsh

5 Year Performance Criteria Monitoring Report for Restored Wetlands at Manzanita Village
University of California, Santa Barbara, Cheadle Center for Biodiversity and Ecological Restoration 74
14 Appendix f: AwArdS

5 Year Performance Criteria Monitoring Report for Restored Wetlands at Manzanita Village
University of California, Santa Barbara, Cheadle Center for Biodiversity and Ecological Restoration 75

5 Year Performance Criteria Monitoring Report for Restored Wetlands at Manzanita Village
University of California, Santa Barbara, Cheadle Center for Biodiversity and Ecological Restoration 76
16 LITERATURE AND REFERENCES CITED
California Coastal Commission. 1999. Notice of Impending Development 1-98 (UCSB)
Environmental Research Team, Department of Biological Sciences, University of California, Santa Barbara. 1988. Enhancement, Restoration, and Creation of Vernal Pools at Del Sol Open Space Reserve, Santa Barbara County, California
Padre Associates, Inc. 2000. Habitat Restoration, Wetland Enhancement and Monitoring Program
Reed, Porter B. Jr. 1988. National List of Plant Species That Occur In Wetlands: California (Region 0)
UCSB CCBER. 2001-2008. Field Notes from Manzanita Village
UCSB, Webster, Andy. 2006. Manzanita Village Biofiltration Project Implementation Report: Evaluation of Project Design and Water Quality Monitoring