5 water quality impact assessment 5.1 5 · pdf filetender no. afc/sq/58/03 establishing...
TRANSCRIPT

Drainage Services Department Agreement No. CE 41/2013 (EP)
Port Shelter Sewerage, Stage 3 – Sewerage Works at Po Toi O
Environmental Impact Assessment Studies - Investigation
Environmental Impact Assessment Report
IA13070/EIARpt v2.3 Cinotech 5-1
5 WATER QUALITY IMPACT ASSESSMENT
5.1 Introduction
5.1.1 This Chapter presents an assessment of the potential water quality impact arising from
the construction and operation of the Project. Mitigation measures have been
identified to alleviate the impact and their effectiveness has been evaluated.
5.2 Environmental Legislation, Standards and Guidelines
Water Pollution Control Ordinance (Cap. 358):
5.2.1 The Water Pollution Control Ordinance (Cap. 358) is the major legislation relating to
the protection and control of water quality in Hong Kong. According to the Ordinance
and its subsidiary legislation, Hong Kong waters are divided into ten water control
zones (WCZ). Corresponding statements of Water Quality Objectives (WQO) are
stipulated for different water regimes (marine waters, inland waters, bathing beaches
subzones, secondary contact recreation subzones and fish culture subzones) in each of
the WCZ based on their beneficial uses. The assessment area in this Project covers the
Port Shelter WCZ. The corresponding WQOs are listed in Table 5-1.
Table 5-1: Summary of Water Quality Objectives for Port Shelter WCZ
Parameters Objectives Sub-Zone Offensive odour, tints Not to be present Whole zone
Colour Not to exceed 50 Hazen units, due to human activity
Inland waters
Visible foam, oil scum, litter
Not to be present Whole zone
E coli Not to exceed 610 per 100mL, calculated as the geometric mean of all samples collected in one calendar year
Secondary Contact Recreation Subzone and Fish Culture Subzones
Not to exceed 180 per 100mL, calculated as the geometric mean of all samples collected from March to October inclusive in one calendar year.
Bathing Beach Subzones
Dissolved oxygen (DO) within 2 m of the seabed
Not less than 2 mg L-1 for 90% of samples
Marine waters including Fish Culture Subzones
Depth-averaged DO Not less than 4 mg L-1 for 90% of samples
Marine waters except Fish Culture Subzones
Not less than 5 mg L-1 for 90% of samples
Fish Culture Subzones
Dissolved Oxygen (DO)
Not less than 4.0 mg/L Inland waters

Drainage Services Department Agreement No. CE 41/2013 (EP)
Port Shelter Sewerage, Stage 3 – Sewerage Works at Po Toi O
Environmental Impact Assessment Studies - Investigation
Environmental Impact Assessment Report
IA13070/EIARpt v2.3 Cinotech 5-2
Parameters Objectives Sub-Zone pH To be in the range of 6.5 - 8.5, change
due to human activity not to exceed 0.2 Inland water in Ho Chung (A) Sub-zone. Marine waters except Bathing Beach Subzones
Not to exceed the range of 6.0 - 9.0 due to human activity
Bathing Beach Subzones
Salinity Change due to human activity not to exceed 10% of ambient
Whole zone
Temperature Change due to human activity not to exceed 2oC
Whole zone
Suspended solids (SS) Not to raise the ambient level by 30% caused by human activity
Marine waters
Annual median not to exceed 25 mg/L due to human activity
Inland waters
Ammonia (NH3-N)
Annual mean not to exceed 0.021 mg(N)/l as unionized form
Whole zone
Nutrients Shall not cause excessive algal growth or other aquatic plants.
Marine waters
Annual mean depth-averaged inorganic nitrogen not to exceed 0.1 mg/L
Total inorganic nitrogen (TIN)
Annual mean depth-averaged inorganic nitrogen not to exceed 0.1 mg(N)/l
Marine waters
5-Day biochemical oxygen demand (BOD5)
Not to exceed 5 mg/L Inland waters
Chemical Oxygen Demand (COD)
Not to exceed 30 mg/L Inland waters
Phenol Shall not be present in such quantities as to produce a specific odour, or in concentrations greater than 0.05 mg per litre as C6H5OH
Bathing Beach Subzones
Dangerous substances Should not attain such levels as to produce significant toxic, carcinogenic, mutagenic or teratogenic effects in humans, fish or any other aquatic organisms.
Whole zone
Human activity should not cause a risk to any beneficial use of the aquatic environment.
Whole zone
Turbidity No changes in turbidity or other factors arising from waste discharges shall reduce light transmission substantially from the normal level.
Bathing Beach Subzones
Source: Statement of Water Quality Objectives (Port Shelter Water Control Zone)
Technical Memorandum on Effluent Discharge Standard
5.2.2 Beside setting the WQOs, the WPCO controls effluent discharging into the WCZs
through a licensing system. Guidance on the permissible effluent discharges based on
the type of receiving waters (foul sewers, stormwater drains, inland and coastal
waters) is provided in the Technical Memorandum on Standards for Effluents
Discharged into Drainage and Sewerage Systems, Inland and Coastal Waters (TM-

Drainage Services Department Agreement No. CE 41/2013 (EP)
Port Shelter Sewerage, Stage 3 – Sewerage Works at Po Toi O
Environmental Impact Assessment Studies - Investigation
Environmental Impact Assessment Report
IA13070/EIARpt v2.3 Cinotech 5-3
DSS). The limits given in the TM cover the physical, chemical and microbial quality
of effluents. Any effluent discharge during the construction and operational stages
should comply with the standards for effluents discharged into the inshore waters or
marine waters. The standards of effluents for this project is summarized in Table 5-2.
Table 5-2: Standards for Effluents Discharged into the Coastal Waters of Tolo
and Port Shelter Water Control Zones
Flow rate
(m3/day) ≦ 10
>10
and
≦ 200
>200
and
≦ 400
>400
and
≦ 600
>600
and
≦ 800
>800
and
≦ 1000
>1000
and
≦ 1500
>1500
and
≦ 2000
>2000
and
≦ 3000
>3000
and
≦ 4000
>4000
and
≦ 5000
>5000
and
≦ 6000 Determined
pH (pH units) 6-9 6-9 6-9 6-9 6-9 6-9 6-9 6-9 6-9 6-9 6-9 6-9
Temperature (∘ C) 45 45 45 45 45 45 45 45 45 45 45 45
Colour (lovibond
units) (25mm cell
length)
1 1 1 1 1 1 1 1 1 1 1 1
Suspended solids 30 30 30 30 30 30 15 15 15 15 15 15
BOD 20 20 20 20 20 20 10 10 10 10 10 10
COD 80 80 80 80 80 80 50 50 50 50 50 50
Oil & Grease 20 20 20 20 20 20 10 10 10 10 10 10
Iron 10 10 10 7 5 4 2.7 2 1.3 1 0.8 0.6
Boron 5 4 3 2.5 2 1.6 1.1 0.8 0.5 0.4 0.3 0.2
Barium 5 4 3 2.5 2 1.6 1.1 0.8 0.5 0.4 0.3 0.2
Mercury 0.1 0.001 0.001 0.001 0.001 0.001 0.001 0.001 0.001 0.001 0.001 0.001
Cadmium 0.1 0.001 0.001 0.001 0.001 0.001 0.001 0.001 0.001 0.001 0.001 0.001
Other toxic metals
individually 1 1 0.8 0.5 0.5 0.4 0.1 0.1 0.1 0.1 0.1 0.1
Total toxic metals 2 2 1.6 1 1 0.8 0.2 0.2 0.2 0.2 0.14 0.1
Cyanide 0.1 0.1 0.1 0.1 0.1 0.1 0.05 0.05 0.03 0.02 0.02 0.01
Phenols 0.5 0.5 0.5 0.25 0.25 0.25 0.1 0.1 0.1 0.1 0.1 0.1
Sulphide 5 5 5 5 5 5 2.5 2.5 2.5 1 1 0.5
Total residual
chlorine 1 1 1 1 1 1 1 1 1 1 1 1
Total nitrogen 20 20 20 15 15 15 15 15 10 10 10 10
Total phosphorus 8 8 5 5 5 5 5 5 5 5 5 5
Surfactants (total) 15 15 15 15 15 15 10 10 10 10 10 10
E. coli
(count/100ml) 1000 1000 1000 1000 1000 1000 1000 1000 1000 1000 1000 1000
Notes:
1 All units in mg/L unless otherwise stated;
2 All figures are upper limits unless otherwise indicated.
Practice Notes
5.2.3 A practice note (PN) for professional persons was issued by the EPD to provide
environmental guidelines for the handling and disposal of construction site discharges.
The Practice Note (PN) for Professional Persons on “Construction Site Drainage”
(ProPECC PN 1/94) issued by EPD provides good practice guidelines for dealing with
ten types of discharge from a construction site. These include surface runoff,
groundwater, boring and drilling water, bentonite slurry, water for testing and
sterilisation of water retaining structures and water pipes, wastewater from building
constructions, acid cleaning, etching and picking wastewater, and waste water from
site facilities. Practices outlined in the ProPECC PN 1/94 should be followed as far as
possible during construction to minimize the water quality impact due to construction

Drainage Services Department Agreement No. CE 41/2013 (EP)
Port Shelter Sewerage, Stage 3 – Sewerage Works at Po Toi O
Environmental Impact Assessment Studies - Investigation
Environmental Impact Assessment Report
IA13070/EIARpt v2.3 Cinotech 5-4
site drainage.
Recommendations from Literature
5.2.4 Assessment criteria for corals were also reviewed through literature search.
According to the studies by Pastororok & Bilyard1, Hawker & Connel2, Erftemeijer et.
al. 3 and Golbuu et.al. 4 on coral reef, sedimentation rate and suspended solid
concentration are important on coral survival and growth. The overall environmental
criteria for coral from these papers have been included in the report: the sedimentation
rate should be less than 0.1kg/m2/day. With reference to a past AFCD study, elevation
in suspended solids concentration should be no more than 10 mg/L or smaller than
30% from baseline for avoiding unacceptable impact on coral5.
5.3 Description of the Environment
5.3.1. The Study Area covers Po Toi O bay, Clearwater Bay and waters surrounding Steep
Island as shown in Figure 5-3.
5.3.2. The project site (area covered within the proposed work boundary in Figure 1-1) is
located within Port Shelter WCZ where water quality was rated as “good” in 2011 for
its high dissolved oxygen, low nutrients (total inorganic nitrogen) and E. coli levels6.
The compliance rate of water quality objectives was reduced in 2012 due to
exceedance in total inorganic nitrogen 7 . This was probably caused by increased
shipping and port activities in the eastern waters7. Despite the water quality was rated
as “good” again in 2013, an increasing trend for TIN was recorded during the period
from 2009 to 20138.
5.3.3. The nearest water quality monitoring station maintained by EPD is MM19, which is
located between Steep Island and Ninepin Group (Kwo Chau Islands), and about 3 km
from Po Toi O mouth. The latest 5-year (2009-2013) water quality at MM19 is
summarized in the Table 5-3.
1 Pastorok, R.A. and Bilyard, G.R. (1985). “Effects of sewage pollution on coral-reef communities.” Marine
Ecology Progress Series 21: 175-189.
2 Hawker, D. W. and Connell, D. W. (1992). “Standards and Criteria for Pollution Control in Coral Reef Areas”
in Connell, D. W and Hawker, D. W. (eds.), Pollution in Tropical Aquatic Systems, CRC Press, Inc. 3 Erftemeijer P. L.A., Riegl B., Hoeksema B. W. & Todd P. A.. (2012). “Environmental impacts of dredging and
other sediment disturbances on corals: A review”. Marine Pollution Bulletin Volume 64, Issue 9, September
2012, Pages 1737–1765
4 Golbuu Y., van Woesik R., Richmond R. H., Harrison P. & Fabricius K. E.. (2011). “River discharge reduces
reef coral diversity in Palau”. Marine Pollution Bulletin Volume 62, Issue 4, April 2011, Pages 824–831 5 AFCD. 2005. Tender No. AFC/SQ/58/03 Establishing threshold tolerance of local corals to sedimentation,
Final Report. 6 EPD. 2012. Marine Water Quality in Hong Kong in 2011. [online] http://wqrc.epd.gov.hk/pdf/water-
quality/annual-report/Marine2011EN.pdf. Accessed: 26 August 2015.
7 EPD. 2013. Marine Water Quality in Hong Kong in 2012. [online]
http://wqrc.epd.gov.hk/pdf/water-quality/annual-report/Report2012eng.pdf. Accessed: 26 August 2015.
8 EPD. 2014. Marine Water Quality in Hong Kong in 2013. [online] http://wqrc.epd.gov.hk/pdf/water-
quality/annual-report/MarineReport2013eng.pdf. Accessed: 26 August 2015.

Drainage Services Department Agreement No. CE 41/2013 (EP)
Port Shelter Sewerage, Stage 3 – Sewerage Works at Po Toi O
Environmental Impact Assessment Studies - Investigation
Environmental Impact Assessment Report
IA13070/EIARpt v2.3 Cinotech 5-5
Table 5-3: Water Quality Monitoring Results at MM19 from 2009 to 2013
Parameters 2009 2010 2011 2012 2013 Mean
pH 8.1 8.0 8.0 7.9 8.1 8.0
(8 - 8.3) (7.7 - 8.2) (7.8 - 8.3) (7.5 - 8.1) (7.8 - 8.3) -
Salinity
(psu)
33.3 32.9 33.1 32.5 32.4 32.9
(31.9 - 34) (31.5 - 33.9) (31.8 - 34) (31.5 - 33.6) (31.1 - 33.5) -
Turbidity
(NTU)
4.5 4.5 2.4 2.2 10.1 4.2
(0.8 - 11.1) (1.1 - 20.4) (1 - 5.6) (1.2 - 3.9) (1.2 – 88.7) -
Temperature
(°C)
23.4 22.3 22.2 22.6 22.7 22.6
(18 - 29.1) (17.1 - 27.5) (15 - 29.1) (15.6 - 27.5) (17.0 - 27.4) -
Suspended Solids
(mg/L)
3.1 2.3 2.7 2.5 2.5 2.6
(1.3 - 5.4) (0.8 - 5.4) (0.9 - 7.5) (0.9 - 4.7) (0.9 – 5.5) -
DO (mg/L)
Depth Average
6.1 6.4 6.4 6.8 6.6 6.5
(5.0 – 7.0) (3.7 - 8.2) (3.6 - 7.9) (4.8 - 8.3) (5.2 - 8.0) -
DO (mg/L)
Bottom
5.8 5.8 5.9 6.2 5.8 5.9
(4 – 7.4) (2.5 – 7.9) (2.7 - 7.9) (2.2 - 8.0) (3.2 - 8.0) -
DO (%saturation)
Depth Average
87.8 88.3 89.2 94.4 91 90.1
(74.3 - 102.3) (54 - 103) (51.3 - 106.3) (71 - 112) (79 - 101) -
DO (%saturation)
Bottom
81 78 81 85 80 81
(56 - 100) (36 - 99) (37 - 96) (32 - 108) (47 – 101) -
Total Inorganic
Nitrogen (mg/L)
0.05 0.09 0.091 0.124 0.09 0.089
(0.01 - 0.11) (0.027 - 0.187) (0.033 - 0.21) (0.037 - 0.27) (0.01 - 0.15) -
Ammonia
Nitrogen (mg/L)
0.017 0.021 0.028 0.035 0.021 0.024
(0.005 - 0.034) (0.011 - 0.035) (0.009 - 0.069) (0.018 - 0.065) (0.006 - 0.037) -
Unionised
Ammonia (mg/L)
0.001 0.001 0.001 0.001 0.001 0.001
(0.001 - 0.003) (0.001 - 0.002) (0.001 - 0.002) (0.001 - 0.002) (0.001 - 0.003) -
Nitrite Nitrogen
(mg/L)
0.007 0.012 0.009 0.013 0.01 0.01
(0.002 - 0.014) (0.002 - 0.019) (0.002 - 0.027) (0.003 - 0.04) (0.002 - 0.017) -
Nitrate Nitrogen
(mg/L)
0.026 0.057 0.055 0.076 0.056 0.054
(0.004 - 0.068) (0.007 - 0.15) (0.004 - 0.18) (0.007 - 0.227) (0.003 - 0.117) -
Total Kjeldahl
Nitrogen (mg/L)
0.114 0.132 0.123 0.162 0.16 0.138
(0.06 - 0.147) (0.09 - 0.193) (0.053 - 0.22) (0.08 - 0.277) (0.07 - 0.35) -
Total Nitrogen
(mg/L)
0.148 0.201 0.187 0.251 0.23 0.20
(0.067 - 0.22) (0.14 - 0.337) (0.07 - 0.323) (0.15 - 0.38) (0.15 - 0.41) -
Orthophosphate
Phosphorus
(mg/L)
0.008 0.01 0.009 0.009 0.01 0.009
(0.005 - 0.012) (0.005 - 0.026) (0.003 - 0.016) (0.005 - 0.014) (0.006 - 0.017) -
Total Phosphorus
(mg/L)
0.02 0.024 0.023 0.025 0.03 0.024
(0.02 - 0.023) (0.02 - 0.043) (0.02 - 0.037) (0.02 - 0.03) (0.02 - 0.04) -
Silica (mg/L) 0.55 0.66 0.611 0.69 0.67 0.63
(0.24 - 1.07) (0.2 - 1.5) (0.16 - 1.3) (0.24 - 1.13) (0.22 - 1.40) -
BOD5 (mg/L) 0.55 0.66 0.69 0.44 0.60 0.59
(0.1 - 1.1) (0.4 - 1.2) (0.1 - 1) (0.2 - 0.9) (0.1 - 1.5) -
Chlorophyll-a
(μg/L)
2.2 1.8 1.8 1.6 1.7 1.8
(0.8 - 5) (0.8 - 4.3) (0.5 - 6) (0.9 - 2.6) (0.5 - 11.1) -

Drainage Services Department Agreement No. CE 41/2013 (EP)
Port Shelter Sewerage, Stage 3 – Sewerage Works at Po Toi O
Environmental Impact Assessment Studies - Investigation
Environmental Impact Assessment Report
IA13070/EIARpt v2.3 Cinotech 5-6
Parameters 2009 2010 2011 2012 2013 Mean
E. coli
(cfu/100mL)
1.1 1.2 1 1 1 1.1
(1 - 2) (1 - 1.9) (1 - 1) (1 - 1) (1 - 2) -
Faecal Coliforms
(cfu/100mL)
1.2 1.2 1.1 1.1 1.1 1.3
(1 - 2.5) (1 - 8.7) (1 - 2.3) (1 - 1.8) (1 - 3.4) -
5.3.4. Clear Water Bay First Beach and Clear Water Bay Second Beach are located within
the Study Area (see Figure 5-2). The water quality in these two beaches is regularly
monitored by EPD. As the Second Beach is one of the gazetted beaches that opens all
year round, the monitoring frequency is at least 3 times per month in whole year. The
monitoring frequency in the First Beach is at least 3 times per month for bathing
season (March to October) and at least once per month in non-bathing season. They
were rated as “good” in 2013. The latest 5-year (2009-2013) water quality of these two
beaches is shown in Table 5-4 and Table 5-5.
Table 5-4: Beach Water Quality Monitoring Results at Clear Water Bay First
Beach from 2009 to 2013
Parameter 2009 2010 2011 2012 2013
pH 8.4 8.4 8.5 8.4 8.4
(8.3 - 8.8) (8.3 - 8.6) (8.3 - 8.6) (8.2 - 8.6) (8.0 - 8.7)
Salinity (psu) 30.3 29.9 31.2 30.1 29
(26.2 - 33.4) (17.8 - 33.4) (26.5 - 32.9) (23.6 - 32.7) (22.4 - 32.3)
Turbidity (NTU) 7.6 4.8 4.6 4.4 4.9
(2.6 - 24.3) (1.5 - 11.3) (1.0 - 26.1) (1.1 - 11.7) (1.4 - 21.7)
Temperature (oC) 26.8 26.3 26.5 26.7 26.8
(18.4 - 31.5) (17.6 - 32.0) (17.9 - 31.4) (15.6 - 31.7) (18.7 - 31.5)
Dissolved Oxygen 6.9 7 6.8 6.7 6.8
(5.7 - 8.8) (5.8 - 8.6) (5.4 -8.4) (5.6 - 8.5) (5.2 - 8.4)
E. coli
(no./100 ml) 15 10 7 8 24
Table 5-5: Beach Water Quality Monitoring Results at Clear Water Bay Second
Beach from 2009 to 2013
Parameter 2009 2010 2011 2012 2013
pH 8.5 8.4 8.4 8.4 8.4
(8.3 - 8.8) 8.2 - 8.6) (8.3 - 8.6) (8.2 - 8.6) (7.9 - 8.7)
Salinity (psu) 30.4 30.6 31.7 30.5 29.9
(24.6 - 34.0) (23.2 - 33.5) (29.1 - 33.1) (20.2 - 32.9) (24.2-32.5)
Turbidity (NTU) 8.7 5.6 5.3 7.1 5.7
(2.3 - 26.5) (1.2 - 28.1) (1.1 - 20.5) (1.8 - 48.9) (1.9-20.6)
Temperature (oC) 27.2 26.3 26.4 26.9 27
(18.5 - 32.2) (16.9 - 32.0) (17.7 - 32.1) (15.2 -32.2) (18.8 - 31.4)

Drainage Services Department Agreement No. CE 41/2013 (EP)
Port Shelter Sewerage, Stage 3 – Sewerage Works at Po Toi O
Environmental Impact Assessment Studies - Investigation
Environmental Impact Assessment Report
IA13070/EIARpt v2.3 Cinotech 5-7
Parameter 2009 2010 2011 2012 2013
Dissolved Oxygen 6.9 6.9 6.8 6.6 6.6
(5.8 - 8.6) (5.9 - 8.6) (5.9 - 8.5) (4.9 - 8.6) (5.1 - 7.6)
E. coli
(no./100 ml) 27 13 5 18 15
5.3.5. Based on Table 5-3, the geometric mean of E. coli at MM19 in the latest five years
well complied with the WQO (180 cfu/100ml for bathing beach subzone and 610
cfu/100ml for fish culture zone). Besides, the E. coli levels recorded in the two
beaches were also well below the criteria, indicating the baseline water quality within
the Study Area (Figure 5-3) is generally good in terms of E. coli level.
5.3.6. In terms of the DO, the annual averaged levels in the two bathing beaches in Clear
Water Bay were very close to each other. All depth-average DO ranges (i.e. 100% of
the samples) lied above 4mg/L, showing compliance with the WQO. The monitoring
results at the beaches and marine monitoring stations showed a wide variation in DO
for each year.
5.3.7. For unionized ammonia, which is toxic to fishes, the monitoring results at MM19 are
much lower than the WQO (0.021 mg/L).
5.3.8. TIN is a nutrient parameter which may potentially cause algal bloom. Its level at
MM19 has shown exceedance of the WQO. The overall 5-year mean of TIN was
within the WQO (0.1 mg/L) but the annual average in 2012 exceeded the WQO
criteria. An increasing trend appeared in the past few years and the maximum levels
exceeded the WQO in every year, indicating a risk of algae bloom in the surrounding
waters.
5.3.9. The pH level was in full compliance with the WQO at both MM19 station and the two
beaches.
On site Monitoring
5.3.10. Even though MM19 is the nearest monitoring station, it is located in the open sea so
that the monitoring results may not represent the actual water quality in Po Toi O bay.
In order to determine the baseline water quality in the area for subsequent analysis and
water quality modelling, baseline water quality monitoring was conducted at the
locations listed in Table 5-6, and their locations are shown in Figure 5-1.

Drainage Services Department Agreement No. CE 41/2013 (EP)
Port Shelter Sewerage, Stage 3 – Sewerage Works at Po Toi O
Environmental Impact Assessment Studies - Investigation
Environmental Impact Assessment Report
IA13070/EIARpt v2.3 Cinotech 5-8
Table 5-6: Water Quality Sampling Stations
Station Location
WM1 Inner bay of Po Toi O
WM2 Inner bay of Po Toi O
WM3 Near Fish Culture Zone
WM4 Near Po Toi O residence
WM5 Near Tai Wong Kung residence
WM6 At the mouth of Po Toi O Bay
WM7 Outside of Po Toi O Bay
Frequency and Duration of Monitoring
5.3.11. The water qualities at these stations were monitored for 2 weeks at a frequency of 3
times per week at mid-ebb and mid-flood during dry and wet seasons. The dry season
monitoring was conducted from 24 March to 23 April 2014 while that for wet season
was from 26 May to 18 June 2014.
Water Quality Parameters and Laboratory Testing
5.3.12. During the monitoring, water samples were extracted at 1m below surface, 1m above
seabed and at the mid-depth level. However, if the water depth was less than 3m,
water samples were only extracted at the mid-depth level. The samples were sent to a
HOKLAS accredited laboratory for laboratory testing for the following parameters:
pH
Salinity
Turbidity
Temperature
Suspended Solids
Dissolved oxygen
Total Inorganic Nitrogen
Ammonium-nitrogen
Unionized Ammonia
Nitrite-nitrogen
Nitrate-nitrogen
TKN
Total Nitrogen
Orthophosphate Phosphorous
Total Phosphorus
Silica
BOD5
Chlorophyll-a
E-coli

Drainage Services Department Agreement No. CE 41/2013 (EP)
Port Shelter Sewerage, Stage 3 – Sewerage Works at Po Toi O
Environmental Impact Assessment Studies - Investigation
Environmental Impact Assessment Report
IA13070/EIARpt v2.3 Cinotech 5-9
Analysis of Results
5.3.13. The monitoring results were analyzed for 2-week arithmetic means for different depths,
except E. coli which was analyzed for 2-week geometric means. The key water quality
parameters (depth averaged) are summarized in Table 5-7 and Table 5-8.
Table 5-7: Summary of the Monitoring Data for Dry Season
Dry Season WM1 WM2 WM3 WM4 WM5 WM6 WM7
Salinity
(ppt)
mean 26.1 26.2 26.3 26.3 26.3 26.3 26.3
range 25.5-26.8 25.4 - 26.8 25.5 - 26.8 25.3 -
26.8 25.3 - 26.9 25.5 - 26.8 25.5 - 26.9
σ 0.53 0.55 0.53 0.52 0.51 0.57 0.54
SS
(mg/L)
mean 2.9 3.3 3.2 3.1 3.3 3.5 3.4
range 2.5 - 5.1 2.5 - 9.3 2.5 - 5.3 2.5 - 6.6 2.5 - 6.2 2.5 - 8.2 2.5 - 8.2
σ 0.78 1.91 1.03 1.16 1.13 1.56 1.94
UIA
(mg/L)
mean 0.011 0.010 0.011 0.011 0.012 0.009 0.009
range 0.001-
0.022
0.002 -
0.022
0.003 -
0.022
0.003 -
0.02
0.004 -
0.021
0.003 -
0.019
0.002 -
0.018
σ 0.006 0.006 0.005 0.01 0.005 0.005 0.005
TIN
(mg/L)
mean 0.31 0.28 0.3 0.29 0.27 0.24 0.23
range 0.15 - 0.51 0.12 - 0.48 0.19 - 0.52 0.14 -
0.50 0.14 - 0.48 0.11 - 0.43 0.13 - 0.49
σ 0.115 0.117 0.099 0.12 0.09 0.1 0.1
E. coli
(no. /
100ml)
mean 3.1 3.4 3.1 2 1.4 2.9 2.4
range 1 - 17 1 - 39 1 - 63 1 - 70 1 - 6 1 - 22.5 1 - 31
σ 3 4 4 4 2 3 3.2
DO
(mg/L)
mean 6.6 6.6 6.7 6.7 6.6 6.7 6.7
range 4.7 - 8.7 4.7 - 8.4 4.8 - 8.6 4.9 - 8.8 4.7 - 8.4 4.7 - 8.9 4.3 - 8.6
σ 1.2 1.2 1.3 1.3 1.2 1.4 1.4
DO
(bottom)
(mg/L)
mean 6.4 6.6 6.5 6.8 6.5 6.7 6.4
range 4.7 - 8.5 4.8 - 8.6 4.9 - 8.8 4.9 - 8.7 4.6 - 8.5 4.6 - 9 4.2 - 8.4
σ 1.1 1.2 1.2 1.3 1.2 1.4 1.4
Table 5-8: Summary of the Monitoring Data for Wet Season
Wet Season WM1 WM2 WM3 WM4 WM5 WM6 WM7
Salinity
(ppt)
mean 27.7 27.8 27.7 27.7 27.7 27.7 27.7
range 25 - 30.8 24.9 - 31 24.9 - 30.8 24.9 -
30.8 25.1 - 30.7 24.8 - 30.9
24.7 -
30.8
σ 2.1 2.2 2.2 2.2 2.1 2.2 2.2
SS
(mg/L)
mean 3.5 3.5 3.2 3.1 3.5 3.3 3.2
range 2.5 - 5.5 2.5 - 5.7 2.5 - 3.8 2.5 - 4.3 2.5 - 8.4 2.5 - 4.1 2.5 - 4.2
σ 1 1 0.41 0.65 1.71 0.61 0.68
UIA
(mg/L)
mean 0.010 0.009 0.009 0.008 0.004 0.008 0.008
range 0.005 -
0.016
0.004 -
0.019
0.004 -
0.017
0.004 -
0.023
0.004 -
0.016
0.004 -
0.014
0.004 -
0.015
σ 0.004 0.005 0.005 0.006 0.005 0.003 0.003
Drainage Services Department Agreement No. CE 41/2013 (EP)
Port Shelter Sewerage, Stage 3 – Sewerage Works at Po Toi O
Environmental Impact Assessment Studies - Investigation
Environmental Impact Assessment Report
IA13070/EIARpt v2.3 Cinotech 5-10
Wet Season WM1 WM2 WM3 WM4 WM5 WM6 WM7
TIN
(mg/L)
mean 0.43 0.41 0.42 0.41 0.43 0.4 0.4
range 0.3 - 0.63 0.29 - 0.61 0.21 - 0.62 0.24 -
0.63 0.29 - 0.62 0.29 - 0.65
0.28 -
0.63
σ 0.112 0.116 0.125 0.121 0.114 0.11 0.111
E. coli
(no. /
100ml)
mean 14.5 13.7 10.4 18.7 12.4 18.5 14.7
range 1 - 660 1 - 470 1 - 225.5 1 - 510 1 - 180 1 - 370 1 - 383.3
σ 7 6 6 10 7 6 8
DO
(mg/L)
mean 6.4 6.3 6.4 6.4 6.5 6.3 6.4
range 5.7 - 7.2 5.7 - 7 5.8 - 7.2 5.7 - 7.2 6.1 - 7.1 5.8 - 7.1 6 - 7.1
σ 0.5 0.5 0.4 0.5 0.4 0.4 0.5
DO
(bottom)
(mg/L)
mean 6.4 6.2 6.4 6.4 6.5 6.2 6.3
range 5.6 - 7.3 5.7 - 7 5.7 - 7.2 5.6 - 7.4 6.1 - 7.2 5.5 - 6.9 5.8 - 7.1
σ 0.6 0.5 0.5 0.6 0.4 0.5 0.5
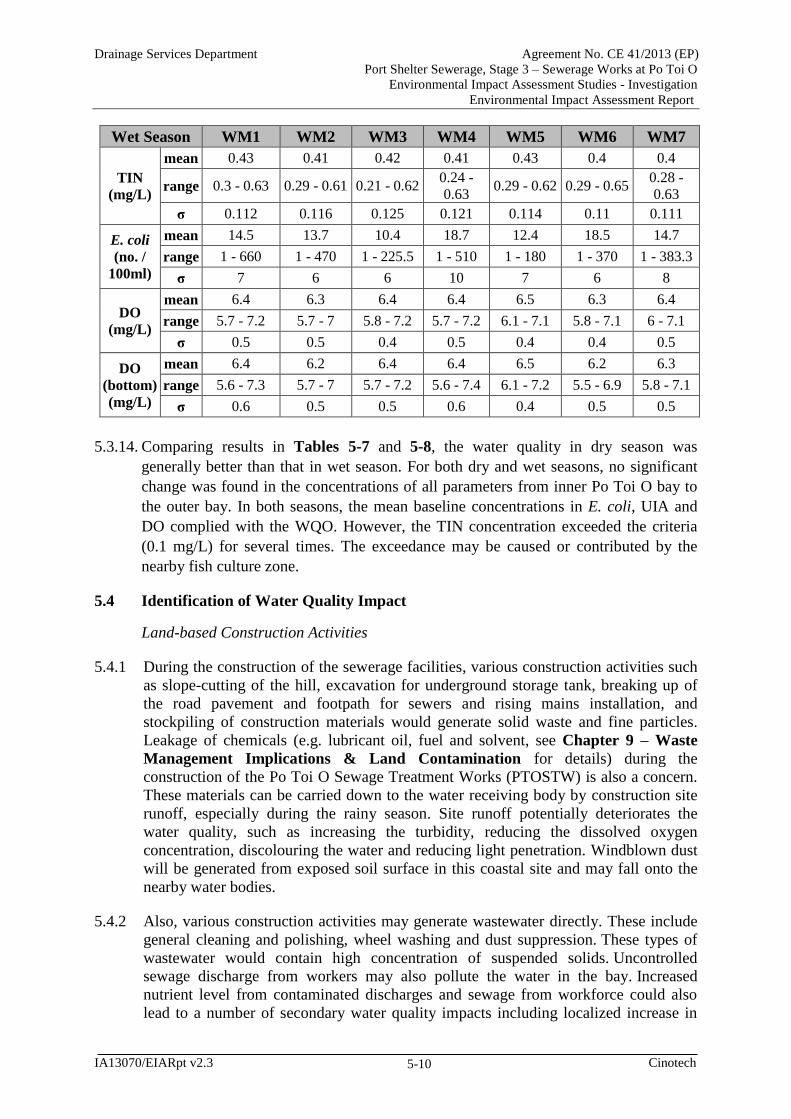
5.3.14. Comparing results in Tables 5-7 and 5-8, the water quality in dry season was
generally better than that in wet season. For both dry and wet seasons, no significant
change was found in the concentrations of all parameters from inner Po Toi O bay to
the outer bay. In both seasons, the mean baseline concentrations in E. coli, UIA and
DO complied with the WQO. However, the TIN concentration exceeded the criteria
(0.1 mg/L) for several times. The exceedance may be caused or contributed by the
nearby fish culture zone.
5.4 Identification of Water Quality Impact
Land-based Construction Activities
5.4.1 During the construction of the sewerage facilities, various construction activities such
as slope-cutting of the hill, excavation for underground storage tank, breaking up of
the road pavement and footpath for sewers and rising mains installation, and
stockpiling of construction materials would generate solid waste and fine particles.
Leakage of chemicals (e.g. lubricant oil, fuel and solvent, see Chapter 9 – Waste
Management Implications & Land Contamination for details) during the
construction of the Po Toi O Sewage Treatment Works (PTOSTW) is also a concern.
These materials can be carried down to the water receiving body by construction site
runoff, especially during the rainy season. Site runoff potentially deteriorates the
water quality, such as increasing the turbidity, reducing the dissolved oxygen
concentration, discolouring the water and reducing light penetration. Windblown dust
will be generated from exposed soil surface in this coastal site and may fall onto the
nearby water bodies.
5.4.2 Also, various construction activities may generate wastewater directly. These include
general cleaning and polishing, wheel washing and dust suppression. These types of
wastewater would contain high concentration of suspended solids. Uncontrolled
sewage discharge from workers may also pollute the water in the bay. Increased
nutrient level from contaminated discharges and sewage from workforce could also
lead to a number of secondary water quality impacts including localized increase in

Drainage Services Department Agreement No. CE 41/2013 (EP)
Port Shelter Sewerage, Stage 3 – Sewerage Works at Po Toi O
Environmental Impact Assessment Studies - Investigation
Environmental Impact Assessment Report
IA13070/EIARpt v2.3 Cinotech 5-11
ammonia and nitrogen concentrations.
5.4.3 Bentonite will be used as drilling liquid during horizontal directional drilling for the
proposed submarine outfall. Reconditioned bentonite free from cutting will be reused
for drilling. Therefore no wastewater will be discharged.
Marine-based Construction Activities
5.4.4 Construction of the submarine outfall will be by means of horizontal directional
drilling from the rising mains at the rocky shore through the seabed to minimize
impact on the rocky shore and the coastal shelf. A diffuser will be installed on top of a
riser shaft extending about 1m above the seabed at the end of the submarine outfall.
5.4.5 An area of 10m x 50m will be fully enclosed by sheet pile cofferdam at the diffuser
point. About 500m2 seabed will be dredged to remove the sediments in the seabed
temporarily in order to ensure the stability of the seabed for the installation of the
diffuser. Most of the area will be backfilled with rockfill and the permanent area lost
at the diffuser is about 5 m2. After the backfilling work is completed, the cofferdam
will be removed.
5.4.6 Installation and extraction of sheet piles will be conducted by vibratory action. This
will cause minor displacement of marine sediment, which will quickly settle without
significant increase in suspended solids. Also, sediment confined within the cofferdam
would be dredged by closed-grab and stored in sealed compartment of the barge
anchored outside the cofferdam. In addition, and backfilling works will be confined
within the cofferdam. No opening of cofferdam is required and thus there will be no
release of sediment into water bodies. Increase in suspended solids is not likely to
happen and no significant water quality impact is expected.
5.4.7 The size of dredging barge is about 12m x 25m. Given that the water depth is about
10m near the proposed diffuser location, there is sufficient water depth for
maneuvering the barge.
Effluent Discharge during PTOSTW Operation
5.4.8 During operation of PTOSTW, effluent will be discharged via the submarine outfall
and diffuser into the Po Toi O Bay and dispersed by the ambient water current,
potentially causing water quality impacts on the bay, the adjacent water bodies and
sensitive receivers.
Emergency Plant Breakdown during PTO STP Operation
5.4.9 The Po Toi O Sewage Treatment Plant (PTO STP) cannot operate in case of power or
equipment failure. The Supervisory control and data acquisition (SCADA) system in
the PTO STP will signal to the operation and maintenance personnel for emergency
attendance. Standby pump and screen will be provided at the PTO STP. According to
the performance pledge of CLP, electricity provision will be restored within 2 hours
after fault outage. Also, emergency generator will be delivered to PTO STP within 4
hours by future term contractor in case of plant failure where necessary.

Drainage Services Department Agreement No. CE 41/2013 (EP)
Port Shelter Sewerage, Stage 3 – Sewerage Works at Po Toi O
Environmental Impact Assessment Studies - Investigation
Environmental Impact Assessment Report
IA13070/EIARpt v2.3 Cinotech 5-12
5.4.10 As the average dry weather flow (ADWF) of PTO STP would be small (about
139m3/day), it would be possible to deploy tankers to transport away the sewage to
Tseung Kwan O Preliminary Treatment Works (TKO PTW) (or other nearby STW) in
case the PTO STP cannot be recovered in a short period of time.
5.4.11 Emergency storage of 4-hour ADWF (23.19m3) will be provided in the PTO STP. In
case of plant failure, three 12m3 sewage tankers will be called in to transport the
sewage from PTO STP to TKO PTW. Each tanker will take different travel routes to
reduce the risk of delay due to traffic jam. The tanker arrangement is as follows:
Table 5-9: Tanker Away Arrangement
Tanker Source Potential Route Arrival
Time Duty
A DSD’s tanker which
stationed at Sai
Kung Sewage
Treatment Works
Sai Kung STW
Hiram’s Highway
Clearwater Bay Road
Tai Au Mun Road
Po Toi O STP
1.5 hours
from plant
failure
Transport
sewage from
PTO STP to
TKO PTW
B DSD Sewage
Treatment Division
Term Contractor,
required to arrive in
2 hours in contract
Shatin STW*
Route 9
Tate’s Cairn Tunnel
Clearwater Bay Road
Tai Au Mun Road
Po Toi O STP
2.5 hours
from plant
failure
Transport
sewage from
PTO STP to
TKO PTW
C DSD District Term
Contractors (any 1 of
the 3 districts),
required to arrive in
1.5 hours in contract
Kwun Tong Preliminary
Treatment Works*
Tseung Kwan O Road
Clearwater Bay Road
Tai Au Mun Road
Po Toi O STP
2.5 hours
from plant
failure
Standby at
PTO STP, to
be on duty if
Tanker A/B
breaks down
or encounters
traffic delay
* Typical location where term contractor’s tankers are stationed
5.4.12 The distance between PTO STP and TKO PTW is about 12.1km or 18-minute travel
distance. Including sewage loading and unloading time, each tanker is assumed to take
2 hours round trip. Tankers A and B will work in shift to continuously remove sewage
from PTO STP. If one of the tankers fails to arrive at PTO STP on time, Tanker C will
come in to ensure that at least two tankers will be operating. An operation drill prior to
future operation will be conducted to confirm the time estimates achievable at peak
hours.
5.4.13 Appendix 5.5 shows the fluctuation of sewage volume in PTO STP in case plant
failure occurs during peak sewage flow (6pm). With continuous removal of sewage by
tankers in rotation, the highest quantity stored in the plant will be 17.24m3, which is
well below the emergency storage capacity (23.19m3). With about additional 6 m3
storage buffer, the chance of having sewage volume exceeding the storage capacity is
very low. No overflow of sewage from the PTO STP is anticipated.
Drainage Services Department Agreement No. CE 41/2013 (EP)
Port Shelter Sewerage, Stage 3 – Sewerage Works at Po Toi O
Environmental Impact Assessment Studies - Investigation
Environmental Impact Assessment Report
IA13070/EIARpt v2.3 Cinotech 5-13
5.4.14 Each tanker will deliver 12m3 sewage from PTO STP to TKO PTW. Based on DSD’s
past experience, it takes 15 minutes to unload all sewage. The average flow rate will
be 12m3/15 minutes/60 seconds = 0.013m3/s, which is far below the design capacity of
TKO PTW (5.55m3/s 9). No overloading of TKO PTW is anticipated.
5.4.15 Considering the project scale, risk of emergency condition, construction difficulties
and cost, the following provisions are the most appropriate and practical mitigation
measures in case of plant/power failure:
Delivery of an emergency generator to PTO STP within 4 hours from plant
failure
Provision of dual power by CLP;
Provision of a supervisory control and data acquisition system (SCADA), which
signals to the operation and maintenance personnel for emergency attendance in
case of plant failure;
Provision of a standby pump and screen at the PTO STP;
Provision of emergency storage of 4-hr ADWF sewage retention time;
Arrangement of tankers for continuous removal of incoming sewage to other
sewage treatment plants for treatment to ensure a sufficient buffer for emergency
storage.
5.4.16 Based on these provisions, emergency discharge is not expected, and thus no adverse
impact on water quality due to emergency discharge is anticipated.
Sludge & Chemical Waste Management during PTOSTW Operation
5.4.17 Sludge, chemicals for cleaning and chemical waste generated will be transported on
land by sealed tanker. Therefore, no leakage and pollution of marine waters is
expected.
5.4.18 Regular chemical cleaning of the MBR membranes will be required to prevent
membrane fouling and to maintain the membrane performance. Sodium hypochlorite
and oxalic acid will be used for removal of organic and inorganic deposits
respectively. The cleaning process will take place in-situ on the permeate side without
removal of membrane. The deposits will dissolve in the sewage and be treated by the
MBR system. The unused chemical will be neutralized by hydrogen chloride and
follow the sewage flow in the MBR system and eventually be discharged at the
diffuser. The water quality impact due to discharge of cleaning chemical will not be
significant.
9 Maunsell Consultants Asia Ltd. 2005. Further Development of Tseung Kwan O Feasibility Study (Application
No. EIA-111/2015) Ch. 6 Sewerage and Sewage Treatment. [online] Available at:
http://www.epd.gov.hk/eia/register/report/eiareport/eia_1112005/HTML/EIA/HTML/Volume%201/Sec_6%20S
ewerage.htm. Last Accessed: 23 March 2016.

Drainage Services Department Agreement No. CE 41/2013 (EP)
Port Shelter Sewerage, Stage 3 – Sewerage Works at Po Toi O
Environmental Impact Assessment Studies - Investigation
Environmental Impact Assessment Report
IA13070/EIARpt v2.3 Cinotech 5-14
5.5 Water Sensitive Receivers
5.5.1 Water sensitive receivers (WSR) likely to be affected by the Project were identified
from on-site visits and surveys. The locations of the representative WSRs are shown
in Figure 5-2.
Po Toi O Fish Culture Zone (F1-F3)
Coral communities at Po Toi O (Cor 1 - Cor7)
Major Amphioxus habitat (Amph)
Clear Water Bay First Beach (B1)
Clear Water Bay Second Beach (B2)
Streams (W1 – W3)
Secondary contact recreation sub-zones
Spawning grounds for commercial fisheries area
Shorelines at the Coastal Protection Area Zone at Po Toi O
5.5.2 Artificial reefs (ARs) are placed in the outer Port Shelter between Steep Island, Tiu
Chung Chau and Basalt Island. Part of the ARs falls into the Study Area far away
from the diffuser location (see Figure 8-1). Therefore, the pollutants from
construction and operation of this Project are not expected to reach this area. Also, as
the ARs are placed in the open water with deep water and high current flow, any
pollutants reaching this area would have been well dispersed and diluted. No
assessment on this WSR is necessary.
5.5.3 The proposed STP is sandwiched by W1 and W2, which both appeared dry during
surveys in wet and dry seasons. Part of W3 was natural with stony bottom while the
water upstream and downstream was channelled through pipes. The outfall is located
near the rocky and sandy shores and the water eventually entered the sea. The water
occasionally appeared milky and gave off odour. The bottom was lined with orange,
slimy substance which was possibly produced from iron bacteria. These observations
indicate that the water is iron rich and polluted. The condition of W3 has been
reported to EPD and DSD for investigation.
5.6 Assessment Methodology
Construction Phase Impact Assessment
5.6.1 The water quality impact due to land-based construction works would be minimized
by following the criteria and guidelines for water pollution evaluation as stated in
Annexes 6 and 14 of the EIAO-TM. Wastewater generated during construction phase
shall be treated up to the effluent standard under the WPCO before discharge. With
implementation of mitigation measures and the proposed good site practices in
Section 5.8, the land-based water quality impact would be minimized to acceptable
level.
5.6.2 A fully enclosed cofferdam will be erected around the proposed diffuser with the
water inside emptied. Silty water removed from the cofferdam should be de-silted in a
sedimentation tank before discharge back into the sea. The cofferdam will be formed
by steel sheetpiles to surround the works area. Lateral loading from wave and water

Drainage Services Department Agreement No. CE 41/2013 (EP)
Port Shelter Sewerage, Stage 3 – Sewerage Works at Po Toi O
Environmental Impact Assessment Studies - Investigation
Environmental Impact Assessment Report
IA13070/EIARpt v2.3 Cinotech 5-15
pressure will be resisted by struts and walings system. Preloaded struts will be adopted
to ensure sufficient resistant for 10m water depth and wave actions. The dredger barge
will be anchored outside the cofferdam and move the closed grab into the cofferdam
for dredging. No opening of cofferdam would be required and therefore no release of
suspended solids into water column is expected.
5.6.3 As there will be no significant sediment release to the water column due to sheet
piling and confined dredging, no significant marine-based water quality impact is
expected. No computational modelling of sediment dispersion is required.
Operational Phase Impact Assessment
Normal Operation
5.6.4 Under normal operation of the sewage treatment plant, the treated effluent from the
proposed diffuser should follow the effluent discharge standard so that the potential
impact is likely to be minor. Water quality impacts arising from effluent discharge
from the diffuser under normal operation on WSRs were assessed by a set of
hydrodynamic and water quality models.
Computational Modeling
5.6.5 The Delft3D suite of computer models was adopted for the assessment of the water
quality during the operation phase. The Delft3D-FLOW was used to simulate the
water currents and water levels in Po Toi O and the adjacent waters while the
Delft3D-WAQ was used to simulate the water quality.
5.6.6 A local fine grid model (Po Toi O computer model, hereafter called “PTO Model”)
was set up to cover the entire Po Toi O and Clear Water Bay, the eastern part of Tai
Hang Tun, eastern part of Shek Mei Tau, southern part of Trio Island and the
periphery of Steep Island. The PTO model was nested with the Update Model which
has been well calibrated. A description of the hydrodynamic and water quality model
and the calibration of this model are given in Appendix 5.1.
Scenario Runs
5.6.7 2 scenarios of Delft3D-WAQ were run to simulate the water quality in both dry
season and wet season, covering one full spring neap cycle. They are listed below:
Scenario 1- Baseline Scenario without project
Scenario 2- Normal Operation of PTOSTW, 24-hour continuous and uniform
discharge of treated effluent at the proposed discharge point
Scenario 1 (Baseline Scenario)
5.6.8 The existing water quality should be mainly affected by the stormwater and sewage
discharge including stormwater surface runoff, open drainage channel flows, the
existing effluent discharge from the sewage treatment plant at Clear Water Bay
Second Beach, fish culture zone, Yacht Club and sewage discharge from septic tanks
surrounding the village houses. Estimations of the pollution inventory are detailed in

Drainage Services Department Agreement No. CE 41/2013 (EP)
Port Shelter Sewerage, Stage 3 – Sewerage Works at Po Toi O
Environmental Impact Assessment Studies - Investigation
Environmental Impact Assessment Report
IA13070/EIARpt v2.3 Cinotech 5-16
Appendix 5.2.
Scenario 2 (Normal Discharge in Operational Phase)
5.6.9 During the operation of the proposed sewage treatment plant, the sewage from Po Toi
O Village, Seacrest Villa and Fairway Vista will be collected and treated at the plant.
As a result, individual discharges from septic tanks and soakaway of these residences
will be replaced by treated effluent discharge at the diffuser after the completion of the
sewerage works. However, the sewage generated from Tai Wong Kung which is
located opposite of Po Toi O bay will remain to be treated by existing septic
tanks/soakaway system.
5.6.10 Sewage in Po Toi O comes from two sources: domestic activities (residential) and
restaurant activities (commercial). Restaurant activities are the highest on weekends.
Therefore, the average dry weather flow of sewage is calculated by averaging sewage
production on weekdays and weekends. Given that the daily flow rate of the discharge
from the proposed PTOSTW is about 139 m3/day and assuming a scenario with 24-
hour continuous release, the instantaneous flow rate is approximately 0.00161 m3/s.
The peak flow which is about 0.00644 m3/s would be considered as the worst case
scenario. The detailed calculation can be found in Appendix 5.3.
5.6.11 In assessing the potential water quality impact due to the discharge of treated effluent
from the submarine outfall (the diffuser), the VISJET model was employed to
characterize the initial dilution of the effluent discharge from the diffuser in the Zone
of Initial Dilution (ZID) and the plume size, e.g. the plume depth and plume thickness
in the near field. A detailed description of VISJET model is provided in Appendix 5.4.
5.6.12 The effluent loadings from the VISJET calculations were fed to the Delft3D –WAQ in
order to compute the water quality in the far field of Po Toi O and the adjacent waters.
Sensitivity Test
5.6.13 The design of sewer alignment has taken into account technical feasibility. However,
the actual sewer connection rate may not reach 100% due to a number of reasons, such
as complicated house ownership, unsuccessful attempt to contact owner, owner with
plan to re-build the village house and thus postpone the sewer connection10. Upon
completion of public sewer construction, the sewer connection rate generally can
reach 80% to 90% in long run. As at end 2014, the territorial connection rate is 85%10.
5.6.14 A sensitivity test was conducted to compare the difference in water quality at WSRs in
wet and dry seasons under two sewer connection rates: 100% (full connection) and
77% (interim connection, with reference to North District and Yuen Long 10). The
detailed results were tabulated in Appendix 5.7. The results show no significant
difference in water quality change for interim or full sewer connection rates. In the
following assessment, the water quality assessment will be based on 100% sewer
10 EPD. 2015. Supplementary information pertaining to item PWSC(2014-15)49. [online] Available at
http://www.legco.gov.hk/yr14-15/english/fc/pwsc/papers/pwsc20150210pwsc-120-1-e.pdf. Accessed: 02
February 2016.

Drainage Services Department Agreement No. CE 41/2013 (EP)
Port Shelter Sewerage, Stage 3 – Sewerage Works at Po Toi O
Environmental Impact Assessment Studies - Investigation
Environmental Impact Assessment Report
IA13070/EIARpt v2.3 Cinotech 5-17
connection rate.
Other Operational Impacts
5.6.15 Marine organisms may grow on the diffuser and cause blockage of the ports
(dispersion holes). Self-cleaning flow velocity at the ports can prevent marine growth
inside the ports. In addition, the diffuser risers and ports will be made up of material
(e.g. high-density polyethylene (HDPE)) that allows cleaning of marine growth off the
diffuser surface by divers easily. No anti-fouling agent will be applied so that there
will be no risk of biocide leakage.
Cumulative Impact
5.6.16 There may be two potential concurrent projects in the area, i.e.
Roundabout near the minibus stop
Fish culture zone (FCZ) dredging and relocation
5.6.17 CEDD has confirmed that they have no programme for the fish culture zone dredging
and relocation during the course of the EIA study. There is also no information on the
status and programme of the roundabout project from HyD. Nevertheless, the land-
based construction works are unlikely to have any major water impact during the
construction and operation of the PTOSTW. Therefore, no cumulative water quality
impact is anticipated.
5.7 Impact Prediction and Assessment
5.7.1 The key water quality parameters studied includes depth-averaged and bottom
suspended solids (SS), depth-averaged unionized ammonia (UIA), depth-averaged
total inorganic nitrogen (TIN), depth-average E. coli (E. coli), depth-averaged
dissolved oxygen (DO), dissolved oxygen in bottom layer (Bottom DO) and
sedimentation rate. The concentration of SS, UIA and TIN are averaged over a spring-
neap cycle, E. coli is geometric mean, DO and Bottom DO are 90 percentile over the
period, and sedimentation rate is the maximum value over the period. Salinity was not
assessed as no significant change due to effluent discharge is expected. The proposed
diffuser location has more than 10 m water depth and is far from the major
Amphioxus habitat in the area and rocky shore where coral grows (>100m). As the
effluent discharge rate during normal operation is only about 7 L/s, the change in
salinity at these WSRs due to the proposed operation of the PTOSTW is expected to
be negligible.

Drainage Services Department Agreement No. CE 41/2013 (EP)
Port Shelter Sewerage, Stage 3 – Sewerage Works at Po Toi O
Environmental Impact Assessment Studies - Investigation
Environmental Impact Assessment Report
IA13070/EIARpt v2.3 Cinotech 5-18
5.7.2 All criteria are based on the WQO, except in assessing impact on corals where
specific suspended solids and sedimentation rate criteria have been adopted, which
represent the limits that coral can withstand based on past studies11,12,13,14. For E. coli,
the WQO criteria is 180 no./100ml at gazetted beaches and 610 no./100ml at FCZ.
5.7.3 Detailed modelled results and the criteria for each parameter in baseline and normal
discharge scenarios are available in Appendix 5.8.
Scenario 1 (Baseline Scenario)
5.7.4 The modelled baseline water quality in the Study Area (as described in Section 5.3.1)
is in line with the descriptions in Section 5.3, which was good and complied with the
WQO criteria except TIN.
Scenario 2 (Normal Discharge in Operational Phase)
5.7.5 The contour plots of the modelled results during normal operation for dry season are
presented in Figure A5.6-1 to Figure A5.6-8 in Appendix 5.6 while the contour plots
for wet season are presented in Figure A5.6-9 to Figure A5.6-16 in Appendix 5.6.
These plots were generated to show the worst concentration at each grid over the 15-
day spring neap cycle.
5.7.6 For the normal operation of PTOSTW, the concentration of depth averaged SS are in
the range of 2.14 mg/L to 2.46 mg/L in dry season while the concentrations are
between 1.63 mg/L and 2.61 mg/L in wet season. The bottom SS levels in dry and wet
seasons are in the range of 2.48 mg/L to 2.65 mg/L and 1.96 mg/L to 2.51 mg/L
respectively. No significant change is found between the baseline and normal
operation scenarios for depth averaged and bottom SS in both dry and wet seasons.
All values comply with the WQO (<30% increment) and criteria for coral.
5.7.7 The sedimentation rates under normal operation in dry and wet seasons have no
significant change from those in the baseline. The rates are predicted to be lower than
1.8 g/m2/day which are far below the unacceptable value of sedimentation rate (100
g/m2/day) for normal coral growth.
5.7.8 No significant change in DO and Bottom DO concentrations is expected under normal
operation when compared with the baseline scenario. Both of these scenarios are in
range from 7.0 to 7.2 mg/L for dry season and 5.0 to 5.6 mg/L for wet season and they
all comply with the WQO criteria.
11 Pastorok R.A. & Bilyard G.R. (1985). Effects of sewage pollution on coral-reef communities. Marine
Ecology Progress Series 21: 175-189.
12 Hawker D.W. & Connell D.W. (1992). Standards and Criteria for Pollution Control in Coral Reef Areas. In
Connell D.W. & Hawker D.W. (eds.), Pollution in Tropical Aquatic Systems. CRC Press, Boca Raton.
13 Erftemeijer P. L.A., Riegl B., Hoeksema B. W. & Todd P. A.. (2012). “Environmental impacts of dredging
and other sediment disturbances on corals: A review”. Marine Pollution Bulletin Volume 64, Issue 9, September
2012, Pages 1737–1765
14 AFCD. 2005. Tender No. AFC/SQ/58/03 Establishing threshold tolerance of local corals to sedimentation,
Final Report.

Drainage Services Department Agreement No. CE 41/2013 (EP)
Port Shelter Sewerage, Stage 3 – Sewerage Works at Po Toi O
Environmental Impact Assessment Studies - Investigation
Environmental Impact Assessment Report
IA13070/EIARpt v2.3 Cinotech 5-19
5.7.9 The depth-averaged concentrations of UIA are in the range of 0.0025 mg/L to 0.0043
mg/L in dry season, while the concentrations are between 0.0027 mg/L to 0.0063
mg/L in wet season. No significant change is found between the baseline and normal
operation scenarios in both dry and wet seasons. All values comply with the WQO
(<0.021 mg/L).
5.7.10 The baseline TIN concentrations range from 0.16 to 0.21 mg/L for dry season and
0.09 to 0.17 mg/L for wet season. Both are already above the WQO criteria. Under
normal operation of PTOSTW, the TIN concentrations are predicted to stay in the
same range as in baseline case. As the major source of TIN (fish rafts) remains as
before, the TIN concentrations would still exceed the WQO criteria under normal
operation.
5.7.11 The geometric mean of depth-averaged E. coli in baseline scenario are much lower
than the WQO criteria (180 no./100ml for bathing beach subzone and 610 no./100ml
for fish culture zone or secondary contact recreation subzone). With the normal
operation of PTOSTW, the concentration of E. coli in wet and dry seasons is predicted
to be similar to the baseline scenario.
5.7.12 Overall, it is predicted that following the normal operation of the PTOSTW, no
substantial change in the water quality in Po Toi O is expected. Therefore, no
significant water quality impact on the surrounding water is anticipated.
5.8 Water Quality Mitigation Measures
Construction Phase
Works near Waterbodies
5.8.1 The STP is sandwiched by two streams which may have water flow under heavy rain.
There is a u-channel at the foot of the manmade slope where the STP will be
constructed. It brings the water seeped from the surrounding slope to the culverts
downstream of the above streams and eventually flow into the sea. Protection to this
u-channel shall be provided (e.g. covered by pore-less metal plate) to prevent
materials dropping into it.
5.8.2 Place sandbag along the upstream section of the stream near Fairway Vista and along
rocky shore during open cut excavation for laying of gravity sewers/rising mains
nearby to prevent the excavated materials from falling into the water and being carried
into the sea. The downstream water from the outfall at the rocky shore shall be
temporarily diverted away from the work boundary for excavation works into sea
directly, e.g. through a pipe without the need of construction work. The diversion shall
be removed to revert the flow to normal after completion of the excavation works.
5.8.3 A drip tray/container should be provided underneath the bentonite recycling system to
prevent any leakage from entering the watercourse or sea.

Drainage Services Department Agreement No. CE 41/2013 (EP)
Port Shelter Sewerage, Stage 3 – Sewerage Works at Po Toi O
Environmental Impact Assessment Studies - Investigation
Environmental Impact Assessment Report
IA13070/EIARpt v2.3 Cinotech 5-20
Works in the Sea
5.8.4 Sheet piles in marine waters should be installed by vibratory action. Single-layer silt
curtain should be equipped during the installation and extraction works.
5.8.5 Marine works (dredging, construction and installation works at diffuser location,
backfilling) shall be carried out inside fully enclosed, watertight cofferdam. The
cofferdam can only be removed after completion of work during ebb tide to avoid
water quality impact on the Po Toi O Bay.
5.8.6 Dredging should be carried out by closed-grab dredger. The marine sediment should
be placed in sealed compartment of the marine barge.
5.8.7 Silty water removed from the cofferdam should be de-silted in a sedimentation tank
before discharge back into the sea.
Good Site Practices
5.8.8 To minimize the potential impact from the land-based construction works, good
practices outlined in ProPECC PN1/94 should be followed as far as possible.
Mitigation measures should include, but not limited to, the following:
Perimeter channels and catchpits shall be constructed prior to commencement of
site formation works and earthworks;
Removal facilities (sand traps, silt traps and sediment basins) should be provided
to collect the surface run-off from construction sites. Channel or earth bund or
sand bag barriers should be provided to direct the stormwater to removal
facilities;
Silt removal facilities, channels and manholes should be maintained regularly;
Works program should be designed to minimize the scale of soil excavation
during the rainy season (April to September) as far as possible;
Works program should be well designed to minimize work areas to reduce the
soil exposure and site runoff;
To avoid the surface runoff from the earthwork, the exposed soil area should be
installed with surface protection measure such as covering by tarpaulin before
arrival of rainstorm;
Minimize exposed earth after completion of work in a certain area by
hydroseeding, vegetating, soil compacting or covering with bitumen;
Protect temporary access roads by crushed stone or gravel;
Prevent rainwater from entering trenches. Excavation of trenches should be dug
and backfilled in short sections during rainy seasons. Remove silt in rainwater
collected from trenches or foundation excavations prior to discharge to storm
drains.
Open stockpiles of construction materials (e.g. aggregates, sand and fill material)
onsite should be covered with tarpaulin or similar fabric during rainstorm;
All materials stored on the marine barge should be covered with tarpaulin or
similar fabric. If any equipment or material that contain oil/chemicals would be

Drainage Services Department Agreement No. CE 41/2013 (EP)
Port Shelter Sewerage, Stage 3 – Sewerage Works at Po Toi O
Environmental Impact Assessment Studies - Investigation
Environmental Impact Assessment Report
IA13070/EIARpt v2.3 Cinotech 5-21
stored on the marine barge, a robust drip tray/container should be provided
underneath to prevent any leakage from entering the sea.
All plant and vehicles should be washed before they leave the construction site.
The wash-water should have sand and silt settled out or removed before
discharging into storm drain;
Any wastewater generated from construction works should undergo removal of
settleable solids in a silt removal facility;
Remove waste from the construction site regularly to prevent waste
accumulation and chance of wash-off.
Provide sufficient chemical toilets with regular maintenance by licensed
chemical waste collector where necessary
Prevention of Pollution from Chemicals
Register as chemical waste producer if chemical waste will be generated.
Perform maintenance of vehicles and equipment that have oil leakage and
spillage potential on hard standings within a bunded area with sumps and oil
interceptors.
Dispose chemical waste in accordance to Waste Disposal Ordinance. Follow the
Code of Practice on the Packaging, Labelling and Storage of Chemical Wastes,
examples as follows:
i. Store chemical wastes with suitable containers to avoid leakage or spillage
during storage, handling and transport
ii. Label chemical waste containers according to the CoP to notify and warn
the waste handlers
iii. Store chemical wastes at designated safe location with adequate space
5.8.9 As there should be no immerse need for chemical or oil in this small scale project, the
quantity stored or used onsite should be limited to exert a significant water quality
impact in case of leakage. The largest amount of chemical involved should be
bentonite used in HDD, which should be stored in enclosed system with low chance of
leakage. Nevertheless, given the proximity to sensitive receivers (e.g. coral,
amphioxus, fish culture zone), the Contractor shall devise an emergency contingency
plan as part of the environmental monitoring and audit programme for accidental
leakage or spillage of motor oil, bentonite, chemicals (e.g. paint) and etc. during
construction phase. It should details the communication line between Contractor,
relevant government and stakeholders, remediation plan for containing and cleaning
of the leakage, evaluation and improvement of work and determine follow-up action
(e.g. monitoring).
Operational Phase
Normal Operation
5.8.10 Considering the problem of insufficient water depth and proximity to the rocky shore
for the diffuser location proposed in the project profile, the diffuser in this EIA has
been relocated to the current position which is far away from the rocky shore and has
over 10m water depth. The model results show no water quality impact from the
normal operation when the effluent discharge standard in Table 5-2 is strictly

Drainage Services Department Agreement No. CE 41/2013 (EP)
Port Shelter Sewerage, Stage 3 – Sewerage Works at Po Toi O
Environmental Impact Assessment Studies - Investigation
Environmental Impact Assessment Report
IA13070/EIARpt v2.3 Cinotech 5-22
followed. Chemicals will be transferred and stored within the sewage treatment plant
and thus no spillage outside the premise is expected. No further mitigation is needed
for normal operational phase.
Emergency Plant Failure
5.8.11 Arrangement in case of emergency plant failure summarized from Section 5.4.9 -
5.4.16 is listed below. Considering the project scale, risk of emergency condition,
construction difficulties and cost, the following provisions are the most appropriate
and practical mitigation measures in case of plant/power failure. No emergency
discharge of untreated sewage is expected.
Delivery of an emergency generator to PTO STP within 4 hours from plant
failure
Provision of dual power by CLP;
Provision of a supervisory control and data acquisition system (SCADA), which
signals to the operation and maintenance personnel for emergency attendance in
case of plant failure;
Provision of a standby pump and screen at the PTO STP;
Provision of emergency storage of 4-hr ADWF sewage retention time;
Arrangement of tankers for continuous removal of incoming sewage to other
sewage treatment plants for treatment to ensure a sufficient buffer for emergency
storage.
5.9 Evaluation of Residual Impacts
5.9.1 With proper implementation of mitigation measures, residual impact is anticipated to
be acceptable during construction and operational phases.
5.10 Environmental Monitoring and Audit Requirements
5.10.1 Regular monitoring of water quality should be carried out at water quality monitoring
stations near the dredging point (impact station), upstream of the impact (control
stations), and near representative sensitive receivers (e.g. Fish Culture Zone, coral and
Amphioxus) before and during cofferdam installation works, throughout dredging
works and during cofferdam extraction works.
5.10.2 No substantial change in water quality in the Po Toi O Bay is expected during normal
operation of the PTOSTW. However, in view of the sensitivity of fish culture zone,
corals and amphioxus to water quality change, marine water quality monitoring is
proposed for the first commencement year to ensure that no deterioration of water
quality arises in the semi-enclosed bay due to effluent discharge.
5.10.3 Practical and well sufficient preventative and mitigation measures have been proposed
to protect water quality during marine construction works, such as no open dredging
for submarine outfall alignment construction by adopting HDD, dredging and filling
within fully enclosed cofferdam and use of closed grab dredger for the construction of
the submarine outfall diffuser. During operation of the proposed STP, effluent that
meets the water quality requirements under WPCO will be discharged in the outer Po
Toi O Bay. As no adverse water deterioration is expected during construction and

Drainage Services Department Agreement No. CE 41/2013 (EP)
Port Shelter Sewerage, Stage 3 – Sewerage Works at Po Toi O
Environmental Impact Assessment Studies - Investigation
Environmental Impact Assessment Report
IA13070/EIARpt v2.3 Cinotech 5-23
operational phases given the sufficient design and mitigation measures, real-time
reporting of monitoring data for the Project through a dedicated internet website is
considered not necessary. Detailed EM&A requirement are provided in EM&A
Manual.
5.11 Conclusion
5.11.1 During normal operation of the PTOSTW, all water quality parameters would comply
with the WQO except TIN, which is attributed to the background level.
5.11.2 Considering the project scale, risk of emergency condition, construction difficulties
and cost, the following provisions are the most appropriate and practical mitigation
measures in case of plant/power failure:
Delivery of an emergency generator to PTO STP within 4 hours from plant
failure
Provision of dual power by CLP;
Provision of a supervisory control and data acquisition system (SCADA), which
signals to the operation and maintenance personnel for emergency attendance in
case of plant failure;
Provision of a standby pump and screen at the PTO STP;
Provision of emergency storage of 4-hr ADWF sewage retention time;
Arrangement of tankers for continuous removal of incoming sewage to other
sewage treatment plants for treatment to ensure a sufficient buffer for emergency
storage.
5.11.3 Based on these provisions, emergency discharge is not expected, and thus no water
quality impact in case of plant/equipment failure is anticipated.
5.11.4 Regarding construction phase impact from the submarine outfall, no open dredging
and backfilling will be required. The submarine outfall will be constructed below
seabed by HDD. At the emerging point for diffuser, a fully enclosed cofferdam shall
be erected to surround the dredging site and the dredger barge shall be anchored
outside the cofferdam. No leakage of suspended solids is expected.
5.11.5 Regarding construction phase impact from land-based works, standard water
protection measures shall be implemented to minimize water quality impact.
5.11.6 With proper implementation of mitigation measures, no insurmountable water quality
impact due to this Project is expected.