(5) (total 10 marks) - the maths and science tutor
TRANSCRIPT

(a) Describe the cohesion-tension theory of water transport in the xylem.
(5)1
(b) Describe how mRNA is produced in a plant cell.
(5)
(Total 10 marks)
Read the following passage.
Some insect species feed on the leaves of plants. These leaf-chewersbite off pieces of leaves. Other insect species feed on sap from phloemor xylem. These sap-feeders have sharp, piercing mouthparts that theyinsert directly into either xylem or phloem. Leaf-chewers and insectsthat feed on xylem sap are active feeders; this means they use theirjaw muscles to obtain their food. In contrast, insects that feed on phloemsap are passive feeders; this means they do not use their jaw musclesto take up sap from phloem.
Feeding on phloem sap presents two problems. Firstly, phloem sap hassa high sugar concentration. This could lead to a high pressure of liquidin the insect’s gut because of water entering the gut from the insect’sbody tissues. A phloem-sap-feeder polymerises some of these sugarsinto polysaccharides which are passed out of its anus as ‘honey dew’.The second< >problem is that phloem sap has a low concentration ofamino acids. Phloem-sap-feeding insects rely on bacteria in their guts toproduce amino acids. Each phloem-sap-feeding insect receives a few ofthese bacteria from its parent. This has resulted in a reduction in thegenetic diversity of the bacteria found within these insects.
A scientist investigated the effect of three different insects on the growthof a plant called the goldenrod. He found that leaf-chewing insects andxylem-sap-feeding insects caused a much greater reduction in totalleaf area than did phloem-sap-feeding insects.
5
10
15
20
2
Page 1 of 64Catalyst Tutors

Use the information from the passage and your own knowledge to answer the followingquestions.
(a) Phloem-sap-feeders are passive feeders (lines 6–7).Phloem-sap-feeders do not use their jaw muscles to take up sap from phloem.
Explain why they can take up sap without using their jaw muscles.
___________________________________________________________________
___________________________________________________________________
___________________________________________________________________
___________________________________________________________________
___________________________________________________________________
___________________________________________________________________
___________________________________________________________________
(3)
(b) A phloem-sap-feeder polymerises some of these sugars into polysaccharides (line 12-13).Suggest the advantage of this.
___________________________________________________________________
___________________________________________________________________
___________________________________________________________________
___________________________________________________________________
___________________________________________________________________
(2)
(c) Each phloem-sap-feeding insect receives a few of these bacteria from its parent.(lines 16–17).
Suggest how this has caused a reduction in genetic diversity of the bacteria.
___________________________________________________________________
___________________________________________________________________
___________________________________________________________________
___________________________________________________________________
___________________________________________________________________
(2)
Page 2 of 64Catalyst Tutors

(d) A scientist found that leaf-chewers and xylem-sap-feeders had a greater effect on plantgrowth than phloem-sap-feeders (lines 20–22).
Other than environmental factors, give two features the scientist would have controlledin his experiment to ensure this conclusion was valid.
1. _________________________________________________________________
___________________________________________________________________
2. _________________________________________________________________
___________________________________________________________________
(2)
(e) The scientist used the reduction in total leaf area of the experimental plants as an indicatorof plant growth.
Outline a method by which you could find the area of a plant leaf.
___________________________________________________________________
___________________________________________________________________
___________________________________________________________________
(1)
(Total 10 marks)
Organic compounds synthesised in the leaves of a plant can be transported to the plant’s roots.This transport is called translocation and occurs in the phloem tissue of the plant.
(a) One theory of translocation states that organic substances are pushed from a highpressure in the leaves to a lower pressure in the roots.
Describe how a high pressure is produced in the leaves.
___________________________________________________________________
___________________________________________________________________
___________________________________________________________________
___________________________________________________________________
___________________________________________________________________
___________________________________________________________________
(Extra space) _______________________________________________________
___________________________________________________________________
___________________________________________________________________
(3)
3
Page 3 of 64Catalyst Tutors

PCMBS is a substance that inhibits the uptake of sucrose by plant cells.
Scientists investigated the effect of PCMBS on the rate of translocation in sugar beet.The figure below shows their results.
Time / minutes
(b) During their experiment, the scientists ensured that the rate of photosynthesis of theirplants remained constant.Explain why this was important.
___________________________________________________________________
___________________________________________________________________
___________________________________________________________________
___________________________________________________________________
(2)
(c) The scientists concluded that some translocation must occur in the spaces in the cell walls.Explain how the information in the figure above supports this conclusion.
___________________________________________________________________
___________________________________________________________________
___________________________________________________________________
___________________________________________________________________
___________________________________________________________________
(2)
(Total 7 marks)
A student investigated the distribution of stomata on leaves from two species of plant. Sheremoved small pieces from the lower surface of the leaves of each plant species. She mountedthese pieces on separate microscope slides. She then counted the number of stomata in severalparts of the epidermis on each piece of leaf tissue using an optical microscope.
4
Page 4 of 64Catalyst Tutors

(a) Suggest appropriate units the student should use to compare the distribution of stomata onleaves.
___________________________________________________________________
(1)
(b) The pieces of leaf tissue examined were very thin.
Explain why this was important.
___________________________________________________________________
___________________________________________________________________
___________________________________________________________________
___________________________________________________________________
___________________________________________________________________
(2)
(c) Give two reasons why it was important that the student counted the number of stomata inseveral parts of each piece of leaf tissue.
1. _________________________________________________________________
___________________________________________________________________
2. _________________________________________________________________
___________________________________________________________________
(2)
(d) One of the two plant species used by the student in this investigation was a xerophyte.
Other than the distribution of stomata, suggest and explain two xerophytic features theleaves of this plant might have.
1. _________________________________________________________________
___________________________________________________________________
2. _________________________________________________________________
___________________________________________________________________
(2)
Page 5 of 64Catalyst Tutors

(e) The student then compared the rate of transpiration (evaporation of water) from the twospecies of plant. She did this by measuring the rate of water uptake by each plant species.
Suggest two reasons why the rate of water uptake by a plant might not be the same as therate of transpiration.
1. _________________________________________________________________
___________________________________________________________________
2. _________________________________________________________________
___________________________________________________________________
(2)
(Total 9 marks)
(a) Describe how the structures of starch and cellulose molecules are related to their functions.
(5)
(b) Describe the processes involved in the transport of sugars in plant stems.
(5)
(Total 10 marks)
5
(a) (i) Give two ways in which the structure of starch is similar to cellulose.
1. ____________________________________________________________
2. ____________________________________________________________
(2)
6
(ii) Give two ways in which the structure of starch is different from cellulose.
1. ____________________________________________________________
2. ____________________________________________________________
(2)
Page 6 of 64Catalyst Tutors

(b) In plants, mass transport of sugars takes place through columns of sieve cells in thephloem. Other cells, called companion cells, transport sugars into, and out of, the sievecells.
The diagram shows the structure of phloem.
Structures I and J allow the transport of sugars between cells.
(i) Using the diagram, suggest and explain one other way in which sieve cells areadapted for mass transport.
______________________________________________________________
______________________________________________________________
______________________________________________________________
______________________________________________________________
______________________________________________________________
(2)
Page 7 of 64Catalyst Tutors

(ii) Using the diagram, suggest and explain one other way in which companion cells areadapted for the transport of sugars between cells.
______________________________________________________________
______________________________________________________________
______________________________________________________________
______________________________________________________________
______________________________________________________________
(2)
(Total 8 marks)
Environmental factors can affect the density of stomata in the lower epidermis of leaves of plantsof the same species.
Scientists investigated how growing plants at different temperatures affected the density ofstomata in the lower epidermis of leaves. They grew plants of the same species from seeds.Their method is outlined below.
• They took 8 trays containing soil and planted 50 seeds in each tray.• They put each tray in a controlled environment at a different temperature.• When the plants had grown from the seeds, they selected 20 fully grown leaves from the
plants in each tray.• They determined the mean number of stomata per mm 2 in the lower epidermis for each
group of leaves.
7
Their results are shown in the graph.
(a) Give three environmental variables, other than temperature, that the scientists would havecontrolled when growing the plants.
1. _________________________________________________________________
2. _________________________________________________________________
3. _________________________________________________________________
(3)
Page 8 of 64Catalyst Tutors
(b) The scientists used a range of temperatures from 6 to 20 °C.Using their data, explain why they did not use temperatures above 20 °C.
___________________________________________________________________
___________________________________________________________________
___________________________________________________________________
(1)
(c) The scientists only selected fully grown leaves from the plants.
Suggest why.
___________________________________________________________________
___________________________________________________________________
___________________________________________________________________
(1)
(d) The plants grown at higher temperatures had a lower number of stomata per mm2.This would be an advantage to the plant because the transpiration rate increases as thetemperature increases.
Explain why the transpiration rate increases when the temperature increases.
___________________________________________________________________
___________________________________________________________________
___________________________________________________________________
___________________________________________________________________
___________________________________________________________________
(2)
(Total 7 marks)
Scientists used fossil leaves from one species of pine tree to investigate whether changes in theconcentration of carbon dioxide in the air over long periods of time had led to changes in thenumber of stomata in the leaves.
Their method is outlined below.
• They selected sites of different ages.• They collected between 11 and 24 fossil leaves from each site.• They found the mean number of stomata per mm 2 on the leaves from each site.• They estimated the age of each sample by dating organic remains around the leaves at
each site.
8
Page 9 of 64Catalyst Tutors

They compared results from the fossil leaves with leaves from the same species of pine treegrowing today.
They knew the concentration of carbon dioxide in the air at different times in the past.
Their results are shown in the table.
Age of sample/yearsConcentration of
carbon dioxide in theair/%
Mean number of stomataper mm2
(± standard deviation)
present day 0.0350 92 (±2)
5000 0.0270 87 (±4)
10 000 0.0250 95 (±2)
15 000 0.0205 108 (±6)
20 000 0.0195 115 (±4)
25 000 0.0188 118 (±6)
30 000 0.0190 130 (±6)
(a) The concentration of carbon dioxide in the air has changed with time. Use the data todescribe how.
___________________________________________________________________
___________________________________________________________________
___________________________________________________________________
___________________________________________________________________
___________________________________________________________________
(2)
(b) The scientists calculated the mean number of stomata per mm2 and the standard deviation.
What does the standard deviation show?
___________________________________________________________________
___________________________________________________________________
___________________________________________________________________
___________________________________________________________________
___________________________________________________________________
(2)
Page 10 of 64Catalyst Tutors

(c) The scientists found the age of the fossil leaves by dating the organic remains aroundthem.Would this have affected the accuracy of their data? Explain your answer.
___________________________________________________________________
___________________________________________________________________
___________________________________________________________________
(1)
(d) 30 000 years ago the mean number of stomata per mm2 on the lower epidermis of pinetree leaves was much higher than it is today. This would have enabled the plant to growfaster when the carbon dioxide concentration of the air was low.
Explain why.
___________________________________________________________________
___________________________________________________________________
___________________________________________________________________
(1)
(e) A student who saw these results concluded that as the carbon dioxide concentration of theair had increased the number of stomata per mm2 in leaves had decreased.Do the results support this conclusion?
___________________________________________________________________
___________________________________________________________________
___________________________________________________________________
___________________________________________________________________
___________________________________________________________________
___________________________________________________________________
(Extra space)________________________________________________________
___________________________________________________________________
___________________________________________________________________
(3)
Page 11 of 64Catalyst Tutors

(f) The leaves of plants that grow in dry areas usually have a low number of stomata per mm2.Use your knowledge of leaf structure to suggest three other adaptations that the leavesmight have that enable the plants to grow well in dry conditions.
1. _________________________________________________________________
2. _________________________________________________________________
3. _________________________________________________________________
(3)
(Total 12 marks)
Students investigated the effect of removing leaves from a plant shoot on the rate of wateruptake. Each student set up a potometer with a shoot that had eight leaves. All the shoots camefrom the same plant. The potometer they used is shown in the diagram.
(a) Describe how the students would have returned the air bubble to the start of the capillarytube in this investigation.
___________________________________________________________________
___________________________________________________________________
___________________________________________________________________
(1)
9
(b) Give two precautions the students should have taken when setting up the potometer toobtain reliable measurements of water uptake by the plant shoot.
1. _________________________________________________________________
2. _________________________________________________________________
(2)
Page 12 of 64Catalyst Tutors
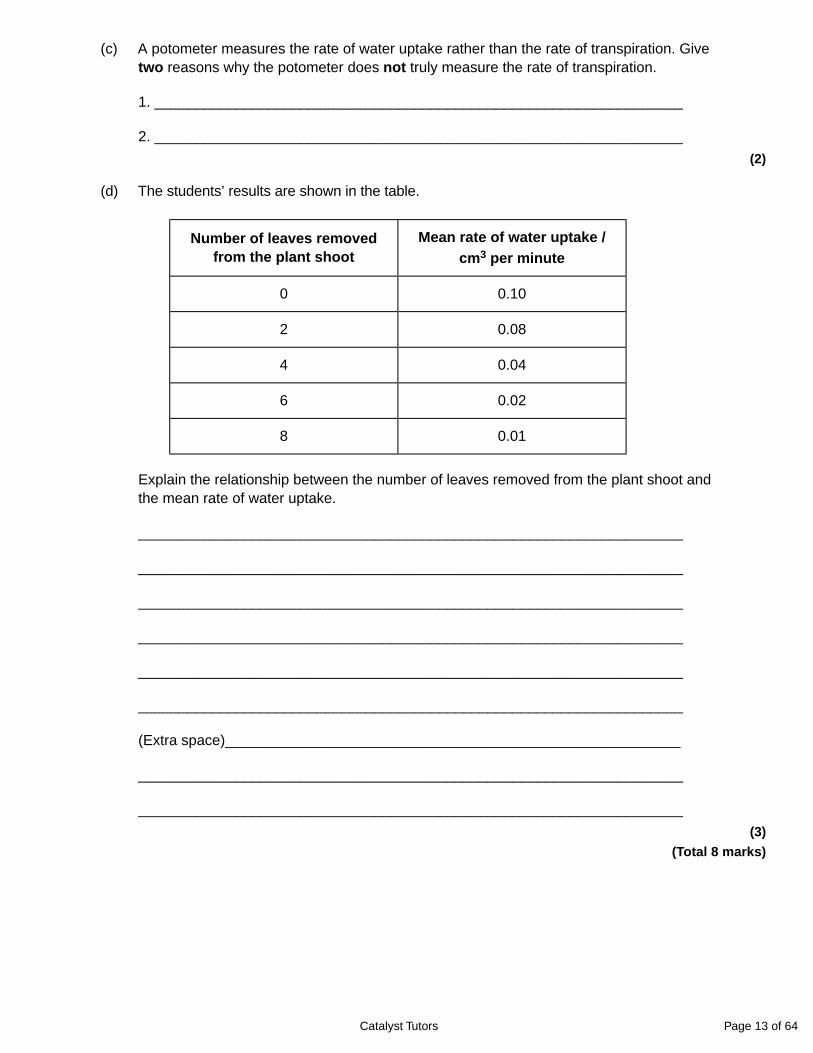
(c) A potometer measures the rate of water uptake rather than the rate of transpiration. Givetwo reasons why the potometer does not truly measure the rate of transpiration.
1. _________________________________________________________________
2. _________________________________________________________________
(2)
(d) The students’ results are shown in the table.
Number of leaves removedfrom the plant shoot
Mean rate of water uptake /cm3 per minute
0 0.10
2 0.08
4 0.04
6 0.02
8 0.01
Explain the relationship between the number of leaves removed from the plant shoot andthe mean rate of water uptake.
___________________________________________________________________
___________________________________________________________________
___________________________________________________________________
___________________________________________________________________
___________________________________________________________________
___________________________________________________________________
(Extra space)________________________________________________________
___________________________________________________________________
___________________________________________________________________
(3)
(Total 8 marks)
Page 13 of 64Catalyst Tutors

(a) Scientists measured the rate of water flow and the pressure in the xylem in a small branch.Their results are shown in the graph.
(i) Use your knowledge of transpiration to explain the changes in the rate of flow in thexylem shown in the graph.
______________________________________________________________
______________________________________________________________
______________________________________________________________
______________________________________________________________
______________________________________________________________
______________________________________________________________
(Extra space)___________________________________________________
______________________________________________________________
______________________________________________________________
(3)
10
(ii) Explain why the values for the pressure in the xylem are negative.
______________________________________________________________
______________________________________________________________
______________________________________________________________
(1)
Page 14 of 64Catalyst Tutors

(b) Doctors measured the thickness of the walls of three blood vessels in a large group ofpeople. Their results are given in the table.
Name of vesselMean wall thickness /mm
(± standard deviation)
Aorta 5.7 ± 1.2
Pulmonary artery 1.0 ± 0.2
Pulmonary vein 0.5 ± 0.2
(i) Explain the difference in thickness between the pulmonary artery and the pulmonaryvein.
______________________________________________________________
______________________________________________________________
______________________________________________________________
(1)
(ii) The thickness of the aorta wall changes all the time during each cardiac cycle.Explain why
______________________________________________________________
______________________________________________________________
______________________________________________________________
______________________________________________________________
______________________________________________________________
______________________________________________________________
(Extra space)___________________________________________________
______________________________________________________________
______________________________________________________________
(3)
(iii) Which of the three blood vessels shows the greatest variation in wall thickness?Explain your answer.
______________________________________________________________
______________________________________________________________
______________________________________________________________
(1)
Page 15 of 64Catalyst Tutors

(c) Describe how tissue fluid is formed and how it is returned to the circulatory system.
___________________________________________________________________
___________________________________________________________________
___________________________________________________________________
___________________________________________________________________
___________________________________________________________________
___________________________________________________________________
___________________________________________________________________
___________________________________________________________________
___________________________________________________________________
___________________________________________________________________
___________________________________________________________________
___________________________________________________________________
(Extra space)________________________________________________________
___________________________________________________________________
___________________________________________________________________
___________________________________________________________________
___________________________________________________________________
___________________________________________________________________
___________________________________________________________________
___________________________________________________________________
___________________________________________________________________
___________________________________________________________________
___________________________________________________________________
(6)
(Total 15 marks)
Page 16 of 64Catalyst Tutors

A biologist investigated the rate of water movement during the day in different parts of a tree. Theresults are shown in the graph.
(i) Describe how the rate of water movement in the upper branches changed over the periodshown in the graph.
___________________________________________________________________
___________________________________________________________________
___________________________________________________________________
___________________________________________________________________
___________________________________________________________________
(2)
11
(ii) The rate of water movement in the upper branches was different from the rate of watermovement in the trunk. Describe how.
___________________________________________________________________
___________________________________________________________________
___________________________________________________________________
___________________________________________________________________
___________________________________________________________________
(2)
Page 17 of 64Catalyst Tutors

(iii) The results of this investigation support the cohesion tension theory. Explain how.
___________________________________________________________________
___________________________________________________________________
___________________________________________________________________
___________________________________________________________________
___________________________________________________________________
(2)
(Total 6 marks)
A student investigated the rate of transpiration from privet leaves.
• She obtained two sets of ten privet leaves.
• She left the ten leaves in set A untreated. She covered the upper surfaces of the ten leavesin set B with grease.
• She weighed each set of leaves and then tied all the leaves in each set to a separatelength of thread. This is shown in the diagram.
12
Page 18 of 64Catalyst Tutors

• She then weighed each set of leaves every 20 minutes over a period of 2 hours and plotteda graph of her results.
(a) Give two environmental conditions that the student should have kept constant during thisinvestigation.
1. _________________________________________________________________
2. _________________________________________________________________
(2)
(b) The student measured the water loss in milligrams. Explain the advantage of using tenleaves when taking measurements in milligrams.
___________________________________________________________________
___________________________________________________________________
(1)
Page 19 of 64Catalyst Tutors

(c) Explain the change in mass of untreated leaves in set A shown in the graph.
___________________________________________________________________
___________________________________________________________________
___________________________________________________________________
___________________________________________________________________
___________________________________________________________________
___________________________________________________________________
(Extra space)________________________________________________________
___________________________________________________________________
___________________________________________________________________
(3)
(d) The results that the student obtained for the leaves in set B were different from those forset A. Suggest an explanation for this difference.
___________________________________________________________________
___________________________________________________________________
___________________________________________________________________
___________________________________________________________________
___________________________________________________________________
(2)
(Total 8 marks)
(a) Students measured the rate of transpiration of a plant growing in a pot under differentenvironmental conditions. Their results are shown in the table.
Conditions Transpiration rate / g h–1
A Still air 15° 1.2
B Moving air 15° 1.7
C Still air 25° 2.3
During transpiration, water diffuses from cells to the air surrounding a leaf.
13
Page 20 of 64Catalyst Tutors

(i) Suggest an explanation for the difference in transpiration rate between conditions Aand B.
______________________________________________________________
______________________________________________________________
______________________________________________________________
______________________________________________________________
______________________________________________________________
(2)
(ii) Suggest an explanation for the difference in transpiration rate between conditions Aand C.
______________________________________________________________
______________________________________________________________
______________________________________________________________
______________________________________________________________
______________________________________________________________
(2)
(b) Scientists investigated the rate of water movement through the xylem of a twig from a treeover 24 hours. The graph shows their results. It also shows the light intensity for the sameperiod of time.
Page 21 of 64Catalyst Tutors

(i) Describe the relationship between the rate of water movement through the xylem andthe light intensity.
______________________________________________________________
______________________________________________________________
______________________________________________________________
(1)
(ii) Explain the change in the rate of water movement through the xylem between 06.00and 12.00 hours.
______________________________________________________________
______________________________________________________________
______________________________________________________________
______________________________________________________________
______________________________________________________________
(2)
(iii) The scientists also measured the diameter of the trunk of the tree on which the twighad been growing. The diameter was less at 12.00 than it was at 03.00 hours.
Explain why the diameter was less at 12.00 hours.
______________________________________________________________
______________________________________________________________
______________________________________________________________
______________________________________________________________
______________________________________________________________
(2)
Page 22 of 64Catalyst Tutors

(c) Arteries and arterioles take blood away from the heart.
Explain how the structures of the walls of arteries and arterioles are related to theirfunctions.
___________________________________________________________________
___________________________________________________________________
___________________________________________________________________
___________________________________________________________________
___________________________________________________________________
___________________________________________________________________
___________________________________________________________________
___________________________________________________________________
___________________________________________________________________
___________________________________________________________________
___________________________________________________________________
___________________________________________________________________
(6)
(Total 15 marks)
Page 23 of 64Catalyst Tutors

A student investigated the rate of transpiration from a leafy shoot. She used a potometer tomeasure the rate of water uptake by the shoot. The diagram shows the potometer used by thestudent.
(a) Give one environmental factor that the student should have kept constant during thisinvestigation.
___________________________________________________________________
(1)
14
(b) The student cut the shoot and put it into the potometer under water. Explain why.
___________________________________________________________________
___________________________________________________________________
(1)
(c) The student wanted to calculate the rate of water uptake by the shoot in cm3 per minute.What measurements did she need to make?
___________________________________________________________________
___________________________________________________________________
___________________________________________________________________
___________________________________________________________________
(2)
Page 24 of 64Catalyst Tutors
(d) The student assumed that water uptake was equivalent to the rate of transpiration.
Give two reasons why this might not be a valid assumption.
1. _________________________________________________________________
___________________________________________________________________
2. _________________________________________________________________
___________________________________________________________________
(2)
(e) The student measured the rate of water uptake three times.
(i) Suggest how the reservoir allows repeat measurements to be made.
______________________________________________________________
______________________________________________________________
(1)
(ii) Suggest why she made repeat measurements.
______________________________________________________________
______________________________________________________________
(1)
(Total 8 marks)
A student found the number of stomata per cm2 on the lower surface of a daffodil leaf.He removed a small, thin piece of lower epidermis and mounted it on a microscope slide.
He examined the slide using an optical microscope.
(a) Explain why it was important that the piece of the epidermis that the student removed wasthin.
___________________________________________________________________
___________________________________________________________________
___________________________________________________________________
___________________________________________________________________
(2)
15
Page 25 of 64Catalyst Tutors

(b) Suggest how the student could have used his slide to find the number of stomata per cm2.
___________________________________________________________________
___________________________________________________________________
___________________________________________________________________
___________________________________________________________________
___________________________________________________________________
___________________________________________________________________
(3)
(c) The stomata on the leaves of pine trees are found in pits below the leaf surface. Explainhow this helps to reduce water loss.
___________________________________________________________________
___________________________________________________________________
___________________________________________________________________
___________________________________________________________________
(2)
(Total 7 marks)
Page 26 of 64Catalyst Tutors

The drawing shows part of the lower leaf epidermis of sorghum.
(a) Calculate the number of stomata per mm2 of the leaf surface. Show your working.
Answer ____________________ stomata per mm2
(2)
16
(b) Sorghum has few stomata per mm2 of leaf surface area. Explain how this is an adaptationto the conditions in which sorghum grows.
___________________________________________________________________
___________________________________________________________________
___________________________________________________________________
___________________________________________________________________
___________________________________________________________________
___________________________________________________________________
(3)
(Total 5 marks)
Page 27 of 64Catalyst Tutors

The chart shows the results obtained from an investigation to determine the effect of lightintensity on the tension in xylem vessels in the leaves of a plant.
17
(a) Describe and explain the effects of increasing light intensity on the tension in the xylemvessels in the leaves.
___________________________________________________________________
___________________________________________________________________
___________________________________________________________________
___________________________________________________________________
___________________________________________________________________
___________________________________________________________________
___________________________________________________________________
___________________________________________________________________
___________________________________________________________________
___________________________________________________________________
(5)
Page 28 of 64Catalyst Tutors

(b) Explain why it was important to keep the humidity constant during the investigation.
___________________________________________________________________
___________________________________________________________________
___________________________________________________________________
___________________________________________________________________
(2)
(Total 7 marks)
The drawing shows four common plants found in the Mojave Desert.
W X Y Z
18
Page 29 of 64Catalyst Tutors

(a) Explain how three features of the plants shown in the drawing are adaptations to desertconditions.
1. _________________________________________________________________
___________________________________________________________________
2. _________________________________________________________________
___________________________________________________________________
3. _________________________________________________________________
___________________________________________________________________
(3)
(b) Resurrection plants can lose up to 95% of their water content without dying. They cansurvive for many years in this desiccated state and will revive within hours of rainfall.Suggest which of the plants W to Z is most likely to be a resurrection plant. Give a reasonfor your choice.
___________________________________________________________________
___________________________________________________________________
___________________________________________________________________
___________________________________________________________________
(2)
(Total 5 marks)
(a) Explain how xylem tissue is adapted for its function.
___________________________________________________________________
___________________________________________________________________
___________________________________________________________________
___________________________________________________________________
___________________________________________________________________
___________________________________________________________________
___________________________________________________________________
___________________________________________________________________
(4)
19
Page 30 of 64Catalyst Tutors
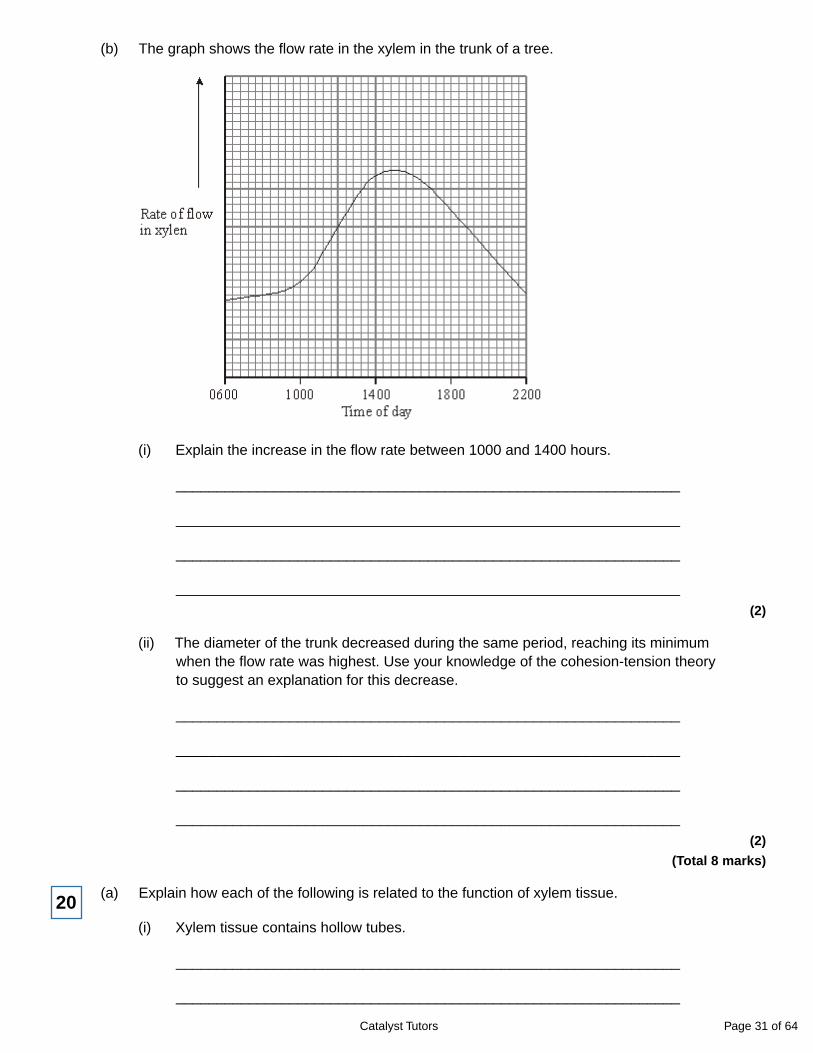
(b) The graph shows the flow rate in the xylem in the trunk of a tree.
(i) Explain the increase in the flow rate between 1000 and 1400 hours.
______________________________________________________________
______________________________________________________________
______________________________________________________________
______________________________________________________________
(2)
(ii) The diameter of the trunk decreased during the same period, reaching its minimumwhen the flow rate was highest. Use your knowledge of the cohesion-tension theoryto suggest an explanation for this decrease.
______________________________________________________________
______________________________________________________________
______________________________________________________________
______________________________________________________________
(2)
(Total 8 marks)
(a) Explain how each of the following is related to the function of xylem tissue.
(i) Xylem tissue contains hollow tubes.
______________________________________________________________
______________________________________________________________
20
Page 31 of 64Catalyst Tutors

(ii) Lignin is present in xylem cell walls.
______________________________________________________________
______________________________________________________________
(2)
(b) In an investigation the total area of the stomatal openings and the rate of flow of waterthrough xylem were measured in a plant over a period of 24 hours. The results are shownin the graph.
(i) Describe the relationship between the rate of flow of water and the total area of thestomatal openings for the period of time between midday and midnight.
______________________________________________________________
______________________________________________________________
(1)
(ii) Between 8 am and midday the rate of flow of water continues to rise although thetotal area of the stomatal openings remains constant. Explain why the rate of flow ofwater rises.
______________________________________________________________
(1)
(iii) How would the curve showing the total area of the stomatal openings differ if theinvestigation was repeated on a dull day?
______________________________________________________________
______________________________________________________________
(1)
Page 32 of 64Catalyst Tutors

(c) Some xerophytic plants have sunken stomata. Explain the advantage of this adaptation.
___________________________________________________________________
___________________________________________________________________
___________________________________________________________________
___________________________________________________________________
(2)
(Total 7 marks)
(a) Describe how water is moved through a plant according to the cohesion-tensionhypothesis.
___________________________________________________________________
___________________________________________________________________
___________________________________________________________________
___________________________________________________________________
___________________________________________________________________
___________________________________________________________________
___________________________________________________________________
___________________________________________________________________
(4)
21
(b) The mass of water lost from a plant was investigated. The same plant was used in everytreatment and the plant was subjected to identical environmental conditions. In sometreatments, the leaves were coated with a type of grease. This grease provides awaterproof barrier. The results of the investigation are given in the table.
Treatment Mass lost in 5 days / g
No grease applied 10.0
Grease applied only to theupper surface of every leaf
8.7
Grease applied to bothsurfaces of every leaf
0.1
(i) What is the advantage of using the same plant in every treatment?
______________________________________________________________
______________________________________________________________
(1)
Page 33 of 64Catalyst Tutors

(ii) Why was it important to keep the environmental conditions constant?
______________________________________________________________
______________________________________________________________
(1)
(iii) What is the evidence that the grease provides a waterproof barrier?
______________________________________________________________
______________________________________________________________
(1)
(c) (i) Calculate the mass of water lost in 5 days through the upper surface of the leaves.
Answer ___________________________________
(1)
(ii) Use your knowledge of leaf structure to explain why less water is lost through theupper surface of leaves than is lost through the lower surface.
______________________________________________________________
______________________________________________________________
______________________________________________________________
______________________________________________________________
(2)
(Total 10 marks)
Page 34 of 64Catalyst Tutors

(a) The diameter of a branch of a tree and the rate of flow of water through the branch weremeasured over a 24-hour period. The results are shown in the graph.
22
Using your knowledge of cohesion-tension theory
(i) describe and explain the changes in rate of flow of water in the branch over the24 hour period;
______________________________________________________________
______________________________________________________________
______________________________________________________________
______________________________________________________________
______________________________________________________________
______________________________________________________________
(3)
(ii) explain why the diameter of the branch decreased during the first 12 hours.
______________________________________________________________
______________________________________________________________
(1)
Page 35 of 64Catalyst Tutors

(b) A stem was cut from a transpiring plant. The cut end of the stem was put into a solution ofpicric acid, which kills plant cells. The transpiration stream continued. Suggest anexplanation for this observation.
___________________________________________________________________
___________________________________________________________________
___________________________________________________________________
___________________________________________________________________
(2)
(Total 6 marks)
(a) The table shows the transpiration rate of a group of plants exposed to different humiditiesat a temperature of 25°C.
Humidity / % Transpiration rate /arbitrary units
20 26.0
40 21.0
50 16.5
60 11.0
70 9.5
Describe and explain the relationship between humidity and transpiration rate.
___________________________________________________________________
___________________________________________________________________
___________________________________________________________________
___________________________________________________________________
___________________________________________________________________
___________________________________________________________________
(3)
23
Page 36 of 64Catalyst Tutors

(b) The diagrams show a section through a typical leaf and a section through a leaf from axerophytic plant. The xerophytic leaf has a lower transpiration rate than the typical leaf.
Describe two features shown in the diagram of the xerophytic leaf which reducetranspiration rate. Explain how each of these features contributes to a lower transpirationrate.
Feature 1___________________________________________________________
Explanation _________________________________________________________
___________________________________________________________________
Feature 2___________________________________________________________
Explanation _________________________________________________________
___________________________________________________________________
(4)
(Total 7 marks)
Page 37 of 64Catalyst Tutors
Mark schemes
(a) 1. Water lost from leaf because of transpiration / evaporation of water (molecules) /diffusion from mesophyll / leaf cells;ORTranspiration / evaporation / diffusion of water (molecules) through stomata /from leaves;
2. Lowers water potential of mesophyll / leaf cells;3. Water pulled up xylem (creating tension);4. Water molecules cohere / ‘stick’ together by hydrogen bonds;5. (forming continuous) water column;6. Adhesion of water (molecules) to walls of xylem;
2. Accept Ψ or WP5 max
1
(b) 1. The DNA strands separate by breaking the H bonds;ORH bonds broken between (complementary) (DNA) bases;
2. (Only) one of the strands/template strand is used (to make mRNA/istranscribed);
3. (Complementary) base pairing so A ⟶ U, T ⟶ A, C ⟶ G, G ⟶ C;4. (RNA) nucleotides joined by RNA polymerase;5. pre-mRNA formed;6. Splicing / introns removed to form mRNA;
1. Ignore ‘hydrolysis’ of bonds
1. Accept DNA “unzips” by breaking the H bonds
6. Accept ‘non-coding’ sections for introns5 max
[10]
(a) 1. Contents of phloem vessel pushed into insect’s mouth by high pressure;
2. (High pressure in phloem vessel) caused by loading of sugars into phloem in leaf;
3. And (resulting) entry of water by osmosis.3
2
(b) 1. Polysaccharides are insoluble;
2. So do not affect water potential of gut.2
(c) 1. (Only few bacteria passed from parent, so) only a few (copies of) genes passed on (inbacteria);
2. May not / does not include all alleles (of genes, so diversity reduced)ORSmall number of bacteria transmitted means unrepresentative sample.
2
Page 38 of 64Catalyst Tutors

(d) 1. Number / mass / density of insects per plant;
2. Stage of development / size of plants / insects;
Ignore any abiotic factor2
(e) Draw around leaf on graph paper and count squares;1
[10]
(a) 1. Water potential becomes lower / becomes more negative (as sugar enters phloem);2. Water enters phloem by osmosis;3. Increased volume (of water) causes increased pressure.
3
3
(b) 1. Rate of photosynthesis related to rate of sucrose production;2. Rate of translocation higher when sucrose concentration is higher.
2
(c) 1. Rate of translocation does not fall to zero / translocation still occurs after 120minutes;
2. But sucrose no longer able to enter cytoplasm of phloem cells.2
[7]
(a) Stomata per mm2 or cm2
ORNumber per mm2 or cm2;
Accept: mm−2 or cm−2.
Reject: per μm2 or μm−2.
Reject: the use of a solidus / as being equivalent to per.
Ignore: ‘amount’.1
4
(b) 1. Single/few layer(s) of cells;
Accept: more/too many/overlapping.
‛Single layer’ without reference to cells/tissue should not becredited.
2. So light can pass through;2
(c) 1. Distribution may not be uniformORSo it is a representative sample;
Accept: more/fewer stomata in different areas.
Ignore: anomalies/random/bias.2. To obtain a (reliable) mean;
Accept: ‘average’.2
Page 39 of 64Catalyst Tutors

(d) 1. Hairs so ‘trap’ water vapour and water potential gradient decreased;2. Stomata in pits/grooves so ‘trap’ water vapour and water
potential gradient decreased;3. Thick (cuticle/waxy) layer so increases diffusion distance;4. Waxy layer/cuticle so reduces evaporation/transpiration.5. Rolled/folded/curled leaves so ‘trap’ water vapour and water
potential gradient decreased;6. Spines/needles so reduces surface area to volume ratio;
1, 2 and 5. Accept: humid/moist air as ‛water vapour’ but notwater/moisture on its own.
1, 2 and 5. Accept: diffusion gradient as equivalent to waterpotential gradient.
1, 2 and 5. Accept: less exposed to air as an alternative to waterpotential gradient.
6. Accept: spines/needles so ‘reduce area’.2 max
(e) 1. Water used for support/turgidity;2. Water used in photosynthesis;3. Water used in hydrolysis;4. Water produced during respiration;
2 max
[9]
(a) Starch (max 3)1. Helical/ spiral shape so compact;2. Large (molecule)/insoluble so osmotically inactive;
Accept: does not affect water potential/ψ.3. Branched so glucose is (easily) released for respiration;
Ignore: unbranched.4. Large (molecule) so cannot leave cell/cross cell-surface
membrane;
Cellulose (max 3)5. Long, straight/unbranched chains of β glucose;6. Joined by hydrogen bonding;
Note: references to ‘strong hydrogen bonds’ disqualifies this markpoint.
7. To form (micro/macro)fibrils;8. Provides rigidity/strength;
5 max
5
Page 40 of 64Catalyst Tutors

(b) 1. (At source) sucrose is actively (transported) into the phloem/sieve element/tube;
Accept: ‘sugar/s’ for sucrose but reject other named sugars e.g.glucose.
Accept: co-transport (with H+ ions).2. By companion/transfer cells;3. Lowers water potential in phloem/sieve element/tube and
water enters by osmosis;4. (Produces) high (hydrostatic) pressure;
Accept: pressure gradient.5. Mass flow/transport towards sink/roots/storage tissue;
Accept: sieve element/tube.6. At sink/roots sugars are removed/unloaded;
Accept: at sink/roots sugars are used in respiration/stored.5 max
[10]
(a) (i) (Both)1. Are polymers / polysaccharides / are made of monomers / of
monosaccharides;2. Contain glucose / carbon, hydrogen and oxygen;3. Contain glycosidic bonds;4. Have 1−4 links;
Neutral: references to ‘unbranched’, insoluble, formed bycondensation, flexible and rigid
Are made of the monomer glucose = MP 1 and 2 = 2 marks5. Hydrogen bonding (within structure).
Ignore reference to H bonds between cellulose molecules2 max
6
(ii) (Starch)1. Contains α / alpha glucose;
Assume ‘it’ refers to starch
Accept: converse arguments only if linked directly to cellulose
Accept: forms α glycosidic bonds2. Helical / coiled / compact / branched / not straight;3. 1,6 bonds / 1,6 branching;4. Glucoses / monomers same way up;5. No H-bonds between molecules;6. No (micro / macro) fibres / fibrils.
2 max
(b) (i) 1. No / few organelles / very little cytoplasm / cytoplasm at edge / more room / hollow / large vacuole / large space / thick walls;
Accept strong walls for thick walls
2. (So) easier / more flow / (thick / strong walls) resist pressure.
Easier flow may be expressed in other ways e.g. lower resistance toflow
2
Page 41 of 64Catalyst Tutors

(ii) 1. Mitochondria release energy / ATP / site of respiration;
Q Reject: ‘produce energy’
but accept produce energy in form of ATP
2. For active transport / uptake against concentration gradient.
Note: no mark is awarded for simply naming an organelleOR:3. Ribosomes / rough endoplasmic reticulum produce(s) proteins;
Concept of making proteins needed
4. (Proteins) linked to transport e.g. carrier proteins / enzymes.2
[8]
(a) Any three from:
1. Light;
2. Carbon dioxide;
3. Type of soil;
4. Minerals / nutrients;
Accept named example
5. Water (in soil);
6. Humidity (of air);
7. pH (of soil)
8. Planting density;
Idea of equally spaced3 max
7
(b) Already levelled out (before 20 °C);1
(c) Young leaves (may) have different number of stomata (per mm2) / number of stomata(per mm2) changes during development (of leaf);
Accept reference to density of stomata1
Page 42 of 64Catalyst Tutors

(d) Any two from:
Points 1 and 2 need context of ‘more’
1. Molecules have more kinetic energy;
Accept KE
2. Faster diffusion of water / more evaporation of water (as temperature increasesin leaf);
For this point, diffusion must relate to movement of water
3. For this point, diffusion must relate to movement of water2 max
[7]
(a) 1. The more recent the sample the greater the concentration;
Accept converse
This could be expressed by reference to time e.g. ‘concentrationhas increased since 25 000 years ago
2. Increases most in last 5000 years / more or less constant / slight increasebetween 30 000 and 15 000 years ago;
2
8
(b) 1. Variation in data / spread of data;
Reject references to range e.g. ‘range of data’
2. Around the mean;
Both marks are possible in the context of using the data2
(c) 1. Yes as pine leaves not in organic matter of the same age;
2. No as organic matter would be the same age as the pine leaves;
Accept either approach1 max
(d) Can get more CO2 for photosynthesis;
More CO2 enters leaf is insufficient.Accept light-independent (reaction) as equivalent
1
Page 43 of 64Catalyst Tutors
(e) Any three from:
1. (Overall data show) negative correlation;
Do not allow description of correlation because in question stem
2. Little change in number of stomata in last 10 000 years;
3. Small sample size;
4. Only one species studied;
5. Other factors / named factor may have affected number of stomata;
6. Evidence does not support the conclusion between 30 000 and 25 000 yearsago / between 5000 years ago and present day;
Accept reference to either one of these age ranges
7. Appropriate reference to standard deviations (in comparing means);
E.g. no overlap between 15 000 and 10 000 years ago3 max
(f) Any three from :
1. Thick cuticle;
2. Small leaves / low surface area;
Accept other ways of describing ‘small’, e.g. ‘needle-like’
3. Hairy leaves;
4. Sunken stomata;
5. Rolled leaves;3 max
[12]
(a) Open / use tap / add water from reservoir;19
Page 44 of 64Catalyst Tutors

(b) 1. Seal joints / ensure airtight / ensure watertight;
Answer must refer to precautions when setting up the apparatus
Ignore: references to keeping other factors constant
2. Cut shoot under water;
3. Cut shoot at a slant;
4. Dry off leaves;
5. Insert into apparatus under water;
6. Ensure no air bubbles are present;
7. Shut tap;
8. Note where bubble is at start / move bubble to the start position;2 max
(c) 1. Water used for support / turgidity;
Accept: water used in (the cell’s) hydrolysis or condensation(reactions) for one mark. Allow a named example of these reactions
2. Water used in photosynthesis;
3. Water produced in respiration;
4. Apparatus not sealed / ‘leaks’;2 max
(d) As number of leaves are reduced (no mark),
Accept: converse arguments
1. Less surface area / fewer stomata;
3. Less evaporation / transpiration;
4. Less cohesion / tension / pulling (force);3
[8]
(a) (i) 1. Stomata open;
Allow converse
2. Transpiration highest around mid-day as middle of day warmer / lighter;
2. Allow ‘Sun is at its hottest’
3. (Increased) tension / water potential gradient;
Ignore ‘pull, suck’3
10
(ii) (Inside xylem) lower than atmospheric pressure / (water is under) tension;
Accept cohesion tension. Ignore vacuum1
Page 45 of 64Catalyst Tutors

(b) (i) High pressure / smoothes out blood flow / artery wall contains more collagen /muscle / elastic (fibres) / connective tissue;
Accept converse for pulmonary vein
Incorrect function of artery disqualifies mark1
(ii) 1. (Aorta wall) stretches because ventricle / heart contracts / systole /pressure increases;
1. Allow expand
2. (Aorta wall) recoils because ventricle relaxes / heart relaxes / diastole /pressure falls;
2. Allow spring back
Reject any reference to contract / relax in MP1 and 2
3. Maintain smooth flow / pressure;3
(iii) Aorta 1.2 / largest SD;
Allow pulmonary vein provided candidate relates standard deviationto mean
1
(c) Formation
1. High blood / hydrostatic pressure / pressure filtration;
2. Forces water / fluid out;
2. Reject plasma, ignore tissue
3. Large proteins remain in capillary;
Return
4. Low water potential in capillary / blood;
5. Due to (plasma) proteins;
6. Water enters capillary / blood;
7. (By) osmosis;
7. Osmosis must be in correct context
8. Correct reference to lymph;6 max
[15]
(i) 1. Increases then decreases;
Allow peak / maximum at any time between 13.00 - 14.00 or 7.8 -8.0;
2. Peak / maximum at 13.00 / 14.00 (hours) / 7.8 - 8.0;2
11
Page 46 of 64Catalyst Tutors

(ii) 1. Maximum / overall rate is higher (in branches);
Allow converse for all marking points.
2. Reaches maximum / peak earlier (in the day) (in branches);
3. Starts higher / ends lower (in branches)2
(iii) 1. Movement starts / peaks earlier in branches / higher up;
2. Creates tension / 'negative pressure' / 'pull'2
[6]
(a) Light;
Humidity / moisture in air;
Air movement / wind;
Temperature;2 max
12
(b) Decreases chance of error / larger difference in mass / improvesaccuracy / precision;
Neutral: Reliability, references to anomalies.1
(c) 1. Stomata open, (water) transpired / evaporates / diffuses out (via) water potentialgradient / leaf has higher water potential;
2. Water potential / diffusion gradient reduces (during investigation) as water notbeing replaced / no water supply;
3. Stomata close / closing;
Must clearly indicate that stomata are open for third marking point.However, allow correct descriptions of guard cells being turgid orflaccid as being equivalent to stomata being open or closed. ‘Lossthrough stomata’ on its own is not sufficient.
Neutral: Any reference to ‘loss by osmosis’.3
(d) Stomata (on upper surface) covered / stomata close due to lack oflight / (grease provides) longer diffusion pathway;
Less evaporation / transpiration / diffusion out;
Accept: Evaporation / transpiration / diffusion ‘stops’ for secondpoint as this could be referring to upper surface.
2
[8]
Page 47 of 64Catalyst Tutors

(a) (i) 1. Removes water vapour / moisture / saturated air;
2. Increases water potential gradient / more diffusion / more evaporation;2
13
(ii) 1. Increases kinetic energy so water molecules move faster;
2. Increases diffusion / evaporation;2
(b) (i) Positive correlation / as light intensity increases so does rate of watermovement / follows same pattern / directly proportional;
1
(ii) 1. Stomata open and photosynthesis increases / transpiration increases;
2. More water pulled up due to cohesion between water molecules / bycohesion tension;
2
(iii) 1. Water pulled up trunk / moves up at fast rate under tension;
2. Sticking / adhesion (between water and) cells / walls / pulls xylem in;
Adhesion is not a specification requirement.
Accept cohesion in this context2
(c) Elastic tissue
1. Elastic tissue stretches under pressure / when heart beats then recoils / springsback;
2. Evens out pressure / flow;
Do not allow credit for expands / contracts / relaxes in this context.
From a marking viewpoint ignore all specific references to arteriesand arterioles. Consider all points as applying to both.
2 Do accept controls
Muscle
3. Muscle contracts to reduce diameter of lumen / vasoconstriction / constrictsvessel;
4. Changes flow / pressure;
Epithelium
5. Epithelium smooth;
6. Reduces friction / blood clots / less resistance;6
[15]
Page 48 of 64Catalyst Tutors

(a) Light (intensity) / temperature / air movement / humidity;1
(b) Prevent air entering / continuous water column;
Allow answer in context of shoot, xylem or potometer.1
14
(c) Distance and time;
Reject ‘amount bubble moves’1
Radius / diameter / area (of capillary tube);1
(d) (used to provide) turgidity / support / description of;
(used in) photosynthesis / (produced in) respiration;
Apparatus not sealed / ’leaks’;2 max
(e) (i) Returns bubble (to start);1
(ii) Increases reliability (of results) / anomalous result can be identified;
Q Ignore references to validity / precision / accuracy etc.1
[8]
(a) Single layer of cells / few layers of cells;
So that light that can pass through / cells absorb light;2
15
(b) Method of determining area of field of view / area seen using microscope;
Count number of stomata in field of view;
Repeats and calculation of mean;3
(c) Water vapour accumulates / increased humidity / reduced air movement (aroundstomata);
Water potential / diffusion gradient reduced;2
[7]
(a) 235–240;;(one mark for an answer between 200-300
based on 2 - 3 stomata in 0.01mm
Alternatively, one mark for calculating the area of the
rectangle correctly as 0.016 – 0.017mm )2
162
2
Page 49 of 64Catalyst Tutors

(b) grows in arid / dry conditions;less surface area;(rate of) transpiration / water loss would be reduced;
3
[5]
(a) 1. (when light intensity is increased) tension in the xylem becomes greater / morenegative / stronger;
2. (this increase) takes place over ≈100 second;3. then levels out;4. stomata open (more);5. increased evaporation / transpiration;6. therefore the water potential of leaf cells becomes more negative / lower;7. therefore more water moves from xylem to surrounding cells;8. down a water potential gradient;9. correct ref. to hydrogen bonds / cohesion;
5 max
17
(b) humidity will affect (the rate of) evaporation / transpiration;increased humidity / humid conditions decreases rate of water loss;
2
[7]
(a) shallow roots enable rapid uptake of rainfall (in X and / or Z);widespread / shallow roots allow collection of larger volumewater / over a larger area / rapid uptake of water (in Z);swollen stem for water storage (in X);deep roots for accessing deep groundwater (in Y);small / no leaves so little transpiration;
3
18
(b) Z;wide spread of roots for rapid water absorption;(accept X; if linked to leaves channelling water to roots)(ignore references to water storage abilities)(accept other responses if justified)
2
[5]
(a) long cells / tubes with no end walls;continuous water columns;no cytoplasm / no organelles / named organelle;to impede / obstruct flow / allows easier water flow;thickening / lignin;support / withstand tension / waterproof / keeps water in cells;pits in walls;allow lateral movement / get round blocked vessels;
4 max
19
Page 50 of 64Catalyst Tutors

(b) (i) increase in transpiration rate / evaporation due toincrease in temperature ;increased (kinetic) energy of water molecules;
OR
increase in light (intensity) increases transpiration rate / evaporation;
greater stomatal aperture / more stomata open so increase in flowrate due to cohesion / attraction of water molecules;
2 max
(ii) adhesion / attraction of water molecules to walls of xylem;results in tension as water pulled up stem;pulling in walls;
2
[8]
(a) (i) unrestricted / free / quick / easy water flow / continuous column / maintainstranspiration stream;
1
(ii) resists tension in water (column) / provides support / strength /maintains column of water / adhesion / prevents water loss
(allow waterproofing in correct context i.e. not absorbing);1
20
(b) (i) as total area of stomata decreases the rate of water flow decreases /decrease is proportional;
(reject proportional, ‘as one goes up the other goes up’ and ‘sameshape’)
1
(ii) increasing / higher temperature causes increasing / higher rate of evaporation /transpiration;(not water loss)
1
(iii) lower plateau (start and finish at same point);(allow if curve sketched on original graph, reject ‘curve is lower’ )
1
(c) conserves water / reduces water loss / reduces transpiration / reduces evaporation;high humidity (in pit) / reduced water potential gradient / less water blown away / increased diffusion pathway;
2
[7]
Page 51 of 64Catalyst Tutors

(a) 1. water evaporates / transpires from leaves;2. reduces water potential in cell / water potential / osmotic gradient across cells (ignore reference to air space);3. water is drawn out of xylem;4. creates tension (accept negative pressure, not reduced pressure);5. cohesive forces between water molecules;6. water pulled up as a column;
4 max
21
(b) (i) same surface area of leaf / number of leaves / age / thickness ofcuticle;
1
(ii) (environmental conditions) affect rate of transpiration / evaporation;1
(iii) presence of grease reduces water loss;1
(c) (i) 1.2 / 1.3g;1
(ii) more stomata on the lower surface;(thicker) waxy cuticle on the upper surface;
2
[10]
(a) (i) rate of flow increases to max at 1200 and then decreases;increasing transpiration / evaporation from leaves;transpiration creates tension / increases transpirational pull;water molecules are cohesive / stick together;produces a water column;
3 max
(ii) (increase transpiration) produce a higher tension / reduces thepressure in the xylem reducing the diameter / adhesive forcesbetween xylem and water;
1
22
(b) water moves in dead cells / xylem is non-living tissue;the process is passive / no energy is needed;
2
[6]
(a) increased humidity leads to decreased transpiration;high humidity means more water in the air / increased saturation /increased water potential;reduced diffusion gradient / water potential gradient;slower rate of water loss / less evaporation;
3 max
23
Page 52 of 64Catalyst Tutors

(b) thick cuticle;impermeable to water / waterproof;
sunken stomata;reduces water diffusion gradient;
shape of leaf / rounded / small surface area;small surface area : volume ratio;
(explanation must be linked to feature)4 max
[7]
Page 53 of 64Catalyst Tutors

Examiner reports
There was a wide range in the quality of the responses to question (a), with 16% gaining 4 or 5marks and approximately the same percentage gaining zero marks. Many students did not seemto understand what is meant by the cohesion-tension hypothesis and complicated their answerwith unnecessary and lengthy accounts of the movement of water across a root, root pressureand even translocation. Those who understood the scope of the question were frequently able toaccess the mark scheme, with most writing about hydrogen bonding between water moleculesresulting in cohesion and water being pulled up the xylem as a continuous column. Many wroteabout transpiration from the leaves though few explained how this would result in a lower waterpotential in the leaf cells. Only a small number of students referred to adhesion of watermolecules to the walls of the xylem vessels.
1
Question (b) discriminated well, with approximately 20% of students gaining 4 or 5 marks and28% gaining no marks (although quite a few of these may well have been as a result of studentsrunning out of time). Some excellent answers were seen in which students wrote logically andclearly using accurate scientific terminology, though even these students rarely gave the fullinformation for complementary base pairing. A high percentage of students gained the 2 marksavailable for describing how the pre-mRNA formed is cut and spliced to form mature mRNA. Therole of RNA polymerase was often incorrectly stated and students frequently stated that plantDNA does not contain introns.
Page 54 of 64Catalyst Tutors

(a) Most students were unable to provide appropriate units to compare the distribution ofstomata on leaves. The units used varied from nanometres to metres and these were oftenmeasurements of length or volume rather than area. A significant number of students wereunder the mistaken impression that ‘per’ can be represented by a solidus.
(b) Most students were able to obtain one mark in this question usually for explaining that lightwould be able to pass through a thin piece of tissue. Very few students obtained bothmarks by further explaining that a single/few layer(s) of cells was required for this to occur.Many students did not gain a second mark due to the use of imprecise terminology, otherswere clearly confused with references being made to ‘diffusion distance’, ‘water loss’ and‘electrons’.
(c) Almost 80% of students were able to obtain at least one of the two marks available. Bothmark points were seen in relatively equal numbers. A common error was to refer tovariation in the number of stomata on different leaves rather than in parts of the same leaf.There were also frequent references to anomalies, not always in the correct context.
(d) The quality of the answers for this question was very disappointing. Consequently, 75% ofstudents scored zero. Some students had not carefully read the question and described arange of xerophytic features of plants rather than those specifically related to leaves. Otherstudents simply described two xerophytic features of leaves but did not provideexplanations. However, most students did suggest two xerophytic features of leaves andgave explanations but these explanations lacked detail. Students often referred to ‘hairstrapping water’ rather than ‘water vapour’ and omitted any reference to water potentialgradients. Another common response was ‘a waxy cuticle to reduce water loss’ whichagain lacks sufficient detail to gain credit. A common misconception was that small leavesreduce surface area to volume ratios rather than referring to needles or spines.
(e) This question was problematic for many students, with only a third gaining any marks. Themost frequently awarded mark point related to the use of water in photosynthesis.However, almost the same number of students suggested that water was produced inphotosynthesis. Slightly fewer students mentioned the use of water to providesupport/turgidity. There were far fewer references to the production of water duringrespiration or its use in hydrolysis. Again, weaker answers suggested that water is used inrespiration or provided vague references to water being used for growth. A significantnumber of students referred to leakage of water from a potometer evidently havingmisinterpreted the context of the question.
4
Page 55 of 64Catalyst Tutors

(a) There was a considerable range in the quality of answers for this question. Some studentsprovided detailed explanations of how the structures of starch and cellulose are related totheir functions. At the other end of the spectrum, students referred to these molecules aspolypeptides and provided details on protein structure. 10% of students gained full marksand almost 15% gained zero. Although many students appreciated the importance ofstarch being compact they did not always relate this to its helical/spiral structure. Moststudents stated that starch did not affect the water potential of cells due to its insolubility.Fewer students related the branching of starch to the faster release of glucose forrespiration or discussed its inability to leave a cell. Generally, more students gained markswhen describing the structure and function of cellulose. Most appreciated the strength ofcellulose but a common error was to relate this to ‘strong hydrogen bonds’. However, asignificant number of students gained credit for describing (micro/macro) fibrils.
(b) As in question 10.1, 10% of students obtained maximum marks. However, almost 30% ofstudents scored zero in this question. The responses from students obtaining low marksincluded a number of factual errors; sugars being produced by sinks, phloem consisting ofdead cells, the transport of sugars in the xylem, transport of glucose rather than sucrose,and transport of sugars using cohesion tension. Conversely, there were also some superbanswers which included detailed explanations that went beyond the requirements of themark scheme. This was particularly evident in the details provided on the loading of sugarsfrom the source into the phloem via companion cells. Better answers contained extensiveexplanations of how co-transport is involved in this process. A significant number ofstudents gained credit for explaining how the pressure gradient between the source andsink was established including the osmotic movement of water into the phloem.Surprisingly, few students obtained the mark for referring to the mass flow of sugarstowards sinks. However, most students did describe the unloading of sugars at sinks.
5
(a) This part discriminated more than was, perhaps, intended. In both (i) and (ii), manystudents did not read the question carefully enough and included comparisons of propertiesor function, rather than structure. For example, many wrote about starch and cellulosebeing insoluble but this is not a similarity of structure. About 40% obtained both marks in (i)and 60% in (ii).
(b) This required students to use the figure and apply some basic concepts. As in (a), somestudents did not read the stem of the question carefully enough and couched their answersin terms of structures I and J.
(i) Many students described (in various ways) the large open space in the sieve cell andsome went on to suggest that this would lead to a (relatively) unrestricted flow; about30% obtained 2 marks and 40% 1 mark.
(ii) This was where more students failed to score because of answers based aroundplasmodesmata (J), which are precluded by the stem of the question. Over 40%obtained 2 marks by linking energy from mitochondria to active transport. Somestudents missed one mark because the examiners rejected references tomitochondria creating or making energy.
6
Page 56 of 64Catalyst Tutors

(a) Invariably, students could offer three appropriate environmental variables that scientistswould have controlled. Some assessors credited what they considered valid, as a generalreaction to control of variables, without considering the conditions that would apply asoutlined in the resource materials with seeds sown in trays and kept in controlledconditions. Students who failed to achieve full credit were usually guilty of producing astereotyped response.
(b) This question troubled many, but the higher scoring students recognised that the curve hadalready levelled out and, in effect, it would serve no purpose to continue at highertemperatures.
(c) Many students chose the wrong reasoning considering the growing conditions to be therelevant factor as opposed to potential differences in the number of stomata at differentstages of leaf development.
(d) In marking point 1, ‘kinetic’ was underlined. This means that use of the term is essentialbefore the marking point can be awarded. Students often identified the effect of atemperature increase on evaporation rate but few expressed this in terms of diffusion rate.As a consequence, most students failed to gain marking point 3.
7
(a) In general, students made good use of the data, as required, answering this question.Weaker answers only identified the overall trend.
(b) There was some misinterpretation of this question by students. All that was required was adescription of what standard deviation shows, namely, the variation in, or spread of dataabout, the mean value. Some attempted to discuss standard deviation values related to thedata obtained but there was no specific direction to do so in this case.
(c) Given that two possible approaches to this question were possible, the majority of studentswere able to make one acceptable line of reasoning.
(d) The link between carbon dioxide and photosynthesis was not apparent to a large number ofstudents. Thus, they failed to gain the mark for this question.
(e) Although all responses were seen within the work that was moderated, most students couldnot make three relevant points – the mark allocation was the key for this – to justify whetherthe results supported the conclusion. It was rare to see recognition of a negativecorrelation, although some described such but were only repeating the question stem and,for doing so, there is no credit. This type of question reflects a weakness with theassimilation of resource material. The likelihood of another factor being responsible wasthe most common point made, but this supports the idea that many students producerehearsed answers without showing a comprehension of what is in the resources.
(f) Many students finished strongly with a question relying on recall. The Marking Guidelinesspecifically referred to “thick” cuticle but some assessors credited reference to ‘waxy’ as analternative.
8
Page 57 of 64Catalyst Tutors

It appeared that some students had not used a potometer. The investigative and practical skillssection of the specification for this unit clearly states that students require specific knowledge ofthe use of a potometer to measure the rate of water uptake. It also makes clear that students canbe tested on this in the examination.
(a) Many students were aware that opening the tap would return the air bubble to the start.Students who appeared unfamiliar with a potometer usually made incorrect guesses fromthe diagram, e.g. ‘add water to the reservoir’, ‘remove the plant’ or ‘remove the bung’.
9
(b) 60% of students gained at least one mark. Better responses usually went beyond ensuringthat the apparatus was airtight. The question asked for specific precautions that shouldhave been taken when setting up the potometer. Despite this, weaker responses typicallynamed factors that should be kept constant.
(c) Given that this question has been asked in a previous series, it is disappointing that over60% of students scored zero. Better responses showed appreciation that water is used forsupport and photosynthesis and produced during respiration. However, weaker responsesseemed to focus on the word ‘transpiration’ in the question stem. Consequently, referencesto the opening and closing of stomata, effects of environmental factors and not all waterbeing used in transpiration were widespread. Similarly, some students thought that water isused in respiration, or produced during photosynthesis.
(d) This proved to be an excellent discriminator. Just under half of students scored at least twomarks. This was usually for appreciating that removing more leaves meant fewer stomata,less transpiration and less tension. Unfortunately, weaker responses often did no morethan describe the relationship between the number of leaves removed and the rate oftranspiration. Some students had difficulty in applying their knowledge to an unfamiliarcontext. They wrote all they knew about cohesion-tension, without linking this directly to thedata in the table.
(a) (i) There were many approaches used in trying to explain this. Better students wereprecise in answering, relating data given to stomatal action and transpiration. Somedid not read the stem carefully and wrote about changes in pressure. Many othersfailed to make the link between flow in the xylem and transpiration. The idea ofincreased tension occured only rarely but most students showed an understanding ofcohesion.
(ii) Most students made an attempt at this question but often made incorrect reference toroot pressure and osmosis. There were some imprecise general discussions of waterflow and transpiration, but there were also good answers showing clearunderstanding of principles. Again the best answers addressed the context of thequestion rather than producing generalisations. Many incorrect answers linked thenegative values of water potential to negative pressure in the xylem.
10
Page 58 of 64Catalyst Tutors

(b) (i) Generally answered well, but answers often only described rather than explained thedifference in wall thickness. A significant number of students wrongly referred to theartery wall as ‘needing thick layer of muscle to pump the blood’.
(ii) There were frequent incorrect references to the aorta wall contracting or relaxing andto thickness increasing due to contraction. There were also many very generalreferences to vasodilation or constriction. A frequently expressed incorrect idea wasthat the wall would become thicker with increasing pressure.
(iii) This question was answered well by the majority of students. Frequent inappropriateresponses involved relating the function of the vessel to wall thickness rather than tothe variations in wall thickness.
(c) The majority of students were able to score high marks on this question. Many gave wellreasoned answers, although some failed to include precise detail. There were often gooddiscussions relating to hydrostatic, water and osmotic pressures. Many students madegood references to the role of the lymphatic system, although a common error was to statethat the lymph nodes returned the surplus fluid to the circulatory system.
(i) It was pleasing to note that the vast majority of students were able to describe the rate ofwater movement in the upper branches and gain both marks. Only 5% obtained zero onthis question.
(ii) Many students gained one mark for the idea that the peak is higher in the upper branches.However, relatively few students described a second difference between the results in thetrunk and upper branches. A significant number of students simply described one of theresults and gained no marks.
11
(iii) Approximately half the students gained one mark by describing how tension is produced orby referring to water being pulled up the tree. Very few students referred to watermovement starting in the upper branches for a second mark.
(a) This was a straightforward question with over ninety percent of candidates gaining bothmarks and very few scoring zero.
(b) A third of the candidates gained this mark for clearly indicating that measuring water loss inmilligrams would improve precision or accuracy. Incorrect responses often mentionedreliability, anomalous results, or calculating a mean.
(c) Some answers were limited to descriptions of the graph and scored zero, or referred ingeneral terms to transpiration for one mark. Candidates scoring three marks often provideda clear, detailed explanation of the results including reference to changing water potentialgradients and the opening and closing of stomata. A significant number of candidates alsorealised that water was not replaced in the leaves as they were detached.
(d) Most candidates gained one mark for indicating that there would be less transpiration orevaporation. Far fewer candidates, however, suggested that the grease had covered thestomata or had increased the diffusion pathway. Many candidates failed to get this mark asthey simply stated that the grease provided a waterproof layer.
12
Page 59 of 64Catalyst Tutors

(a) Many candidates appeared to understand the principles that were being tested in the twoparts of this question but explanations often fell short of the required standard. In part (i) areference was required to the dispersal of water vapour and the consequences of this onthe diffusion or water potential gradient. Many less able candidates offered explanations interms of moving air forcing water out of the leaf or involving water moving out of the leaf byosmosis. Those who appreciated, in part (ii), that an increase in temperature increasedkinetic energy usually progressed to refer to an increase in the rate of movement of watermolecules. Others, perhaps inevitably, attempted to link temperature with enzyme activity
13
(b) Most candidates followed the instruction in part (i) and described the relationship withsufficient precision to gain the mark. They were also able to link movement through thexylem to increased light intensity and stomatal opening with some success. However, by farthe most popular response to part (ii) was to suggest that there would be an increase in therate of photosynthesis and therefore more water would be needed by the plant. The termscohesion and tension were frequently used in such a way as to suggest little realunderstanding. It was not uncommon to read about water molecules being pulled throughthe xylem because “they stick to each other by cohesion-tension”. The idea conveyed inpart (iii) appeared to be unfamiliar to all but the best candidates. The structure of thequestion should have lead candidates to realise that it was testing the same basic principle.The question was worded in such a way as to encourage candidates to explain the lowerdiameter at 12.00. Many opted however to explain the converse of this and based theiranswers on suggestions involving storage of water in the xylem.
(c) Responses to this question were very disappointing as evidenced by the large number ofcandidates who were unable to gain credit. Many answers were very general and did littlemore than suggest, often at great length, that “strong” walls meant that blood vessels didnot burst under pressure. Such answers often established this point for arteries, thenrepeated it for arterioles. Only the very best candidates appeared aware of the presence ofmuscle and elastic tissue within the walls and could describe the roles of these particulartissues. There was also much emphasis on valves. They were correctly described as notbeing present in arteries and arterioles but then discussed in terms of what they wouldhave done if they had been present. Those candidates who referred to the endotheliumwere generally able to point out its functions in reducing friction. There were others,however, who considered the lumen to be a fundamental component of the wall.
(a) The vast majority of candidates was able to give one correct environmental factor that thestudent should have kept constant during the investigation.
(b) Answers to this question were generally disappointing with only a third of candidatesappreciating that it was important to prevent air entering the shoot, xylem or potometer.
14
(c) Approximately half the candidates obtained a mark for indicating that distance and timehave to be measured. Very few candidates obtained a second mark by indicating that theradius, diameter or area of the capillary tube had to be measured.
(d) Surprisingly, this proved the most difficult question on the paper. Seventy five percent ofcandidates scored zero with many candidates simply stating that not all the water is used intranspiration. Candidates obtaining one mark often referred to water being used inphotosynthesis. Very few candidates obtained a second mark by indicating that water isused to provide support or that it may evaporate or ‘leak’ from the apparatus.
Page 60 of 64Catalyst Tutors

(e) (i) Most candidates simply suggested that the reservoir would allow water to be added.Fewer candidates gained the mark by linking this to moving the position of thebubble.
(ii) Most candidates gained this mark by indicating that repeat measurements wouldenable the reliability of the results to be assessed.
(a) Most candidates appreciated that having a thin piece of epidermis would allow light to passthrough the specimen. However, far fewer candidates could explain this in terms of a singleor few layers of cells being present. A common misconception was that being thin enabledorganelles to be identified.
15
(b) This proved to be the most demanding question on the paper with over 75% of candidatesscoring zero. It was very evident that most candidates had little experience or recall of thistype of practical work. Most candidates simply stated that the number of stomata on a leafwould be counted and divided by the area without any reference to using the slide. Almostinvariably when candidates did gain a mark, this was for carrying out repeats andcalculating a mean.
(c) Although many candidates gained one mark, a significant minority did not mainly due topoor or imprecise terminology. References to ‘trapped water droplets’ rather than watervapour or to ‘concentration gradient’ rather than water potential gradient were frequentlypenalised. Consequently, few candidates obtained both marks.
(a) Very few candidates correctly worked out the area as 0.0167mm2 and many seemed tohave a basic problem with calculating areas. It was common to see 0.1 x 0.1 = 0. l mm2.Many candidates failed to gain credit by carrying out calculations that were not clearlyidentified. A common approach was to estimate the number of stomata in an area 0. 1mm x0. 1mm, which gained credit if done correctly. Many gave answers that were clearlyincorrect, such as 20-25 or even 0.25!
16
(b) Most candidates picked up the 2 marking points but some failed to gain the second point byincorrectly stating that ‘fewer stomata prevent water loss’. Few answers referred to the ideaof there being a reduced surface area.
(a) An increase in negativity, representing an increase in tension, was a stumbling block formany candidates. Having set off on the wrong foot they then found it more difficult toanswer the question effectively, even though they often understood the mechanics of watertransport quite well. Few candidates scored more than one mark for their description of theeffects of increasing light intensity. A reasonable number of candidates lost their way indetailed descriptions of the mechanism of stomatal opening. As a result, few candidatesscored all five marks although many gained some credit. The contribution of increasedphotosynthesis to tension is so small that credit could not be given for the suggestion.
17
(b) This question produced many simplistic responses which centred around the idea of ‘a fairtest’.
It appeared that many of the candidates knew the answer failed to gain marks for not beingsufficiently explicit. Many answers made the connection between humidity and transpirationbut went no further.
Page 61 of 64Catalyst Tutors

(a) Most candidates could identify three features which were adaptations to desert conditions.Some candidates were rather vague with responses like ‘lots of roots’, and many failed toidentify which plant(s) they were referring to.
(b) Most candidates correctly identified Z as the resurrection plant and gained two marks. Themost common error was suggesting plant X because of its ability to store water. This wasnot given credit.
18
(a) This question produced a full range of marks with some candidates gaining full marks but asubstantial number gaining no marks. This appeared to be a topic that was oftenoverlooked by centres.
19
(b) Only the better candidates scored both marks in part (i). Many correctly linked an increasein temperature or light intensity with an increase in the rate of transpiration. Only the moreable went on to explain this increase in terms of kinetic energy or stomatal aperture. Fewrelated this to the flow rate. Part (ii) was answered well with many candidates able to relatethe adhesion properties of water to the pulling in of xylem vessels. As in previous years,many candidates used the terms ‘cohesion’ and ‘tension’ very loosely with littleunderstanding of their meaning.
(a) Both parts of this question were answered correctly by the vast majority of candidates.
(b) (i) Many candidates achieved the mark for this question by correctly identifying therelationship in the given time period, but some failed to achieve it because they gavea general relationship which is not valid between midday and midnight: for example,‘the relationship is proportional’ does not sufficiently explain the decreasing aspect ofthe relationship in the time given. Some candidates lost this mark by making aninappropriate link between the cause and effect: for example, ‘the total area ofstomatal openings decreases when the rate of flow of water decreases’.
20
(ii) Relatively few candidates gave enough detail in their answer to achieve this mark.Often they failed to appreciate the temperature is likely to continue increasingbetween 8 am and midday. If they had this idea they often failed to link it to a processin which water is lost from a plant (by evaporation or transpiration). A lot ofcandidates recognised that there would be an increased rate of transpiration, but theygave the wrong reason for it: for example, because light intensity has increased orthere is more photosynthesis taking place.
(iii) This proved to be a difficult question for many candidates who clearly understoodwhat was required, but who expressed themselves without sufficient clarity to gainthe mark: for example, ‘the curve is lower’, ‘the area of stomata is smaller’ were oftenquoted and gained no mark.
(c) Xerophytic adaptations are known well by the majority of candidates. Many achieved bothmarks.
Page 62 of 64Catalyst Tutors

(a) There were some very good answers achieving maximum marks. However, many answersused very vague language, such as ‘water is pulled up by cohesion-tension’, with nodescription of what cohesion involves, or what creates the tension. Water was said bymany to be ‘sticky’. This was the lowest level of answer accepted for a mark aboutcohesion. Root pressure was often included in the description of cohesion-tension, whichcost candidates time but gained no credit.
21
(b) (i) Many candidates appear to confuse the concept of fair testing with reliability; bothterms being used interchangeably.
(ii) More able candidates answered in terms of how an environmental variable couldaffect the rate of transpiration, or the rate of evaporation, rather than just stating ‘tokeep water loss the same’.
(iii) Most candidates gave the correct answer.
(c) (i) Most candidates calculated the mass of water lost accurately.
(ii) Many candidates missed marks by failing to give a comparison between the upperand lower surfaces of leaves. There were many references to ‘pores’ rather than‘stomata’, or a ‘waxy layer’ rather than a ‘cuticle’, indicating a poor knowledge of leafstructure.
(a) (i) This question was answered well by only the better candidates. The description ofwater flow was not well done; often the information in the graph was not used to givean A level standard description. For example, although many candidates noted that itincreased and decreased few wrote that water flow peaked at midday. To explain thispattern many answers used the phrase ‘cohesion tension’ very loosely. However,good answers explained clearly the relationship between the rate of transpiration, themovement of water and the cohesive properties of water molecules. There weremany confused accounts which involved general descriptions of water flow anddiameter changes which were not creditworthy. The fact that transpiration increasedduring the day was often missed, and the link between that and an increased tensionwas tenuous at best.
22
(ii) Very few candidates gained credit for explaining why the diameter of the branchdecreased. A common misconception was that the change was due to lack of turgor.The effect of cohesion and adhesion confused many candidates with few makingreferences to a reduction in pressure; far more candidates thought that there was anincrease in pressure.
(b) Many answers correctly stated that picric acid would have no effect on xylem as this isnon-living or dead tissue. Better answers went on to relate this observation to the passivenature of the transpiration stream.
Again most candidates scored highly on this question, with many achieving maximum marks.
(a) Most candidates were able to describe the relationship between humidity and transpirationrate, and then to explain this relationship in terms of how high humidity increases theamount of water in the air, and therefore decreases the diffusion gradient, resulting in aslower rate of water loss. Marks were often not awarded for incorrect or vagueexplanations, such as ‘water is lost to the air by osmosis’ or ‘humidity affects the apertureof the stomata’.
23
Page 63 of 64Catalyst Tutors

(b) There were many excellent answers relating features evident in the diagrams with clearexplanations of how each feature contributes to a lower rate of transpiration. For example,many candidates correctly recognised the thicker cuticle of the xerophytic leaf andexplained how the waterproof property of the cuticle reduces water loss. A lack of precisionoften resulted in few marks, such as the vague statement that the cuticle reduces waterloss with no explanation of how this is achieved. Sunken stomata reducing the diffusiongradient of water and the shape of the leaf resulting in a smaller surface area:volume ratio,were correctly identified as other explanations, but they were less common.
Page 64 of 64Catalyst Tutors