5. non-parametric methods - the barton group · p-values and statistical tests 5. non-parametric...
TRANSCRIPT

P-values and statistical tests5. Non-parametric methods
Hand-outsavailableathttp://is.gd/statlec
MarekGierlińskiDivisionofComputationalBiology

Statistical test
2
NullhypothesisH0:noeffect
Significancelevel𝛼 = 0.05
StatisticTData
p-value
𝑝 < 𝛼RejectH0
𝑝 ≥ 𝛼Insufficientevidence

Nonparametric methodsn Parametricmethods:
o requirefindingparameters(e.g.mean)o sensitivetodistributionso don’tworkinsomecaseso morepowerful
n Nonparametricmethods:o basedonrankso distribution-freeo widerapplicationo lesspowerful
3
Parametrictest
Nonparametrictest
Mann-Whitney test(Wilcoxon rank-sum test)
a nonparametric alternative to t-test

Mann-Whitney testn Twosamplesrepresentingrandomvariables𝑋 and𝑌
n Nullhypothesis:thereisnoshiftinlocation(and/orchangeinshape)
𝐻,: 𝑃 𝑋 > 𝑌 = 𝑃 𝑌 > 𝑋
n Onlyranksmatter,notactualvalues
5
𝑋 𝑌

Mann-Whitney testn Twosamples:𝑥2, 𝑥4, … , 𝑥67𝑦2, 𝑦4, … , 𝑦69
n Foreach𝑥: countthenumberof𝑦;,suchthat𝑥: > 𝑦;
n Thesumofthesecountsoverall𝑥: is𝑈=
n Dothesamefor𝑦; andfind𝑈>
n Teststatistic
𝑈 = min(𝑈=, 𝑈>)
6
𝑈= = 10𝑈> = 32
𝑈 = 10
𝑋 𝑌

Mann-Whitney testn 𝑈 measuresdifferenceinlocationbetweenthesamples
n Withnooverlap𝑈 = 0n Directionnotimportant
n 𝑈 = max = 67694
whensamplesmostsimilar
7
𝑈= 𝑈>
𝑈

Null distribution
8
Populationofmice
Selecttwosamplessize7and6
measuretheirlifespan
Find𝑈
Builddistributionof𝑈
×10J
𝑛= = 7𝑛> = 6
Nulldistributionrepresentsallrandomsampleswhenthenull
hypothesisistrue

Null distributionn Forlargesamples𝑈 isapproximatelynormallydistributed(halfofit)with
𝜇O =𝑛=𝑛>2
𝜎O =𝑛=𝑛> 𝑛= + 𝑛> + 1
12
�
n Forsmallersamplesexactsolutionsareavailable(tablesorsoftware)
9
𝑛= = 7𝑛> = 6
𝜇O =7×62 = 21
𝜎O =7×6× 7 + 6 + 1
12�
= 7

P-value
10
𝑈= = 10𝑈> = 32
𝑈 = 10
𝜇O = 21 g𝜎O = 7 g
𝑍 =𝑈 − 𝜇O𝜎O
= −1.57
𝑝 = 0.12Exactsolution:𝑝 = 0.14
Observation
12 𝑝 = 0.06

Limited usage for small samples
11
Only5possiblep-values:0.1,0.2,0.4,0.7,1𝑝 = 0.1

Comparison to t-test
12
t-test𝑝 = 0.042
MWtest𝑝 = 0.14

Mann-Whitney can compare medians, but...n Considertwosamplesinthefiguren Yes,Iknowtheyarecontrived
n Mediansaresimilar,butmed𝑋 > med𝑌
n Mann-Whitneytestgives𝑈 = 100 andone-sided𝑝 = 0.02
n 𝑌 exceeds𝑋!
n Mann-Whitneytestissensitivetochangeinlocation(median)and/orshape
n Ifshapesarethesame,thenMWtestcanbeatestofmedians
n Otherwise,useMood’stestformedians
13
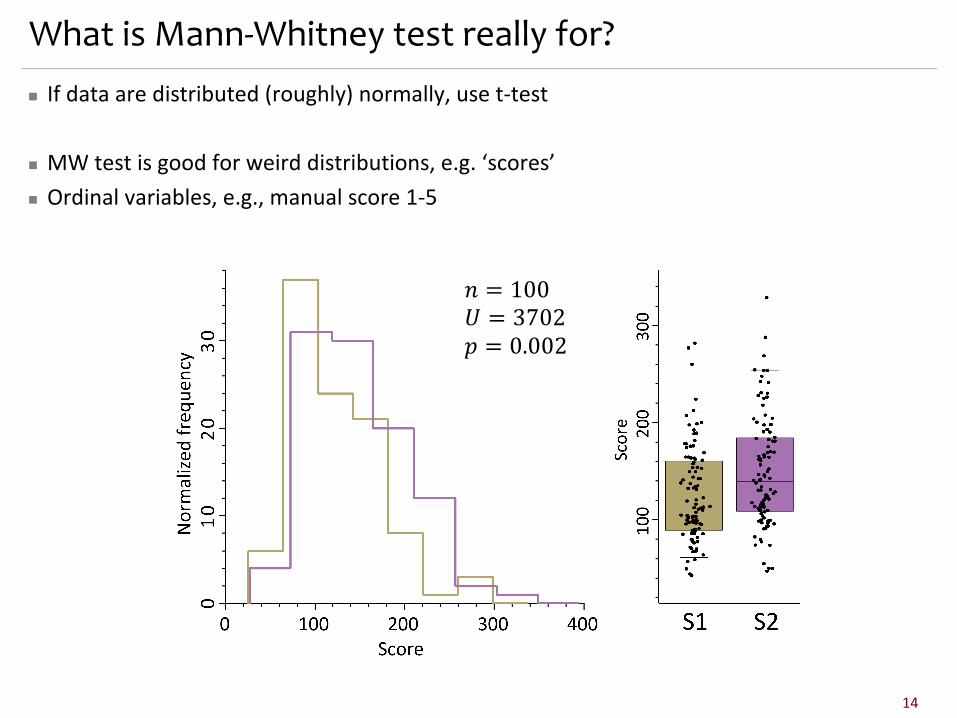
What is Mann-Whitney test really for?n Ifdataaredistributed(roughly)normally,uset-test
n MWtestisgoodforweirddistributions,e.g.‘scores’n Ordinalvariables,e.g.,manualscore1-5
14
𝑛 = 100𝑈 = 3702𝑝 = 0.002

How to do it in R?>x =c(0,7,56,112,464,537,575)>y =c(402,434,472,510,600,627)#Mann-Whitneytest>wilcox.test(x,y)
Wilcoxonranksumtest
data:xandyW=10,p-value=0.1375alternativehypothesis:truelocationshiftisnotequalto0
#Mood’stestformedians>mood.test(x,y)
Moodtwo-sampletestofscale
data:xandyZ=0.55995,p-value=0.5755alternativehypothesis:two.sided
15

Mann-Whitney test: summary
16
Input two samplesof𝑛2 and 𝑛4 valuesvaluescanbeordinal
Assumptions Samplesarerandomandindependent(nobefore/after tests)If usedformedians,bothdistributionsmustbethesame
Usage Comparelocationandshapeoftwosamples
Nullhypothesis Thereisno shiftinlocationand/orchangeinshapeStronger version:bothsamplesarefromthesamedistribution
Comments Non-parametriccounterpartoft-testLesspowerfulthant-test(uset-testifdistributionssymmetric)NotveryusefulforsmallsamplesDoesn’treallygivetheeffectsize

Mann-Whitney-Wilcoxon
17
FrankWilcoxon(1892-1965)
Wilcoxon,F.(1945) ”IndividualComparisonsbyRankingMethods” BiometricsBulletin1,80–83
HenryBertholdMann(1905-2000)
Mann,H.B.;Whitney,D.R.(1947)."OnaTestofWhetheroneofTwoRandomVariablesisStochasticallyLargerthantheOther"AnnalsofMathematicalStatistics 18,50–60
DonaldRansomWhitney(1915-2007)

Wilcoxon signed-rank test
a nonparametric alternative to paired t-test

Paired datan Samplesarepairedn Forexample:mouseweightbeforeandafterobesitytreatment
n Nullhypothesis:differencebetweenpairsfollowsasymmetricdistributionaroundzero
n Example:mousebodymass(g)
19
Before: 21.4 20.2 23.5 17.5 18.6 17.0 18.9 19.2
After: 22.6 20.9 23.8 18.0 18.4 17.9 19.3 19.1

Wilcoxon signed-rank testn Findthedifferences:
∆:= 𝑦: − 𝑥:
𝑠: = sgn(𝑦: − 𝑥:)
n Orderandrankthepairsaccordingto∆:
𝑅: - rankofthei-thepair
n Teststatistic:
𝑊 =^𝑠:𝑅:
6
:_2
20

Wilcoxon signed-rank testn 𝑊 measuresdifferenceinlocationbetweenpairsofpoints
n Directionisimportant
n 𝑊 = 0 whensamplesmostsimilar
21
Null distribution
22
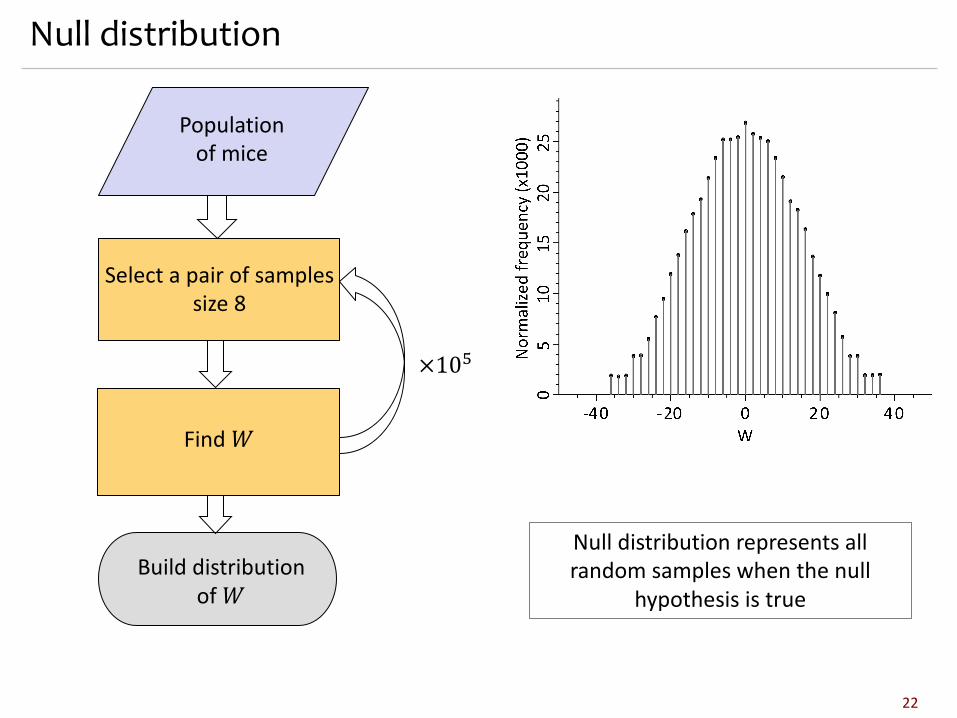
Populationofmice
Selectapairofsamplessize8
Find𝑊
Builddistributionof𝑊
×10J
Nulldistributionrepresentsallrandomsampleswhenthenull
hypothesisistrue

Null distributionn Forlargesamples𝑊 isapproximatelynormallydistributedwith
𝜇` = 0
𝜎` =𝑛(𝑛 + 1) 2𝑛 + 1
6�
n Forsmallersamplesexactsolutionsareavailable(tablesorsoftware)
23
𝑛 = 8
𝜎` =8×9×17
6�
= 204� ≈ 14.3

P-value
𝑥: 𝑦: Δ: 𝑅: 𝑠: 𝑠:𝑅:19.2 19.1 0.1 1 -1 -118.6 18.4 0.2 2 -1 -223.5 23.8 0.3 3 1 318.9 19.3 0.4 4 1 417.5 18.0 0.5 5 1 520.2 20.9 0.7 6 1 617.0 17.9 0.9 7 1 721.4 22.6 1.2 8 1 8
30
24
𝑛 = 8𝑊 = 30𝜎` = 14.3𝑍 = 𝑊/𝜎` = 2.10𝑝 = 0.036𝑝fghij = 0.039
Observation
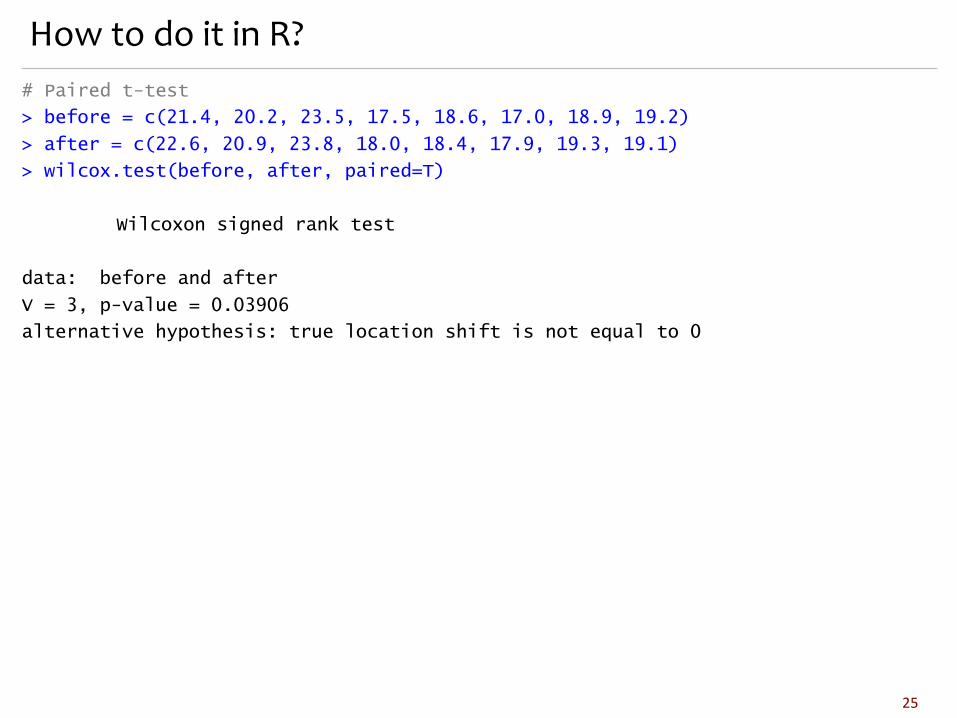
How to do it in R?# Paired t-test
> before = c(21.4, 20.2, 23.5, 17.5, 18.6, 17.0, 18.9, 19.2)
> after = c(22.6, 20.9, 23.8, 18.0, 18.4, 17.9, 19.3, 19.1)
> wilcox.test(before, after, paired=T)
Wilcoxon signed rank test
data: before and after
V = 3, p-value = 0.03906
alternative hypothesis: true location shift is not equal to 0
25

Wilcoxon signed-rank test: summary
26
Input Sampleof𝑛 pairsofdata(before andafter)Valuescanbeordinal
Assumptions Pairs shouldberandomandindependent
Usage Discoverchangeinindividualpointsbetweenbefore andafter
Nullhypothesis Thereisnochangebetweenbefore andafter iszeroThedifferencebetweenbefore andafterfollowsasymmetricdistributionaroundzero
Comments Non-parametriccounterpartofpairedt-testPaireddataonlyDoesn’tcareaboutdistributionsNotveryusefulforsmallsamples

Kruskal-Wallis test
a nonparametric alternative to one-way ANOVA
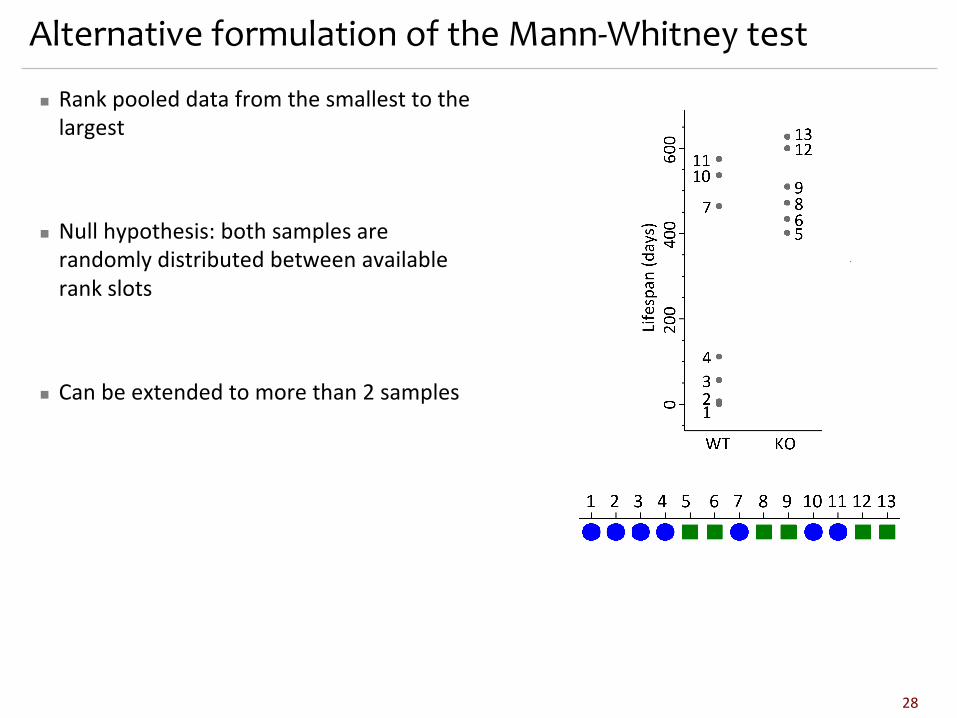
Alternative formulation of the Mann-Whitney test
n Rankpooleddatafromthesmallesttothelargest
n Nullhypothesis:bothsamplesarerandomlydistributedbetweenavailablerankslots
n Canbeextendedtomorethan2samples
28

Ranked ANOVA
29

Variance between groups
30
�̅� =𝑁 + 12
�̅�n

Test statisticn Sumofsquareresiduals
𝑆𝑆p = ^𝑛n �̅�n − �̅�4
6
n_2
n Rankvariance
𝜎4 =112𝑁(𝑁 + 1)
n Teststatistic
𝐻 =𝑆𝑆p𝜎4
𝐻 =12
𝑁(𝑁 + 1)^ 𝑛n �̅�n −𝑁 + 12
46
n_2
31
�̅� =𝑁 + 12
�̅�n

Test statistic
𝐻 =12
𝑁(𝑁 + 1)^ 𝑛n �̅�n −𝑁 + 12
46
n_2
n whereo 𝑛n – numberofpointsingroup𝑔o �̅�n – meanrankingroup𝑔o �̅� = (𝑁 + 1)/2 – meanranko 𝑁 – numberofallpointso 𝑛 – numberofgroups
n 𝐻 isdistributedwith𝜒4 distributionwith𝑛 − 1 degreesoffreedom
n Nullhypothesis:meanrankineachgroupisthesameastotalmeanrank
𝐻,: �̅�n =𝑁 + 12
32
�̅� =𝑁 + 12
�̅�n

English Scottish Welsh N.Irish
Number 𝑛n 12 9 8 5
Meanrank �̅�n 18.96 16.78 22.81 6.80
ContributiontoH𝑛n �̅�n − �̅�
4
𝜎4 0.258 0.047 2.27 5.77
𝐻 =1𝜎4^ 𝑛n �̅�n − �̅�
46
n_2
�̅� =𝑁 + 12 = 17.5 𝜎4 =
𝑁(𝑁 + 1)12 = 99.2
𝐻 = 8.36

Null distribution
34
𝑝 = 0.04
𝜒4 distributionwith3d.o.f.
Observation
Populationofmice
Selectfoursamplessize12,9,8and5
Find𝐻
Builddistributionof𝐻
×10J
Nulldistributionrepresentsallrandomsampleswhenthenull
hypothesisistrue

Comparison to ANOVA
35
Kruskal-Wallis
𝑝 = 0.04
ANOVA
𝑝 = 0.18

How to do it in R?> mice = read.table('http://tiny.cc/mice_kruskal', header=T)> kruskal.test(Lifespan ~ Country, data=mice)
Kruskal-Wallis rank sum test
data: Lifespan by Country
Kruskal-Wallis chi-squared = 8.3617, df = 3, p-value = 0.0391
36

What about two-way test?
n Scheirer-Ray-Hare extensiontoKruskal-Wallistestn Briefly:replacevalueswithranksandcarryouttwo-wayANOVA
Scheirer C.J.,RayW.S.andHareN(1976),TheAnalysisofRankedDataDerivedfromCompletelyRandomizedFactorialDesigns,Biometrics,32,429-434
37

Kruskal-Wallis test: summary
38
Input 𝑛 samplesofvalues𝑁 valuesdividedinto 𝑛 groups
Assumptions Samplesarerandom andindependent
Usage Comparelocationandshapeof𝑛 samples
Nullhypothesis MeanrankineachgroupisthesameastotalmeanrankThereisnochangebetweengroups
Comments Doesn’tcareaboutdistributions

Hand-outsavailableathttp://tiny.cc/statlec