5. electronics - ijecierd -low complexity viterbi - vineeta kumari
DESCRIPTION
TJPRC JournalsTRANSCRIPT

www.tjprc.org [email protected]
LOW COMPLEXITY VITERBI DECODER BY USING TRELLIS STRUCTURE
VINEETA KUMARI1, N R KIDWAI
2 & M ALAM
3
1Department of E.C, Integral University, Uttar Pradesh, India
2,3Department of E.C, Integral University, Uttar Pradesh, India
ABSTRACT
Viterbi Algorithm (VA) has been traditionally implemented in the digital domain, high-speed, small size, and
low-power constraints have motivated researchers to look for analog realizations. Analog Viterbi decoders have
demonstrated many advantages over digital realizations and various analysis of partial-response signalling (PRS) read
channel often employs an analog detector in its processor core. In an analog implementation, savings are mainly due to the
elimination of the A/D, which usually turns out to be a large and power hungry block at high speeds. This paper describes
an integrated analog Viterbi decoder for PSK and FSK partial-response signals. The decoder is based on a new derivation
of the difference metric Viterbi algorithm, to be described in this paper.
KEYWORDS: Viterbi Decoder, Convolutional Encoder, PSK, FSK, Inter Symbol Interference
INTRODUCTION
Partial response signalling (PRS) [1] is a signaling scheme first proposed for data communication [2], [3] for
controlling the amount of inters symbol interference (ISI) to the signal before the signal is transmitted. This controlled ISI
is then removed at the receiver. By relaxing the condition of zero ISI, certain beneficial effects can be attained through
convenient spectral shaping. Two examples of these effects are providing more similarity between the spectrum of the
transmitted signal and the frequency response of the channel, and realizing minimum-bandwidth transmission systems in
practice.
A PRS system can be modeled by a finite impulse response (FIR) filter. The transfer function of the filter,
expressed in terms of a time-step delay D, is known as the coding polynomial. Two commonly used factors of the coding
polynomials are 1-D and 1+D. These two factors, namely dicode and duobinary, create often-desirable spectral nulls at dc
and fs/2, respectively. Combining these two factors results in a decoding system with the coding polynomial 1-D2.
In addition to the usefulness of the spectral shaping attained from this signaling scheme, it is also attractive from an
implementation point of view. A decoding system can be built by time-interleaving two independent decodes [4]. This
decomposition is particularly useful at high speeds, as, in addition to reducing the complexity, it also reduces the speed of
each dicode to half the symbol rate. Figure 1 illustrates the time-interleaved decomposition concept.
International Journal of Electronics,
Communication & Instrumentation Engineering
Research and Development (IJECIERD)
ISSN(P): 2249-684X; ISSN(E): 2249-7951
Vol. 5, Issue 3, Jun 2015, 37-50
© TJPRC Pvt. Ltd.

38 Vineeta Kumari, N R Kidwai & M Alam
Impact Factor (JCC): 5.2896 NAAS Rating: 2.23
Figure 1: Time-Interleaved Structure of a Class-IV PRS System
Beside data communication, coding schemes are receiving considerable attention in the magnetic-storage area. It
has been shown that the read signal of a saturated magnetic-recording system resembles a partial-response signal [5].
Although more complicated coding – decoding response schemes have been proposed but Viterbi scheme appears to
provide a good compromise between the density of the storage device and the complexity of the detector.
Viterbi Decoding Algorithm
Viterbi decoding is a multilevel signalling scheme and exhibits a loss in the performance if conventional
symbol-by-symbol detection is used. However, this loss can be combated if a more complicated detection scheme is
employed. In this paper it has been shown that maximum-likelihood sequence detection (MLSD) leads to the optimum
performance because it fully exploits the redundancy introduced by the level coding [6], [7]. MLSD is usually realized by
the Viterbi algorithm (VA) [8], [9]. The basic idea behind Viterbi detection is to consider the received sequence as a
finite-state discrete-time Markov process contaminated by memoryless noise. A trellis diagram is conceptually constructed
by unwrapping the state diagram in time. The detector assigns a metric to each branch of the trellis, proportional to the
error signal (usually mean-square error) between the received value and the ideal signal resulting from that transition.
The maximum-likelihood sequence is the one which results in the minimum accumulated error throughout the trellis.
This approach is algorithmic in the sense that at each time step, and for each one of the states of the trellis, the state metric,
defined to be the accumulated error signal, is calculated using the previous state metrics and the branch metrics at that time
step. In addition to the state metrics, the paths along which these optimum metrics have been obtained are also saved.
A block of digital memory can be used to save the required information. Following the literature, we shall refer to this
memory as path memory and its contents as survivor sequences.
Here, each decoder has an input-interleaved structure (in addition to time-interleaving two dicodes to realize the
PSK and FSK decoder) which eliminates analog feedback and thereby substantially increases the speed of the overall
circuitry. Furthermore, it is less complex and more robust with respect to circuit imperfections than other reported analog
integrated decoders. Each decoder consists of a fully differential analog processing core and a digital path memory. The
interleaving and de-interleaving circuits may be included on the system.
PROPOSED WORK
In the normal convolution encoder shift register output are passing through XOR gate in our work since we have
used 101, 111 generator polynomial for convolution encoder hence such an encoder normally uses two XOR gate & two
shift register due to incorporation of shift register the encoder represents are sequential circuit in this way we can
represents our encoder as the algorithm based on state transition diagram as shown in figure 2.

Low Complexity Viterbi Decoder by Using Trellis Structure 39
www.tjprc.org [email protected]
Figure 2: State Diagram for Convolutional Encoder
Our algorithm is based on above describe state transition diagram state of using operational behaviour of shift
register & XOR gate after the encoding processes both the data stream simply pass through BPSK modulator equation.
Above main work focus on the steps that are involve during decoding process. The processes design simpler by
considering to different parameter of the decoder
Distance calculation
Metric calculation
The design modification that we have involve are both abstract are proposed below.
2.1 Proposed Method for Distance Calculation
The viterbi decoder receives two symbols at a time 2*2 MIMO system considered as Y0 and Y1 since in the
normal decoder first all symbols are demodulated in a bit format and their after hamming distance is calculative between
all the possible combination of two bits.
This hamming distance is the no. of differing bits in between both two bit data it can be computed by performing
XOR operation Y0, Y1 with 00, 01, 10, 11 then counting the no of 1. In this way we can get four possible hamming
distance as given below.
Hd1=00 XOR Y0Y1
Hd2=01 XOR Y0Y1
Hd3=10 XOR Y0Y1
Hd4=11 XOR Y0Y1
In another literature more accurate method for finding distance is proposed as given below.
Y= (1)
Proposed method of metric calculation – Normally metric is calculated using the flowing equation

40 Vineeta Kumari, N R Kidwai & M Alam
Impact Factor (JCC): 5.2896 NAAS Rating: 2.23
=2
BPSK there are two metric for 2*1 MIMO system as given in reference [1] where r(t) is possible received
symbols represented as –j,+j that is (-1,+1) and Y(i) are the actual symbols data are received after mixing noise by channel.
In our proposed scream we have considered following formula from calculating metric for transition from one
state to other.
RESULTS AND DISCUSSIONS
In this work we have considered such a case where Viterbi algorithm is used for symbols received through a noisy
channel from multiple input convolutional encoded signal. The basic algorithm used in the Viterbi decoding considered the
receive sequence as a finite state Markov process distorted by memory less noise.
We have focused on a trellis diagram for two bit received symbol sequence in a develop algorithm the decoded
assign a metric for each possible state transmission with respect to trellis diagram.
For each state of the trellis the state metric is calculated using previous state metric and the corresponding
distance.
We have described our result for different combination of bit length and block size which are perform one by one
and discussed in the upcoming section.
Table 1: Total No of Bits =102 for BPSK Modulation
SNR(dB) BLOCK
LENGTH(N)
N=10 N=100
1 0.16 0.23
2 0.04 0.01
3 0.03 0.00
4 0.06 0.00
5 0.05 0.00
6 0.02 0.00
7 0.00 0.00
8 0.00 0.00
9 0.00 0.00
10 0.00 0.00
11 0.00 0.00
12 0.00 0.00
Case 1.1.B=100,N=10: Initially we have taken Bit length=100, block length=10 in this case we have shown the
value of BER in the table 1 and the plot is given as figure 3 (a). In this figure the dark block line indicate the theoretical
value of BER and different SNR. X- axis is the SNR dB varying from 1 to 12dB and Y axis is the logarithmic value of
BER in this way it is the semi log plot showing the performance of our Viterbi decoder over AWGN channel for BPSK
modulated symbols.
In this figure 3 we can observed that as the SNR increase theoretical BER is decrease (black line) but our
simulated BER is slightly higher at SNR 4dB and 5dB it is a approximately 0.06 and 0.05 after 6dB the BER has reached
to zero value in this way our simulated BER is the lower then the theoretical BER varying from 0.16 to 5.4*10-19
for this
bit length and block length combination.

Low Complexity Viterbi Decoder by Using Trellis Structure 41
www.tjprc.org [email protected]
Figure 3 (a): BER vs.SNR Semilog Plot at Bit Length = 100 & Block Length=10
Case 1.2.B=100,N=100: In this figure 3(b) we can observed that as the SNR increase simulated BER is at everey
SNR is lower than theortical BER and it is zero for SNR>2dB
Figure 3 (b): BER vs.SNR Semilog Plot at Bit Length = 100 & Block Length=100
Table 2: Total No of Bits =103 for BPSK Modulation
SNR(dB) Block Length(N)
N=10 N=100 N=1000
1 0.214 .091 .054
2 0.113 .013 .011
3 0.00 .014 0.00
4 0.021 0.00 0.00
5 0.037 0.00 0.00
6 0.029 0.00 0.00
7 0.00 0.00 0.00
8 0.00 0.00 0.00
9 0.00 0.00 0.00
10 0.00 0.00 0.00
11 0.00 0.00 0.00
12 0.00 0.00 0.00

42 Vineeta Kumari, N R Kidwai & M Alam
Impact Factor (JCC): 5.2896 NAAS Rating: 2.23
Case 2.1.B=1000,N=10: In this figure 4 we can observed that as the SNR increase theoretical BER is decrease
(black line) but our simulated BER is slightly higher at SNR 5dB and 6dB it is a approximately 0.037 and 0.029 after 6dB
BER has reached to zero value in this way our simulated BER is the lower then the theoretical BER varying from 0.214 to
5.4*10-19
for this bit length and block length combination.
Figure 4 (a): BER vs.SNR Semilog Plot at Bit Length = 1000 & Block Length=10
Case 2.2.B=1000,N=100: In this case we can see that in table 2 BER in pre measuring reduce to zero at SNR>3in
all the Cases the simulated BER is to be less than theoretical BER hence as the block length is increased the BER is
significantly reduce it is varing from 0.091 to 5.4*10-19
as show in figure 4 b.
Figure 4 (b): BER vs.SNR Semilog Plot at Bit Length = 1000 & Block Length=100
Case 2.3. B=1000,N=1000: In this case we can see that in table 3 BER is pre measuring reduce to zero at
SNR>2in all the Cases the simulated BER from to be less than theoretical BER hence as the block length is increased the
BER is significantly reduce it is varing from 0.051 to 5.4*10-19
as show in figure 4 c.

Low Complexity Viterbi Decoder by Using Trellis Structure 43
www.tjprc.org [email protected]
Figure 4 c: BER vs.SNR Semilog Plot at Bit Length = 1000 & Block Length=1000
Table 3: Total no of Bits =104 for BPSK Modulation
SNR(dB) Block Length(N)
N=10 N=100 N=1000
1 0.195 0.060 0.044
2 0.144 0.036 0.023
3 0.099 0.012 0.004
4 0.063 0.002 0.0017
5 0.036 0.001 0.0001
6 0.016 0.0008 0.00
7 0.007 0.0005 0.00
8 0.002 0.0002 0.00
9 0.001 0.0001 0.00
10 0.0009 0.0002 0.00
11 0.0002 0.00 0.00
12 0.0001 0.00 0.00
Case 3.1.B=10000,N=10: In this figure 5 we can observed that as the SNR increase theoretical BER is decrease
(black line) but our simulated BER is higher at SNR >2dB simulated BER is the lower then the theoretical BER varying
from 0.195 to 5.4*10-19
for this bit length and block length combination.
Figure 5 (a): BER vs.SNR Semilog Plot at Bit Length = 10000 & Block Length=10
Case 3.2.B=10000,N=100: In this figure 5 we can observed that simulated BER is slightly higher than SNR 4dB
to 8dB and after 8dB BER has reached to zero value in this way our simulated BER is the lower then the theoretical BER
varying from 0.060 to 5.4*10-19
for this bit length and block length combination.
44 Vineeta Kumari, N R Kidwai & M Alam
Impact Factor (JCC): 5.2896 NAAS Rating: 2.23
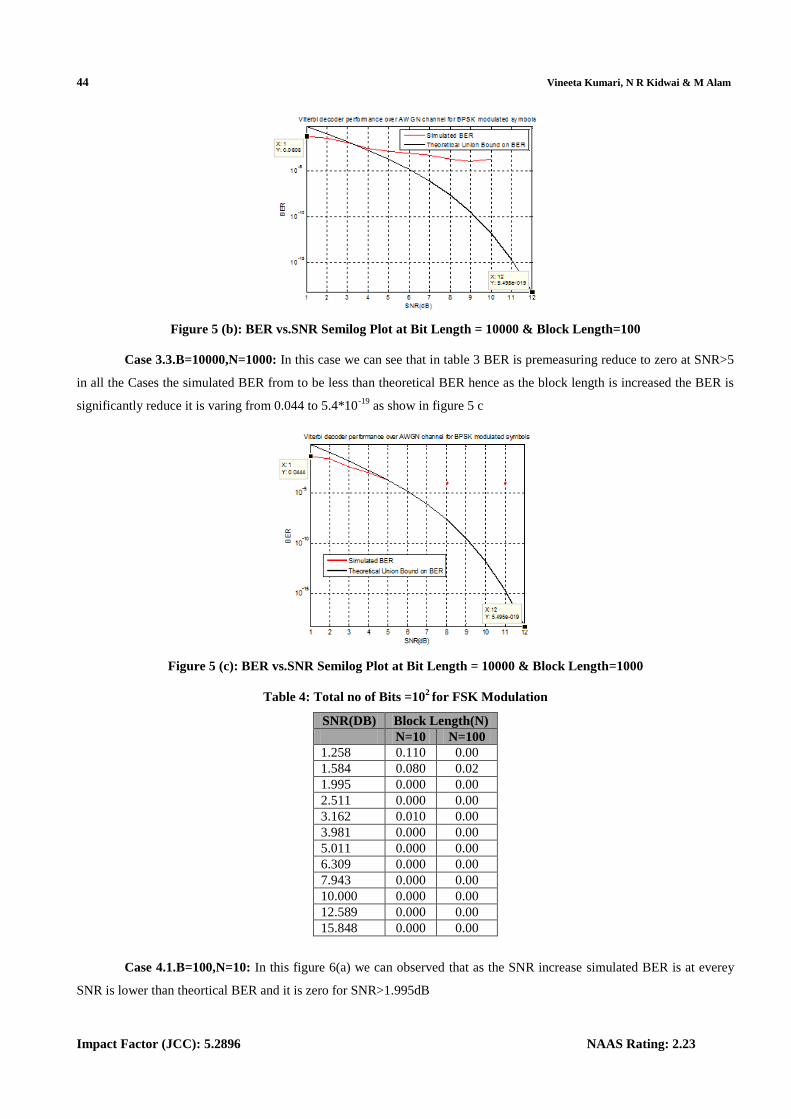
Figure 5 (b): BER vs.SNR Semilog Plot at Bit Length = 10000 & Block Length=100
Case 3.3.B=10000,N=1000: In this case we can see that in table 3 BER is premeasuring reduce to zero at SNR>5
in all the Cases the simulated BER from to be less than theoretical BER hence as the block length is increased the BER is
significantly reduce it is varing from 0.044 to 5.4*10-19
as show in figure 5 c
Figure 5 (c): BER vs.SNR Semilog Plot at Bit Length = 10000 & Block Length=1000
Table 4: Total no of Bits =102 for FSK Modulation
SNR(DB) Block Length(N)
N=10 N=100
1.258 0.110 0.00
1.584 0.080 0.02
1.995 0.000 0.00
2.511 0.000 0.00
3.162 0.010 0.00
3.981 0.000 0.00
5.011 0.000 0.00
6.309 0.000 0.00
7.943 0.000 0.00
10.000 0.000 0.00
12.589 0.000 0.00
15.848 0.000 0.00
Case 4.1.B=100,N=10: In this figure 6(a) we can observed that as the SNR increase simulated BER is at everey
SNR is lower than theortical BER and it is zero for SNR>1.995dB

Low Complexity Viterbi Decoder by Using Trellis Structure 45
www.tjprc.org [email protected]
Figure 6(a): BER vs.SNR Semilog Plot at Bit Length = 100 & Block Length=10 in FSK
Case 4.2.B=100,N=100: In this figure 6(b) we can observed that as the SNR increase simulated BER is as point at
SNR=1.584dB
Figure 6 (b): BER vs.SNR Semilog Plot at Bit Length = 100 & Block Length=100 in FSK
Table5: Total no of Bits =103 for FSK Modulation
SNR(dB) Block Length(N)
N=10 N=100 N=1000
1.258 0.072 .134 0.004
1.584 .051 .057 0.004
1.995 .025 .035 0.00
2.511 .019 .011 0.003
3.162 01 .017 0.00
3.981 .003 .004 0.00
5.011 .004 .004 0.00
6.309 .001 .001 0.00
7.943 .00 0.00 0.00
10.000 .00 0.00 0.00
12.589 .00 0.00 0.00
15.848 .00 0.00 0.00
Case 5.1.B=1000,N=10: In this figure 7(a) we can observed that as the SNR increase theoretical BER is decrease
(black line) but our simulated BER is slightly higher at SNR 1.99dB

46 Vineeta Kumari, N R Kidwai & M Alam
Impact Factor (JCC): 5.2896 NAAS Rating: 2.23
Figure 7(a): BER vs.SNR Semilog Plot at Bit Length = 1000 & Block Length=10 in FSK
Case 5.2.B=1000,N=100: In this figure 7 b we can observed that as the SNR increase theoretical BER is decrease
(black line) but our simulated BER is slightly higher at SNR 1.584dB
Figure 7(b): BER vs.SNR Semilog Plot at Bit Length = 1000 & Block Length=100 in FSK
Case 5.3.B=100,N=1000: In this figure 7(c) we can observed that as the SNR increase simulated BER is at everey
SNR is lower than theortical BER and it is zero for SNR>1.995dB.
Figure 7(c): BER vs.SNR Semilog Plot at Bit Length = 1000 & Block Length=1000 in FSK
Low Complexity Viterbi Decoder by Using Trellis Structure 47
www.tjprc.org [email protected]
Table 6: Total no of Bits =104 for FSK Modulation
SNR(dB) Block Length(N)
N=10 N=100 N=1000
1.258 0.096 .314 0.307
1.584 .051 .264
0.262
1.995 .034 .159 0.207
2.511 .014 .116 0.160
3.162 .007 .074 0.105
3.981 .003 .045 0.071
5.011 .0009 .026 0.037
6.309 .0002 .013 0.016
7.943 .0001 0.004 0.012
10.000 .00 0.002 0.004
12.589 .00 0.001 0.001
15.848 .00 0.00 0.0004
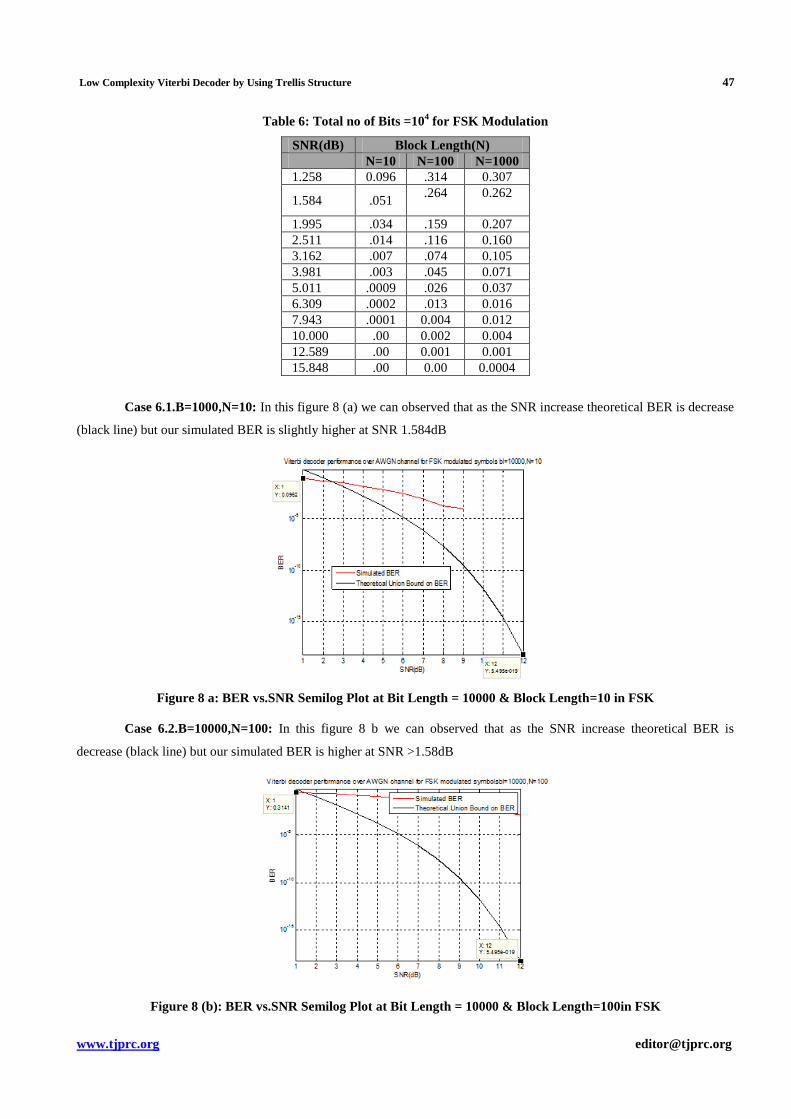
Case 6.1.B=1000,N=10: In this figure 8 (a) we can observed that as the SNR increase theoretical BER is decrease
(black line) but our simulated BER is slightly higher at SNR 1.584dB
Figure 8 a: BER vs.SNR Semilog Plot at Bit Length = 10000 & Block Length=10 in FSK
Case 6.2.B=10000,N=100: In this figure 8 b we can observed that as the SNR increase theoretical BER is
decrease (black line) but our simulated BER is higher at SNR >1.58dB
Figure 8 (b): BER vs.SNR Semilog Plot at Bit Length = 10000 & Block Length=100in FSK

48 Vineeta Kumari, N R Kidwai & M Alam
Impact Factor (JCC): 5.2896 NAAS Rating: 2.23
Case 6.3.B=10000,N=1000: In this figure 8 b we can observed that as the SNR increase theoretical BER is
decrease (black line) but our simulated BER is higher at SNR >1.58dB.
Figure 8(c): BER vs.SNR Semilog Plot at Bit Length = 10000 & Block Length=1000 in FSK
CONCLUSIONS
In this work we have investigated the performance of the error correcting convolutional code data reduced to
decrease the complexity of the receiver by using a modified viterbi decoder that can give better response in the presence of
AWGN channel distortion.
The decoder complexity is reduced by eliminating the reduced of demodulator and assuming the name of state as
similar to BPSK symbols. In addition to this the math metical equation for determine distance between receive symbol is
based on norm of the error in the receive and actual states in this way the size and circuit component required are reduced
twice.
We have justified our algorithm design by generating the bit error rate value at different SNR AWGN channel for this
purpose we have changed data bit length and block length with different combination and plot the BER verses SNR curve
for visualizing the performance of the our improved decode algorithm. It have concluded that at bit length=100 BER
reduces frequently as the increase the block length N=10 to N=100. It can be found that at bit length 100 when N=10 BER
reaches zero at SNR 6dB but at N=100 it reaches zero at SNR 2dB.
On further increase the bit length 1000 we have found that at N=10 BER reduced to zero at SNR>6dB N=100
BER zero at SNR>3dB. and N=100 BER=0 at SNR>2dB. It has been also observed that for bit length=1000 and N=10
simulated BER is always higher than the theoretical BER for SNR 2 to 8 dB.
Similarly at bit length 104 BER=0 at SNR>12dB,for N=100 BER=0 at SNR>10dB and for N=1000 BER=0 at
SNR>5dB. And again it has observed that at bit length 10000our simulated BER is greater than theoretical BER N=10 and
N=100 in this way it can be surmised that as the bit length increases BER and decrease with a slower rate and best bit
length 1000 to10000. For the block length N=10 & N=100 BER performance are not suitable hence block length shoude be
near above 1000 get the best BER performance.

Low Complexity Viterbi Decoder by Using Trellis Structure 49
www.tjprc.org [email protected]
REFERENCES
1. P. Kabal and S. Pasupathy, “Partial-response signaling,” IEEE Trans. Commun, vol. 23, pp. 921–934, Sept. 1975.
2. A. Lender, “The duobinary technique for high-speed data transmission,” IEEE Trans. Commun, Electron, vol. 82,
pp. 214–218, May 1963.
3. E. R. Kretzmer, “Generalization of a technique for binary data communication,” IEEE Trans. Commun. Technol,
vol. 14, pp. 67–68, Feb. 1966.
4. M. J. Ferguson, “Optimal reception for binary partial response channels,” Bell Syst. Tech. J, vol. 51, no. 2, pp.
493–505, Feb. 1972.
5. H. Kobayashi and D. T. Tang, “Application of partial-response channel coding to agnetic recording systems,”
IBM J. Res. Develop, vol. 14, pp. 368–375, July 1970.
6. [6] H. Kobayashi, “Correlative level coding and maximum-likelihood decoding,” IEEE Trans. Inform. Theory,
vol. IT-17, pp. 586–594, Sept. 1971.
7. G. D. Forney, Jr, “Maximum-likelihood sequence estimation of digital sequences in the presence of intersymbol
interference,” IEEE Trans. Inform. Theory, vol. IT-18, pp. 363–378, May 1972.
8. A. J. Viterbi, “Error bounds for convolutional codes and an asymptotically optimum decoding algorithm,” IEEE
Trans. Inform. Theory, vol. IT-13, pp. 260–269, Apr. 1967.
9. G. D. Forney, Jr, “The Viterbi algorithm,” Proc. IEEE, vol. 61, pp. 268–278, Mar. 1973.
