5. data report: normalization factors for semiquantitative x-ray
TRANSCRIPT
Mikada, H., Moore, G.F., Taira, A., Becker, K., Moore, J.C., and Klaus, A. (Eds.)Proceedings of the Ocean Drilling Program, Scientific Results Volume 190/196
5. DATA REPORT: NORMALIZATION FACTORS FOR SEMIQUANTITATIVE
X-RAY DIFFRACTION ANALYSIS, WITH APPLICATION TO DSDP SITE 297, SHIKOKU BASIN1
Michael B. Underwood,2 Nandini Basu,2 Joan Steurer,2 and Swati Udas2
ABSTRACT
This data report documents the acquisition of two new sets of nor-malization factors for semiquantitative X-ray diffraction analyses. Oneset of factors is for bulk sediment powders, and the other applies to ori-ented aggregates of clay-sized fractions (<2 µm). We analyzed mixturesof standard minerals with known weight percentages of each compo-nent and solved for the normalization factors using matrix singularvalue decomposition. The components in bulk powders include totalclay minerals (a mixture of smectite, illite, and chlorite), quartz, plagio-clase, and calcite. For clay-sized fractions, the minerals are smectite, il-lite, chlorite, and quartz. We tested the utility of the method byanalyzing natural mudstone specimens from Site 297 of the Deep SeaDrilling Project, which is located in the Shikoku Basin south of Site1177 of the Ocean Drilling Program (Ashizuri transect).
INTRODUCTION
Analysis of sediment samples by X-ray diffraction (XRD) has been aroutine part of shipboard and shore-based measurements by the OceanDrilling Program (ODP) and the Deep Sea Drilling Project (DSDP). Thepresence of specific detrital and/or authigenic minerals can be detected
1Underwood, M.B., Basu, N., Steurer, J., and Udas, S., 2003. Data report: Normalization factors for semiquantitative X-ray diffraction analysis, with application to DSDP Site 297, Shikoku Basin. In Mikada, H., Moore, G.F., Taira, A., Becker, K., Moore, J.C., and Klaus, A. (Eds.), Proc. ODP, Sci. Results, 190/196, 1–28 [Online]. Available from World Wide Web: <http://www-odp.tamu.edu/publications/190196SR/VOLUME/CHAPTERS/203.PDF>. [Cited YYYY-MM-DD]2Department of Geological Sciences, University of Missouri, Columbia MO 65211, USA. Correspondence author: [email protected]
Initial receipt: 4 November 2002Acceptance: 6 June 2003Web publication: 22 August 2003Ms 190SR-203
M. UNDERWOOD ET AL.DATA REPORT: XRD NORMALIZATION FACTORS 2
easily through visual recognition of characteristic peak positions. It ismore difficult, however, to estimate the relative abundance of a mineralwith meaningful accuracy (Moore, 1968; Cook et al., 1975; Heath andPisias, 1979; Johnson et al., 1985; Mascle et al., 1988). Fisher and Un-derwood (1995) developed a method during ODP Leg 156 to calculateabundances of common minerals in bulk powders using matrix singularvalue decomposition (SVD). They derived normalization factors basedon the peak areas of diagnostic XRD reflections, as produced by stan-dard mineral mixtures with known weight percentages of each compo-nent. In essence, this method accounts for changes in any givenmineral’s peak dimensions as a function of its own absolute abundance,as well as the abundance of every other mineral in the mixture.
When the method of Fisher and Underwood (1995) is applied to nat-ural samples of marine sediment, the accuracy of absolute weight per-cent values deteriorates as additional minerals and amorphous solids(e.g., volcanic glass and biogenic silica) increase in number andamount. Consequently, the mineral percentages calculated by SVD arerelative only with respect to the other minerals in the standard mix-tures (e.g., weight percent quartz relative to total clay, plagioclase, andcalcite). In the case of diatomaceous ooze or vitric mud, this limitationcould lead to substantial errors in estimates of absolute mineral abun-dance relative to all solid phases. Another limitation of the SVD ap-proach is the need to establish sets of normalization factors that matcheach indigenous mineral mixture within each study area. In otherwords, factors for a kaolinite-rich mineral suite from Barbados or CostaRica will not work for an illite-chlorite assemblage in Nankai Trough orCascadia. Thus, some advanced knowledge of the natural sediment’scomposition is a prerequisite to mixing appropriate mineral standards.A third significant limitation is imposed by design differences in X-raydiffractometers (e.g., a fixed-step vs. continuous-scan mode, or auto-matic vs. fixed slits). Separate normalization factors are needed for eachtype of instrument. This requirement is especially important if there is adesire to integrate shipboard and shore-based data sets generated by dif-ferent instruments. A final consideration is the individual instrumentperformance (e.g., life span of X-ray tube and detector). If peak intensi-ties change significantly with tube life, recalibration may be warranted.
Similar questions of accuracy arise during the semiquantitative calcu-lations of clay mineral percentages. The most common approach in ma-rine geology is to apply the Biscaye (1965) peak area weighting factorsduring calculations of the relative proportions of smectite, illite, andchlorite. The errors in such data can be substantial, however, and theychange with the absolute abundance by weight of each mineral (Under-wood et al., 1993). Results can also shift because of interlaboratory dif-ferences in sample disaggregation and chemical treatments, particle sizeseparation, and the degree of preferred orientation of clay mounts(Moore and Reynolds, 1989; McManus, 1991). Even though the repro-ducibility of such data might be good, the typical estimates of accuracyare no better than ±10%.
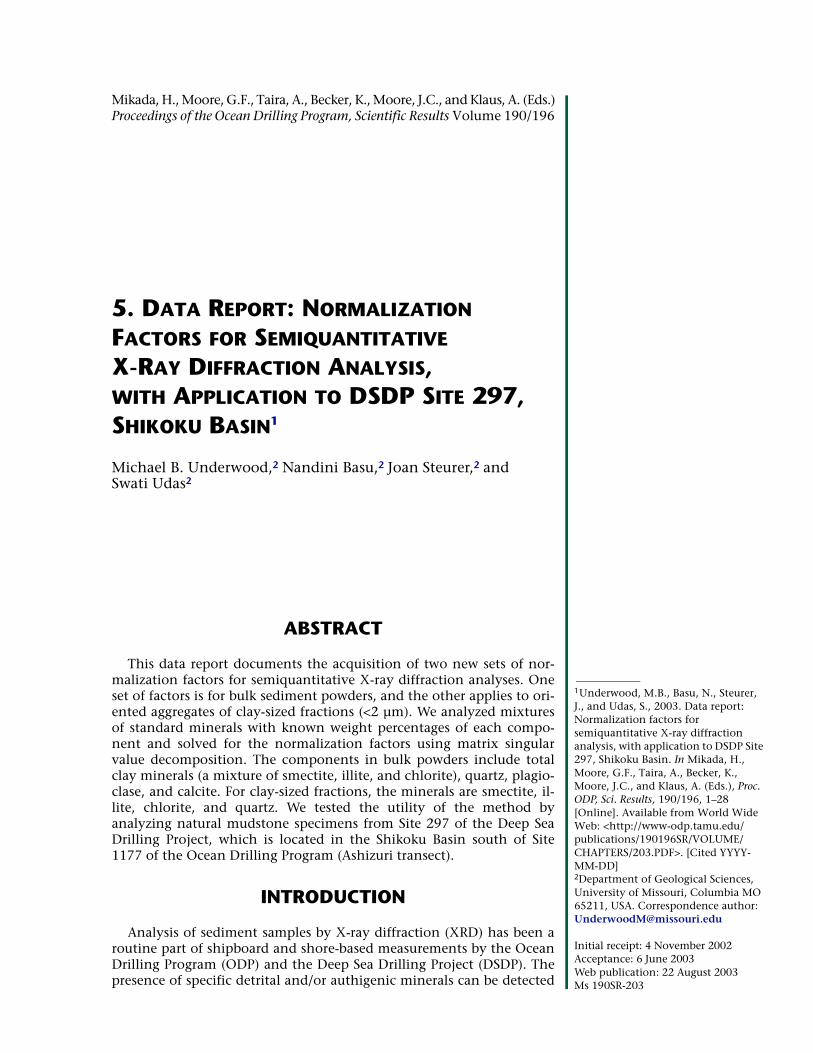
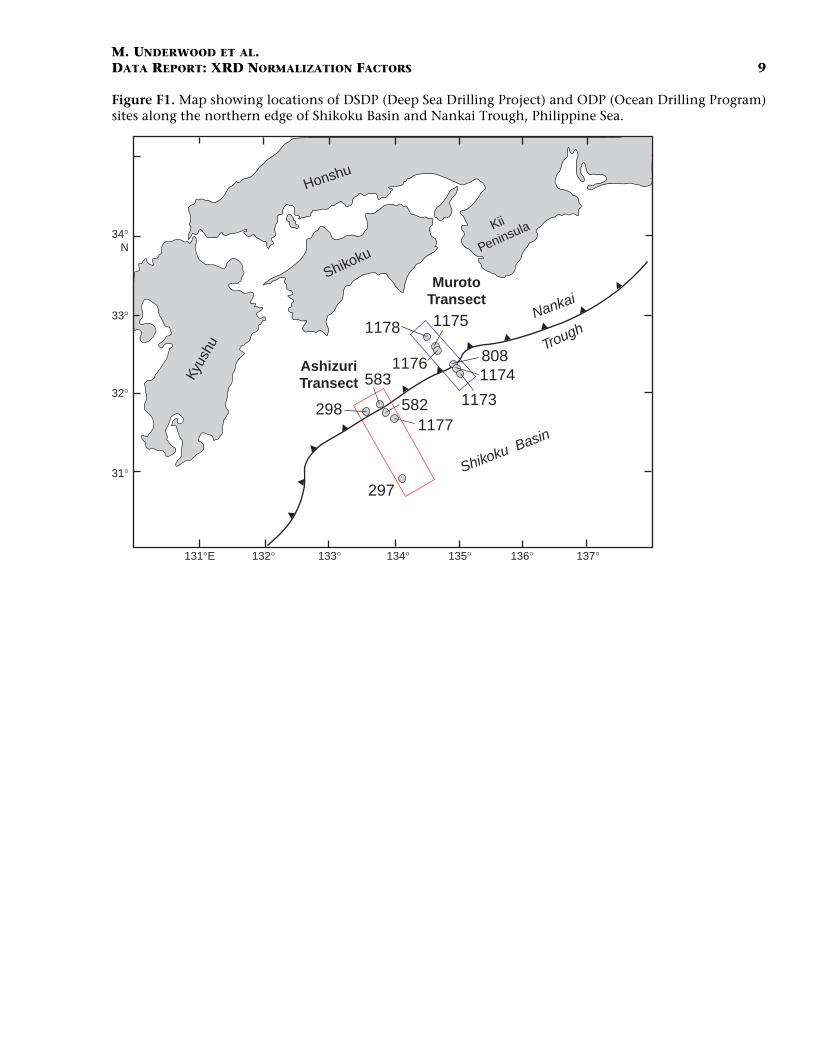
The purpose of this data report is to document the acquisition of newnormalization factors for analyses of bulk powder and clay-sized mix-tures in sediments from the Nankai Trough and Shikoku Basin (Fig. F1).Recalibration of the methodology was required for several reasons: (1)to allow accurate comparisons among bulk powder data generated byshipboard (Philips) and shore-based (Scintag) XRD systems; (2) to im-prove mergers of data from DSDP Site 297 and ODP Leg 190; (3) to im-prove the accuracy of calculated relative mineral percentages within the
F1. Location map, p. 9.
Shikoku
Kyus
hu
Honshu
297
298 582
583
808
1177
1174
1173
1178 1175
1176
MurotoTransect
AshizuriTransect
Shikoku Basin
Nankai
Trough
Kii
Peninsula
31°
32°
33°
34°N
131°E 132° 133° 134° 135° 136° 137°
M. UNDERWOOD ET AL.DATA REPORT: XRD NORMALIZATION FACTORS 3
clay-sized fraction (<2 µm); and (4) to improve the accuracy of calcu-lated percentages of specific clay minerals (e.g., weight percent smec-tite) within the bulk sediment. We also include the results of bulkpowder and clay-fraction analyses of samples from DSDP Site 297 to il-lustrate fully the utility of the method. The data from Site 297 are im-portant for characterizing the composition of subduction inputs withinthe Ashizuri transect of Nankai Trough (Fig. F1), and they have beenused to document how frictional properties change as a function of to-tal clay content and clay mineralogy (Brown et al., in press).
METHODS/MATERIALS
Standard Mineral Mixtures
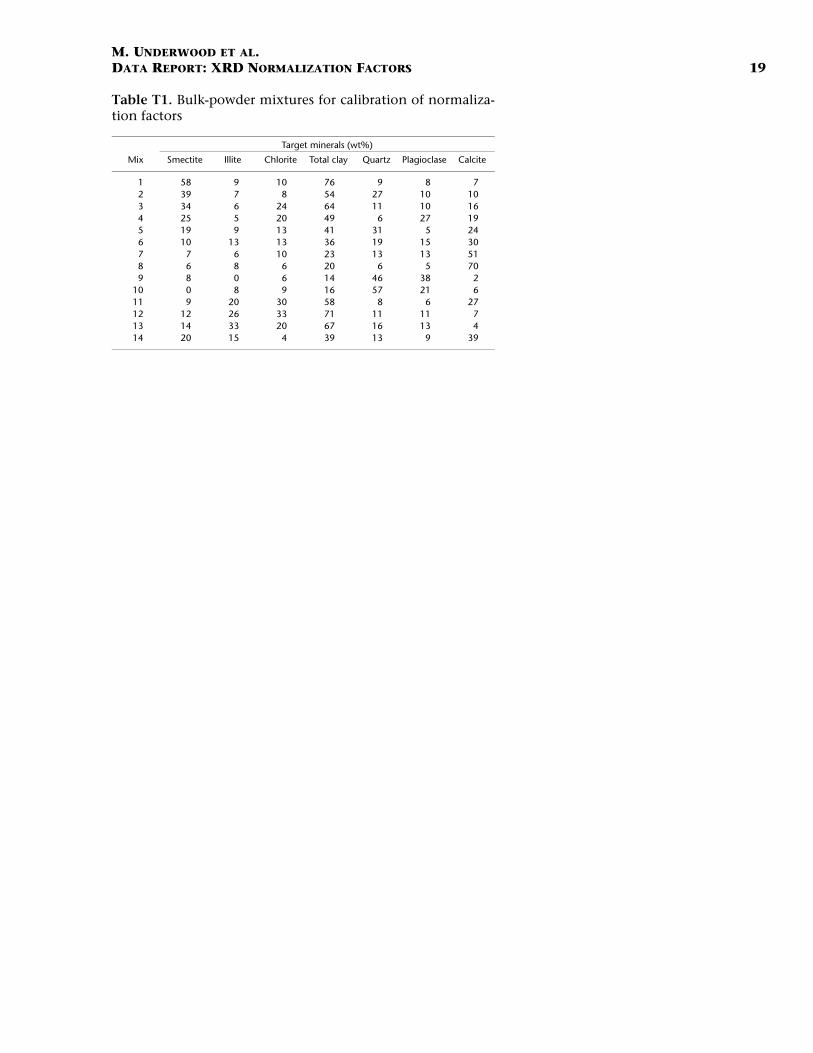
The mineral standards used for the new bulk powder mixtures aresimilar to those used during ODP Leg 190: quartz (St. Peter sandstone),feldspar (Ca-rich albite), calcite (Cyprus chalk), illite (2M1 polytype),and chlorite. We discovered that the specimen of Wyoming montmoril-lonite (Swy-2) used during Leg 190 contains an unacceptable amount ofcontamination (mostly by quartz); it was replaced by a relatively puresmectite (Ca-montmorillonite). We also decided to omit kaolinite (ClayMineral Society Kga-1) from the mixtures because its abundance inNankai sediments at Site 808 is only 8%–20% of the kaolinite + chloriteclay-sized fraction (Orr, 1992), which amounts to <3% of the typicalbulk sediment. Table T1 shows the percentages by dry weight of eachmineral in the 14 mixtures that we analyzed.
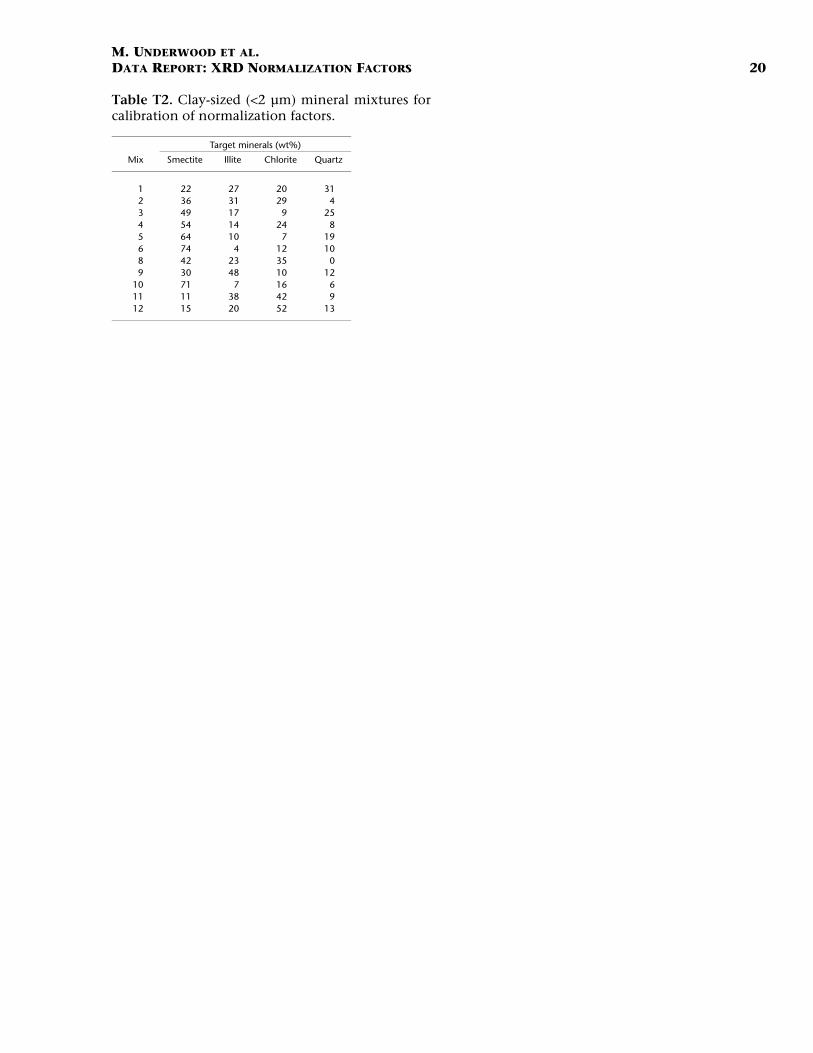
The standards used for the clay-sized mixtures are smectite (Ca-montmorillonite), illite (Clay Mineral Society Imt-2), chlorite (ClayMineral Society Cca-2), and quartz (St. Peter sandstone). We includedquartz in the mix because of the desire to quantify the nonclay compo-nent of the clay-sized fraction in natural specimens and for correctingpeak positions relative to quartz (100). Each standard was powderedthoroughly using a Spex Certiprep 5100 mixer mill, suspended in ~500mL of distilled water with sodium hexametaphosphate dispersant, anddisaggregated using an ultrasonic cell disrupter. Particles <2 µm equiva-lent settling diameter were separated by centrifugation (1000 rpm for2.4 min; ~320× g). The purity of each clay-sized separate was confirmedby XRD. The average concentration of each suspension was determinedby extracting and drying three aliquots at 75°C to obtain dry weight ofclay per unit volume of suspension, corrected for weight of dispersant.The weights for smectite probably reflect a hydration state containingtwo layers of interlayer water. Volumetric proportions of the four com-ponents were measured by pipette, then converted to dry weights andweight percentages. Table T2 shows the percentages by dry weight ofeach mineral in the mixtures that we analyzed. Mixture 7 is nearly puresmectite and was not included in the calculation of normalization fac-tors.
Sample Preparation
Bulk samples of natural sediment were freeze-dried, hand crushed bymortar and pestle, and powdered for 5 min using a Spex Certiprep 5100mixer mill. The standard mineral mixtures were also run through themixer mill for 5 min to improve their homogenization. The bulk pow-ders were then packed gently into XRD sample holders to retain ran-
T1. Bulk-powder mixtures, p. 19.
T2. Clay-sized mineral mixtures, p. 20.
M. UNDERWOOD ET AL.DATA REPORT: XRD NORMALIZATION FACTORS 4
dom orientation. The mixtures of standard minerals were analyzedthree times each and remixed between each run using the ball mill.
Isolation of clay-sized fractions started with drying and gentle crush-ing of the mud/mudstone, after which specimens were immersed in 3%H2O2 for at least 24 hr to digest organic matter. We then added ~250 mLof sodium hexametaphosphate solution (concentration = 4 g/1000 mL)and inserted beakers into an ultrasonic bath for several minutes to pro-mote disaggregation and deflocculation. This step (and additional soak-ing) was repeated for highly indurated samples until visual inspectionindicated complete disaggregation. Washing consisted of two passesthrough a centrifuge (8200 rpm for 25 min; ~6000× g), with resuspen-sion in distilled water after each pass. After transferring the suspendedsediment to a 60-mL plastic bottle, each sample was resuspended byvigorous shaking and a 2-min application of a sonic cell probe. Theclay-sized fractions (<2 µm equivalent settling diameter) then were sep-arated by centrifugation (1000 rpm for 2.4 min; ~320× g). Oriented ag-gregates of natural samples and standard clay mixtures were preparedusing the filter-peel method and 0.45-µm membranes (Moore and Rey-nolds, 1989). Three separate slides were prepared for each of the stan-dard clay mixtures. The clay aggregates were saturated with ethyleneglycol for at least 24 hr prior to XRD analysis, using a closed vaporchamber heated to 60°C in an oven.
X-Ray Diffraction Parameters
The XRD laboratory at the University of Missouri utilizes a ScintagPad V X-ray diffractometer with CuKα radiation (1.54 Å) and a Ni filter.Scans of bulk powders were run at 40 kV and 35 mA over a scanningrange of 3° to 35°2θ at a rate of 1°2θ/min and a step size of 0.01°2θ.Scans of oriented clay aggregates were run at 40 kV and 30 mA over ascanning range of 2° to 23°2θ, a rate of 1°2θ/min, and a step size of0.01°2θ. Slits were 0.5 mm (divergence) and 0.2 mm (receiving). Weprocessed the digital data using MacDiff software (version 4.2.5) to es-tablish a baseline of intensity, smooth counts, correct peak positions(relative to quartz), and calculate peak intensities and peak areas.
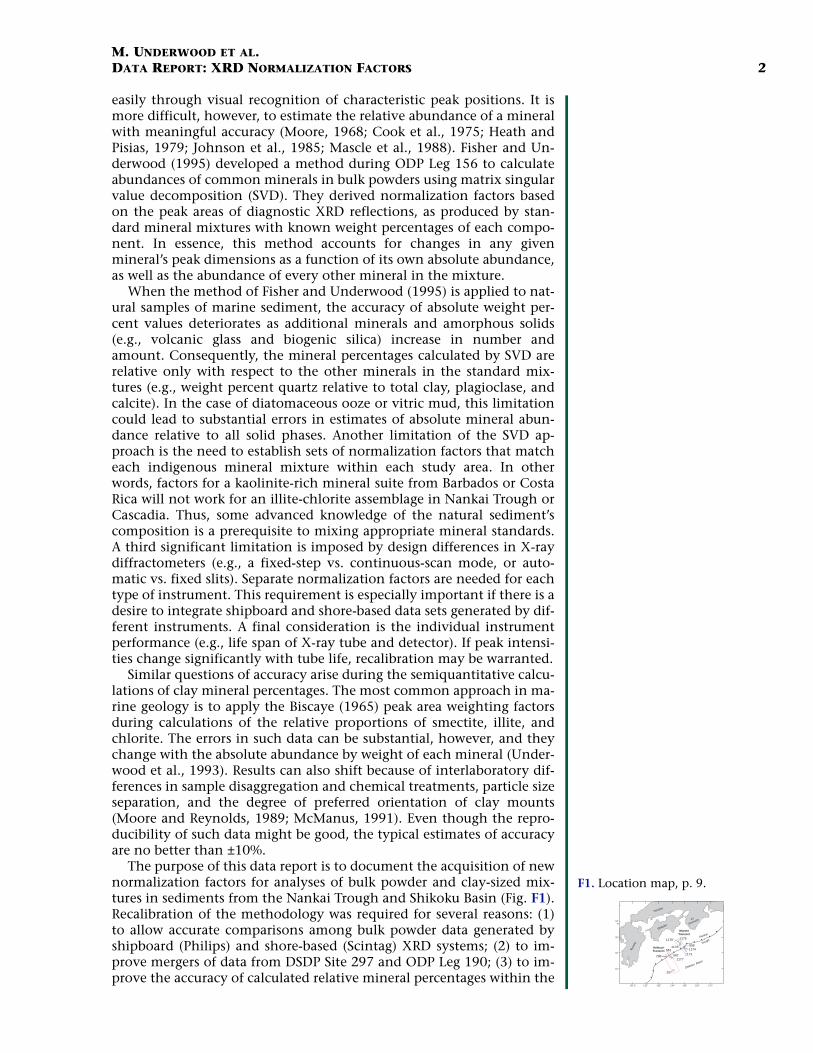
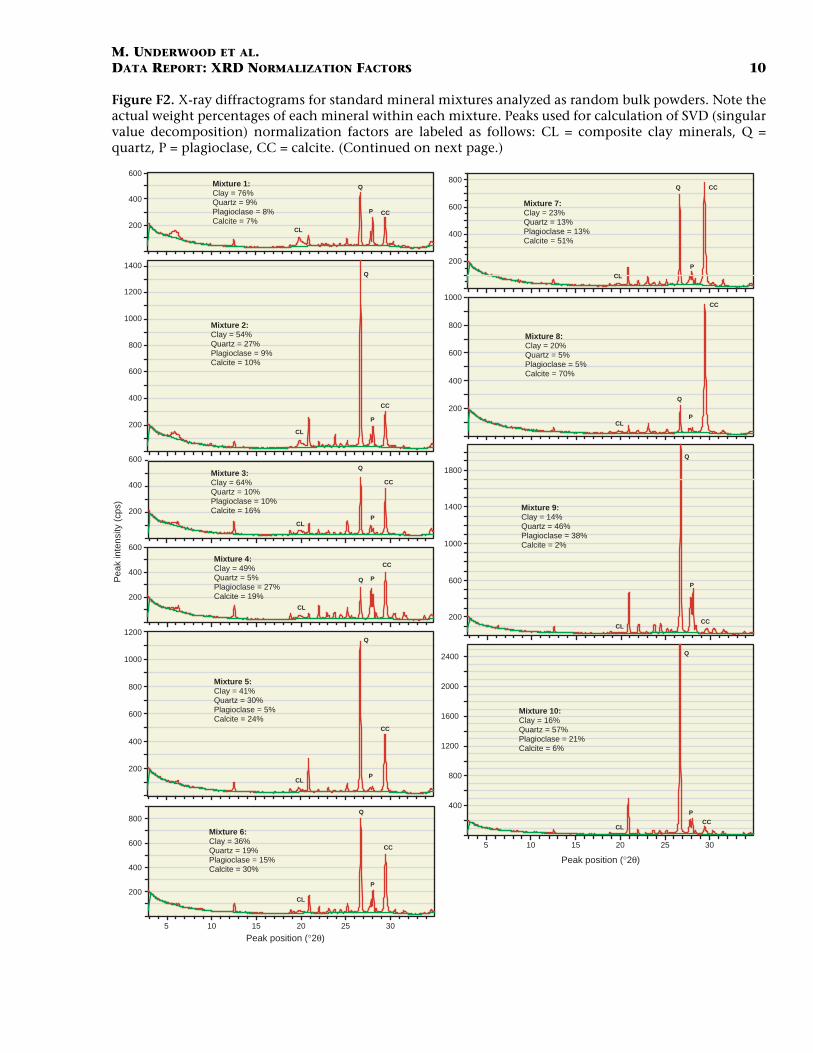
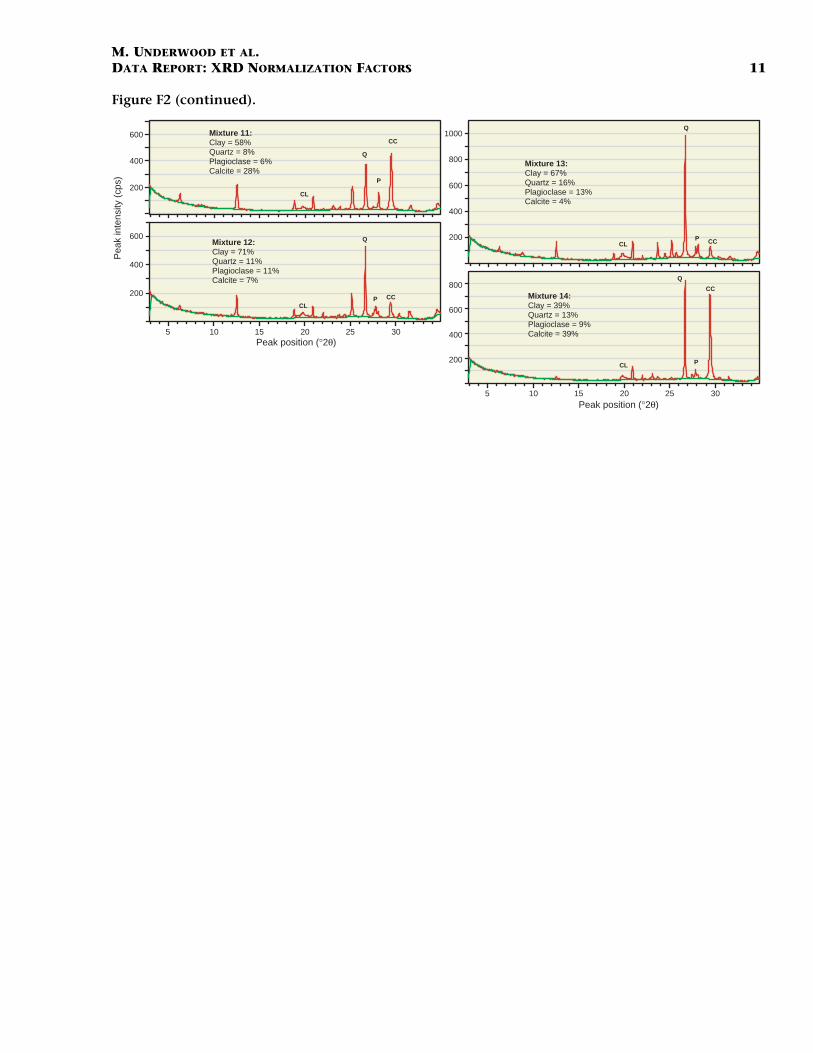
Figure F2 shows the resulting diffractograms for the bulk powdermineral mixtures. Normalization factors were established for the inte-grated areas of the following peaks: composite clay mineral at ~19.8°2θ(d-value = 4.49 Å); quartz (101) at 26.65°2θ (d-value = 3.34 Å); a charac-teristic double peak for plagioclase at 27.77°–28.02°2θ (d-value = 3.21–3.18 Å); and calcite (104) at 29.42°2θ (d-value = 3.04 Å). We did notrecord the dimensions of individual clay mineral peaks generated bybulk powders because of low intensities and interference between smec-tite (001) and chlorite (001) reflections.
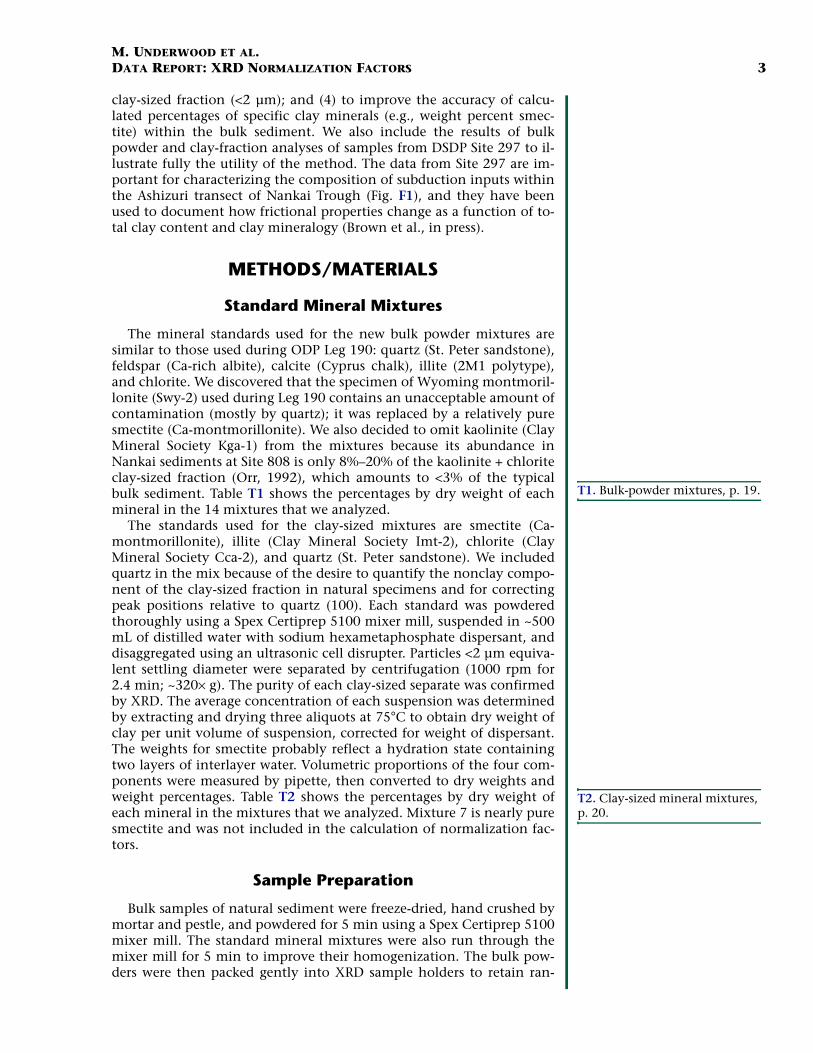
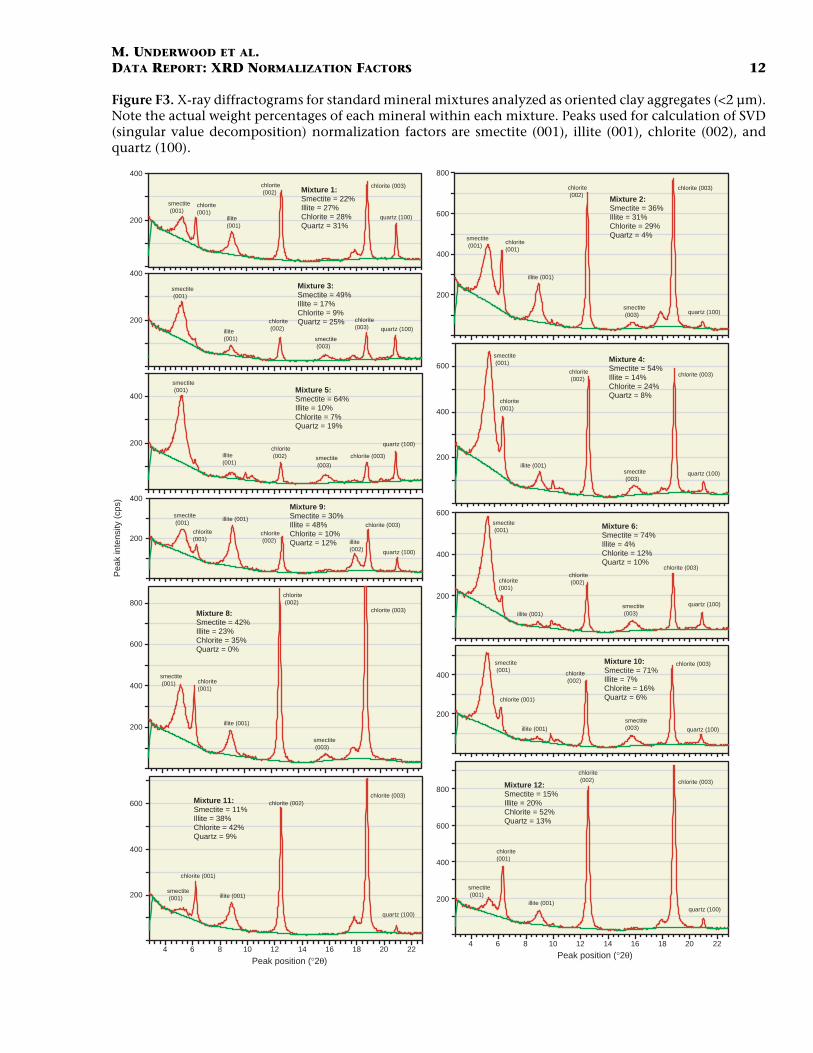
Figure F3 shows the resulting diffractograms for the clay-sized min-eral mixtures. The normalization factors for clay aggregates are basedon the integrated areas of a broad smectite (001) peak centered ataround 5.3°2θ (d-value = 16.5 Å), the illite (001) peak at 8.93°2θ (d-value = 9.9 Å), the chlorite (002) peak at 12.53°2θ (d-value = 7.06 Å),and the quartz (100) peak at 20.95°2θ (d-value = 4.24 Å).
F2. Standard mineral mixtures analyzed as random bulk pow-ders, p. 10.
CL
Mixture 2:Clay = 54%Quartz = 27%Plagioclase = 9%Calcite = 10%
CL
Q
P
CC
Mixture 3:Clay = 64%Quartz = 10%Plagioclase = 10%Calcite = 16%
Mixture 4:Clay = 49%Quartz = 5%Plagioclase = 27%Calcite = 19%
Mixture 5:Clay = 41%Quartz = 30%Plagioclase = 5%Calcite = 24%
Mixture 7:Clay = 23%Quartz = 13%Plagioclase = 13%Calcite = 51%
Q
P
CC
CL
Mixture 1:Clay = 76%Quartz = 9%Plagioclase = 8%Calcite = 7%
CL
Q
P CC
CL
Q
P
CC
Q P
CC
CL
Q
P
CC
5 10 15 20 25 30
Mixture 6:Clay = 36%Quartz = 19%Plagioclase = 15%Calcite = 30%
CL
Q
P
CC
Peak position (°2θ)
Mixture 8:Clay = 20%Quartz = 5%Plagioclase = 5%Calcite = 70%
CL
Q
P
CC
Mixture 9:Clay = 14%Quartz = 46%Plagioclase = 38%Calcite = 2%
CL
P
CC
Q
5 10 15 20 25 30
Mixture 10:Clay = 16%Quartz = 57%Plagioclase = 21%Calcite = 6%
CL
Q
P
CC
Peak position (°2θ)
200
400
600
800
200
400
600
800
1000
200
600
1000
1400
1800
400
800
1200
1600
2000
2400
200
400
600
200
400
600
800
1000
1200
1400
200
400
600
200
400
600
200
400
600
800
1000
1200
200
400
600
800
Pea
k in
tens
ity (
cps)
F3. Standard mineral mixtures analyzed as oriented clay aggre-gates, p. 12.
4 6 8 10 12 14 16 18 20 22
Mixture 11:Smectite = 11%Illite = 38%Chlorite = 42%Quartz = 9%
smectite (001)
chlorite (001)
illite (001)
chlorite (002)chlorite (003)
quartz (100)
Peak position (°2θ)
quartz (100)
chlorite (003)
smectite(003)
chlorite (002)
illite (001)
chlorite (001)
smectite (001)
Mixture 10:Smectite = 71%Illite = 7%Chlorite = 16%Quartz = 6%
Mixture 9:Smectite = 30%Illite = 48%Chlorite = 10%Quartz = 12%
smectite (001)
chlorite (001)
illite (001)
chlorite (002)
chlorite (003)
quartz (100)
illite (002)
smectite (001)
illite (001)
chlorite (002) smectite
(003)
chlorite (003)
quartz (100)
Mixture 5:Smectite = 64%Illite = 10%Chlorite = 7%Quartz = 19%
smectite (001)
illite (001)
chlorite (002)
chlorite (003) quartz (100)
quartz (100)
chlorite (003)chlorite (002)
illite (001)
smectite (001)
chlorite (001)
Mixture 1:Smectite = 22%Illite = 27%Chlorite = 28%Quartz = 31%
Mixture 3:Smectite = 49%Illite = 17%Chlorite = 9%Quartz = 25%
smectite (003)
quartz (100)
Mixture 12:Smectite = 15%Illite = 20%Chlorite = 52%Quartz = 13%
4 6 8 10 12 14 16 18 20 22
Peak position (°2θ)
chlorite (003)
chlorite (002)
illite (001)
chlorite (001)
smectite (001)
chlorite (003)
chlorite (002)
illite (001)
chlorite (001)
smectite (001)
smectite (003)
Mixture 8:Smectite = 42%Illite = 23%Chlorite = 35%Quartz = 0%
chlorite (003)
quartz (100)
chlorite (002)
illite (001)
chlorite (001)
smectite (001)
smectite (003)
Mixture 4:Smectite = 54%Illite = 14%Chlorite = 24%Quartz = 8%
Pea
k in
tens
ity (
cps)
Mixture 2:Smectite = 36%Illite = 31%Chlorite = 29%Quartz = 4%
quartz (100)
chlorite (003)chlorite (002)
illite (001)
chlorite (001)
smectite (001)
smectite (003)
quartz (100)
chlorite (003)chlorite (002)
illite (001)
chlorite (001)
smectite (001)
smectite (003)
Mixture 6:Smectite = 74%Illite = 4%Chlorite = 12% Quartz = 10%
200
400
200
400
200
400
200
400
600
200
400
200
400
600
800
200
400
200
400
600
800
200
400
600
200
400
600
800
200
400
600
M. UNDERWOOD ET AL.DATA REPORT: XRD NORMALIZATION FACTORS 5
RESULTS
Bulk Powder Standards
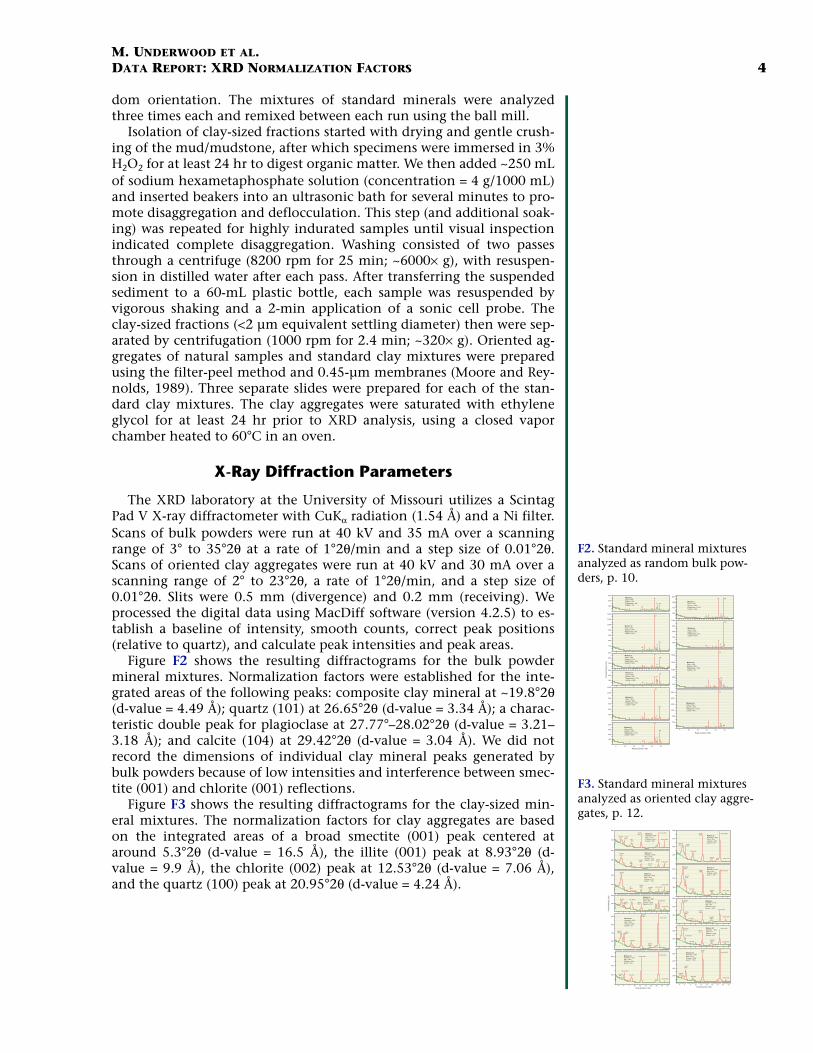
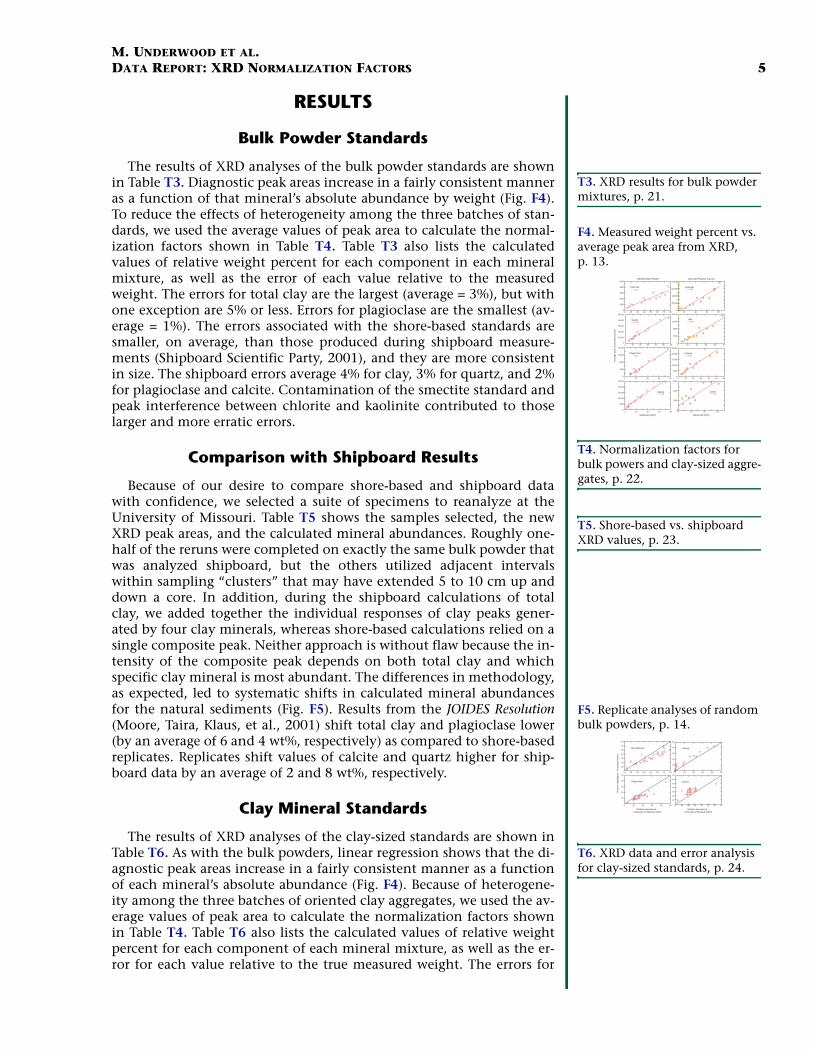
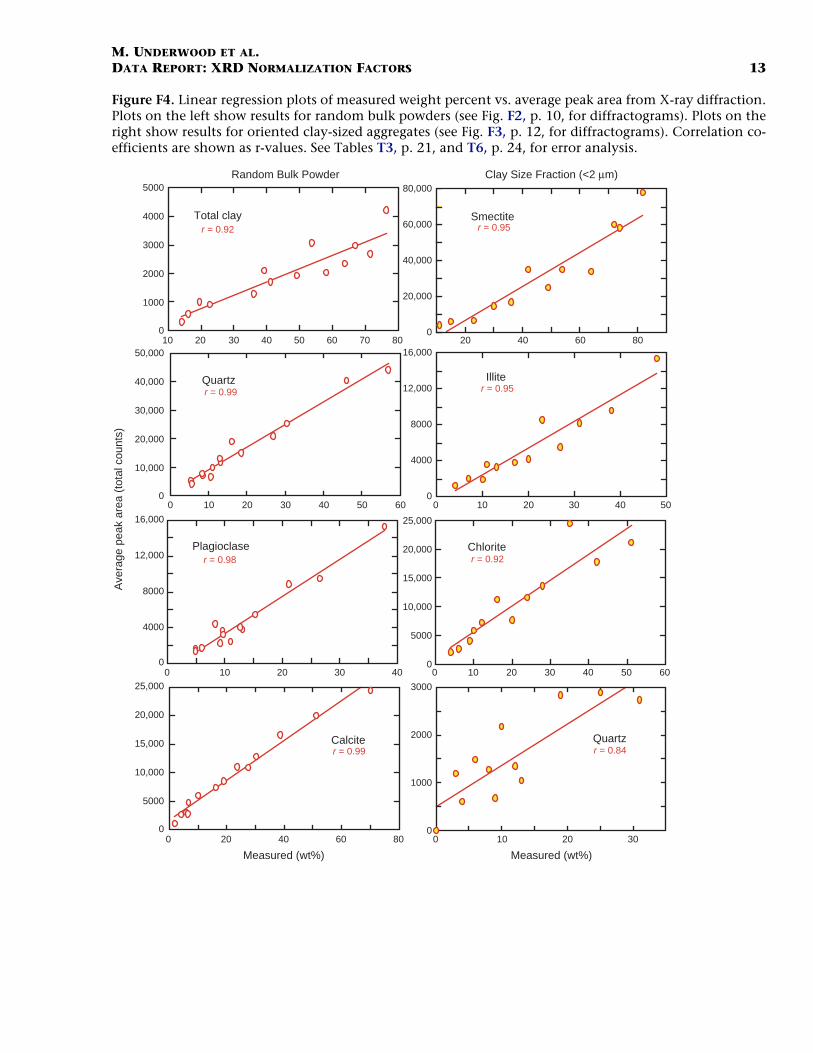
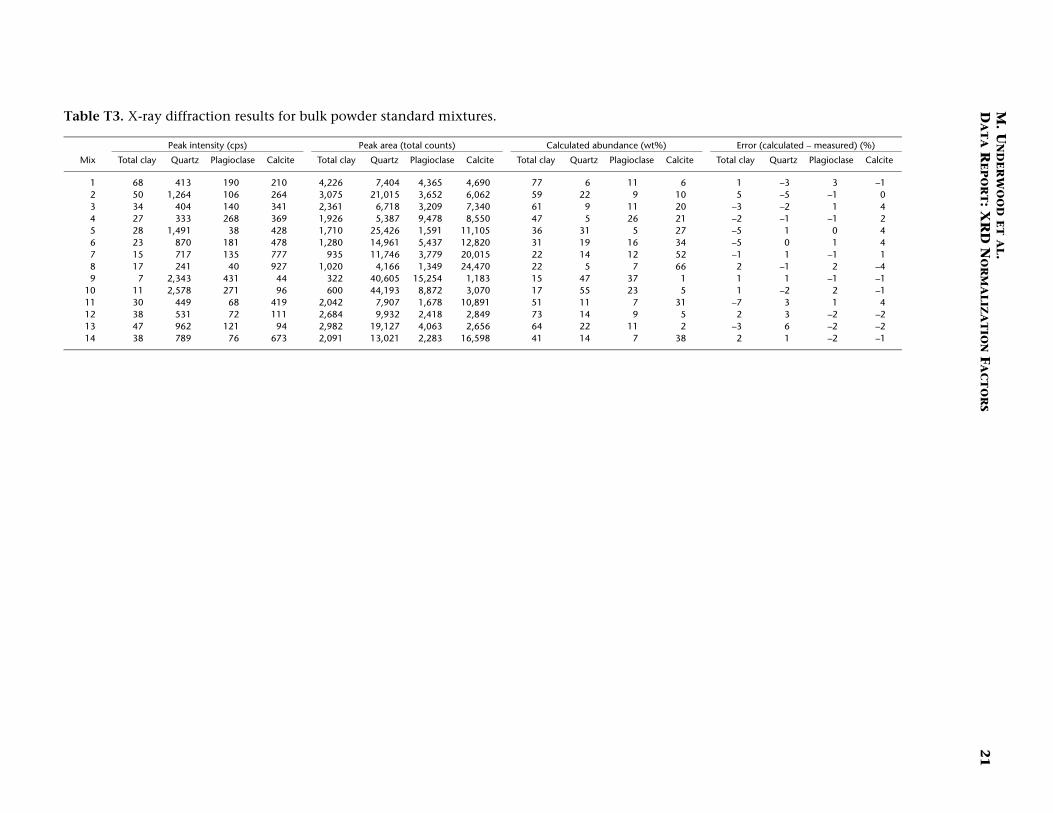
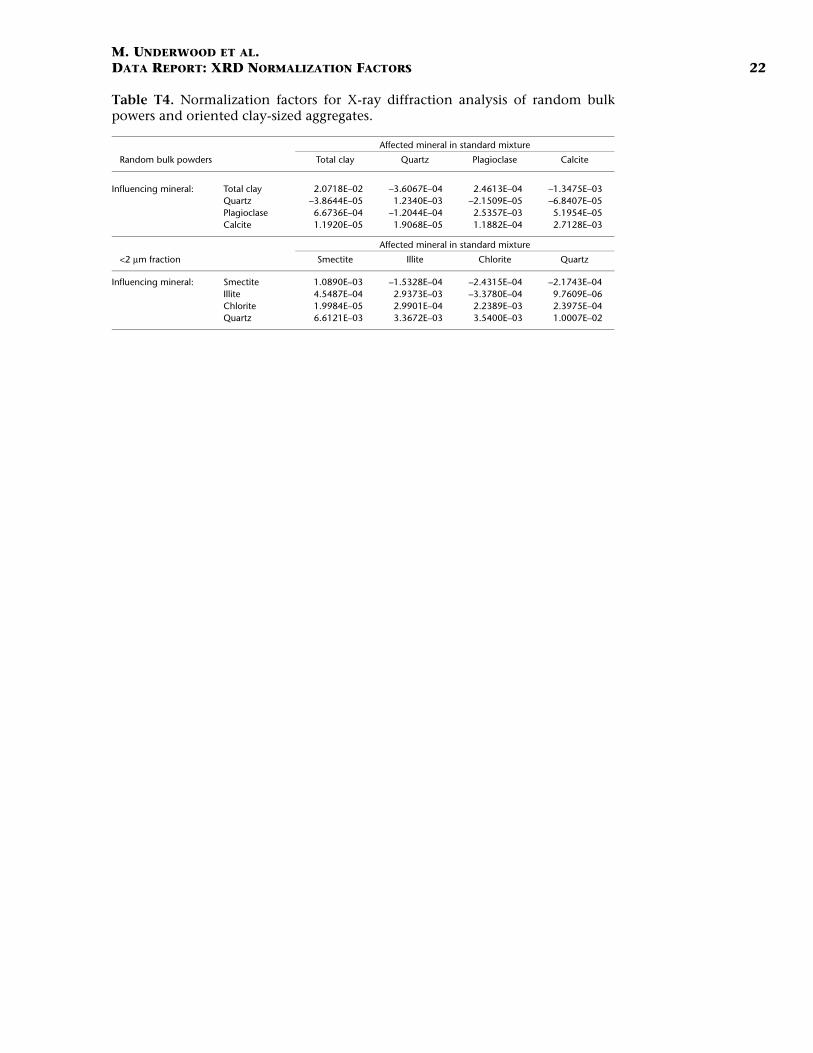
The results of XRD analyses of the bulk powder standards are shownin Table T3. Diagnostic peak areas increase in a fairly consistent manneras a function of that mineral’s absolute abundance by weight (Fig. F4).To reduce the effects of heterogeneity among the three batches of stan-dards, we used the average values of peak area to calculate the normal-ization factors shown in Table T4. Table T3 also lists the calculatedvalues of relative weight percent for each component in each mineralmixture, as well as the error of each value relative to the measuredweight. The errors for total clay are the largest (average = 3%), but withone exception are 5% or less. Errors for plagioclase are the smallest (av-erage = 1%). The errors associated with the shore-based standards aresmaller, on average, than those produced during shipboard measure-ments (Shipboard Scientific Party, 2001), and they are more consistentin size. The shipboard errors average 4% for clay, 3% for quartz, and 2%for plagioclase and calcite. Contamination of the smectite standard andpeak interference between chlorite and kaolinite contributed to thoselarger and more erratic errors.
Comparison with Shipboard Results
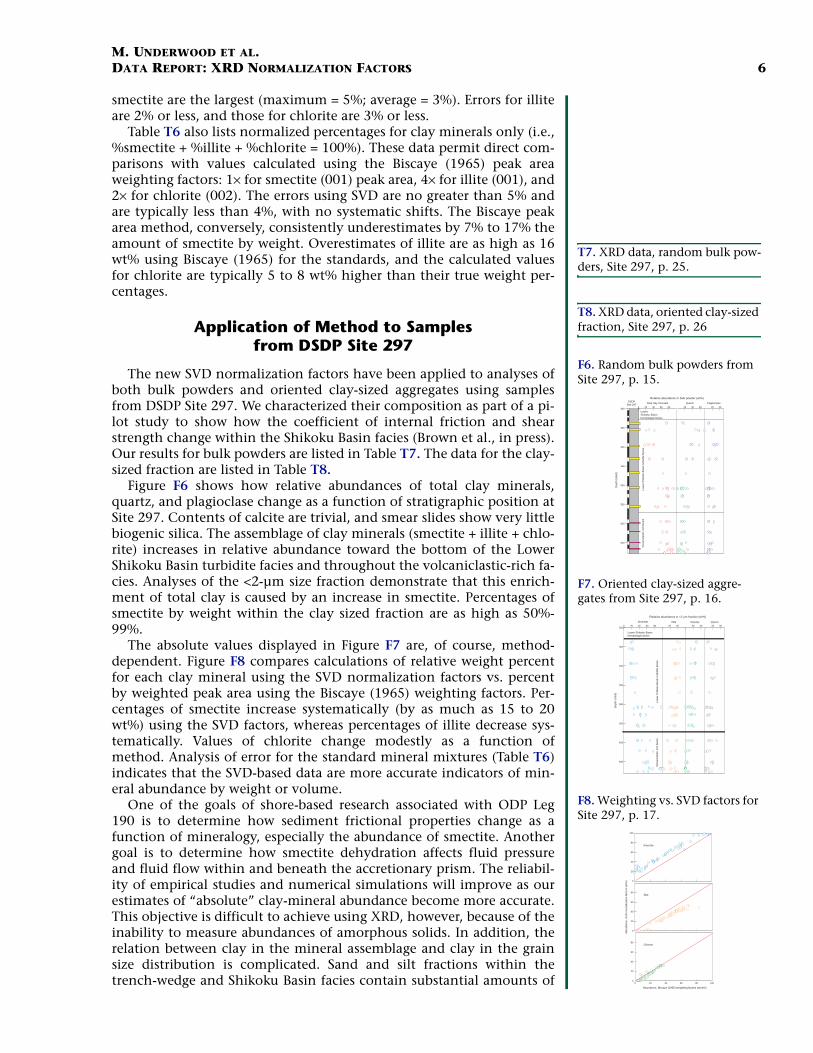
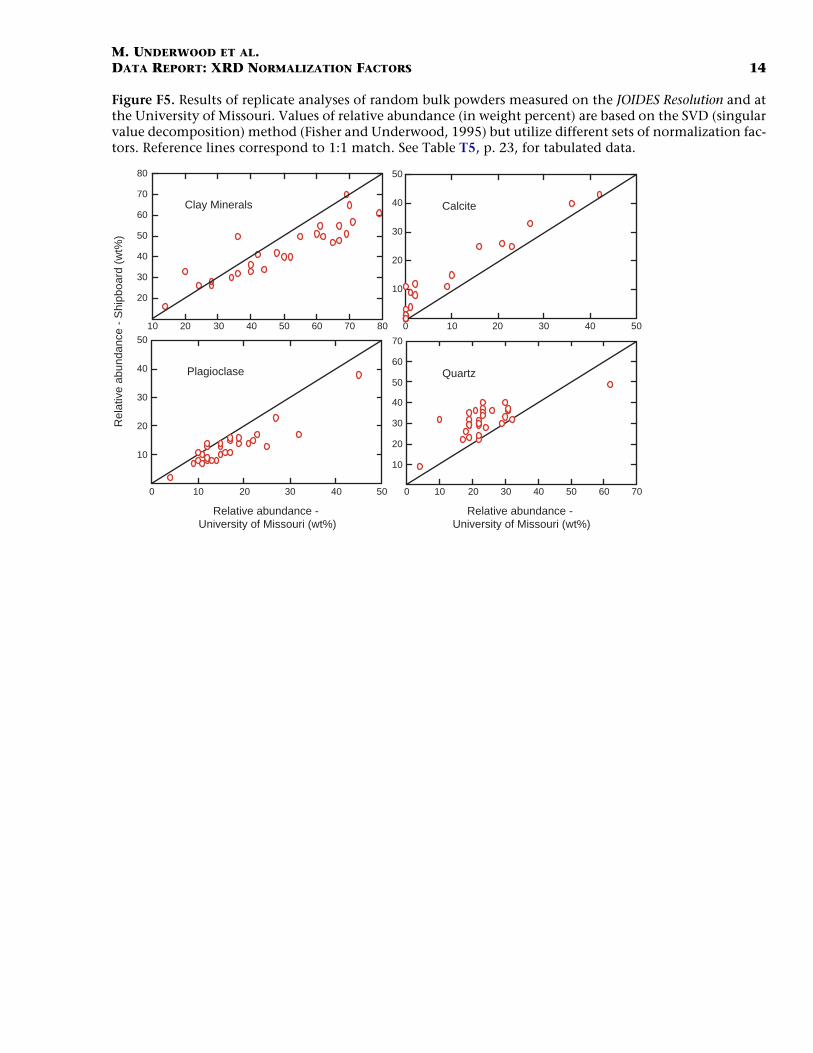
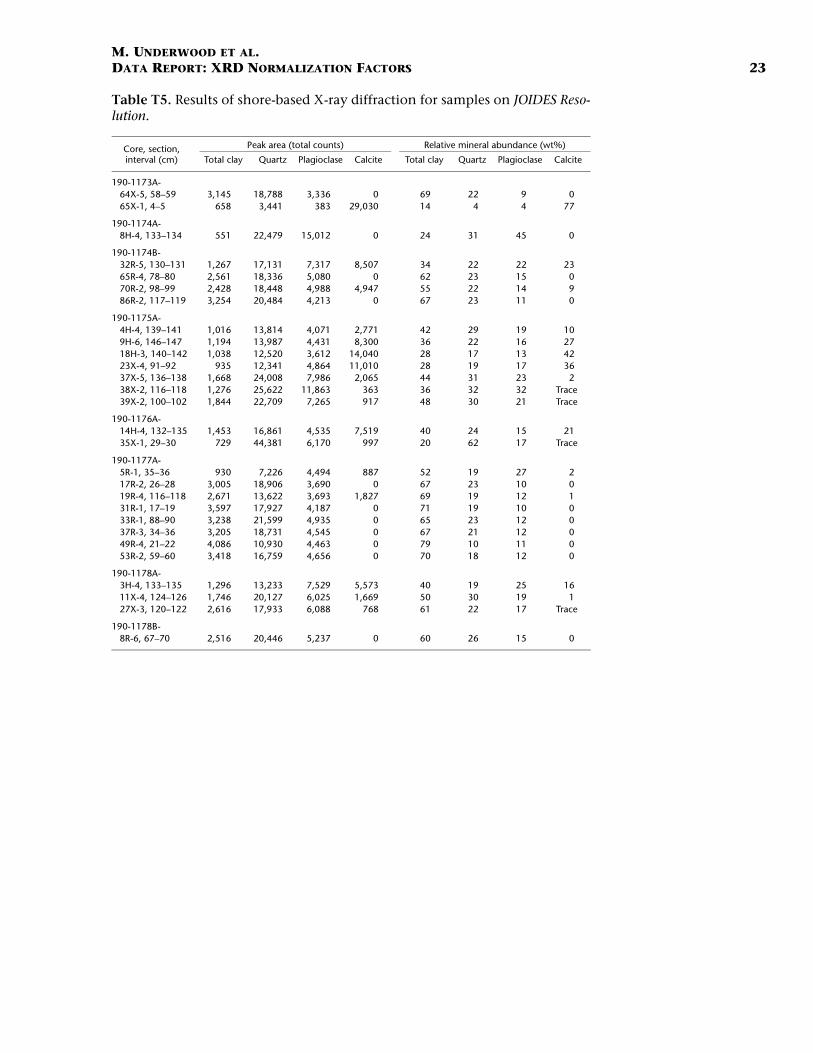
Because of our desire to compare shore-based and shipboard datawith confidence, we selected a suite of specimens to reanalyze at theUniversity of Missouri. Table T5 shows the samples selected, the newXRD peak areas, and the calculated mineral abundances. Roughly one-half of the reruns were completed on exactly the same bulk powder thatwas analyzed shipboard, but the others utilized adjacent intervalswithin sampling “clusters” that may have extended 5 to 10 cm up anddown a core. In addition, during the shipboard calculations of totalclay, we added together the individual responses of clay peaks gener-ated by four clay minerals, whereas shore-based calculations relied on asingle composite peak. Neither approach is without flaw because the in-tensity of the composite peak depends on both total clay and whichspecific clay mineral is most abundant. The differences in methodology,as expected, led to systematic shifts in calculated mineral abundancesfor the natural sediments (Fig. F5). Results from the JOIDES Resolution(Moore, Taira, Klaus, et al., 2001) shift total clay and plagioclase lower(by an average of 6 and 4 wt%, respectively) as compared to shore-basedreplicates. Replicates shift values of calcite and quartz higher for ship-board data by an average of 2 and 8 wt%, respectively.
Clay Mineral Standards
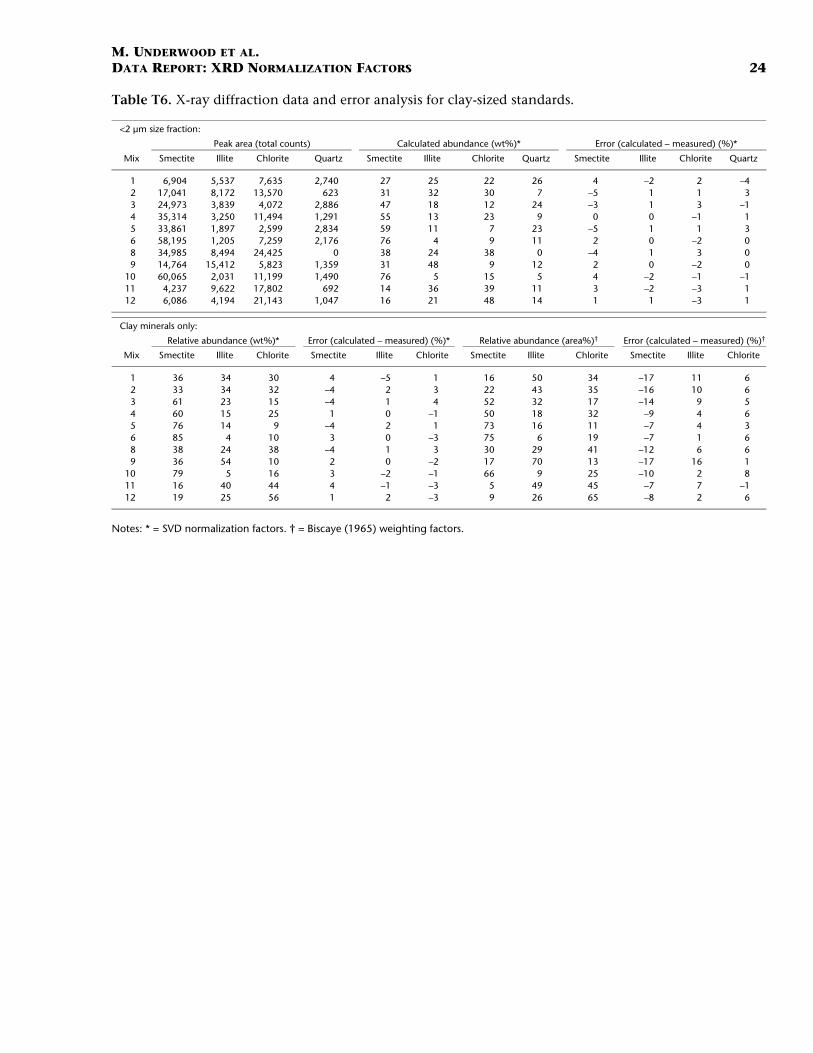
The results of XRD analyses of the clay-sized standards are shown inTable T6. As with the bulk powders, linear regression shows that the di-agnostic peak areas increase in a fairly consistent manner as a functionof each mineral’s absolute abundance (Fig. F4). Because of heterogene-ity among the three batches of oriented clay aggregates, we used the av-erage values of peak area to calculate the normalization factors shownin Table T4. Table T6 also lists the calculated values of relative weightpercent for each component of each mineral mixture, as well as the er-ror for each value relative to the true measured weight. The errors for
T3. XRD results for bulk powder mixtures, p. 21.
F4. Measured weight percent vs. average peak area from XRD, p. 13.
r = 0.92 r = 0.95 Total clay Smectite
r = 0.99
Ave
rage
pea
k ar
ea (
tota
l cou
nts)
r = 0.95 IlliteQuartz
r = 0.98 r = 0.92 ChloritePlagioclase
r = 0.99 r = 0.84 QuartzCalcite
0
20,000
40,000
60,000
80,000
0
4000
8000
12,000
16,000
0
5000
10,000
15,000
20,000
25,000
0
1000
2000
3000
0
1000
2000
3000
4000
5000
0
10,000
20,000
30,000
40,000
50,000
0
4000
8000
12,000
16,000
0
5000
10,000
15,000
20,000
25,000
10 20 30 40 50 60 70 80 20 40 60 80
0 10 20 30 40 50 60 0 10 20 30 40 50
0 10 20 30 40 0 10 20 30 40 50 60
0 20 40 60 80 0 10 20 30
Measured (wt%)Measured (wt%)
Random Bulk Powder Clay Size Fraction (<2 µm)
T4. Normalization factors for bulk powers and clay-sized aggre-gates, p. 22.
T5. Shore-based vs. shipboard XRD values, p. 23.
F5. Replicate analyses of random bulk powders, p. 14.
Plagioclase
Rel
ativ
e ab
unda
nce
- S
hipb
oard
(w
t%)
Relative abundance - University of Missouri (wt%)
Quartz
Relative abundance - University of Missouri (wt%)
10 20 30 40 50 60 70 80
Clay Minerals
0 10 20 30 40 50
Calcite
10
20
30
40
50
20
30
40
50
60
70
80
10
20
30
40
50
60
70
10
20
30
40
50
0 10 20 30 40 50 0 10 20 30 40 50 60 70
T6. XRD data and error analysis for clay-sized standards, p. 24.
M. UNDERWOOD ET AL.DATA REPORT: XRD NORMALIZATION FACTORS 6
smectite are the largest (maximum = 5%; average = 3%). Errors for illiteare 2% or less, and those for chlorite are 3% or less.
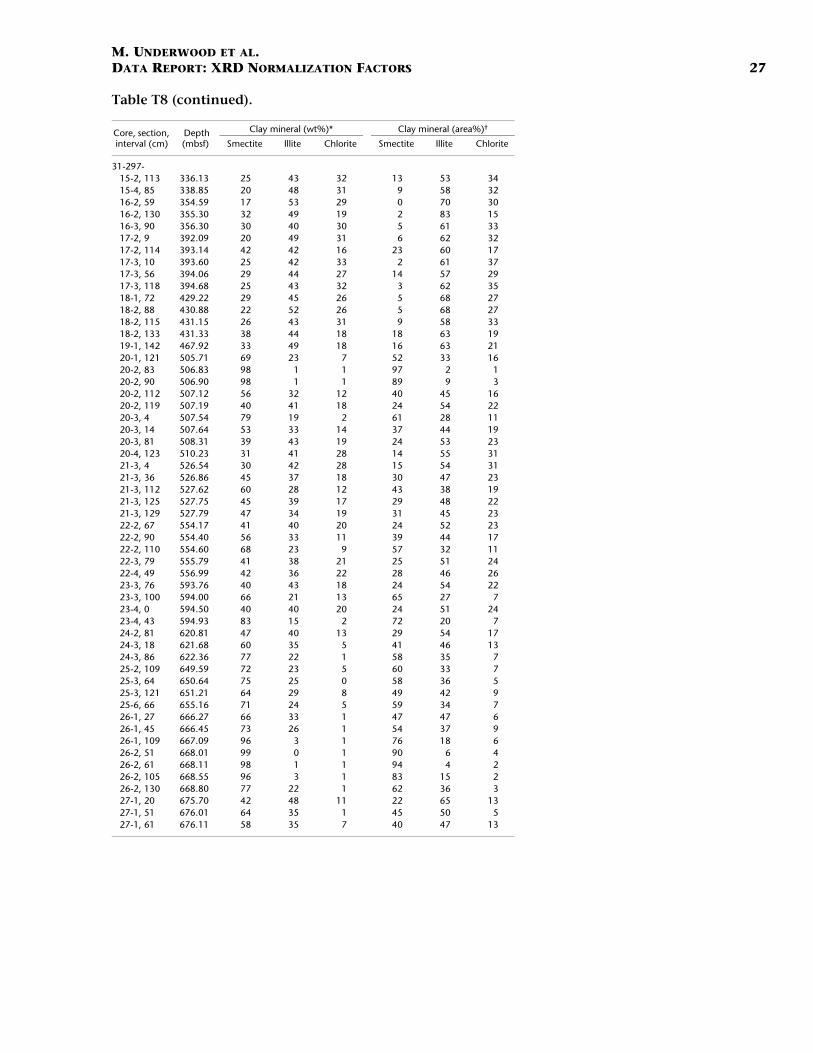
Table T6 also lists normalized percentages for clay minerals only (i.e.,%smectite + %illite + %chlorite = 100%). These data permit direct com-parisons with values calculated using the Biscaye (1965) peak areaweighting factors: 1× for smectite (001) peak area, 4× for illite (001), and2× for chlorite (002). The errors using SVD are no greater than 5% andare typically less than 4%, with no systematic shifts. The Biscaye peakarea method, conversely, consistently underestimates by 7% to 17% theamount of smectite by weight. Overestimates of illite are as high as 16wt% using Biscaye (1965) for the standards, and the calculated valuesfor chlorite are typically 5 to 8 wt% higher than their true weight per-centages.
Application of Method to Samplesfrom DSDP Site 297
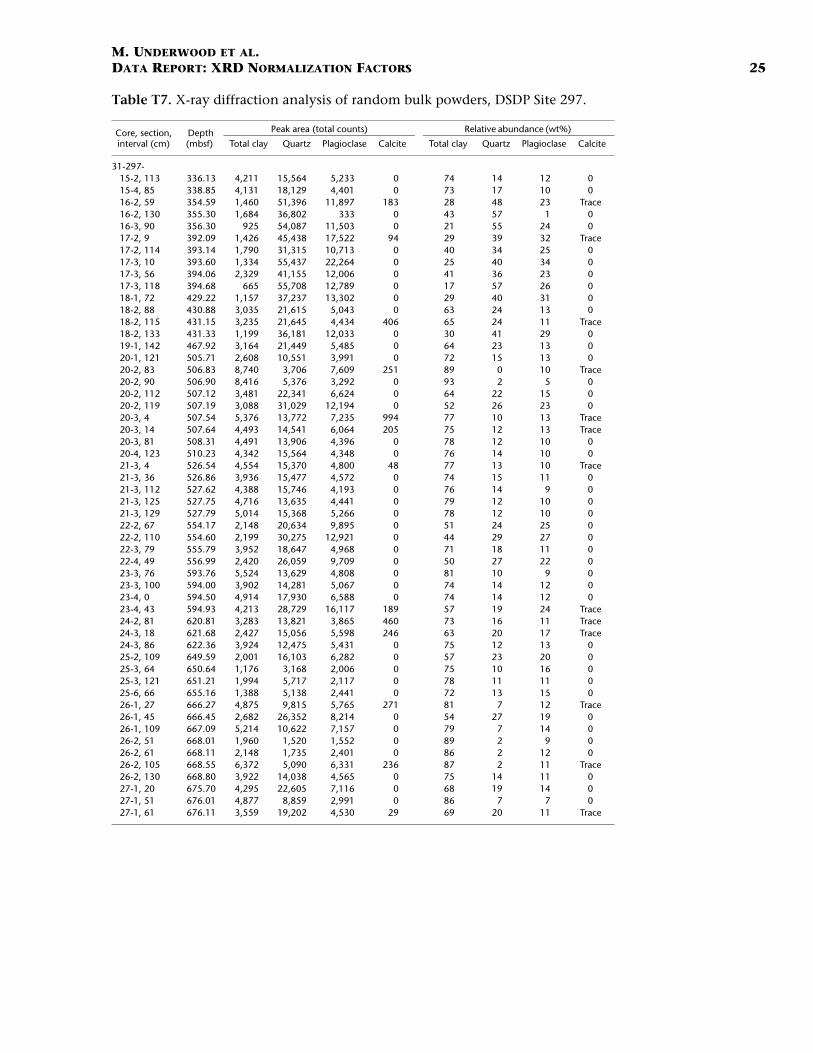
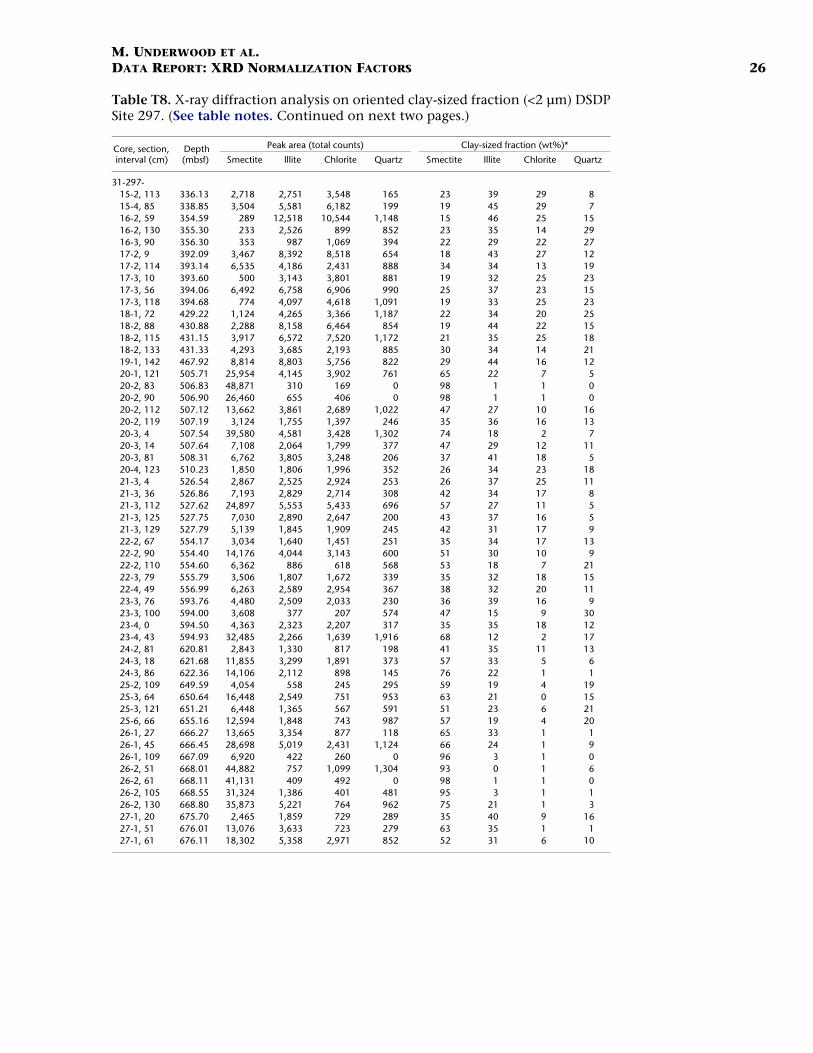
The new SVD normalization factors have been applied to analyses ofboth bulk powders and oriented clay-sized aggregates using samplesfrom DSDP Site 297. We characterized their composition as part of a pi-lot study to show how the coefficient of internal friction and shearstrength change within the Shikoku Basin facies (Brown et al., in press).Our results for bulk powders are listed in Table T7. The data for the clay-sized fraction are listed in Table T8.
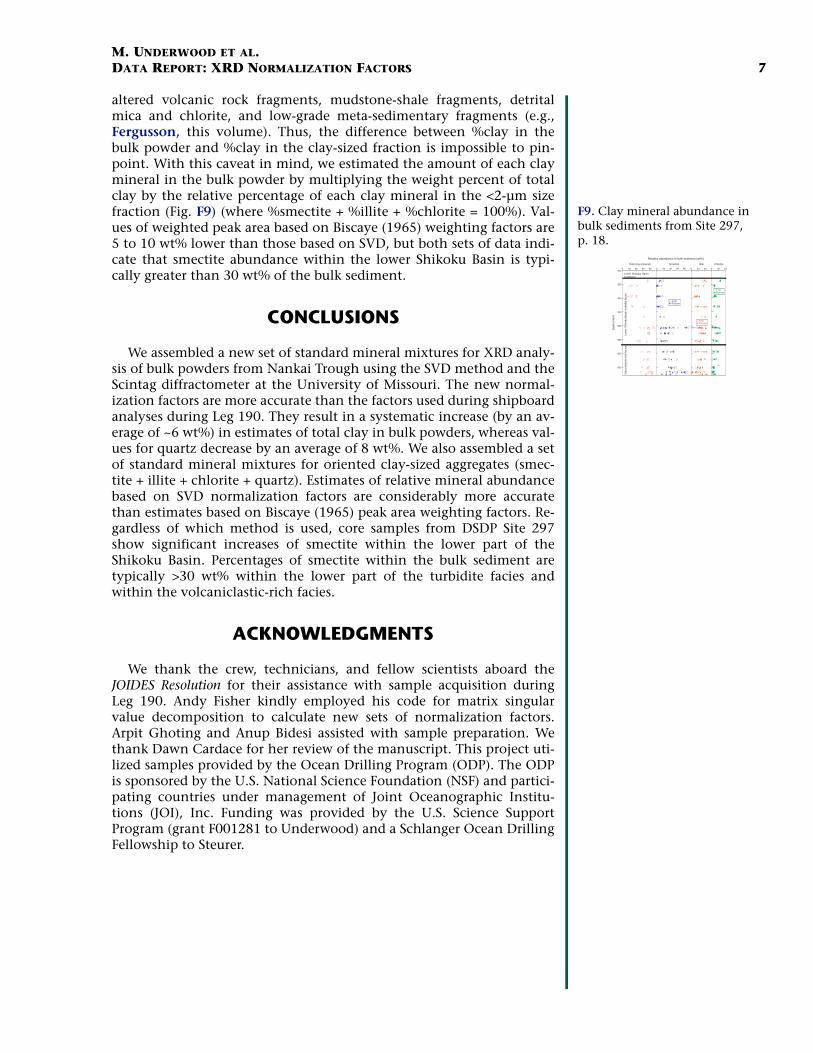
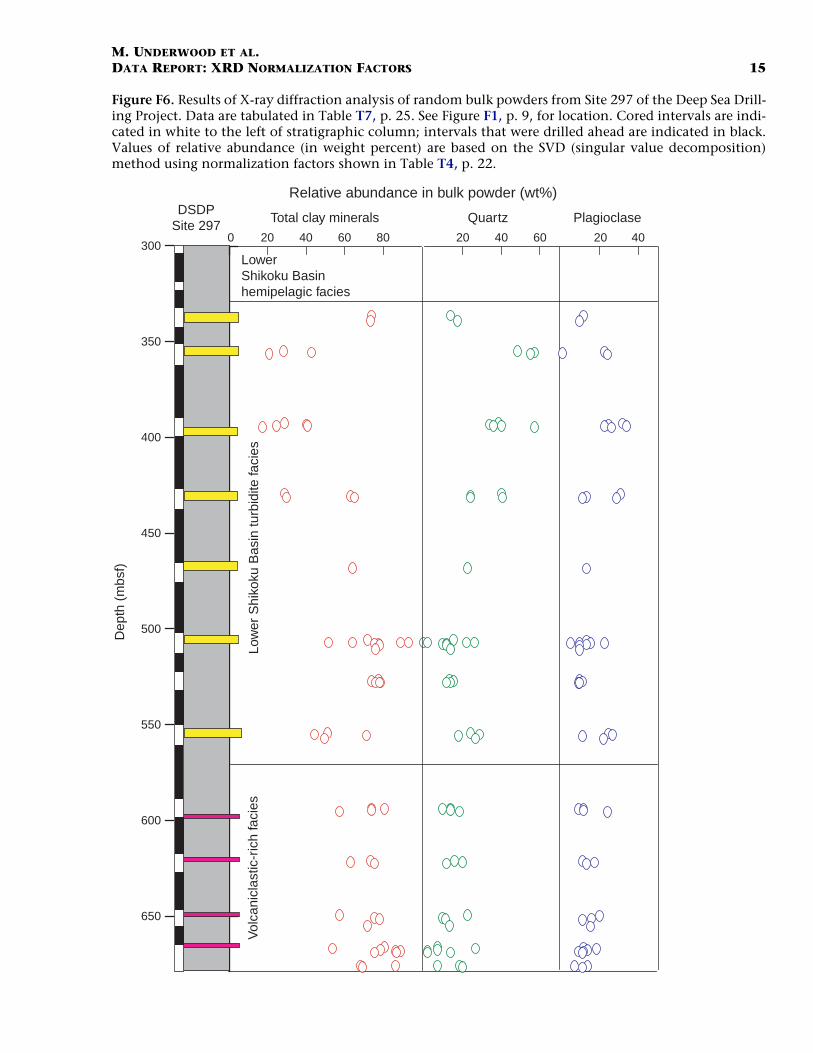
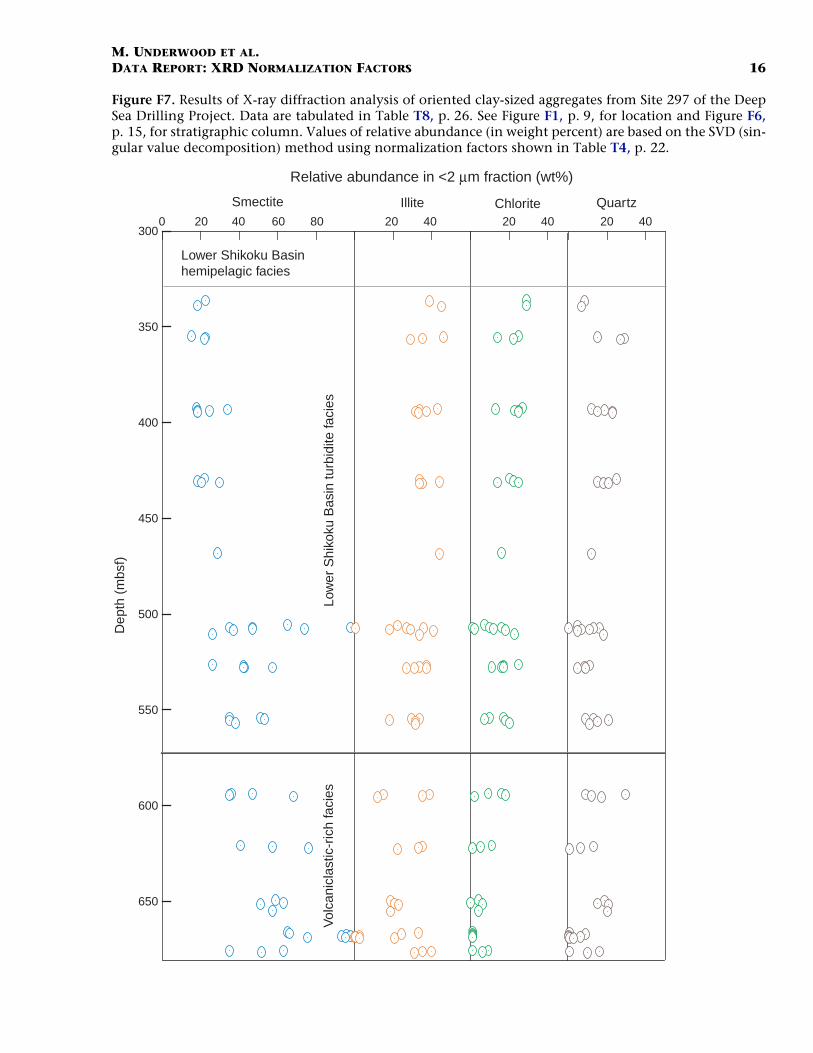
Figure F6 shows how relative abundances of total clay minerals,quartz, and plagioclase change as a function of stratigraphic position atSite 297. Contents of calcite are trivial, and smear slides show very littlebiogenic silica. The assemblage of clay minerals (smectite + illite + chlo-rite) increases in relative abundance toward the bottom of the LowerShikoku Basin turbidite facies and throughout the volcaniclastic-rich fa-cies. Analyses of the <2-µm size fraction demonstrate that this enrich-ment of total clay is caused by an increase in smectite. Percentages ofsmectite by weight within the clay sized fraction are as high as 50%-99%.
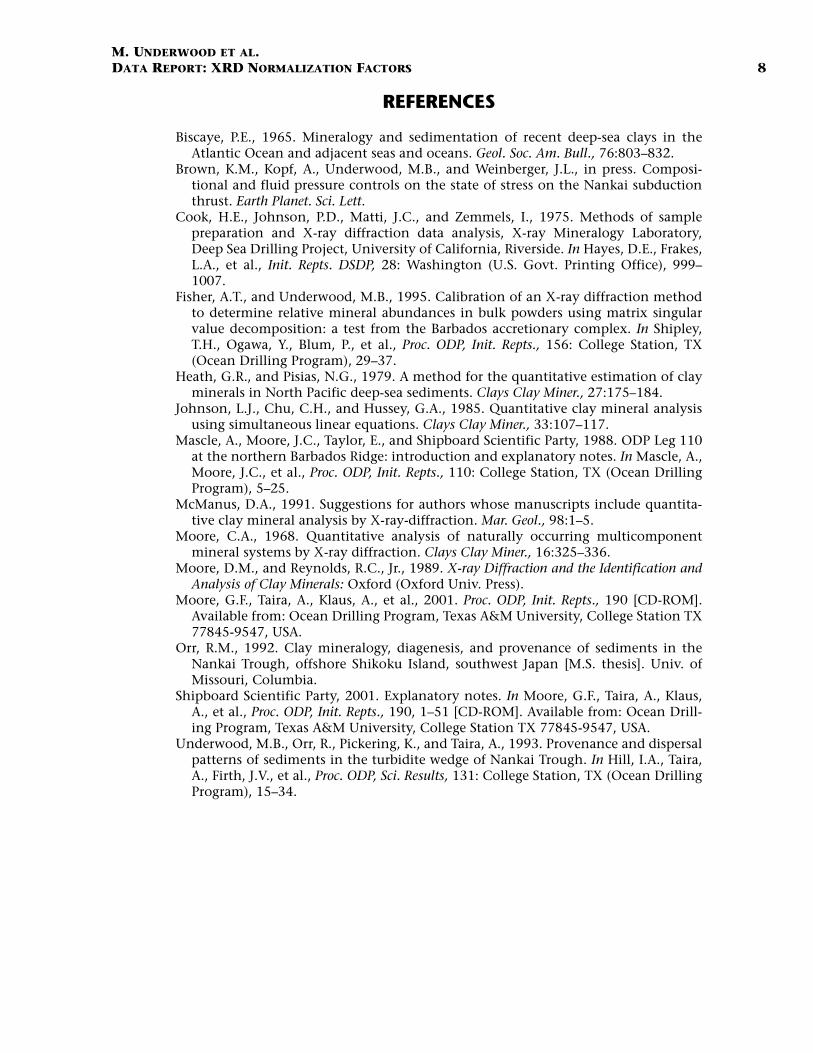
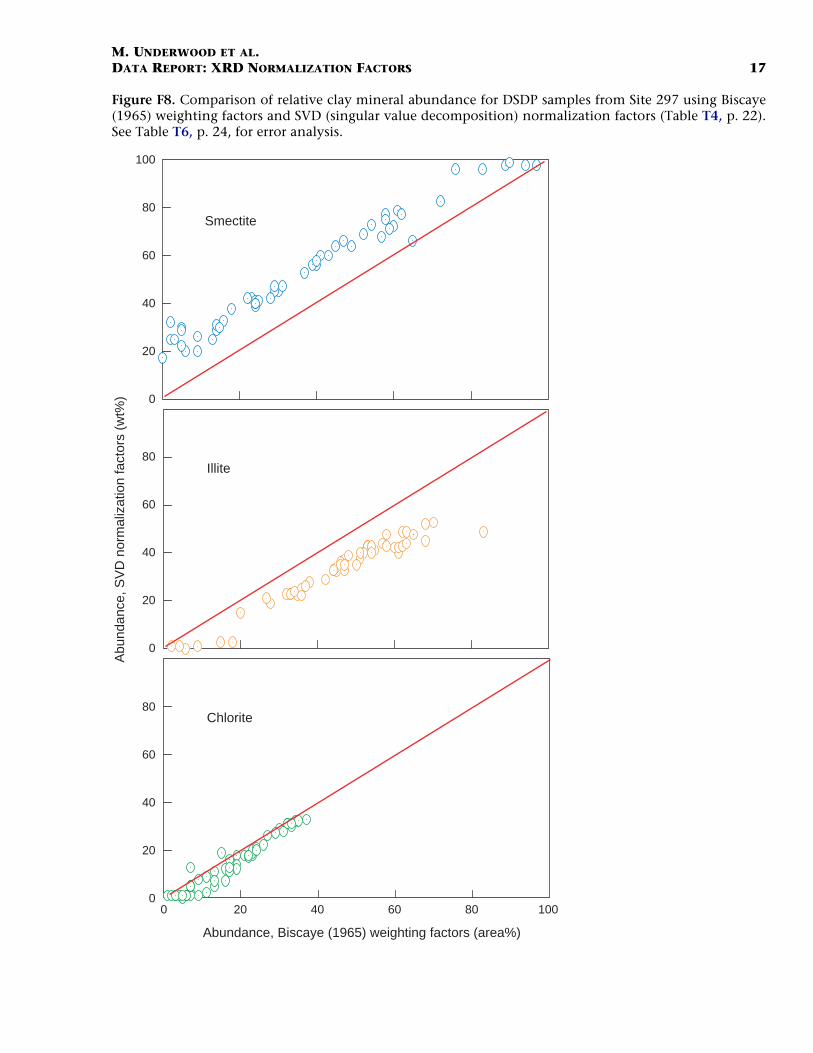
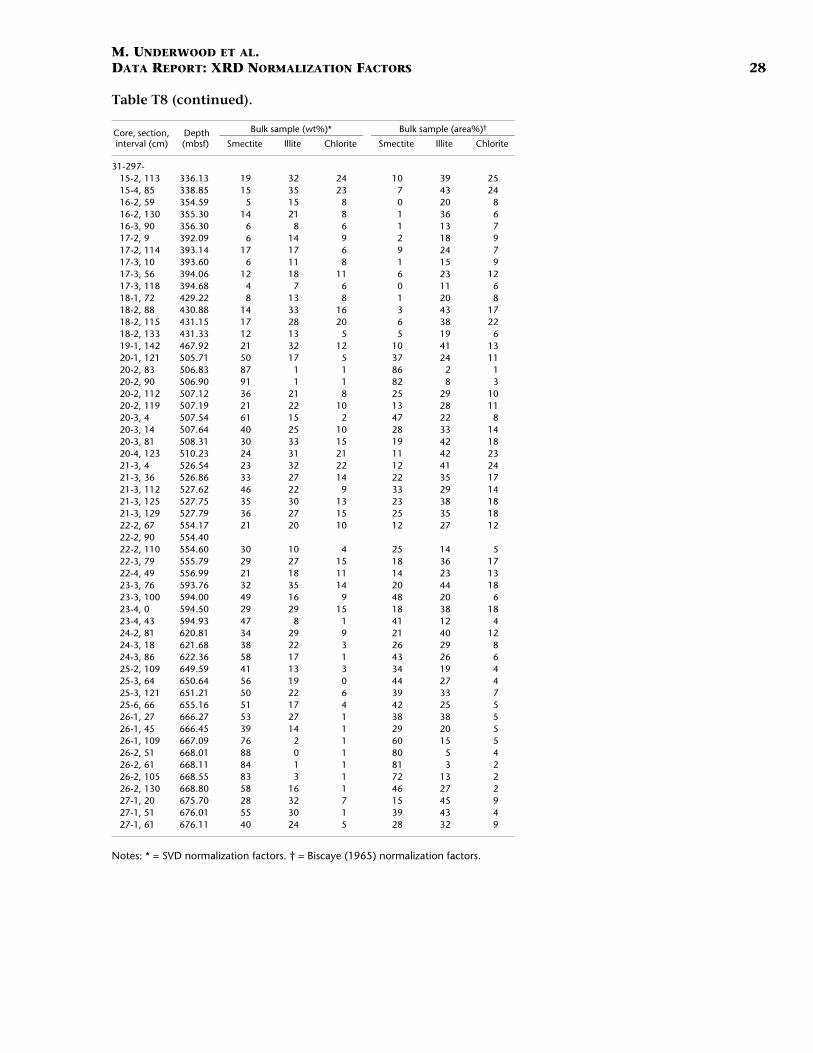
The absolute values displayed in Figure F7 are, of course, method-dependent. Figure F8 compares calculations of relative weight percentfor each clay mineral using the SVD normalization factors vs. percentby weighted peak area using the Biscaye (1965) weighting factors. Per-centages of smectite increase systematically (by as much as 15 to 20wt%) using the SVD factors, whereas percentages of illite decrease sys-tematically. Values of chlorite change modestly as a function ofmethod. Analysis of error for the standard mineral mixtures (Table T6)indicates that the SVD-based data are more accurate indicators of min-eral abundance by weight or volume.
One of the goals of shore-based research associated with ODP Leg190 is to determine how sediment frictional properties change as afunction of mineralogy, especially the abundance of smectite. Anothergoal is to determine how smectite dehydration affects fluid pressureand fluid flow within and beneath the accretionary prism. The reliabil-ity of empirical studies and numerical simulations will improve as ourestimates of “absolute” clay-mineral abundance become more accurate.This objective is difficult to achieve using XRD, however, because of theinability to measure abundances of amorphous solids. In addition, therelation between clay in the mineral assemblage and clay in the grainsize distribution is complicated. Sand and silt fractions within thetrench-wedge and Shikoku Basin facies contain substantial amounts of
T7. XRD data, random bulk pow-ders, Site 297, p. 25.
T8. XRD data, oriented clay-sized fraction, Site 297, p. 26
F6. Random bulk powders from Site 297, p. 15.
Dep
th (
mbs
f)
Vol
cani
clas
tic-r
ich
faci
es
LowerShikoku Basinhemipelagic facies
Relative abundance in bulk powder (wt%)
Low
er S
hiko
ku B
asin
turb
idite
faci
es
DSDPSite 297
0 20 40 60 80 20 40 60 20 40
Total clay minerals Quartz Plagioclase
300
350
400
450
500
550
600
650
F7. Oriented clay-sized aggre-gates from Site 297, p. 16.
Dep
th (
mbs
f)Relative abundance in <2 µm fraction (wt%)
Smectite Illite Chlorite Quartz
Vol
cani
clas
tic-r
ich
faci
esLo
wer
Shi
koku
Bas
in tu
rbid
ite fa
cies
Lower Shikoku Basinhemipelagic facies
300
350
400
450
500
550
600
650
0 20 40 60 80 20 40 20 40 20 40
F8. Weighting vs. SVD factors for Site 297, p. 17.
Abu
ndan
ce, S
VD
nor
mal
izat
ion
fact
ors
(wt%
)
0 20 40 60 80 100
Abundance, Biscaye (1965) weighting factors (area%)
Smectite
Illite
Chlorite
0
20
40
60
80
100
0
20
40
60
80
0
20
40
60
80
M. UNDERWOOD ET AL.DATA REPORT: XRD NORMALIZATION FACTORS 7
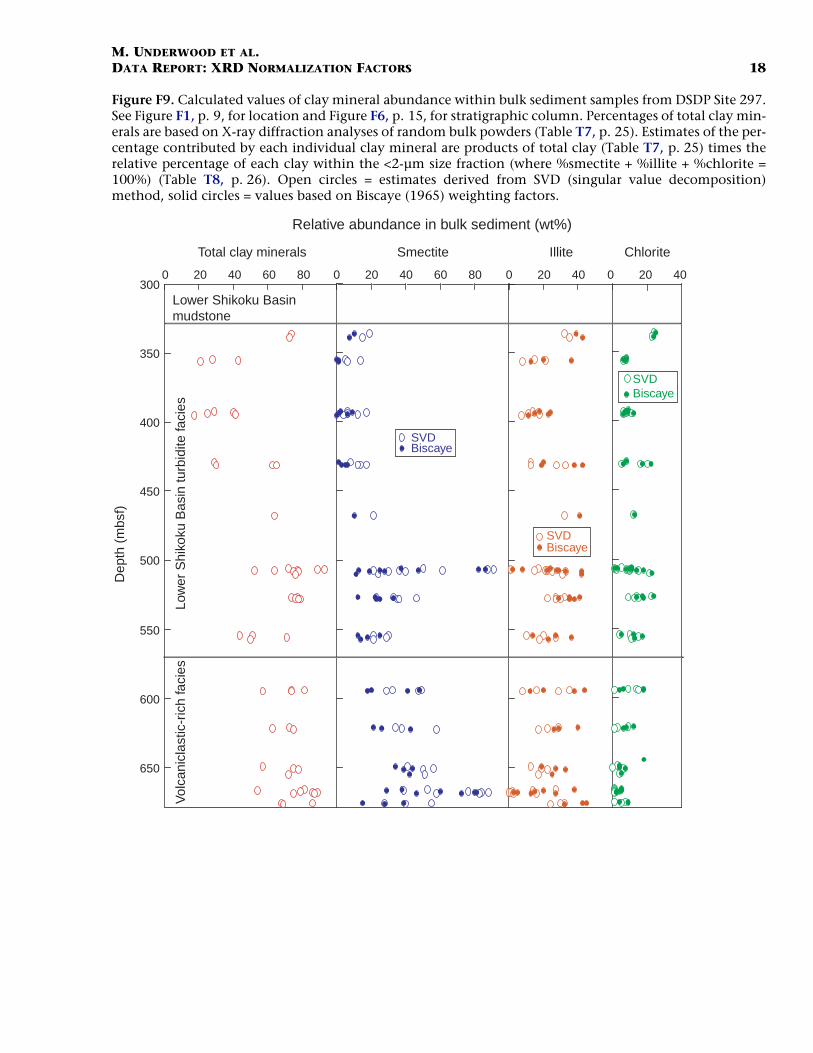
altered volcanic rock fragments, mudstone-shale fragments, detritalmica and chlorite, and low-grade meta-sedimentary fragments (e.g.,Fergusson, this volume). Thus, the difference between %clay in thebulk powder and %clay in the clay-sized fraction is impossible to pin-point. With this caveat in mind, we estimated the amount of each claymineral in the bulk powder by multiplying the weight percent of totalclay by the relative percentage of each clay mineral in the <2-µm sizefraction (Fig. F9) (where %smectite + %illite + %chlorite = 100%). Val-ues of weighted peak area based on Biscaye (1965) weighting factors are5 to 10 wt% lower than those based on SVD, but both sets of data indi-cate that smectite abundance within the lower Shikoku Basin is typi-cally greater than 30 wt% of the bulk sediment.
CONCLUSIONS
We assembled a new set of standard mineral mixtures for XRD analy-sis of bulk powders from Nankai Trough using the SVD method and theScintag diffractometer at the University of Missouri. The new normal-ization factors are more accurate than the factors used during shipboardanalyses during Leg 190. They result in a systematic increase (by an av-erage of ~6 wt%) in estimates of total clay in bulk powders, whereas val-ues for quartz decrease by an average of 8 wt%. We also assembled a setof standard mineral mixtures for oriented clay-sized aggregates (smec-tite + illite + chlorite + quartz). Estimates of relative mineral abundancebased on SVD normalization factors are considerably more accuratethan estimates based on Biscaye (1965) peak area weighting factors. Re-gardless of which method is used, core samples from DSDP Site 297show significant increases of smectite within the lower part of theShikoku Basin. Percentages of smectite within the bulk sediment aretypically >30 wt% within the lower part of the turbidite facies andwithin the volcaniclastic-rich facies.
ACKNOWLEDGMENTS
We thank the crew, technicians, and fellow scientists aboard theJOIDES Resolution for their assistance with sample acquisition duringLeg 190. Andy Fisher kindly employed his code for matrix singularvalue decomposition to calculate new sets of normalization factors.Arpit Ghoting and Anup Bidesi assisted with sample preparation. Wethank Dawn Cardace for her review of the manuscript. This project uti-lized samples provided by the Ocean Drilling Program (ODP). The ODPis sponsored by the U.S. National Science Foundation (NSF) and partici-pating countries under management of Joint Oceanographic Institu-tions (JOI), Inc. Funding was provided by the U.S. Science SupportProgram (grant F001281 to Underwood) and a Schlanger Ocean DrillingFellowship to Steurer.
F9. Clay mineral abundance in bulk sediments from Site 297, p. 18.
Dep
th (
mbs
f)
SVDBiscaye
Relative abundance in bulk sediment (wt%)
Lower Shikoku Basinmudstone
Low
er S
hiko
ku B
asin
turb
idite
faci
esV
olca
nicl
astic
-ric
h fa
cies
SVDBiscaye
SVDBiscaye
0 20 40 60 80 0 20 40 60 80 0 20 40 0 20 40
Total clay minerals Smectite Illite Chlorite
300
350
400
450
500
550
600
650
M. UNDERWOOD ET AL.DATA REPORT: XRD NORMALIZATION FACTORS 8
REFERENCES
Biscaye, P.E., 1965. Mineralogy and sedimentation of recent deep-sea clays in theAtlantic Ocean and adjacent seas and oceans. Geol. Soc. Am. Bull., 76:803–832.
Brown, K.M., Kopf, A., Underwood, M.B., and Weinberger, J.L., in press. Composi-tional and fluid pressure controls on the state of stress on the Nankai subductionthrust. Earth Planet. Sci. Lett.
Cook, H.E., Johnson, P.D., Matti, J.C., and Zemmels, I., 1975. Methods of samplepreparation and X-ray diffraction data analysis, X-ray Mineralogy Laboratory,Deep Sea Drilling Project, University of California, Riverside. In Hayes, D.E., Frakes,L.A., et al., Init. Repts. DSDP, 28: Washington (U.S. Govt. Printing Office), 999–1007.
Fisher, A.T., and Underwood, M.B., 1995. Calibration of an X-ray diffraction methodto determine relative mineral abundances in bulk powders using matrix singularvalue decomposition: a test from the Barbados accretionary complex. In Shipley,T.H., Ogawa, Y., Blum, P., et al., Proc. ODP, Init. Repts., 156: College Station, TX(Ocean Drilling Program), 29–37.
Heath, G.R., and Pisias, N.G., 1979. A method for the quantitative estimation of clayminerals in North Pacific deep-sea sediments. Clays Clay Miner., 27:175–184.
Johnson, L.J., Chu, C.H., and Hussey, G.A., 1985. Quantitative clay mineral analysisusing simultaneous linear equations. Clays Clay Miner., 33:107–117.
Mascle, A., Moore, J.C., Taylor, E., and Shipboard Scientific Party, 1988. ODP Leg 110at the northern Barbados Ridge: introduction and explanatory notes. In Mascle, A.,Moore, J.C., et al., Proc. ODP, Init. Repts., 110: College Station, TX (Ocean DrillingProgram), 5–25.
McManus, D.A., 1991. Suggestions for authors whose manuscripts include quantita-tive clay mineral analysis by X-ray-diffraction. Mar. Geol., 98:1–5.
Moore, C.A., 1968. Quantitative analysis of naturally occurring multicomponentmineral systems by X-ray diffraction. Clays Clay Miner., 16:325–336.
Moore, D.M., and Reynolds, R.C., Jr., 1989. X-ray Diffraction and the Identification andAnalysis of Clay Minerals: Oxford (Oxford Univ. Press).
Moore, G.F., Taira, A., Klaus, A., et al., 2001. Proc. ODP, Init. Repts., 190 [CD-ROM].Available from: Ocean Drilling Program, Texas A&M University, College Station TX77845-9547, USA.
Orr, R.M., 1992. Clay mineralogy, diagenesis, and provenance of sediments in theNankai Trough, offshore Shikoku Island, southwest Japan [M.S. thesis]. Univ. ofMissouri, Columbia.
Shipboard Scientific Party, 2001. Explanatory notes. In Moore, G.F., Taira, A., Klaus,A., et al., Proc. ODP, Init. Repts., 190, 1–51 [CD-ROM]. Available from: Ocean Drill-ing Program, Texas A&M University, College Station TX 77845-9547, USA.
Underwood, M.B., Orr, R., Pickering, K., and Taira, A., 1993. Provenance and dispersalpatterns of sediments in the turbidite wedge of Nankai Trough. In Hill, I.A., Taira,A., Firth, J.V., et al., Proc. ODP, Sci. Results, 131: College Station, TX (Ocean DrillingProgram), 15–34.
M. UNDERWOOD ET AL.DATA REPORT: XRD NORMALIZATION FACTORS 9
Figure F1. Map showing locations of DSDP (Deep Sea Drilling Project) and ODP (Ocean Drilling Program)sites along the northern edge of Shikoku Basin and Nankai Trough, Philippine Sea.
Shikoku
Kyus
hu
Honshu
297
298 582
583
808
1177
1174
1173
1178 1175
1176
MurotoTransect
AshizuriTransect
Shikoku Basin
Nankai
Trough
Kii
Peninsula
31°
32°
33°
34°N
131°E 132° 133° 134° 135° 136° 137°
M. UNDERWOOD ET AL.DATA REPORT: XRD NORMALIZATION FACTORS 10
Figure F2. X-ray diffractograms for standard mineral mixtures analyzed as random bulk powders. Note theactual weight percentages of each mineral within each mixture. Peaks used for calculation of SVD (singularvalue decomposition) normalization factors are labeled as follows: CL = composite clay minerals, Q =quartz, P = plagioclase, CC = calcite. (Continued on next page.)
CL
Mixture 2:Clay = 54%Quartz = 27%Plagioclase = 9%Calcite = 10%
CL
Q
P
CC
Mixture 3:Clay = 64%Quartz = 10%Plagioclase = 10%Calcite = 16%
Mixture 4:Clay = 49%Quartz = 5%Plagioclase = 27%Calcite = 19%
Mixture 5:Clay = 41%Quartz = 30%Plagioclase = 5%Calcite = 24%
Mixture 7:Clay = 23%Quartz = 13%Plagioclase = 13%Calcite = 51%
Q
P
CC
CL
Mixture 1:Clay = 76%Quartz = 9%Plagioclase = 8%Calcite = 7%
CL
Q
P CC
CL
Q
P
CC
Q P
CC
CL
Q
P
CC
5 10 15 20 25 30
Mixture 6:Clay = 36%Quartz = 19%Plagioclase = 15%Calcite = 30%
CL
Q
P
CC
Peak position (°2θ)
Mixture 8:Clay = 20%Quartz = 5%Plagioclase = 5%Calcite = 70%
CL
Q
P
CC
Mixture 9:Clay = 14%Quartz = 46%Plagioclase = 38%Calcite = 2%
CL
P
CC
Q
5 10 15 20 25 30
Mixture 10:Clay = 16%Quartz = 57%Plagioclase = 21%Calcite = 6%
CL
Q
P
CC
Peak position (°2θ)
200
400
600
800
200
400
600
800
1000
200
600
1000
1400
1800
400
800
1200
1600
2000
2400
200
400
600
200
400
600
800
1000
1200
1400
200
400
600
200
400
600
200
400
600
800
1000
1200
200
400
600
800
Pea
k in
tens
ity (
cps)
M. UNDERWOOD ET AL.DATA REPORT: XRD NORMALIZATION FACTORS 11
Figure F2 (continued).
Mixture 11:Clay = 58%Quartz = 8%Plagioclase = 6%Calcite = 28%
CL
Q
P
CC
Mixture 12:Clay = 71%Quartz = 11%Plagioclase = 11%Calcite = 7%
CL
Q
P CC
Mixture 13:Clay = 67%Quartz = 16%Plagioclase = 13%Calcite = 4%
CL
Q
P CC
5 10 15 20 25 30
Mixture 14:Clay = 39%Quartz = 13%Plagioclase = 9%Calcite = 39%
CL
Q
P
CC
5 10 15 20 25 30Peak position (°2θ)
Peak position (°2θ)
Pea
k in
tens
ity (
cps)
200
400
600
200
400
600 200
400
600
800
1000
200
400
600
800
M. UNDERWOOD ET AL.DATA REPORT: XRD NORMALIZATION FACTORS 12
Figure F3. X-ray diffractograms for standard mineral mixtures analyzed as oriented clay aggregates (<2 µm).Note the actual weight percentages of each mineral within each mixture. Peaks used for calculation of SVD(singular value decomposition) normalization factors are smectite (001), illite (001), chlorite (002), andquartz (100).
4 6 8 10 12 14 16 18 20 22
Mixture 11:Smectite = 11%Illite = 38%Chlorite = 42%Quartz = 9%
smectite (001)
chlorite (001)
illite (001)
chlorite (002)chlorite (003)
quartz (100)
Peak position (°2θ)
quartz (100)
chlorite (003)
smectite(003)
chlorite (002)
illite (001)
chlorite (001)
smectite (001)
Mixture 10:Smectite = 71%Illite = 7%Chlorite = 16%Quartz = 6%
Mixture 9:Smectite = 30%Illite = 48%Chlorite = 10%Quartz = 12%
smectite (001)
chlorite (001)
illite (001)
chlorite (002)
chlorite (003)
quartz (100)
illite (002)
smectite (001)
illite (001)
chlorite (002) smectite
(003)
chlorite (003)
quartz (100)
Mixture 5:Smectite = 64%Illite = 10%Chlorite = 7%Quartz = 19%
smectite (001)
illite (001)
chlorite (002)
chlorite (003) quartz (100)
quartz (100)
chlorite (003)chlorite (002)
illite (001)
smectite (001)
chlorite (001)
Mixture 1:Smectite = 22%Illite = 27%Chlorite = 28%Quartz = 31%
Mixture 3:Smectite = 49%Illite = 17%Chlorite = 9%Quartz = 25%
smectite (003)
quartz (100)
Mixture 12:Smectite = 15%Illite = 20%Chlorite = 52%Quartz = 13%
4 6 8 10 12 14 16 18 20 22
Peak position (°2θ)
chlorite (003)
chlorite (002)
illite (001)
chlorite (001)
smectite (001)
chlorite (003)
chlorite (002)
illite (001)
chlorite (001)
smectite (001)
smectite (003)
Mixture 8:Smectite = 42%Illite = 23%Chlorite = 35%Quartz = 0%
chlorite (003)
quartz (100)
chlorite (002)
illite (001)
chlorite (001)
smectite (001)
smectite (003)
Mixture 4:Smectite = 54%Illite = 14%Chlorite = 24%Quartz = 8%
Pea
k in
tens
ity (
cps)
Mixture 2:Smectite = 36%Illite = 31%Chlorite = 29%Quartz = 4%
quartz (100)
chlorite (003)chlorite (002)
illite (001)
chlorite (001)
smectite (001)
smectite (003)
quartz (100)
chlorite (003)chlorite (002)
illite (001)
chlorite (001)
smectite (001)
smectite (003)
Mixture 6:Smectite = 74%Illite = 4%Chlorite = 12% Quartz = 10%
200
400
200
400
200
400
200
400
600
200
400
200
400
600
800
200
400
200
400
600
800
200
400
600
200
400
600
800
200
400
600
M. UNDERWOOD ET AL.DATA REPORT: XRD NORMALIZATION FACTORS 13
Figure F4. Linear regression plots of measured weight percent vs. average peak area from X-ray diffraction.Plots on the left show results for random bulk powders (see Fig. F2, p. 10, for diffractograms). Plots on theright show results for oriented clay-sized aggregates (see Fig. F3, p. 12, for diffractograms). Correlation co-efficients are shown as r-values. See Tables T3, p. 21, and T6, p. 24, for error analysis.
r = 0.92 r = 0.95 Total clay Smectite
r = 0.99
Ave
rage
pea
k ar
ea (
tota
l cou
nts)
r = 0.95 IlliteQuartz
r = 0.98 r = 0.92 ChloritePlagioclase
r = 0.99 r = 0.84 QuartzCalcite
0
20,000
40,000
60,000
80,000
0
4000
8000
12,000
16,000
0
5000
10,000
15,000
20,000
25,000
0
1000
2000
3000
0
1000
2000
3000
4000
5000
0
10,000
20,000
30,000
40,000
50,000
0
4000
8000
12,000
16,000
0
5000
10,000
15,000
20,000
25,000
10 20 30 40 50 60 70 80 20 40 60 80
0 10 20 30 40 50 60 0 10 20 30 40 50
0 10 20 30 40 0 10 20 30 40 50 60
0 20 40 60 80 0 10 20 30
Measured (wt%)Measured (wt%)
Random Bulk Powder Clay Size Fraction (<2 µm)
M. UNDERWOOD ET AL.DATA REPORT: XRD NORMALIZATION FACTORS 14
Figure F5. Results of replicate analyses of random bulk powders measured on the JOIDES Resolution and atthe University of Missouri. Values of relative abundance (in weight percent) are based on the SVD (singularvalue decomposition) method (Fisher and Underwood, 1995) but utilize different sets of normalization fac-tors. Reference lines correspond to 1:1 match. See Table T5, p. 23, for tabulated data.
Plagioclase
Rel
ativ
e ab
unda
nce
- S
hipb
oard
(w
t%)
Relative abundance - University of Missouri (wt%)
Quartz
Relative abundance - University of Missouri (wt%)
10 20 30 40 50 60 70 80
Clay Minerals
0 10 20 30 40 50
Calcite
10
20
30
40
50
20
30
40
50
60
70
80
10
20
30
40
50
60
70
10
20
30
40
50
0 10 20 30 40 50 0 10 20 30 40 50 60 70
M. UNDERWOOD ET AL.DATA REPORT: XRD NORMALIZATION FACTORS 15
Figure F6. Results of X-ray diffraction analysis of random bulk powders from Site 297 of the Deep Sea Drill-ing Project. Data are tabulated in Table T7, p. 25. See Figure F1, p. 9, for location. Cored intervals are indi-cated in white to the left of stratigraphic column; intervals that were drilled ahead are indicated in black.Values of relative abundance (in weight percent) are based on the SVD (singular value decomposition)method using normalization factors shown in Table T4, p. 22.
Dep
th (
mbs
f)
Vol
cani
clas
tic-r
ich
faci
esLowerShikoku Basinhemipelagic facies
Relative abundance in bulk powder (wt%)
Low
er S
hiko
ku B
asin
turb
idite
faci
es
DSDPSite 297
0 20 40 60 80 20 40 60 20 40
Total clay minerals Quartz Plagioclase
300
350
400
450
500
550
600
650
M. UNDERWOOD ET AL.DATA REPORT: XRD NORMALIZATION FACTORS 16
Figure F7. Results of X-ray diffraction analysis of oriented clay-sized aggregates from Site 297 of the DeepSea Drilling Project. Data are tabulated in Table T8, p. 26. See Figure F1, p. 9, for location and Figure F6,p. 15, for stratigraphic column. Values of relative abundance (in weight percent) are based on the SVD (sin-gular value decomposition) method using normalization factors shown in Table T4, p. 22.
Dep
th (
mbs
f)
Relative abundance in <2 µm fraction (wt%)
Smectite Illite Chlorite Quartz
Vol
cani
clas
tic-r
ich
faci
esLo
wer
Shi
koku
Bas
in tu
rbid
ite fa
cies
Lower Shikoku Basinhemipelagic facies
300
350
400
450
500
550
600
650
0 20 40 60 80 20 40 20 40 20 40
M. UNDERWOOD ET AL.DATA REPORT: XRD NORMALIZATION FACTORS 17
Figure F8. Comparison of relative clay mineral abundance for DSDP samples from Site 297 using Biscaye(1965) weighting factors and SVD (singular value decomposition) normalization factors (Table T4, p. 22).See Table T6, p. 24, for error analysis.
Abu
ndan
ce, S
VD
nor
mal
izat
ion
fact
ors
(wt%
)
0 20 40 60 80 100
Abundance, Biscaye (1965) weighting factors (area%)
Smectite
Illite
Chlorite
0
20
40
60
80
100
0
20
40
60
80
0
20
40
60
80
M. UNDERWOOD ET AL.DATA REPORT: XRD NORMALIZATION FACTORS 18
Figure F9. Calculated values of clay mineral abundance within bulk sediment samples from DSDP Site 297.See Figure F1, p. 9, for location and Figure F6, p. 15, for stratigraphic column. Percentages of total clay min-erals are based on X-ray diffraction analyses of random bulk powders (Table T7, p. 25). Estimates of the per-centage contributed by each individual clay mineral are products of total clay (Table T7, p. 25) times therelative percentage of each clay within the <2-µm size fraction (where %smectite + %illite + %chlorite =100%) (Table T8, p. 26). Open circles = estimates derived from SVD (singular value decomposition)method, solid circles = values based on Biscaye (1965) weighting factors.
Dep
th (
mbs
f)
SVDBiscaye
Relative abundance in bulk sediment (wt%)
Lower Shikoku Basinmudstone
Low
er S
hiko
ku B
asin
turb
idite
faci
esV
olca
nicl
astic
-ric
h fa
cies
SVDBiscaye
SVDBiscaye
0 20 40 60 80 0 20 40 60 80 0 20 40 0 20 40
Total clay minerals Smectite Illite Chlorite
300
350
400
450
500
550
600
650
M. UNDERWOOD ET AL.DATA REPORT: XRD NORMALIZATION FACTORS 19
Table T1. Bulk-powder mixtures for calibration of normaliza-tion factors
Mix
Target minerals (wt%)
Smectite Illite Chlorite Total clay Quartz Plagioclase Calcite
1 58 9 10 76 9 8 72 39 7 8 54 27 10 103 34 6 24 64 11 10 164 25 5 20 49 6 27 195 19 9 13 41 31 5 246 10 13 13 36 19 15 307 7 6 10 23 13 13 518 6 8 6 20 6 5 709 8 0 6 14 46 38 2
10 0 8 9 16 57 21 611 9 20 30 58 8 6 2712 12 26 33 71 11 11 713 14 33 20 67 16 13 414 20 15 4 39 13 9 39
M. UNDERWOOD ET AL.DATA REPORT: XRD NORMALIZATION FACTORS 20
Table T2. Clay-sized (<2 µm) mineral mixtures forcalibration of normalization factors.
Mix
Target minerals (wt%)
Smectite Illite Chlorite Quartz
1 22 27 20 312 36 31 29 43 49 17 9 254 54 14 24 85 64 10 7 196 74 4 12 108 42 23 35 09 30 48 10 12
10 71 7 16 611 11 38 42 912 15 20 52 13
M. U
ND
ER
WO
OD
ET A
L.D
AT
A R
EP
OR
T: XR
D N
OR
MA
LIZ
AT
ION
FA
CT
OR
S2
1
Table T3. X-ray diffraction results for bulk powder standard mixtures.
Mix
ak area (total counts) Calculated abundance (wt%) Error (calculated – measured) (%)
Quartz Plagioclase Calcite Total clay Quartz Plagioclase Calcite Total clay Quartz Plagioclase Calcite
1 7,404 4,365 4,690 77 6 11 6 1 –3 3 –12 21,015 3,652 6,062 59 22 9 10 5 –5 –1 03 6,718 3,209 7,340 61 9 11 20 –3 –2 1 44 5,387 9,478 8,550 47 5 26 21 –2 –1 –1 25 25,426 1,591 11,105 36 31 5 27 –5 1 0 46 14,961 5,437 12,820 31 19 16 34 –5 0 1 47 11,746 3,779 20,015 22 14 12 52 –1 1 –1 18 4,166 1,349 24,470 22 5 7 66 2 –1 2 –49 40,605 15,254 1,183 15 47 37 1 1 1 –1 –1
10 44,193 8,872 3,070 17 55 23 5 1 –2 2 –111 7,907 1,678 10,891 51 11 7 31 –7 3 1 412 9,932 2,418 2,849 73 14 9 5 2 3 –2 –213 19,127 4,063 2,656 64 22 11 2 –3 6 –2 –214 13,021 2,283 16,598 41 14 7 38 2 1 –2 –1
Peak intensity (cps) Pe
Total clay Quartz Plagioclase Calcite Total clay
68 413 190 210 4,22650 1,264 106 264 3,07534 404 140 341 2,36127 333 268 369 1,92628 1,491 38 428 1,71023 870 181 478 1,28015 717 135 777 93517 241 40 927 1,020
7 2,343 431 44 32211 2,578 271 96 60030 449 68 419 2,04238 531 72 111 2,68447 962 121 94 2,98238 789 76 673 2,091
M. UNDERWOOD ET AL.DATA REPORT: XRD NORMALIZATION FACTORS 22
Table T4. Normalization factors for X-ray diffraction analysis of random bulkpowers and oriented clay-sized aggregates.
Random bulk powders
Affected mineral in standard mixture
Total clay Quartz Plagioclase Calcite
Influencing mineral: Total clay 2.0718E–02 –3.6067E–04 2.4613E–04 –1.3475E–03Quartz –3.8644E–05 1.2340E–03 –2.1509E–05 –6.8407E–05Plagioclase 6.6736E–04 –1.2044E–04 2.5357E–03 5.1954E–05Calcite 1.1920E–05 1.9068E–05 1.1882E–04 2.7128E–03
<2 µm fraction
Affected mineral in standard mixture
Smectite Illite Chlorite Quartz
Influencing mineral: Smectite 1.0890E–03 –1.5328E–04 –2.4315E–04 –2.1743E–04Illite 4.5487E–04 2.9373E–03 –3.3780E–04 9.7609E–06Chlorite 1.9984E–05 2.9901E–04 2.2389E–03 2.3975E–04Quartz 6.6121E–03 3.3672E–03 3.5400E–03 1.0007E–02
M. UNDERWOOD ET AL.DATA REPORT: XRD NORMALIZATION FACTORS 23
Table T5. Results of shore-based X-ray diffraction for samples on JOIDES Reso-lution.
Core, section, interval (cm)
Peak area (total counts) Relative mineral abundance (wt%)
Total clay Quartz Plagioclase Calcite Total clay Quartz Plagioclase Calcite
190-1173A-64X-5, 58–59 3,145 18,788 3,336 0 69 22 9 065X-1, 4–5 658 3,441 383 29,030 14 4 4 77
190-1174A-8H-4, 133–134 551 22,479 15,012 0 24 31 45 0
190-1174B-32R-5, 130–131 1,267 17,131 7,317 8,507 34 22 22 2365R-4, 78–80 2,561 18,336 5,080 0 62 23 15 070R-2, 98–99 2,428 18,448 4,988 4,947 55 22 14 986R-2, 117–119 3,254 20,484 4,213 0 67 23 11 0
190-1175A-4H-4, 139–141 1,016 13,814 4,071 2,771 42 29 19 109H-6, 146–147 1,194 13,987 4,431 8,300 36 22 16 2718H-3, 140–142 1,038 12,520 3,612 14,040 28 17 13 4223X-4, 91–92 935 12,341 4,864 11,010 28 19 17 3637X-5, 136–138 1,668 24,008 7,986 2,065 44 31 23 238X-2, 116–118 1,276 25,622 11,863 363 36 32 32 Trace39X-2, 100–102 1,844 22,709 7,265 917 48 30 21 Trace
190-1176A-14H-4, 132–135 1,453 16,861 4,535 7,519 40 24 15 2135X-1, 29–30 729 44,381 6,170 997 20 62 17 Trace
190-1177A-5R-1, 35–36 930 7,226 4,494 887 52 19 27 217R-2, 26–28 3,005 18,906 3,690 0 67 23 10 019R-4, 116–118 2,671 13,622 3,693 1,827 69 19 12 131R-1, 17–19 3,597 17,927 4,187 0 71 19 10 033R-1, 88–90 3,238 21,599 4,935 0 65 23 12 037R-3, 34–36 3,205 18,731 4,545 0 67 21 12 049R-4, 21–22 4,086 10,930 4,463 0 79 10 11 053R-2, 59–60 3,418 16,759 4,656 0 70 18 12 0
190-1178A-3H-4, 133–135 1,296 13,233 7,529 5,573 40 19 25 1611X-4, 124–126 1,746 20,127 6,025 1,669 50 30 19 127X-3, 120–122 2,616 17,933 6,088 768 61 22 17 Trace
190-1178B-8R-6, 67–70 2,516 20,446 5,237 0 60 26 15 0
M. UNDERWOOD ET AL.DATA REPORT: XRD NORMALIZATION FACTORS 24
Table T6. X-ray diffraction data and error analysis for clay-sized standards.
Notes: * = SVD normalization factors. † = Biscaye (1965) weighting factors.
<2 µm size fraction:
Peak area (total counts) Calculated abundance (wt%)* Error (calculated – measured) (%)*
Mix Smectite Illite Chlorite Quartz Smectite Illite Chlorite Quartz Smectite Illite Chlorite Quartz
1 6,904 5,537 7,635 2,740 27 25 22 26 4 –2 2 –42 17,041 8,172 13,570 623 31 32 30 7 –5 1 1 33 24,973 3,839 4,072 2,886 47 18 12 24 –3 1 3 –14 35,314 3,250 11,494 1,291 55 13 23 9 0 0 –1 15 33,861 1,897 2,599 2,834 59 11 7 23 –5 1 1 36 58,195 1,205 7,259 2,176 76 4 9 11 2 0 –2 08 34,985 8,494 24,425 0 38 24 38 0 –4 1 3 09 14,764 15,412 5,823 1,359 31 48 9 12 2 0 –2 0
10 60,065 2,031 11,199 1,490 76 5 15 5 4 –2 –1 –111 4,237 9,622 17,802 692 14 36 39 11 3 –2 –3 112 6,086 4,194 21,143 1,047 16 21 48 14 1 1 –3 1
Clay minerals only:
Relative abundance (wt%)* Error (calculated – measured) (%)* Relative abundance (area%)† Error (calculated – measured) (%)†
Mix Smectite Illite Chlorite Smectite Illite Chlorite Smectite Illite Chlorite Smectite Illite Chlorite
1 36 34 30 4 –5 1 16 50 34 –17 11 62 33 34 32 –4 2 3 22 43 35 –16 10 63 61 23 15 –4 1 4 52 32 17 –14 9 54 60 15 25 1 0 –1 50 18 32 –9 4 65 76 14 9 –4 2 1 73 16 11 –7 4 36 85 4 10 3 0 –3 75 6 19 –7 1 68 38 24 38 –4 1 3 30 29 41 –12 6 69 36 54 10 2 0 –2 17 70 13 –17 16 1
10 79 5 16 3 –2 –1 66 9 25 –10 2 811 16 40 44 4 –1 –3 5 49 45 –7 7 –112 19 25 56 1 2 –3 9 26 65 –8 2 6
M. UNDERWOOD ET AL.DATA REPORT: XRD NORMALIZATION FACTORS 25
Table T7. X-ray diffraction analysis of random bulk powders, DSDP Site 297.
Core, section, interval (cm)
Depth (mbsf)
Peak area (total counts) Relative abundance (wt%)
Total clay Quartz Plagioclase Calcite Total clay Quartz Plagioclase Calcite
31-297-15-2, 113 336.13 4,211 15,564 5,233 0 74 14 12 015-4, 85 338.85 4,131 18,129 4,401 0 73 17 10 016-2, 59 354.59 1,460 51,396 11,897 183 28 48 23 Trace16-2, 130 355.30 1,684 36,802 333 0 43 57 1 016-3, 90 356.30 925 54,087 11,503 0 21 55 24 017-2, 9 392.09 1,426 45,438 17,522 94 29 39 32 Trace17-2, 114 393.14 1,790 31,315 10,713 0 40 34 25 017-3, 10 393.60 1,334 55,437 22,264 0 25 40 34 017-3, 56 394.06 2,329 41,155 12,006 0 41 36 23 017-3, 118 394.68 665 55,708 12,789 0 17 57 26 018-1, 72 429.22 1,157 37,237 13,302 0 29 40 31 018-2, 88 430.88 3,035 21,615 5,043 0 63 24 13 018-2, 115 431.15 3,235 21,645 4,434 406 65 24 11 Trace18-2, 133 431.33 1,199 36,181 12,033 0 30 41 29 019-1, 142 467.92 3,164 21,449 5,485 0 64 23 13 020-1, 121 505.71 2,608 10,551 3,991 0 72 15 13 020-2, 83 506.83 8,740 3,706 7,609 251 89 0 10 Trace20-2, 90 506.90 8,416 5,376 3,292 0 93 2 5 020-2, 112 507.12 3,481 22,341 6,624 0 64 22 15 020-2, 119 507.19 3,088 31,029 12,194 0 52 26 23 020-3, 4 507.54 5,376 13,772 7,235 994 77 10 13 Trace20-3, 14 507.64 4,493 14,541 6,064 205 75 12 13 Trace20-3, 81 508.31 4,491 13,906 4,396 0 78 12 10 020-4, 123 510.23 4,342 15,564 4,348 0 76 14 10 021-3, 4 526.54 4,554 15,370 4,800 48 77 13 10 Trace21-3, 36 526.86 3,936 15,477 4,572 0 74 15 11 021-3, 112 527.62 4,388 15,746 4,193 0 76 14 9 021-3, 125 527.75 4,716 13,635 4,441 0 79 12 10 021-3, 129 527.79 5,014 15,368 5,266 0 78 12 10 022-2, 67 554.17 2,148 20,634 9,895 0 51 24 25 022-2, 110 554.60 2,199 30,275 12,921 0 44 29 27 022-3, 79 555.79 3,952 18,647 4,968 0 71 18 11 022-4, 49 556.99 2,420 26,059 9,709 0 50 27 22 023-3, 76 593.76 5,524 13,629 4,808 0 81 10 9 023-3, 100 594.00 3,902 14,281 5,067 0 74 14 12 023-4, 0 594.50 4,914 17,930 6,588 0 74 14 12 023-4, 43 594.93 4,213 28,729 16,117 189 57 19 24 Trace24-2, 81 620.81 3,283 13,821 3,865 460 73 16 11 Trace24-3, 18 621.68 2,427 15,056 5,598 246 63 20 17 Trace24-3, 86 622.36 3,924 12,475 5,431 0 75 12 13 025-2, 109 649.59 2,001 16,103 6,282 0 57 23 20 025-3, 64 650.64 1,176 3,168 2,006 0 75 10 16 025-3, 121 651.21 1,994 5,717 2,117 0 78 11 11 025-6, 66 655.16 1,388 5,138 2,441 0 72 13 15 026-1, 27 666.27 4,875 9,815 5,765 271 81 7 12 Trace26-1, 45 666.45 2,682 26,352 8,214 0 54 27 19 026-1, 109 667.09 5,214 10,622 7,157 0 79 7 14 026-2, 51 668.01 1,960 1,520 1,552 0 89 2 9 026-2, 61 668.11 2,148 1,735 2,401 0 86 2 12 026-2, 105 668.55 6,372 5,090 6,331 236 87 2 11 Trace26-2, 130 668.80 3,922 14,038 4,565 0 75 14 11 027-1, 20 675.70 4,295 22,605 7,116 0 68 19 14 027-1, 51 676.01 4,877 8,859 2,991 0 86 7 7 027-1, 61 676.11 3,559 19,202 4,530 29 69 20 11 Trace
M. UNDERWOOD ET AL.DATA REPORT: XRD NORMALIZATION FACTORS 26
Table T8. X-ray diffraction analysis on oriented clay-sized fraction (<2 µm) DSDPSite 297. (See table notes. Continued on next two pages.)
Core, section, interval (cm)
Depth (mbsf)
Peak area (total counts) Clay-sized fraction (wt%)*
Smectite Illite Chlorite Quartz Smectite Illite Chlorite Quartz
31-297-15-2, 113 336.13 2,718 2,751 3,548 165 23 39 29 815-4, 85 338.85 3,504 5,581 6,182 199 19 45 29 716-2, 59 354.59 289 12,518 10,544 1,148 15 46 25 1516-2, 130 355.30 233 2,526 899 852 23 35 14 2916-3, 90 356.30 353 987 1,069 394 22 29 22 2717-2, 9 392.09 3,467 8,392 8,518 654 18 43 27 1217-2, 114 393.14 6,535 4,186 2,431 888 34 34 13 1917-3, 10 393.60 500 3,143 3,801 881 19 32 25 2317-3, 56 394.06 6,492 6,758 6,906 990 25 37 23 1517-3, 118 394.68 774 4,097 4,618 1,091 19 33 25 2318-1, 72 429.22 1,124 4,265 3,366 1,187 22 34 20 2518-2, 88 430.88 2,288 8,158 6,464 854 19 44 22 1518-2, 115 431.15 3,917 6,572 7,520 1,172 21 35 25 1818-2, 133 431.33 4,293 3,685 2,193 885 30 34 14 2119-1, 142 467.92 8,814 8,803 5,756 822 29 44 16 1220-1, 121 505.71 25,954 4,145 3,902 761 65 22 7 520-2, 83 506.83 48,871 310 169 0 98 1 1 020-2, 90 506.90 26,460 655 406 0 98 1 1 020-2, 112 507.12 13,662 3,861 2,689 1,022 47 27 10 1620-2, 119 507.19 3,124 1,755 1,397 246 35 36 16 1320-3, 4 507.54 39,580 4,581 3,428 1,302 74 18 2 720-3, 14 507.64 7,108 2,064 1,799 377 47 29 12 1120-3, 81 508.31 6,762 3,805 3,248 206 37 41 18 520-4, 123 510.23 1,850 1,806 1,996 352 26 34 23 1821-3, 4 526.54 2,867 2,525 2,924 253 26 37 25 1121-3, 36 526.86 7,193 2,829 2,714 308 42 34 17 821-3, 112 527.62 24,897 5,553 5,433 696 57 27 11 521-3, 125 527.75 7,030 2,890 2,647 200 43 37 16 521-3, 129 527.79 5,139 1,845 1,909 245 42 31 17 922-2, 67 554.17 3,034 1,640 1,451 251 35 34 17 1322-2, 90 554.40 14,176 4,044 3,143 600 51 30 10 922-2, 110 554.60 6,362 886 618 568 53 18 7 2122-3, 79 555.79 3,506 1,807 1,672 339 35 32 18 1522-4, 49 556.99 6,263 2,589 2,954 367 38 32 20 1123-3, 76 593.76 4,480 2,509 2,033 230 36 39 16 923-3, 100 594.00 3,608 377 207 574 47 15 9 3023-4, 0 594.50 4,363 2,323 2,207 317 35 35 18 1223-4, 43 594.93 32,485 2,266 1,639 1,916 68 12 2 1724-2, 81 620.81 2,843 1,330 817 198 41 35 11 1324-3, 18 621.68 11,855 3,299 1,891 373 57 33 5 624-3, 86 622.36 14,106 2,112 898 145 76 22 1 125-2, 109 649.59 4,054 558 245 295 59 19 4 1925-3, 64 650.64 16,448 2,549 751 953 63 21 0 1525-3, 121 651.21 6,448 1,365 567 591 51 23 6 2125-6, 66 655.16 12,594 1,848 743 987 57 19 4 2026-1, 27 666.27 13,665 3,354 877 118 65 33 1 126-1, 45 666.45 28,698 5,019 2,431 1,124 66 24 1 926-1, 109 667.09 6,920 422 260 0 96 3 1 026-2, 51 668.01 44,882 757 1,099 1,304 93 0 1 626-2, 61 668.11 41,131 409 492 0 98 1 1 026-2, 105 668.55 31,324 1,386 401 481 95 3 1 126-2, 130 668.80 35,873 5,221 764 962 75 21 1 327-1, 20 675.70 2,465 1,859 729 289 35 40 9 1627-1, 51 676.01 13,076 3,633 723 279 63 35 1 127-1, 61 676.11 18,302 5,358 2,971 852 52 31 6 10
M. UNDERWOOD ET AL.DATA REPORT: XRD NORMALIZATION FACTORS 27
Table T8 (continued).
Core, section, interval (cm)
Depth (mbsf)
Clay mineral (wt%)* Clay mineral (area%)†
Smectite Illite Chlorite Smectite Illite Chlorite
31-297-15-2, 113 336.13 25 43 32 13 53 3415-4, 85 338.85 20 48 31 9 58 3216-2, 59 354.59 17 53 29 0 70 3016-2, 130 355.30 32 49 19 2 83 1516-3, 90 356.30 30 40 30 5 61 3317-2, 9 392.09 20 49 31 6 62 3217-2, 114 393.14 42 42 16 23 60 1717-3, 10 393.60 25 42 33 2 61 3717-3, 56 394.06 29 44 27 14 57 2917-3, 118 394.68 25 43 32 3 62 3518-1, 72 429.22 29 45 26 5 68 2718-2, 88 430.88 22 52 26 5 68 2718-2, 115 431.15 26 43 31 9 58 3318-2, 133 431.33 38 44 18 18 63 1919-1, 142 467.92 33 49 18 16 63 2120-1, 121 505.71 69 23 7 52 33 1620-2, 83 506.83 98 1 1 97 2 120-2, 90 506.90 98 1 1 89 9 320-2, 112 507.12 56 32 12 40 45 1620-2, 119 507.19 40 41 18 24 54 2220-3, 4 507.54 79 19 2 61 28 1120-3, 14 507.64 53 33 14 37 44 1920-3, 81 508.31 39 43 19 24 53 2320-4, 123 510.23 31 41 28 14 55 3121-3, 4 526.54 30 42 28 15 54 3121-3, 36 526.86 45 37 18 30 47 2321-3, 112 527.62 60 28 12 43 38 1921-3, 125 527.75 45 39 17 29 48 2221-3, 129 527.79 47 34 19 31 45 2322-2, 67 554.17 41 40 20 24 52 2322-2, 90 554.40 56 33 11 39 44 1722-2, 110 554.60 68 23 9 57 32 1122-3, 79 555.79 41 38 21 25 51 2422-4, 49 556.99 42 36 22 28 46 2623-3, 76 593.76 40 43 18 24 54 2223-3, 100 594.00 66 21 13 65 27 723-4, 0 594.50 40 40 20 24 51 2423-4, 43 594.93 83 15 2 72 20 724-2, 81 620.81 47 40 13 29 54 1724-3, 18 621.68 60 35 5 41 46 1324-3, 86 622.36 77 22 1 58 35 725-2, 109 649.59 72 23 5 60 33 725-3, 64 650.64 75 25 0 58 36 525-3, 121 651.21 64 29 8 49 42 925-6, 66 655.16 71 24 5 59 34 726-1, 27 666.27 66 33 1 47 47 626-1, 45 666.45 73 26 1 54 37 926-1, 109 667.09 96 3 1 76 18 626-2, 51 668.01 99 0 1 90 6 426-2, 61 668.11 98 1 1 94 4 226-2, 105 668.55 96 3 1 83 15 226-2, 130 668.80 77 22 1 62 36 327-1, 20 675.70 42 48 11 22 65 1327-1, 51 676.01 64 35 1 45 50 527-1, 61 676.11 58 35 7 40 47 13
M. UNDERWOOD ET AL.DATA REPORT: XRD NORMALIZATION FACTORS 28
Table T8 (continued).
Notes: * = SVD normalization factors. † = Biscaye (1965) normalization factors.
Core, section, interval (cm)
Depth (mbsf)
Bulk sample (wt%)* Bulk sample (area%)†
Smectite Illite Chlorite Smectite Illite Chlorite
31-297-15-2, 113 336.13 19 32 24 10 39 2515-4, 85 338.85 15 35 23 7 43 2416-2, 59 354.59 5 15 8 0 20 816-2, 130 355.30 14 21 8 1 36 616-3, 90 356.30 6 8 6 1 13 717-2, 9 392.09 6 14 9 2 18 917-2, 114 393.14 17 17 6 9 24 717-3, 10 393.60 6 11 8 1 15 917-3, 56 394.06 12 18 11 6 23 1217-3, 118 394.68 4 7 6 0 11 618-1, 72 429.22 8 13 8 1 20 818-2, 88 430.88 14 33 16 3 43 1718-2, 115 431.15 17 28 20 6 38 2218-2, 133 431.33 12 13 5 5 19 619-1, 142 467.92 21 32 12 10 41 1320-1, 121 505.71 50 17 5 37 24 1120-2, 83 506.83 87 1 1 86 2 120-2, 90 506.90 91 1 1 82 8 320-2, 112 507.12 36 21 8 25 29 1020-2, 119 507.19 21 22 10 13 28 1120-3, 4 507.54 61 15 2 47 22 820-3, 14 507.64 40 25 10 28 33 1420-3, 81 508.31 30 33 15 19 42 1820-4, 123 510.23 24 31 21 11 42 2321-3, 4 526.54 23 32 22 12 41 2421-3, 36 526.86 33 27 14 22 35 1721-3, 112 527.62 46 22 9 33 29 1421-3, 125 527.75 35 30 13 23 38 1821-3, 129 527.79 36 27 15 25 35 1822-2, 67 554.17 21 20 10 12 27 1222-2, 90 554.4022-2, 110 554.60 30 10 4 25 14 522-3, 79 555.79 29 27 15 18 36 1722-4, 49 556.99 21 18 11 14 23 1323-3, 76 593.76 32 35 14 20 44 1823-3, 100 594.00 49 16 9 48 20 623-4, 0 594.50 29 29 15 18 38 1823-4, 43 594.93 47 8 1 41 12 424-2, 81 620.81 34 29 9 21 40 1224-3, 18 621.68 38 22 3 26 29 824-3, 86 622.36 58 17 1 43 26 625-2, 109 649.59 41 13 3 34 19 425-3, 64 650.64 56 19 0 44 27 425-3, 121 651.21 50 22 6 39 33 725-6, 66 655.16 51 17 4 42 25 526-1, 27 666.27 53 27 1 38 38 526-1, 45 666.45 39 14 1 29 20 526-1, 109 667.09 76 2 1 60 15 526-2, 51 668.01 88 0 1 80 5 426-2, 61 668.11 84 1 1 81 3 226-2, 105 668.55 83 3 1 72 13 226-2, 130 668.80 58 16 1 46 27 227-1, 20 675.70 28 32 7 15 45 927-1, 51 676.01 55 30 1 39 43 427-1, 61 676.11 40 24 5 28 32 9