5. bridge geometry (18.0) 6. dynamic/earthquake analysisccfu/ref717/ence717bridgespecial.pdfof the...
TRANSCRIPT

1
ENCE717 – Bridge EngineeringSpecial Topics of Bridges I
Chung C. Fu, Ph.D., P.E.(http: www.best.umd.edu)
Part III – Special Topics of Bridges
1. Strut-and-Tie Model (13.0)
2. Stability (14.0)
3. Redundancy Analysis (15.0)
4. Integral Bridges (16.0)
5. Bridge Geometry (18.0)
6. Dynamic/Earthquake Analysis
Strut-and-Tie (STM) Model (Chapter 13)
B and D Regions in a Common Bridge Structure • B-region: Bernoulli's hypothesis facilitates the flexural design of
reinforced concrete structures by allowing a linear strain distribution for all loading stages, including an ultimate flexural capacity.
• D-region (disturbed or discontinued portion), Bernoulli’s hypothesis does not apply.
Strut-and-Tie (STM) Model
4
(d) behaves almostelasticallyuntil anticipatedfailure load
(c) requires the largestamount of plasticdeformation; thus it is morelikely to collapse beforereaching the failure loadlevel
Figure 13.3 ‐ Non‐linear Finite Element comparison of three possible models of a short cantilever (MacGregor, et al. 2008)Goal: Min. steel content; the least and shortest ties are the best

Strut-and-Tie (STM) Model
5
Figure 13.4 – Strut (a) Orientation of Strut (b) Angle at support (MacGregor, et al. 2008)Best STM: an STM developed with struts parallel to the orientation of initial cracking will behave very well ; minimum angle per ACI is 25°
Strut-and-Tie (STM) Model
6
Strut-and-Tie (STM) Model
Unequal stress at the different faces of the node
1.The resultants of the three forces coincide
2.The stresses are within the limits
3.The stress is constant on any face
7
C
C
C
CCC Node
T
T
TTT Node
TC
CTT Node
T
T
C
CCT Node
C
Figure 13.6 ‐ Classification of nodal zonesFigure 13.7 – Hydrostatic Element (the in-plane stresses in the nodes are equal in all directions)
Figure 13.8 – Nodal zone formed by the extension of the members
Strut-and-Tie (STM) Model
Hammer Head Pier

Strut-and-Tie (STM) Model
Pile Cap
Strut-and-Tie (STM) Model
Pile Cap (2D & 3D)
Strut-and-Tie (STM) Model
Abutment w/Piles
Strut-and-Tie (STM) Model
Abutment
w/Mat Foundation
Strut-and-Tie (STM) Model
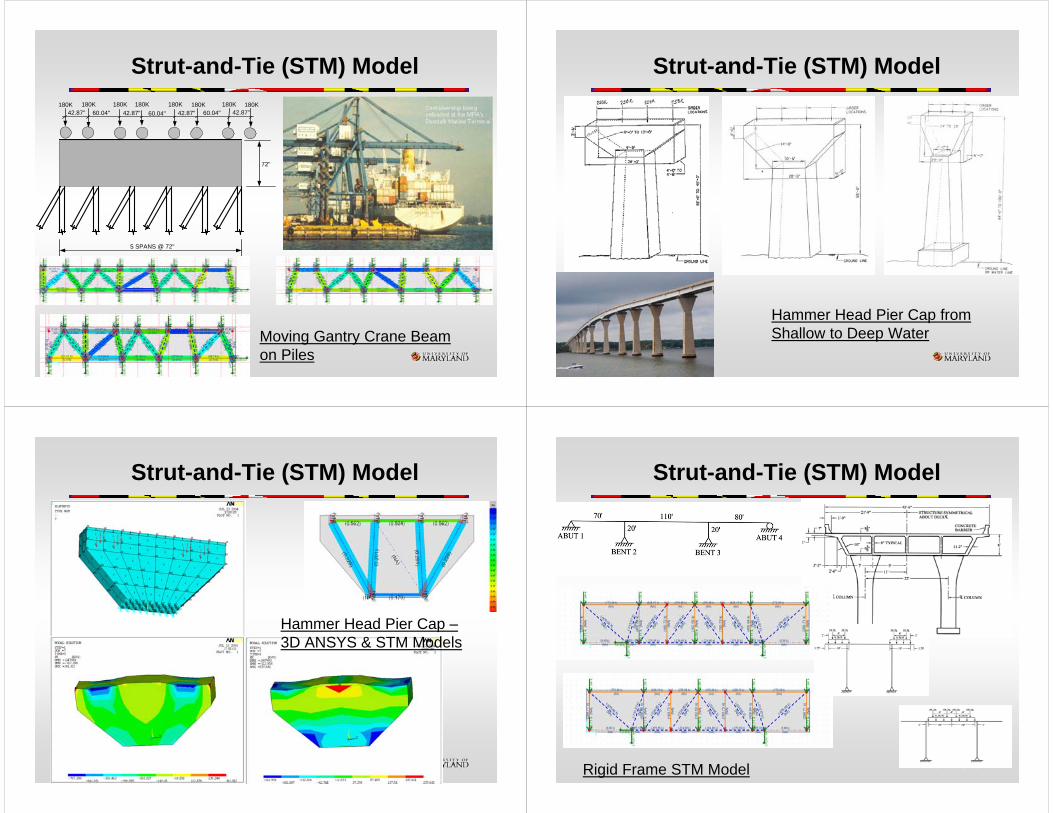
Moving Gantry Crane Beam on Piles
72"
42.87"60.04"
5 SPANS @ 72"
42.87" 60.04" 42.87" 60.04" 42.87"180K180K 180K 180K 180K 180K 180K 180K
Strut-and-Tie (STM) Model
Hammer Head Pier Cap from Shallow to Deep Water
Strut-and-Tie (STM) Model
Hammer Head Pier Cap –3D ANSYS & STM Models
Strut-and-Tie (STM) Model
Rigid Frame STM Model

Strut-and-Tie (STM) ModelNHI-130126 Example 1 – Simply Supported Deep Beam
The 25-degree Limit
Strut-and-Tie (STM) ModelNHI-130126 Example 2 –Cantilever Bent Cap
Strut-and-Tie (STM) ModelNHI-130126 Example 3 – Inverted-T Moment Frame Straddle Bent Cap
Strut-and-Tie (STM) ModelNHI-130126 Example 4 – Drilled Shaft Footing

Structural Stability (Chapter 14)
21large displacement effects)
Structural Stability
22
Structural Stability
23
Structural Stability
24
Two types of buckling:
1.Bifurcation buckling – the primary path is following the original
load-displacement curve the secondary path is the alternative path
from the bifurcation point when the critical load is reached.
If the secondary path has a positive derivative (rises), the structure has post-buckling strength
Structural Stability
25
2. Snap-through buckling. the limit point is not a
bifurcation point because there is no immediate adjacent equilibrium configuration.
When a limit point load is reached under increasing load, snap-through buckling occurs, as the structure assumes a new configuration.
P
Snap-through
Structural Stability
26
Plate Buckling
Figure 14.5 - Buckling stress coefficients for uni-axially compressed plate
Structural Stability
27
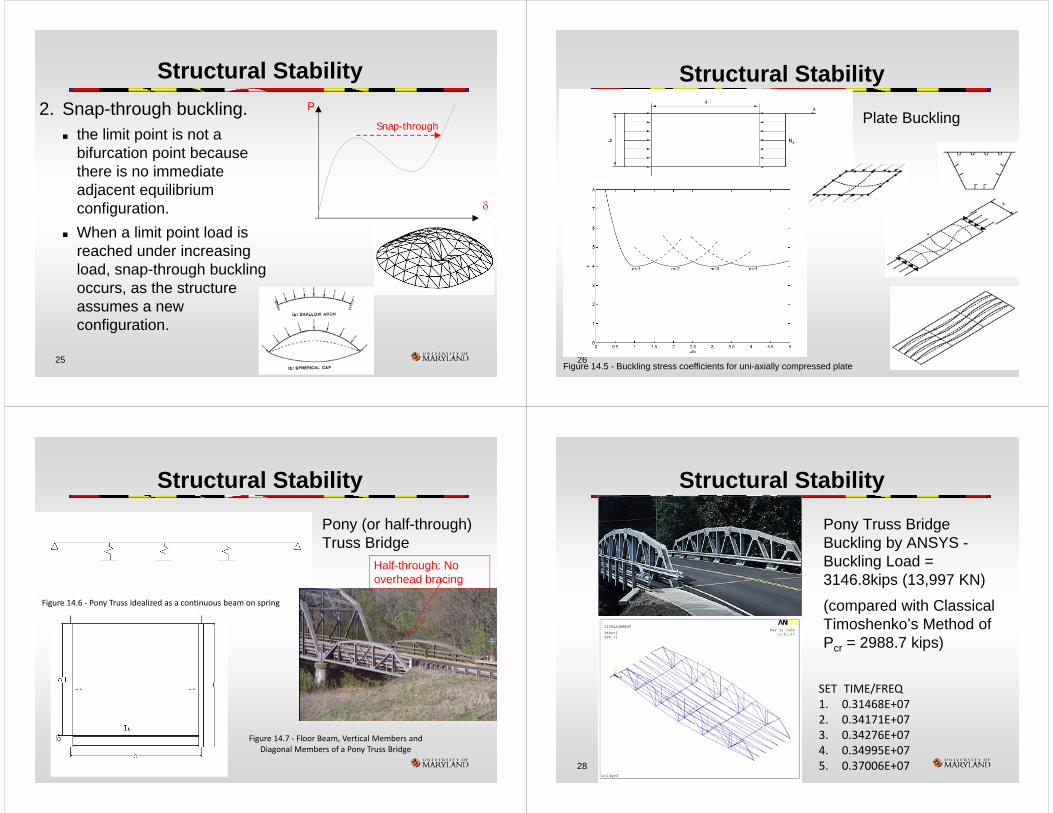
Pony (or half-through) Truss Bridge
Figure 14.6 ‐ Pony Truss idealized as a continuous beam on spring support
Figure 14.7 ‐ Floor Beam, Vertical Members and Diagonal Members of a Pony Truss Bridge
Half-through: No overhead bracing
Structural Stability
28
Pony Truss Bridge Buckling by ANSYS -Buckling Load = 3146.8kips (13,997 KN)
(compared with Classical Timoshenko’s Method of Pcr = 2988.7 kips)
SET TIME/FREQ 1. 0.31468E+07 2. 0.34171E+07 3. 0.34276E+07 4. 0.34995E+07 5. 0.37006E+07

Structural Stability
29
Linear Buckling Analysis of a Standard Simple Arch Rib with a span of 50 meters is fixed at both ends.
Figure 14.12 – The first mode of a simple arch bridge bulking, out‐of‐plane (λ 408.516
Figure 14.13 – The second mode of a simple arch bridge bulking, out‐of‐plane
(λ 1046.208Figure 14.14 – The third mode of a simple arch
bridge buckling, in‐plane (λ 1259.367
Structural Stability
30
Nonlinear Stability Analysis of a Cable-Stayed Bridge
Figure 11.23 ‐Model of a typical steel box girder
Figure 11.26 ‐ Two alternative pylon plans of Sutong Bridge
Figure 11.29 - The elevation of an alternative plan of Sutong Bridge
Structural Stability
31
Loading patterns
Description Critical case
At S0, increase V step by step
To search the live load safety factor without wind interfering at service stage
When the live loads increased up to 40 times of the normal live load, the vertical displacements at the center of the main span abruptly reached 42 meters and the 13 meters at the top of the pylon. The structure, however still maintains some degree of stiffness. No lateral displacement significantly increased.
At S0, increase S step by step
To search the whole structural weight safety factor without wind interference at service stage
At about 3 times of S, the displacements increase abruptly. No lateral displacement significantly increased.
At S1 plus W, increase C step by step
To search the construction load safety factor with wind interference at maximum dual-cantilever stage
When increased to 240 times of C, the displacements increase abruptly. No lateral displacement significantly increased.
At S1, increase W step by step
To search the static wind load safety factor at maximum dual-cantilever stage
Still remains in elastic even at 50 times of W, while the lateral displacement at the end of the girder reaches to 7 meters.
At S2 plus W, increase C step by step
To search the construction load safety factor with wind interfering at maximum single-cantilever stage
At 46 times of C, the vertical displacement at the end of the girder increased to over 100 meters accompanied with 42 meters of lateral displacements (Figure 14.22).
At S2, increase W step by step
To search the static wind load safety factor at maximum single-cantilever stage without the consideration of the
t ti l d
At 48 times of W, the lateral displacement at the end of the girder increased to over 100 meters.
Table 14.2 ‐ Loading patterns and the critical loads in stability analysis
S0: the ideal state at service stage (the structural weight, cable tuning and the superimpose dead load)S1: the state at the maximum dual‐cantilever stage (the structural weight and the cable tuning)S2: the state at the maximum single‐cantilever stage (the structural weight and the cable tuning)S: the whole structure weight plus superimpose dead loadV: the live loads that cause the maximum vertical displacement at the center of the main spanC: a 100‐ton crane at one or two ends of the cantilever and 1‐ton/meter of other construction loadW: the lateral wind load
Structural Stability
32
Nonlinear Stability Analysis of a Cable-Stayed Bridge
0 0 0 0 0 0 2 6 10 12 14 18 30
63
110
0 0
1
1
0
0
0
0 0
0 0 0 0 0 1 6 14 24
35 42
Figure 14.22 ‐ The vertical (top) and the lateral (bottom) displacements (m) of the girder when the construction loads increased to 46 times of the normal construction loads at the maximum single‐cantilever stage