5 1 january-march 2015
TRANSCRIPT


EDITORIAL
Teaching Pedagogy of Management Education Management education has been widely recognized as one of the most important means for development. Although history of
management education dates back to ancient times, modern management education found its formal structure during 1819. Since
then, the content and pedagogy have come under many purposeful modernisation efforts to keep pace with the requirements of
trade, commerce and industry. It is said that the first full-time MBA in India was started way back in 1957, and the two IIMs in
Calcutta and Ahmadabad appeared in 1961 and 62, respectively. Since then the growth of management education in India has been
phenomenal.
In India, the demand for skilled human resources is increasing to meet the competitive heights of business. As a result,
there is a tremendous pressure on the academic field, to develop human resources with employable skills. A close observation into
the present education system reveals that there is a huge gap between the human resources produced by the academia and the human
resources required for the industry. The survey reports of The Confederation of Indian Industry (CII) reveal that 80% of the
postgraduates of management studies (having the average score of 60% in their academics) are not fit for employment (2000-2011).
This infers that the management education in India has failed in developing cognitive aspects of manager and there exists a large
gap between the ‘academic proficiency’ and ‘work proficiency’ of the students. This issue is a major concern in the present
educational system in India. Hence, the transformation or revolution should take place in terms of redesigning the curriculum and
pedagogy in order to enable the students acquire employable and life skills. As a result, pressure is building upon management
education in the country to identify the needs of the industry and to improve the pedagogy in order to bridge the gap between
industry expectations and academic achievement. The teaching pedagogy of management education should aim at aligning the
academic proficiency with the prevailing demands in the industry.
Pedagogy is the method and practice of teaching; art or science or profession of teaching; the principles and methods of
instruction; the act, process, or art of imparting knowledge and skill; especially as an academic subject or theoretical concept. The
term ‘Pedagogy’ can also be used to mean the discipline that deals with the theory and practice of education. It thus concerns the
study and practice of how best to teach. Pedagogy is one of the dimensions of management education. Whatever may be the
pedagogy used, it should increase, enhance or enrich the learning experience of the student.
Management education cannot be compared with studying the academic courses like economics, history, political
science, mathematics etc. It can rather be compared with medicine, where no doctor is allowed near a patient purely on the basis
of theoretical knowledge. In the same way, management students should be trained to take decisions and to monitor results in actual
business scenario. It should also develop the analytical skills of the students and should improve the ability of the student to
understand the complex internal and external factors influencing the organization. That is management education should not aim
at just transferring knowledge but in developing a passionate and diligent management professional.
Till graduation, especially in India, the lecture method is used to a large extent. For almost 15 years students are exposed
to this method. This makes the students passive participants in the learning process. At the same time the faculty is also drawn from
the same background. Hence a new pedagogy should be used to make the students active learners. From the genesis, as a formal
study in the early nineteenth century, the management education has undergone many changes in terms of content, curriculum and
pedagogy, especially in the apex management institutions like IIMs. A variety of teaching and learning techniques are employed
to impart knowledge and skills to the students of Management. Lectures, case analysis, simulation games and exercises, syndicates,
group discussions and practical project work are commonly used to develop conceptual, analytical and decision making skills and
to prepare the students to face the challenges of the complex business and organisational environment.
But in many of the colleges, offering management education, the traditional teaching pedagogy is used, with intermittent
use of technology, to impart education. It is unable to fulfill the learning requirements resulting in low satisfaction level among the
corporates. The management teachers have to come out of traditional school of thought and use the methods suitable to impart
management education. Management education requires research based inputs to know the subject practicalities, well equipped
libraries and online resources. Latest developments in the industry need to be observed and imparted to management students. It
requires investment in areas of research. For imparting management education, a pedagogy, which ensures greater participation by
the student; which provides flexible learning environment, and contextual and choice based learning; which facilitates self-paced
learning, teacher-learner interaction and peer group learning; and which involves real life problem analysis etc. is to be adopted.
In India there are several types of institutions offering management education. Indian Institutes of Management, B-
Schools, IITs, University Departments, Colleges or Institutes of Engineering and Technology, Postgraduate Colleges etc. Though,
lot of research has been done and appropriate pedagogy has been invented / developed there is no uniformity in the teaching
pedagogy used by different institutions offering management education in the country. The teaching pedagogy used in different
institutions depends upon the commitment, perceptions, and awareness on the part of the management, faculty, students and
regulatory authorities. Resource richness, rural and urban background of the institution also influence the teaching pedagogy used
in different colleges / institutions.
Babujee Apparao Punaty
CHIEF EDITOR

Copyright © 2009 by Gokaraju Rangaraju Institute of Engineering & Technology, Hyderabad
Access any latest information about Gokaraju Rangaraju Institute of Engineering & Technology
(GRIET) http://griet.ac.in from our web site : http://mgmt2day.griet.ac.in
The articles covered in this Journal have been peer reviewed. However, the publisher neither
guarantees accuracy of facts nor accepts any liabilities with respect to the articles printed in this
Journal.
Management Today (An International Journal of Management Studies)
Published by
Gokaraju Rangaraju Institute of Engineering and Technology
Bachupally, Kukatpally, Hyderabad - 500 090.

Management Today (An International Journal of Management Studies)
Volume: 5 Number: 1 January-March 2015
Contents
Page
No.
1. HRD in Vizag Steel Plant: An Empirical Study Srinivas Lakkoju and Lakshmi Tirumala, Chimata… … … … … … … … 1-6
2. Influence of Risk Relievers on Dimensions of Perceived
Risk in Car Purchase Sunitha, T., Frank Sunil Justus, T. and Ramesh, M. … … … … … … … … … 7-11
3. A Study of Non-Performing Assets in the Indian Banking
Industry Sipra Debnath and Mihir Dash … … … … … … … … ...… … … … … … … 12-22
4. Bridging Gap between Experience and Theory with
Reference to the Triarchic Model of Education
(Connecting Experience, Logic and Passion in the
Teaching-Learning Process in B-Schools) Umashankar, K. and Ranganatham, G. … … … … … … … … … … … … … 23-27
5. Indian Stock Market and FIIs Investments – A Causality Study Sridhar Ryakala … … … … … … … … … … … … … … … … … … … ... … … … … … … … … 28-32
6. Effectiveness of Creativity and Innovation in Advertising -
An Empirical Analysis towards Changing Market Attitude Tripathy, P. C. and Maharana, K. C. … … … … … … … … … … … … … 33-40
7. Mergers and Acquisitions and Corporate Performance: A
Critical Review Madhumita Dasgupta … … … … … … … … … … … … … … … … … 41-50


1
MANAGEMENT TODAY
-for a better tomorrow An International Journal of Management Studies
home page: www.mgmt2day.griet.ac.in Vol.5, No.1, January-March 2015
HRD in Vizag Steel Plant: An Empirical Study
Srinivas Lakkoju1 and Lakshmi Tirumala, Chimata2
1Associate Professor-HR and 2Postgraduate student (MBA), School of Management Studies, Lakireddy Balireddy College of Engineering
(Autonomous), L. B. Reddy Nagar, Mylavaram-521230, Krishna District, Andhra Pradesh, [email protected] /
A R T I C L E I N F O Article history: Received 13.01.2015 Accepted 31.03.2015 Keywords:
Career planning & development, feedback, performance appraisal, recognition & reward, training & development
A B S T R A C T HRD assumes critical importance for the growth and survival of any organisation. HRD activities
should be uniform across various units or levels within an establishment to ensure equitable
development of its employees and enable them contribute towards organisational goals by coping
with change. In this backdrop, the present study was directed at comparing HRD perceptions held
by managers in select departments of Vizag Steel Plant (VSP). Data were collected as part of a
survey carried out in VSP in relation to the MBA project work of the co-author. The study made a
comparative analysis of HRD activities prevailing in VSP using mean values, their percentage
scores, ANOVA, t-tests and Cohen’s effect sizes. Results show that some of the HRD mechanisms
studied viz. performance appraisal and feedback; recognition and rewards; career planning and
development; and growth opportunities available to employees are significantly varying among the
four departments surveyed. Particularly, in MM and F&A departments, managers perceive
subjective performance appraisals and ineffective recognition and reward practices. Similarly,
career planning and development system is absolutely unsatisfactory and growth opportunities are
inadequate for managers in these two departments. Findings create an impression that the top
management’s focus is less on implementation part which might have created room for subjectivity
in some sections. Management review and its constant follow up may help the organisation
rejuvenate HRD.
Introduction
In this age of frequently changing economic, technological and
industrial environments Human Resource Development (HRD)
assumes critical importance for the growth and survival of any
organisation. HRD programmes assist organisations in preparing their
employees to meet the challenge of competition and contribute
towards organisational goals by coping with ever changing situations.
HRD plays the role of a catalyst through its integrated sub-systems to
manage organisational change (Nair, 1988 and Jain 1991).
According to Rao, T.V., HRD is a process by which employees of
an organisation are helped in a continuous and planned way to;
i. acquire or sharpen capabilities required to perform various
functions associated with their present or expected future
roles;
ii. develop their capabilities as individuals and discover and
exploit their inner potentials for their own and/or
organisational development purposes; and
iii. develop an organisational culture in which superior-
subordinate relationships, teamwork and collaboration
-----------------------------------------------------------------------------------------------------
Responsibility of Contents of this paper rests upon the authors and
not upon GRIET publications
ISSN: 2348-3989 (Online)
ISSN: 2230-9764 (Print)
Doi: http://dx.doi.org/10.11127/gmt.2015.03.01
pp.1-6
Copyright@GRIET Publications. All rights reserved.

HRD in Vizag Steel Plant: An Empirical Study
2
among sub-units are strong and contribute to the professional
wellbeing, motivation and pride of employees.
Organisations use various mechanisms to realise HRD. These
include: performance appraisal, potential appraisal, career
management, training and development, feedback, performance
counseling, quality circles, recognition and rewards, job rotation, etc.
These should be uniform across different units or departments in any
system to ensure equitable growth of all its employees as their efforts
must be pointed towards achieving common organisational objectives.
Through HRD mechanisms an organisation’s culture can be changed
by giving emphasis on employee relations and interdepartmental
communication (Advani, 1989).
Literature Review
Rao and Abraham (1986) through their study of HRD mechanisms
in fifty-three Indian organisations suggested that HRD functions need
to be developed a lot to ensure organisational effectiveness. Gupta
(1988) pointed out that HRD functions often remaining at the corporate
office are not percolating down to the field level. Shah, Saiyadain and
Sheth (1984) opined that managers have to translate corporate policies
into constructive practice at the grass-root level. Abraham (1988) in
his paper commented that there was a wide gap between the belief of
the top management and their practice with regard to HRD. Virmani
(1991) in his paper expressed that the HRD strategy has to be linked to
the investment policies, fiscal policies, monetary policies and even
wage and price policies. Rao and Rath (1992) felt that the success of
any HRD mechanism depends upon how effectively one implements
its ‘process’.
The review of current literature about HRD creates an impression
that in various industries HRD practices are not being implemented in
their true spirit. This screams for a fresh study, to comprehend the
status of HRD in the turbulent economic conditions prevailing all over.
The present study seeks to fill this research gap as it examines the
position of HRD in Vizag Steel Plant which is a Navaratna PSE,
playing a vital role in the Indian economy.
HRD Philosophy of Vizag Steel Plant
Vizag Steel Plant bestows HRD a strategic priority among the functions like production, maintenance, materials and finance. It believes that:
i. Its employees are the greatest and most valuable resources, hence they should be treated with all respect.
ii. HRD should appropriately harness employees’ potential for the attainment of the company’s objectives.
iii. HRD does not refer to training alone. It refers to creative and innovative initiatives in several management functions for the development and growth of employees.
iv. HRD should eventually be a core philosophy of all management actions and should not remain merely a departmental or sectional activity.
v. all functional and divisional heads responsible for various activities of the company will imbibe HRD spirit and suitably integrate HRD into their plans, decisions and actions.
Objectives of the Study
vi. To compare HRD perceptions held by the managerial
personnel in select departments in Vizag Steel Plant (VSP);
and
vii. To discuss about the implications of the results.
Methodology of the Study
i. Sample
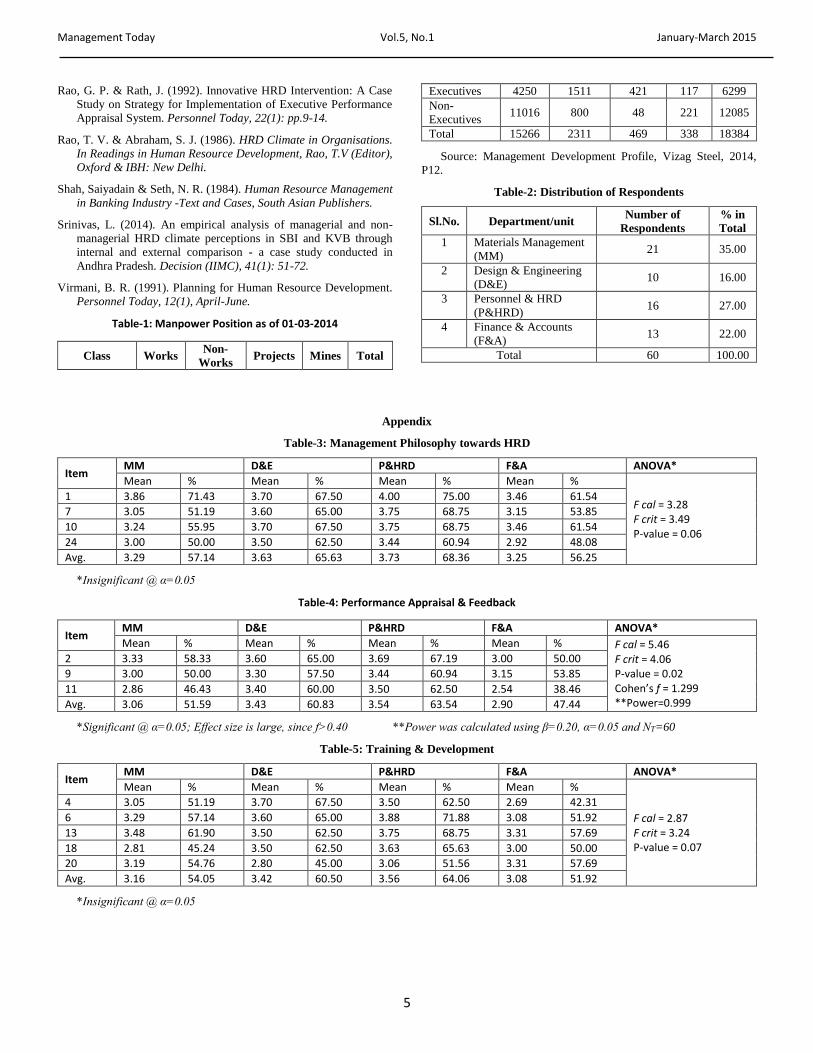
Table 1 shows the present manpower position of VSP, which includes 35% of executives and 65% of non-executives. Actual sample for the present study consists of 60 managers drawn randomly from the executive population of four ‘non-works’ departments. The majority of the responses was obtained from MM department followed by P&HRD department (table 2).
Data Collection and Analysis
Data were gathered as part of the MBA project work carried out
by the co-author during August-September 2014 in VSP. A
questionnaire developed by the authors was administered randomly
among the sample respondents which contained 25 items. It focuses on
six dimensions viz. HRD philosophy of the management; performance
appraisal and feedback; recognition and reward; training and
development; career planning and development; and growth
opportunities. The instrument uses Likert’s five-point scale ranging
from, Strongly Agree-5 to Strongly Disagree-1. Cronbach’s alpha
coefficient of internal consistency for the scale has been calculated to
0.961, showing its high degree of reliability. George and Mallery
(2003, p231) provide a thumb rule, i.e. “≥0.9-excellent; ≥0.8-good;
≥0.7-acceptable; ≥0.6-questionable; ≥0.5-poor; and ≤0.5-
unacceptable”.
For the purpose of analysis, initially, statement-wise mean values
of the responses were calculated for each department. Then, for
making a comparative analysis of HRD activities, ANOVA and t-tests
have been employed. Further, these tests were accompanied by
Cohen’s effect sizes (f-for one-way ANOVA and d-for t-tests) to draw
inferences about the validity of the differences identified (Lenhard &
Lenhard, 2014). Also, the statistical power of hypotheses and post hoc
tests was calculated (Faul et al., 2007) to comprehend the magnitude
of power achieved. Subsequent interpretations were based on the
percentage scores computed from the mean values, using T.V. Rao’s
formula ‘Percentage Score= (Mean value–1) x25’. Final conclusions
were based on the following five-levels of assumptions (Srinivas,
2014):
Percentage Score Assumption
50.00 ‘Unsatisfactory’
>50.00 but 60.00 ‘Less Moderate’
>60.00 but 70.00 ‘Moderate’ or ‘Average’
>70.00 but 80.00 ‘Good’ >80.00 ‘Excellent’
Hypotheses
The present study formulates six multivariate null hypotheses
analysed individually. It is assumed that there is no significant
difference among the four departments at RINL-VSP concerning
management philosophy towards HRD (H10); performance appraisal
and feedback (H20); training and development (H30); recognition and
rewards (H40); career planning and development (H50); and growth
opportunities available to employees (H60). To statistically test these
hypotheses, the study adopts ‘ANOVA: single factor’ technique.

Management Today Vol.5, No.1 January-March 2015
3
Hypotheses Testing
ANOVA results in tables 4, 6, 7 and 8 show significant differences among the four departments regarding HRD mechanisms viz. performance appraisal and feedback, recognition and rewards, career planning and development and employees’ growth opportunities.
Further, the calculated Cohen’s (1988) effect sizes f (0.10, 0.25 and
0.40 represent small, medium and large effect sizes, respectively) with
respect of significant ANOVA, show that the differences are also
meaningful. Therefore, the null hypotheses formulated earlier in this
study, i.e. H20, H40, H50 and H60 are rejected and alternatively it is
concluded that the four HRD mechanisms among the four departments
surveyed are inconsistent. Alphonsa (2000) also had similar findings.
She observed, HRD climate perceptions of supervisors belonging to
different departments in a private hospital were significantly varying.
However, in respect of management attitude towards HRD (H10) and
training and development activities (H30) ANOVA results in tables 3
and 5 present insufficient evidence as to the existence of differences
between departments. Regarding H20, H40, H50 and H60 ANOVA
being significant necessitates post hoc analysis.
Post hoc Comparisons and Discussion
Table 9 contains data pertaining to department-wise comparisons
of HRD mechanisms for their significant differences. Regarding
performance appraisal and feedback mechanisms, perceptions of
managers between MM-P&HRD departments are significantly
differing (tstat5.57>tcrit4.30, P0.03<α0.05). Moreover, the computed
Cohen’s large effect size (d=1.761) shows this difference as
meaningful. Cohen (1992) suggested that the effect sizes of 0.20 are
small, 0.50 are medium, and 0.80 are large. Depending on the results
of his simulation study, de Winter (2013) commented that there are no
objections to using a t-test with extremely small samples, as long as
the effect size is large. Although, the difference between D&E-
P&HRD departments is significant (tstat7.21>tcrit4.30, P0.02<α0.05), it
seems to be moderately meaningful as the effect size worked out is
medium (d=0.589). Thus, significant ANOVA, which lead to the
rejection of H20, is due to the difference really existing between MM-
P&HRD departments. It can be observed from the data in table 4 that
in MM department, superiors are almost reluctant to give a meaningful
and constructive feedback to their subordinate managers on their
performance deficiencies (item 9=50.00). This may tend to inhibit the
performance of managers. The data also reveal that the performance
evaluation system is highly subjective in this department (item
11=46.43). Perhaps, performance standards are lacking here. Superiors
might be excessively highlighting their personal impressions and
showing discrimination among their subordinates. If the organisation
lacks objective performance standards, it is difficult to verify the
validity of (subjective) evaluations by superiors. To promote
objectivity in the evaluation procedure, management can afford to
receive feedback from multiple sources which minimises the
subjective element in superior’s evaluations.
Further, regarding recognition and reward system the study
identifies significant and meaningful differences (table 9) between
departments MM-D&E (tstat6.23>tcrit4.60, P0.00<α0.01, d=2.841) and
MM-P&HRD (tstat5.26>tcrit4.60, P0.01=α0.01, d=2.90). Thus,
rejection of H40 based on ANOVA remains highly valid. The data in
table 6 indicate that in MM department the system of recognising and
rewarding the contributions and abilities of employees is biased (item
3=41.67). Consequently, managers in this department believe that
there is no practice of rewarding any good work done by them (item
14=45.24). They also feel, the extent of recognition for talent (item
21=51.19) and encouragement for creativity (item 22=53.57) is less
moderate. Further, rewards are ill-timed and also not of the right
magnitude (item 25=39.29). Overall, the recognition and reward
system is completely discouraging for managers in this department
(Average=46.19). Perhaps, their valuable efforts and contributions
might be ignored, which might have paved way towards this sort of
discouragement. Hence, management should ensure in place, an
objective, far-reaching and transparent system of recognition and
reward to positively reinforce and nourish the efforts and contributions
of human resources which will guarantee excellence in their
performances.
Next, regarding career planning and development also the study
recognises significant and meaningful differences (table 9) between
the departments MM-P&HRD (tstat5.88>tcrit5.84, P0.01=α0.01,
d=4.574), D&E-F&A (tstat6.07>tcrit5.84, P0.01=α0.01, d=3.980) and
P&HRD-F&A (tstat5.91>tcrit5.84, P0.01=α0.01, d=4.927). Hence,
rejection of H50 based on ANOVA remains extremely consistent. The
data in table 7 clearly indicate that the percentage scores obtained in
respect of all statements in MM and F&A departments are absolutely
unsatisfactory i.e. <50.00. It is evident that in these two departments,
employees are not provided opportunities to develop their capabilities
(item 5). Similarly, superiors are not supportive to their subordinates
to upgrade their qualifications and thereby prepare them for promotion
tests (item 8). Further, managerial careers are not being well planned
and developed (item 16). Management makes no attempt to identify
and utilise managerial potential (item 19). Hence, it can be inferred
that in these two departments, managers are lacking opportunities to
learn new skills and prepare for future assignments. Managers usually
have high level career aspirations and expect their management to
provide the required support and resources in realising these. Indeed,
an organisation’s success or failure depends mostly on its ability to
meet the expectations of its employees.
As regards, growth opportunities available for employees the study
notices significant and meaningful differences (table 9) between
departments MM-P&HRD (tstat3.20>tcrit3.18, P0.05=α0.05, d=2.458)
and P&HRD-F&A (tstat4.58>tcrit3.18, P0.02<α0.05, d=2.529). Thus,
rejection of H60 based on ANOVA remains logical. However, the
significant difference between D&E-P&HRD departments
(tstat5.09>tcrit3.18, P0.01<α0.05) seems to be moderately expressive as
the effect size worked out is medium (d=5.09). Data in table 8 make it
clear that in MM department managers are lacking enough
opportunities for advancement (item 15=47.62). They perceive that
growth opportunities are not equally available to all employees
(item17=44.05). Managers in F&A department also articulate similar
opinion (item17=46.15). Further, growth and development
opportunities are scant in both MM and F&A departments (item
23=48.81 and 51.92). Particularly, managers in F&A department
comment that the promotional policy of the organisation is not fair
(item 12=48.08). Delay in promotions may cause serious problems as
it tends to decrease commitment and productivity levels of the
personnel. Government employees may have job security, but their
families also grow and tend to increase the cost of living. VSP can
follow merit cum seniority principle, while awarding promotions. In
case, managers reach high levels in the organisational ladder where
promotions are unlikely, seniority pay and performance based
incentives may still work as alternative strategies to ensure their
continued support in accomplishing goals.
Conclusion
HRD is the proactive role of HRM and also believed to be for the
organisation as a whole, and not just for some few levels or personnel
(Prasannasai, 1993). Vizag Steel Plant also believes that HRD should
eventually be a core philosophy of all management actions and should

HRD in Vizag Steel Plant: An Empirical Study
4
not remain merely a departmental activity. Relatively, in D&E and
P&HRD departments, HRD is under implementation as per the
intentions of the organisation. But, in MM and F&A departments HRD
is not engrossed in its true character and spirit. The organisation
expects that all functional and divisional heads shall imbibe HRD spirit
and suitably integrate HRD into their plans, decisions and actions. This
approach, however, is missing in MM and F&A departments.
Performance appraisals, recognition and rewards, career planning and
development and growth opportunities are not well implemented in
these two departments. Indeed, the top management deserves
appreciation for having faith in HRD philosophy and implementing
various HRD activities throughout the organisation to realise its HRD
policy and philosophy. What's lacking may be their effective
implementation and constant follow up. This might have given room
for their inefficient use. Hence, the organisation needs an on-going
management review of HRD. HRD audits and surveys help the
management assess the effectiveness of various HRD programmes or
practices and ensure their objective implementation. The surveys may
entail a comparison of HRD between works and non-works
departments.
(The authors would like to thank Shri O. Ram Mohan Rao,
Assistant General Manager (Management Development), RINL-VSP
and the respondents for their support with this project)
Appendix: Questionnaire
Item
No. Statement*
1 Your management believes that HRD activities contribute
to business effectiveness.
2 Your management uses the system of performance
appraisal as a tool for providing feedback to employees.
3 Your management fairly recognises and rewards the
contributions and abilities of employees.
4 Your management conducts assessment of training needs
frequently.
5 Employees are provided opportunities to develop their
capabilities.
6 In this organisation, training makes you more competent
and resourceful.
7 Your management recognises employees and makes them
feel important by giving higher level responsibilities.
8 Your superiors encourage you to improve your
qualifications and prepare you for promotion tests.
9 Your superiors give feedback on your deficiencies
without hurting your ego.
10 Your management appreciates good performance and
achievements of employees.
11 The system of appraising employees is based on objective
assessment and not on favouritism.
12 The promotion policy of your organisation is fair and
rational.
13 Your management arranges for adequate training
facilities.
14 In your organisation, there is a mechanism to reward any
good work done by any employee.
15 Employees in your organisation have enough
opportunities for advancement.
16 Your management plans on a regular basis for your career
development.
17 Growth opportunities are open to every employee in your
organisation.
18 Senior officers take an active interest in juniors and help
them learn their job.
19 The top management makes efforts to identify and utilise
potential of the employees.
20 Job-rotation is frequent in your organisation.
21 Employees are recognised for their talent and work
performance.
22 Creative ideas are always encouraged and rewarded.
23 Growth and development opportunities are at high degree.
24 Management considers development as an important
dimension.
25 The rewards are always timely and of the right magnitude.
*Strongly Agree - 5, Agree - 4, Neutral - 3, Disagree - 2, Strongly
Disagree - 1
References
Abraham, E. (1988). HRD Climate in Banks, in Human Resource
Development in Banks. Khandelwal A.K. (Ed) Oxford and IBH:
New Delhi.
Advani, H. B. (1989). HRD Interventions at Blue Star Ltd. towards
Organisational Effectiveness through HRD. HRD Network, XLRI,
Jamshedpur, pp. 349-361.
Alphonsa, V. K., Sr. (2000). HRD Climate in a Private Hospital in
Hyderabad-An Empirical Study. IJTD, Vol. XXX (4), Oct-Dec.
Cohen, J. (1988). Statistical power analysis for the behavioral sciences
(2nd edn). Hillsdale, New Jersey: Lawrence Erlbaum Associates.
Cohen, J. (1992). A power primer. Psychological Bulletin, 112(1):
155–159.
de Winter, J. C. F. (2013). Using the Student’s t-test with extremely
small sample sizes. Practical Assessment, Research & Evaluation,
18(10). http://pareonline.net/getvn.asp?v=18&n=10.
Faul, F., Erdfelder, E., Lang, A. G., & Buchner, A. (2007). G*Power
3: A flexible statistical power analysis program for the social,
behavioral, and biomedical sciences. Behavior Research Methods,
39, 175-191.
George, D. & Mallery, P. (2003). SPSS for windows step by step: A
simple guide and reference. 11.0 updates (4th Ed.). Boston: Allyn
& Bacon.
Gupta, A. (1988). HRD in R&D Organisations. in Alternative
Approaches and Strategies of HRD. Rao, T.V., Verma, K. K.,
Khandelwal, A. K., Abraham, E. (Eds.), Jaipur: Rawat
Publications. pp.54-61.
Jain, S. R. (1991). Managing Technological Transformation: SAIL’s
Experience. Management of Change through HRD. Pp.189-203.
Lenhard, W. & Lenhard, A. (2014). Calculation of Effect Sizes.
Available: http://www.psychometrica.de/effect_size.html.
Bibergau (Germany): Psychometrica.
Nair, M. R. R. (1988). Major HRD Initiatives in SAIL, op. cit. pp.210-
226.
Prasannasai, K. (1993). The Emerging Role of HRD. Indian Journal
of Training and Development, 22(2), April-June.
Management Today Vol.5, No.1 January-March 2015
5
Rao, G. P. & Rath, J. (1992). Innovative HRD Intervention: A Case
Study on Strategy for Implementation of Executive Performance
Appraisal System. Personnel Today, 22(1): pp.9-14.
Rao, T. V. & Abraham, S. J. (1986). HRD Climate in Organisations.
In Readings in Human Resource Development, Rao, T.V (Editor),
Oxford & IBH: New Delhi.
Shah, Saiyadain & Seth, N. R. (1984). Human Resource Management
in Banking Industry -Text and Cases, South Asian Publishers.
Srinivas, L. (2014). An empirical analysis of managerial and non-
managerial HRD climate perceptions in SBI and KVB through
internal and external comparison - a case study conducted in
Andhra Pradesh. Decision (IIMC), 41(1): 51-72.
Virmani, B. R. (1991). Planning for Human Resource Development.
Personnel Today, 12(1), April-June.
Table-1: Manpower Position as of 01-03-2014
Class Works Non-
Works Projects Mines Total
Executives 4250 1511 421 117 6299
Non-
Executives 11016 800 48 221 12085
Total 15266 2311 469 338 18384
Source: Management Development Profile, Vizag Steel, 2014,
P12.
Table-2: Distribution of Respondents
Sl.No. Department/unit Number of
Respondents
% in
Total
1 Materials Management
(MM) 21 35.00
2 Design & Engineering
(D&E) 10 16.00
3 Personnel & HRD
(P&HRD) 16 27.00
4 Finance & Accounts
(F&A) 13 22.00
Total 60 100.00
Appendix
Table-3: Management Philosophy towards HRD
Item MM D&E P&HRD F&A ANOVA*
Mean % Mean % Mean % Mean %
F cal = 3.28 F crit = 3.49 P-value = 0.06
1 3.86 71.43 3.70 67.50 4.00 75.00 3.46 61.54
7 3.05 51.19 3.60 65.00 3.75 68.75 3.15 53.85
10 3.24 55.95 3.70 67.50 3.75 68.75 3.46 61.54
24 3.00 50.00 3.50 62.50 3.44 60.94 2.92 48.08
Avg. 3.29 57.14 3.63 65.63 3.73 68.36 3.25 56.25
*Insignificant @ α=0.05
Table-4: Performance Appraisal & Feedback
Item MM D&E P&HRD F&A ANOVA*
Mean % Mean % Mean % Mean % F cal = 5.46 F crit = 4.06 P-value = 0.02 Cohen’s f = 1.299 **Power=0.999
2 3.33 58.33 3.60 65.00 3.69 67.19 3.00 50.00
9 3.00 50.00 3.30 57.50 3.44 60.94 3.15 53.85
11 2.86 46.43 3.40 60.00 3.50 62.50 2.54 38.46
Avg. 3.06 51.59 3.43 60.83 3.54 63.54 2.90 47.44
*Significant @ α=0.05; Effect size is large, since f>0.40 **Power was calculated using β=0.20, α=0.05 and NT=60
Table-5: Training & Development
Item MM D&E P&HRD F&A ANOVA*
Mean % Mean % Mean % Mean %
F cal = 2.87 F crit = 3.24 P-value = 0.07
4 3.05 51.19 3.70 67.50 3.50 62.50 2.69 42.31
6 3.29 57.14 3.60 65.00 3.88 71.88 3.08 51.92
13 3.48 61.90 3.50 62.50 3.75 68.75 3.31 57.69
18 2.81 45.24 3.50 62.50 3.63 65.63 3.00 50.00
20 3.19 54.76 2.80 45.00 3.06 51.56 3.31 57.69
Avg. 3.16 54.05 3.42 60.50 3.56 64.06 3.08 51.92
*Insignificant @ α=0.05

HRD in Vizag Steel Plant: An Empirical Study
6
Table 6: Recognition & Reward
Item MM D&E P&HRD F&A ANOVA*
Mean % Mean % Mean % Mean %
F cal = 8.96 F crit = 5.29 P-value = 0.00 Cohen’s f = 1.296 **Power=0.999
3 2.67 41.67 3.60 65.00 3.63 65.63 2.77 44.23
14 2.81 45.24 4.10 77.50 4.06 76.56 3.46 61.54
21 3.05 51.19 3.50 62.50 3.63 65.63 3.31 57.69
22 3.14 53.57 4.00 75.00 3.56 64.06 3.46 61.54
25 2.57 39.29 3.30 57.50 3.25 56.25 3.00 50.00
Avg. 2.85 46.19 3.70 67.50 3.63 65.63 3.20 55.00
*Significant @ α=0.01; Effect size is large, since f>0.40
**Power was calculated using β=0.20, α=0.01 and NT=60
Table-7: Career Planning & Development
Item MM D&E P&HRD F&A ANOVA*
Mean % Mean % Mean % Mean % F cal = 24.83 F crit = 5.95 P-value = 0.00 Cohen’s f = 1.075 **Power=0.999
5 2.90 47.62 3.50 62.50 3.63 65.63 2.85 46.15
8 2.86 46.43 3.30 57.50 3.25 56.25 2.92 48.08
16 2.62 40.48 3.60 65.00 3.56 64.06 2.77 44.23
19 2.81 45.24 3.20 55.00 3.44 60.94 2.69 42.31
Avg. 2.80 44.94 3.40 60.00 3.47 61.72 2.81 45.19
*Significant @ α=0.01; Effect size is large, since f>0.40 **Power was calculated using β=0.20, α=0.01 and NT=60
Table-8: Growth Opportunities
Item MM D&E P&HRD F&A ANOVA*
Mean % Mean % Mean % Mean % F cal = 4.68 F crit = 3.49 P-value = 0.02 Cohen’s f = 1.190 **Power=0.999
12 3.43 60.71 3.20 55.00 3.56 64.06 2.92 48.08
15 2.90 47.62 3.60 65.00 3.75 68.75 3.38 59.62
17 2.76 44.05 3.40 60.00 3.63 65.63 2.85 46.15
23 2.95 48.81 3.00 50.00 3.38 59.38 3.08 51.92
Avg. 3.01 50.30 3.30 57.50 3.58 64.45 3.06 51.44
*Significant @ α=0.05; Effect size is large, since f>0.40
**Power was calculated using β=0.20, α=0.05 and NT=60
Table-9: Post Hoc Comparisons of HRD Activities between Departments
Dimension MM-D&E
(NT=31)
MM-P&HRD
(NT=37)
MM-F&A
(NT=34)
D&E-P&HRD
(NT=26)
D&E-F&A
(NT=23)
P&HRD-F&A
(NT=29)
Performance Appraisal & Feedback
(α=0.05; tcrit=4.30)
tstat=4.24
P=0.05
tstat=5.57
P=0.03*
d=1.761
Power=1.00
tstat=1.03
P=0.41
tstat=7.21
P=0.02*
d=0.589
Power=0.68
tstat=2.56
P=0.12
tstat=3.27
P=0.08
Recognition & Reward
(α=0.01; tcrit=4.60)
tstat=6.23
P=0.00**
d=2.841
Power=1.00
tstat=5.26
P=0.01**
d=2.90
Power=1.00
tstat=3.84
P=0.02
tstat=0.78
P=0.48
tstat=4.34
P=0.01
tstat=3.15
P=0.03
Career Planning & Development
(α=0.01; tcrit=5.84)
tstat=4.51
P=0.02
tstat=5.88
P=0.01**
d=4.574
Power=1.00
tstat=0.16
P=0.88
tstat=0.99
P=0.39
tstat=6.07
P=0.01**
d=3.980
Power=1.00
tstat=5.91
P=0.01**
d=4.927
Power=1.00
Growth Opportunities
(α=0.05; tcrit=3.18)
tstat=1.27
P=0.29
tstat=3.20
P=0.05*
d=2.458
Power=1.00
tstat=0.22
P=0.84
tstat=5.09
P=0.01*
d=0.509
Power=0.49
tstat=1.87
P=0.16
tstat=4.58
P=0.02*
d=2.529
Power=1.00
All t values are two-tail; *Significant at α=0.05; **Significant at α=0.01; d=effect size.
NT=Total Sample Size from two departments; Power was calculated using P, d and NT

7
---------------------------------------------------------------------------------------------------
Responsibility of Contents of this paper rests upon the authors and
not upon GRIET publications
ISSN: 2348-3989 (Online)
ISSN: 2230-9764 (Print)
Doi: http://dx.doi.org/10.11127/gmt.2015.03.02
pp.7-11
Copyright@GRIET Publications. All rights reserved.
MANAGEMENT TODAY
-for a better tomorrow An International Journal of Management Studies
home page: www.mgmt2day.griet.ac.in Vol.5, No.1, January-March 2015
Influence of Risk Relievers on Dimensions of Perceived Risk in Car
Purchase
Sunitha, T.1, Frank Sunil Justus, T2. and Ramesh, M.3
1Assistant Professor, 2Assistant professor, 3Professor, Department of Business Administration, Annamalai University, India,
[email protected] / [email protected] / [email protected]
A R T I C L E I N F O Article history: Received 20.01.2015 Accepted 31.03.2015 Keywords: influence of risk relievers, perceived risk
in car purchase
A B S T R A C T
Perceived risk is the uncertainty that is created in the minds when they doubt the success of their
purchase or when they are unable to decide as to which brand or model to choose out of the
multiple options on offer before them. Perceived risk was classified into nine components namely
physical risk, psychological risk, functional risk, social risk, financial risk, time risk, decision
risk, obsolescence risk and facility risk. Risk reducers are strategies that are used by consumers in
order to bring the risk to a certain level below which they feel comfortable to take a decision. In
this paper seventeen risk relievers has been identified. The influence of risk reliever s on the
specific component of risk is identified. This study will help manufacturers to identify risk
reliever s which they can promote in their own subtle way so as to overcome the perceived risk
barrier in customers. Future studies can incorporate new risk relievers that have not been
considered for this study and this study can be extended to other geographical areas.
Introduction Perceived risk usually plays an important role in the purchase
decision making process, regardless of the nature of the purchase
occasion (planned versus impulse). Every purchase contains some
degree of risk. Perceived risk is the uncertainty that is created in the
minds when they doubt the success of their purchase or when they are
unable to decide as to which brand or model to choose out of the
multiple options on offer before them. Bauer (1960) was the first to
bring up the idea of perceived risk and observed that consumers
perceive uncertainty in contemplating a particular purchase intention.
The outcome may make consumers unhappy and regretful. The study
considers that consumers’ behavior is risk taking. Buying a car is not
a regular purchase activity that is characterized by repeat purchases.
The car market in India has evolved only in the last ten years with
many new manufacturers having entered the Indian market and with
people slowly upgrading from two wheelers towards car. Still as
Joseph (2011) explained, India continues to have one of the lowest
car density (estimated at 13 cars per 1000 people), when compared to
China (45), Brazil (160) and Indonesia (42). This is an ideal situation
for car manufacturers across the world to take a pie of the Indian car
market which is possible only if they can address the perceived risk
associated with the car purchase process.
Dholakia (1997) identified that perceived risk is a function of
three dimensions: (1) the probability that the innovation will not
perform as desired; (2) the consequence of it not performing as
desired; and (3) the ability to reverse and the cost of reversing, any
negative consequences. There are basically two methods of reducing
perceived risk. The consumer can reduce uncertainty by increasing
certainty. This is done by seeking additional information. The
consumer can reduce the consequences by reducing the amount at
stake, which he can do by lowering his performance and purchase
goals.

Influence of Risk Relievers on Dimensions of Perceived Risk in Car Purchase
8
Perceived risk in this study has been classified into nine
components namely physical risk, psychological risk, functional risk,
social risk, financial risk, time risk, decision risk, obsolescence risk
and facility risk. These components are explained as follows
Table-01: Risk and Reviews
Dimensions of
perceived risk
Definition Reference
Functional
Risk
Risk that the
product will not
perform as
expected
Cunningham [1967],
Roselius [1971],
Jacoby and Kaplan
[1972], Peter and Ryan
[1976], Stone and
Gronhaug [1993
Physical Risk Risk that the
product will be
dangerous or
harmful to the
consumer
Jacoby and Kaplan
[1972], Peter and Ryan
[1976], Stone and
Gronhaug [1993],
Cunningham [1967]
Financial Risk Risk that the
product will not be
worth the money
the customer pays
Cunningham [1967],
Jacoby and Kaplan
[1972], Peter and Ryan
[1976], Stone and
Gronhaug [1993],
Social risk Risk that a poor
product choice will
bruise the
consumer’s ego
Cunningham [1967],
Jacoby and Kaplan
[1972], Peter and Ryan
[1976], Stone and
Gronhaug [1993]
Psychological
risk
Risk that a will not
be consistent with
the consumer’s
self-concept or will
not satisfy self –
esteem needs
Cunningham [1967],
Roselius [1971],
Jacoby and Kaplan
[1972], Peter and Ryan
[1976], Stone and
Gronhaug [1993]
Time risk Risk that the time
spent in product
search may be
wasted if the
product does not
perform as
expected
Cunningham [1967],
Roselius [1971], Peter
and Ryan [1976],
Stone and Gronhaug
[1993]
Linked
decision risk
Buying a product
will result in
additional
purchases of other
goods or services
as a direct result of
having selected the
product
Lindquist (2007)
Obsolescence
risk
Risk that the
technology will
soon become
obsolescent
Kidiyoor (2013)
Facility risk The risk that the
support faculties
(road congestion,
parking facility)
needed to utilize
the product will not
be helpful
Introduced through this
paper
Objective
To identify the influence of risk relievers on specific components
of perceived risk
This study tries to examine the major risk relievers involved in
the purchase of car. The main research instrument was an interviewer
administered survey. The research instrument was developed using
the conceptual base of the dimensions of perceived risk and the
contextual basis of the focus group outcomes. The resultant
questionnaire comprised 64 Likert scales reflecting the nine
dimensions of perceived risk. Exploratory factor analysis with a
varimax rotation was conducted on the total 64 questions, which were
later reduced to nine dimensions. The survey incorporated inclusion
criterion of recent car purchase and was carried out with respondents
who had purchased a car within four months. A total of 200
completed questionnaires were obtained.
Table-02: Dimensions of Perceived Risk
Dimensions of Perceived Risk (Perceived Risk
Concerning)
Loadings
Components of Functional Risk
Boot Capacity .968
Quality of audio system .954
Traversing hill roads .947
Capability of local technicians .946
Availability of nationwide service outlets .942
A good after sales service .934
Pleasing car interiors .932
Engine pick up/ performance .928
Cameras and other accessories .924
Leg room inside the car .921
Mileage .915
Components of Psychological Risk
Thirst for high speed driving .965
Car can be stolen .959
Expensive car .957
Fear of driving .942
Making a poor choice of a car .927
Driving experience .925
Poor resale value .923
Doubtful of backseat comfort .920
Components of Decision Risk
New to the market car .963
Misguiding advertisements .949
Performance after two years .945
Tempted because of loyalty / exchange bonus .938
Biased newspaper reports .936
local mechanics can misguide my selection of car .932
Utilize the money for other purpose .927
Company reputation .910
Components of Social Risk
Friends will not complement the decision to purchase
this car
.957
Pleasing color .947
The car is liked by all members of the family .939
The shape of my car will add my social status .937
Getting a sense of more importance among my friends
after I own the car
.936
Social standing will get decreased after buying this car .932
Starting trouble .904
Components of Time Risk

Management Today Vol.5, No.1 January-March 2015
9
Long time to learn to drive the car .970
wasted a lot of time in searching the car of choice .956
Not be able to clean / cover the car properly .949
Wasting time in search of service mechanic .943
Car loan procedure will consume a huge amount of time .942
A car loan that can help the hassle of wasting time in
loans elsewhere
.941
Waiting time to get the car .913
Components of Facility Risk
Exteriors can get damaged in parking lots .993
Non availability of garage at home .986
Inability to drive without making scratches .979
Roads are congested .971
Frequent speed breakers on daily usage roads .967
Difficulty of parking while using it for shopping .966
Components of Financial Risk
Pay a higher EMI for buying this car .979
Not sure if the car is maintenance free .978
The price of the car will come down after purchase .973
Is the car worth the money spent .970
The cost of spares for this car can be expensive .959
Is the price of car within budget .948
Components of Physical Risk
Brake performance .954
Lighting system in the car .950
Road grip .947
Performance/ absence of airbags .943
Air conditioning system .943
Non availability of assisted brake system (ABS) .922
Components of Obsolescence Risk
The car will soon become outdated .948
There will be shortage of personnel to repair with advent
of new technology
.912
The manufacturer will stop this model at any time .909
There will be shortage of spares when new launches
start pouring in
.903
Will lose its resale value .902
Primary Data Computed
From the factor analysis nine factors have been divided and the
factor loading above .90 in each column is formed a dimension. The
64 variables addressed the various components of risk. Seventeen risk
relievers (action initiated by the purchaser or the seller in order to
reduce the perceived risk) were identified as relevant in purchase of
cars. The study was confined to Cuddalore district, India.
Consumers characteristically develop their risk reduction
strategies for reducing their perceived risk. Risk reducers are
strategies that are used by consumers in order to bring the risk to a
certain level below which they feel comfortable to take a decision.
The following seventeen risk relievers were identified as suitable in
purchase of car. They include consumer satisfaction index, sales man
assurance, test drive, auto magazine reviews, brand preference,
frequent advertisements, recommendation of motor mechanic,
authorized service station, country of origin, extended free service,
celebrity emulation, looks of the car, dealer reputation, high price
edition, social observation, market tenure and word of mouth.
Table-01: Influence of Risk Relievers on Components of Perceived Risk
Risk reliever statements Physical
risk
Psychological
risk
Functional
risk
Social
risk
Financial
risk
Time
risk
Decision
risk
Obsolescence
risk
Facility
risk
Consumer satisfaction
index -.080 -0.135
The sales man assurance -0.090
The test drive -0.302 -0.060 -0.101 -0.267 -0.095
Review from Auto
magazines -0.127
Looks of the car -0.157 -0.099 - -0.093
The television
advertisements -0.104 -0.100
Opinion leadership
The availability of
company authorized
Sales / service stations
-0.178 -0.089 -0.096 -0.096
country of origin -0.149 -0.155 -0.225 -0.473 -0.123 -0.144
extended warranty / price
reduction -0.118 -0.255 -.092
Celebrity emulation -0.169
Brand preference -0.454 -0.274 -0.172 -0.098 -0.107 -0.157 -0.216
Dealer reputation
highest end edition -0.175
Social observation -0.091
Market tenure -0.112 -0.102
Word of mouth -0.054 -0.086 -0.204 -0.135
Constant 4.730 5.142 4.694 5.375 4.531 4.502 4.350 4.256 2.671
R Square 0.494 0.842 0.587 0.747 0.283 0.302 0.319 0.337 0.048
Source: Primary data computed
Stepwise multiple regression analysis was carried out to identify
the influence of risk relievers on the components of perceived risk.
The results of the stepwise regression are shown in table no. 2. It is
found that out of the seventeen risk relievers chosen for the study

Influence of Risk Relievers on Dimensions of Perceived Risk in Car Purchase
10
only 15 risk relievers have an influence on the components of
perceived risk.
The R Square value infers that 49.4 percent of physical risk has
been explained by the five risk relievers test drive, availability of
service station country of origin, extended warranty and market
tenure. Test drive is the most influencing risk relievers that tend to
reduce physical risk.
The R Square value infers that 84.2 percent of psychological risk
is relieved by the five risk relievers viz, word of mouth, country of
origin, test drive, high priced edition and market tenure. The
preferred brand is the most influencing risk reliever that tends to
reduce psychological risk. Research shows that brand name can help
consumers reduce search cost and cognitive effort when making
product evaluations (Landes and Posner, 1987)
The R Square value infers that 58.7 percent of functional risk is
mitigated by the five risk relievers namely looks of the car,
availability of service station, preferred brand, country of origin and
word of mouth. Preference of brand is the most influencing risk
reliever that tends to reduce functional risk. Lumpkin et al. (1985b)
showed that perceived risk changed when consumers were made
aware of the country of origin
The R Square value infers that 74 percent of social risk is allayed
by the six risk relievers customer satisfaction index, preferred brand,
authorized service, Country of origin, looks of the car and social
observation are the most influencing risk reliever that tends to reduce
social risk. Country of origin is the most influencing risk reducer that
reduces social risk. Brody and Cunningham (1968) define Social risk
as the extent to which the consumer thinks that other people judge
him on the basis of the brand he uses.
The R Square value infers that 27.7 percent of financial risk is
decreased by six risk relievers identified as sales man assurance,
advertisements, extended warranty, preferred brand, market tenure
and availability of service station. Extended warranty is the most
influencing risk reliever that tends to reduce financial risk. Peter, J. P.
and Tarpey, L. X., (1975) examined financial risk as the net financial
loss to a consumer through reasons like lack of warranty and high
maintenance fees
The R Square value infers that 29.3 percent of time risk is
dispelled by six risk relievers noted as customer satisfaction index,
test drive, advertisements, country of origin, preferred brand and
word of mouth. Word of mouth is the most influencing risk reliever
that tends to reduce time risk. Sunitha et al. (2012b) identified that
Factors like word of mouth, magazine reviews, test drive, availability
of service stations had a major role in the purchase decision making
process
The R Square value infers that 31.9 percent of decision risk has
been explained by the four risk relievers - test drive, auto magazine
reviews, preferred brand and looks of the car. Test drive is the most
influencing risk reliever that tends to reduce decision risk.
The R Square value infers that 33.7 percent of obsolescence risk
is reduced by four risk relievers - test drive, brand preference,
country of origin and celebrity emulation. Preferred brand is the most
influencing risk reliever that tends to reduce obsolescence risk. Arndt
(1967) indicated that word of mouth can be explained as seeking
social support for adoption or non-adoption and as risk reduction by
group action.
The R Square value infers that 4.8 percent of facility risk is
influenced by the two risk relievers extended warranty and looks of
the car. Looks of the car is the most influencing risk reliever that
tends to reduce facility risk.
Among the seventeen risk relievers considered for the study, test
drive, word of mouth, country of origin, availability of service
stations, looks of the car and preferred brand are risk reducers that
impact upon multiple components of perceived risk. Among these
preferred brand is found to weigh upon seven risk reducers.
Manufacturers should create brands that are enduring by designing
cars that are trouble free, having well developed service centres, well
informed sales men and providing a hassle free dealership
experience. Roselius (1971) explained that the most common risk-
reducing strategy employed is to become loyal to a particular brand.
Test drive and availability of service stations are risk relievers that
influence multiple dimensions of perceived risk. Hence companies
should take efforts to draw customers to test their vehicles and
increase the number of service stations while improving the quality of
service which in turn will create a positive word of mouth which
again is an effective risk reliever. Companies should invest on their
brand, a product of promotion, quality and customer experience as
brand value tends to be an effective risk reliever. Hence companies
should put their effort in developing knowledgeable sales people, a
class product free of hassles, develop and communicate a good brand
image, have large number of authorized service centres which
ultimately result in a positive word of mouth for their product.
Companies should design cars that by its looks should inspire the
confidence of future buyers.
Social observation is a risk reducer that consumers can easily
lean upon as it requires a simple observation of the vehicles on the
road. As identified by Cox (1967) Social expectations or peer
pressure are examples of external references consulted during risk
information search. There might be other risk relievers which would
not have been accounted in this manuscript which can be included in
future studies and the study can be extended on a pan India basis.
The major implication that can be drawn from the study is that
manufacturers should leave no stone unturned in their effort to
minimize the perceived risk of customers.
Bibliography
Arndt, Johan. (1967). Perceived Risk, Sociometric Integration, and
Word of Mouth in the Adoption of a New Food Product. in D. F.
Cox, ed. Risk Taking and Information Handling in Consumer
Behavior, Boston: Division of Research, Graduate School of
Business Administration, Harvard University.
Bauer, R. A. Consumer behavior as Risk Taking. in D. F. Cox (Ed.),
(1960). Risk Taking and Information Handling in Consumer
Behavior, Harvard Business Press, Boston, MA, pp. 23–33.
Brody, R. P., Cunningham, S. M. (1968). Personality variables and
the consumer decision process. Journal of Marketing Research,
5, 50-57.
Cunningham, S. M. (1967). The major dimensions of perceived risk.
in Cox, D.F. (Ed.), Risk Taking and Information Handling in
Consumer Behavior, Graduate School of Business
Administration, Harvard University Press, Boston, MA, pp. 82-
108.
Dholakia, Utpal M. (2001). A motivational process model of product
involvement and consumer risk perception. European Journal of
Marketing, 35 (11/12), 1340 – 1362.

Management Today Vol.5, No.1 January-March 2015
11
Jacoby & J Kaplan, L. B. (1972). The components of perceived risk
in: Annual Conference of the Association for Consumer
Research, pp. 382–393.
Joseph, L. (July 10, 2011). Zipping ahead. Business India, 50-58.
Landes, W. M. and Posner, R. A. (1987). Trademark law: An
economic perspective. Journal of Law and Economics, 30 (2),
265–309.
Lindquist D. Jay and Joseph S. M. (2007). Shopper, Buyer, and
Consumer Behavior. biztantra, New Delhi.
Lumpkin, J. R., Crawford, J. C. and Kim, G. (1985). Perceived risk as
a factor in buying foreign clothes - implications for marketing
strategy. International Journal of Advertising, 4 (2), pp. 157-71.
Roselius, T. (1971). Consumer Rankings of Risk Reduction
Methods,” Journal of Marketing (35),.pp 56-61.
Stone, R.N. & Grønhaug, K. (1993) Perceived Risk: Further
Considerations for the Marketing Discipline. European Journal
of Marketing, 27(3), 39-50.
Sunitha .T, T. Frank Sunil Justus, Praba, R. (2012). How to market a
car? Asian Management Review. Pp. 86-90
T. Sunitha is an Assistant Professor, Department of Business
Administration, Annamalai University, India
T. Frank Sunil Justus was earlier senior operation Engineer at
Tuticorin Alkali Chemicals and Fertilizers Limited and is presently
an Assistant professor, Department of Business Administration,
Annamalai University, India
M. Ramesh is Professor, Department of Business Administration,
Annamalai University, India

12
---------------------------------------------------------------------------------------------------
Responsibility of Contents of this paper rests upon the authors
and not upon GRIET publications
ISSN: 2348-3989 (Online)
ISSN: 2230-9764 (Print)
Doi: http://dx.doi.org/10.11127/gmt.2015.03.03
pp.12-22
Copyright@GRIET Publications. All rights reserved.
MANAGEMENT TODAY
-for a better tomorrow An International Journal of Management Studies
home page: www.mgmt2day.griet.ac.in Vol.5, No.1, January-March 2015
A Study of Non-Performing Assets in the Indian Banking Industry
Sipra Debnath and Mihir Dash
Alliance University, [email protected]
A R T I C L E I N F O Article history: Received 29.01.2015 Accepted 31.03.2015 Keywords:
asset quality, non-performing assets
(NPAs), recovery.
A B S T R A C T
The strength and soundness of a banking system primarily depends upon the quality of the assets.
Non-performing assets (NPA) is one of the major concerns for banking system in India. This
study analyzes NPA management in Indian banks for the period 2004-2013. The data for the
study pertained to gross and net NPAs of different bank groups over the research period, and was
collected from the Reserve Bank of India (RBI) website. The results of the study show that there
has been a reduction in the NPA ratios over the research period, which indicates improvement in
the asset quality of Indian public sector banks, private sector banks, and foreign banks. There was
significant improvement in the management of NPAs of the public sector banks. The stringent
prudential and provisioning norms and other initiatives taken by the regulatory bodies have
pressurized banks to improve their performance, and consequently resulted in reduction of NPA
as well as improvement in the financial health of the Indian banking system. The various steps
initiated by the RBI and the Government of India in strengthening/improving the functioning of
the Debt Recovery Tribunals, Lok Adalats, and SARFAESI Act as a comprehensive settlement
policy certainly has resulted in improved recovery of NPA accounts. All these efforts have
improved the efficiency and profitability of Indian banks, and have strengthened the financial
position of the public sector banks and private sector banks. The study further reveals that despite
the huge NPA level of public sector banks, they have been successful in reducing their respective
gross and net NPA ratios at par with the private sector banks.
Introduction
One of the primary functions of banking is the granting of loans
and advances to customers to provide finance for their economic
activities. The funds received back from borrowers plays a major part
in the cash cycle of banks, and contributes largely to their profits.
Non-recovery of interest and/or instalments on the loan portfolio
disrupts the effectiveness of the credit cycle, constraining the funds
of banks, impacting their profitability, and compelling banks to
maintain minimum capital reserves and provisions to act as an offset
for possible loan losses.
As per RBI guidelines, as of March 31, 2004, a non-performing
asset (NPA) is a loan or an advance in any of the following cases:
interest and/or instalment of principal remain overdue
for a period of more than 90 days in respect of a term
loan,
the account remains ‘out of order’ for a period of more
than 90 days, in respect of an overdraft/cash credit
(OD/CC),
the bill remains overdue for a period of more than 90
days in the case of bills purchased and discounted,
interest and/or instalment of principal remains overdue
for two harvest seasons but for a period not exceeding
two half years in the case of an advance granted for
agricultural purposes, and
any amount to be received remains overdue for a period
of more than 90 days in respect of other accounts.

Management Today Vol.5, No.1 January-March 2015
13
An account is treated as ‘out of order’ if the outstanding balance
remains continuously in excess of the sanctioned limit/drawing
power. In cases where the outstanding balance in the principal
operating account is less than the sanctioned limit/drawing power, but
there are no credits continuously for six months as on the date of
Balance Sheet or credits are not enough to cover the interest debited
during the same period, these accounts should be treated as out of
order.’ Any amount due to the bank under any credit facility is
‘overdue’ if it is not paid on the due date fixed by the bank.2
The recognition of the importance of Non-performing Assets has
grown since the Narshimham Committee Report on banking sector
reforms in 1991, which can be considered as the second landmark in
banking sector in India after nationalization of banks. After the
nationalization of banks, RBI focussed its attention mainly on the
lending policy of nationalized banks, but not so much on the recovery
of advances of nationalized banks.
The recovery of non-performing assets has become critical
performance area for all banks in India. As per the RBI report of
March 19993, the gross NPA of all the scheduled commercial banks
and primary co-operative banks had gone up to Rs.58,554 crores
(14.6%) and to Rs. 4,535 (12.2%) crores, respectively. There was a
lack of specific and unanimous guidelines which had resulted in huge
misallocation of bank funds.
Thus it was pertinent to develop some specific guidelines
regarding NPAs. In April 1992 RBI introduced a new set of
prudential norms for commercial banks, which were subsequently
extended in stages to urban co-operative banks as well, as per the
recommendations of the Madhavarao Committee in May 1999 as a
need for strengthening the co-operative sector in order to enhance
operational efficiency, productivity and profitability and with the
objective of implementing international best practices in Indian
banks, it is compulsory for all banking institutions to comply with
prudential norms of RBI.
Literature Review
There is a very extensive literature examining the causes and
management of NPAs. The following is a review of some of the more
recent literature in the Indian context.
Murari (2014) identified a continuous increasing trend in gross
and net NPAs for public sector banks in comparison to private sector
banks. He also found a statistically significant difference in the gross
and net NPAs of public and private sector banks, but no significant
difference in gross and net NPA ratio of public and private sector
banks, which indicated that the public and private sector banks are
trying hard to reduce their NPA ratios consistently due to the
regulatory and supervisory pressure.
Khedekar (2012) examined the causes of NPAs, and its
prevalence in different sectors in India. She argued that the level of
NPAs is an indicator reflecting the credit risks and efficiency of
allocation of bank resources. She suggested the necessity of
provisions to offset possible NPAs, which in turn reduces the overall
profitability of banks.
Vadivalagan and Selvarajan (2012) analysed the impact of NPAs
on liquidity and profitability of banks. They concluded that the
presence of NPAs has an adverse impact on the productivity and
efficiency of Indian banks, resulting in the erosion of profits. They
suggested that banks should keep NPAs at low level through efficient
recovery mechanism (before loans turn into bad debts), in order to
maintain the liquidity and profitability.
Veerakumar (2012) studied the priority sector advances by the
public, private and foreign banks in India, and compared the priority
sector and non-priority sector NPAs over the period 2001-11. He also
identified the categories of priority sector advances which contributed
to the growth of total priority sector NPAs during the period.
Murthy and Gupta (2012) examined the impact of easing on the
non-performing assets of the four banking segments, namely, public
sector, old private sector, new private sector, and foreign banks by
studying the general trends in NPAs. They used the Structure-
Conduct-Performance approach, showing the link between
competition and conduct, concentration and growth in NPAs. They
found that NPAs were declining at a CAGR of 13% p.a.
Paul et al (2011) measured the relative efficiency of Indian public
sector banks based on overall financial performance. They argued
that, given the very dynamic pace of restructuring of the financial
services industry in India, it is imperative for banks to continuously
monitor their efficiency on Non-Performing Assets, Capital Risk-
Weighted Asset Ratio, Business per Employee, Return on Assets and
Profit per Employee. They developed a framework for benchmarking
efficiency wherein Non-Performing Assets is used as a negative
financial indicator. This study analyses NPA management by public
sector, private sector, and foreign banks in the Indian banking sector.
Data and Methodology
The primary objectives of the study were to examine the trends in
NPAs across the public sector, private sector, and foreign banks, to
evaluate the impact of NPAs on the performance of banks, in terms
of profitability and capital adequacy, and to understand the sector-
wise contribution (agricultural, SSI, priority sector, non-priority
sector, public sector units, and others) to NPAs.
The data for the study pertaining to NPAs, their composition,
classification of loan assets, advances, and profits of various banks
have been taken from the RBI online database and from the Report
on Trends and Progress of Banking in India. The research period for
the study was 2004-2013. The study is analytical in nature, applying
the statistical techniques of ANOVA to examine differences in NPAs
between different bank groups, and correlation and regression to
examine associations between NPAs and other variables.
Analysis
(a) Classification of assets (standard, sub-standard, doubtful
and loss) as a percentage of advances of all scheduled commercial
banks and trends in NPAs:
Table 1 shows the classification of assets as a percentage of total
advances of all scheduled commercial banks. Figure 1 shows the
Loan
Ass
ets
as
a %
of
Tota
l Ad
van
ces
Fig 1: NPA's Of Indian Banks
Sub-std.Assets

A Study of Non-Performing Assets in the Indian Banking Industry
14
trend in NPAs (as a percentage of total advances) of all scheduled
commercial banks.
Table-1: Categories of Loan Assets (as a percentage of Total
Advances)
Year Standard
Assets
Sub-
Standard
Assets
Doubtful
Assets
Loss
Assets
Total
NPAs
2004 92.81 2.33 4.02 0.85 7.19
2005 95.09 1.18 3.12 0.62 4.91
2006 96.52 1.00 2.03 0.45 3.48
2007 97.34 1.05 1.29 0.31 2.66
2008 97.61 1.12 1.04 0.23 2.39
2009 97.55 1.29 0.96 0.20 2.45
2010 97.49 1.26 1.00 0.24 2.51
2011 97.64 1.00 1.12 0.24 2.36
2012 97.06 1.45 1.28 0.21 2.94
2013 96.58 1.59 1.63 0.21 3.42
Source: Department of Banking Supervision, RBI
The trend of NPAs (sub-standard, doubtful, and loss assets) was
declining in the period 2004-07, and stabilised in the period 2007-11,
reaching a minimum in 2008; however, there was a slight increase in
2012-13. A similar pattern was reflected in the trends for sub-
standard assets and for doubtful assets. On the other hand, the trend
in loss assets has shown a consistent decline throughout the research
period. These trends reflect the successful implementation of the
Narasimham Committee recommendations, which caused great strain
on the efficiency, productivity and profitability of the public sector
banks and even some of them showed loss in the initial year.
However, there is cause to worry about the apparent loosening of
control in 2012-13.
Table 2 and Table 3 lists the gross and net NPA’s of various
groups of banks viz. all scheduled commercial banks, public sector
banks, old private sectors banks, new private banks, and foreign
banks.
Table-2: Group-wise Gross NPAs of Scheduled Commercial Banks (in Rs. billion; as a Percentage of Gross Advances)
Year
Scheduled Commercial
banks Public sectors banks
Old private sector
banks
New Private sector
banks Foreign banks
2004 647.86 7.7% 515.38 7.8% 43.92 7.6% 59.63 5.0% 28.45 5.3%
2005 583.00 6.3% 473.25 5.7% 42.06 6.0% 45.76 3.6% 28.94 4.6%
2006 518.16 4.4% 421.06 3.7% 37.40 4.3% 40.42 1.7% 21.92 2.8%
2007 504.86 3.7% 389.68 2.7% 29.69 3.1% 62.87 1.9% 19.28 1.9%
2008 564.35 3.5% 405.95 2.2% 25.57 2.3% 104.26 2.5% 22.63 1.8%
2009 846.98 2.4% 599.26 2.2% 36.22 2.3% 140.17 2.9% 28.59 1.8%
2010 979.22 2.3% 746.14 2.2% 36.99 2.0% 145.41 2.3% 64.44 3.8%
2011 1423.00 2.5% 746.64 2.3% 36.00 1.9% 145.00 2.7% 71.33 4.3%
2012 1429.00 3.1% 1172.62 3.0% 42.00 1.8% 145.00 2.2% 50.00 2.5%
2013 1940.00 3.6% 1644.62 3.7% 52.00 1.9% 158.00 2.0% 62.00 2.6%
Source: Report on Trends and progress of Banking in India, relevant issues.
Table 3: Group-wise Net NPAs of Scheduled Commercial Banks (in Rs. billion; as a Percentage of Net Advances)
Year
Scheduled Commercial
banks Public sectors banks
Old private sector
banks
New Private sector
banks Foreign banks
2004 296.92 4.0% 248.77 4.5% 25.98 5.2% 13.65 1.5% 9.03 1.7%
2005 243.96 2.8% 193.35 3.1% 21.42 3.8% 19.86 1.7% 9.33 1.5%
2006 217.54 2.0% 169.04 2.1% 18.59 2.7% 23.53 1.9% 6.39 0.8%
2007 185.43 1.2% 145.66 1.3% 13.75 1.7% 17.96 0.8% 8.08 0.8%
2008 201.01 1.0% 151.45 1.1% 8.91 1.0% 31.37 1.0% 9.27 0.7%
2009 247.30 1.0% 178.36 1.0% 7.40 0.7% 49.07 1.2% 12.47 0.8%
2010 315.64 1.1% 211.55 0.9% 11.59 0.9% 62.52 1.4% 29.96 1.8%
2011 387.23 1.1% 293.75 1.1% 12.71 0.8% 52.34 1.1% 29.77 1.8%
2012 417.00 1.1% 360.00 1.2% 9.00 0.5% 34.00 0.6% 12.00 0.6%
2013 649.00 1.4% 591.00 1.7% 13.00 0.6% 30.00 0.5% 14.00 0.6%
Source: Report on Trends and progress of Banking in India, relevant issues.
The analysis of NPAs of different banks groups indicates that the
total amount of Gross NPA and Net NPA of public sector banks and
private sector banks accounted more than 70% of total NPA of all
scheduled commercial banks. Further, Gross NPA to Gross Advances
for Scheduled commercial banks had declined till 2010 from 7.7% to
2.25%, but from 2011 to 2013, an increase in the percentage of Gross
NPA to Gross Advances is a warning signal for Indian banking. As
far as a comparison between public and private sector banks is
concerned, the public sector banks seem to have higher Gross NPA
ratio (on an average) than old and new private sector banks during the
period of study. In the same manner Net NPA to Net Advances for
public sector banks was also higher when compared to old and new
private sector banks and all scheduled commercial banks, which
shows the inefficiency of public sector banks in managing NPA, and
there is a fluctuation in the percentage of Gross NPA and Net NPA of
foreign banks which is not a good sign.
Figure 2 below presents the linear trend analysis of Gross NPA in
public sector banks and private sector banks across the research
period.
Fig-2: Linear Trend in Gross NPA of Public and Private Sector Banks

Management Today Vol.5, No.1 January-March 2015
15
Source: Report on Trends and progress of Banking in India, Relevant Issues
The Gross NPA of public sector banks and new private sector
banks exhibit an increasing linear trend in the research period, while
the Gross NPA of old private sector banks shows a decreasing linear
trend.
The growth in Gross NPA of public and new private sector banks
could be due to the continued recession in some industrial segments
such as real estate, cement, textiles, and so on. In 2012-13, there was
net addition to Gross NPA in public sector banks by Rs.472 billion,
i.e. 4.02% of Gross NPA as on 31.03.2012, whereas the
corresponding figure was 2.38% for old private sector banks and
8.96% for new private sector banks.
Old private sector banks were successful in reducing their Net
NPA ratio from 2.3% in 2001 to 0.77% in 2013 with a minimum of
0.53% in 2011. Similarly, new private sector banks also showed a
remarkable decline in their Net NPA ratio from 3.1% in 2001 to
0.42% in 2011-12, with a marginal increase to 0.45% in 2012-13. Net
NPA of the public sector banks rose to 2.01% during 2012-13 as
compared to 1.53% in 2011-12.
Table 4 presents the movement of NPAs of scheduled
commercial banks in 2012-13.
Table-4: Movement of NPAs of Scheduled Commercial Banks 2012 and 2013 (in Rs. million)
Bank
Gross NPAs Net NPAs
on
31/3/12 Increases Decreases
Write-
offs on 31/3/13
on
31/3/12
on
31/3/13
SBI and its Associates 482146 425368 219147 60580 627785 202366 281007
State Bank of India 396765 319934 148857 55948 511894 158189 219565
State Bank of Bikaner & Jaipur 16515 16279 6966 4633 21195 9454 13041
State Bank of Hyderabad 20074 28168 16381 - 31860 10020 14487
State Bank of Mysore 15026 16584 10804 - 20806 7684 12088
State Bank of Patiala 18878 20338 14685 - 24530 8484 11942
State Bank of Travancore 14888 24066 21454 - 17499 8536 9886
Nationalised Banks 696247 772748 429260 17461 1022272 391546 619362
Allahabad Bank 20590 58919 28139 - 51370 10917 41268
Andhra Bank 17980 27417 8252 - 37145 7559 24092
Bank of Baroda 44648 68438 33260 - 79826 15436 41920
Bank of India 64709 75781 47394 - 93095 38425 60326
Bank of Maharashtra 12970 8076 9670 - 11376 4696 3929
Canara Bank 40318 58193 35909 - 62602 33863 52781
Central Bank of India 72730 51250 39420 - 84560 46000 49880
Corporation Bank 12742 17973 10233 - 20482 8694 14109
Dena Bank 9565 11198 6238 - 14525 5717 9172
IDBI Bank Ltd. 45514 27397 8411 - 64500 29109 31004
Indian Bank 18508 28925 11778 - 35655 11968 23843
Indian Overseas Bank 39201 56006 29127 - 66080 19074 40272
Oriental Bank of Commerce 35805 32133 26098 - 41840 24590 29027
Punjab and Sind Bank 7634 10936 3201 - 15369 5476 11104
Punjab National Bank 87196 86470 39009 - 134658 44542 72365
Syndicate Bank 31827 21420 23462 - 29785 11854 11248
UCO Bank 40862 51616 15005 6172 71301 22639 40693
Union Bank of India 54499 39738 19809 11288 63138 30250 33534

A Study of Non-Performing Assets in the Indian Banking Industry
16
United Bank of India 21764 24848 16974 - 29638 10756 19700
Vijaya Bank 17185 16014 17869 - 15329 9980 9097
Old Private Sector Banks 41998 41833 30063 1674 52095 13357 20864
Catholic Syrian Bank 1829 1713 1434 - 2109 842 993
City Union Bank 1235 2234 1739 - 1731 540 964
Dhanlaxmi Bank 1043 5048 2288 - 3803 580 2610
Federal Bank 13008 8070 5424 115 15540 1990 4319
ING Vysya Bank 1495 1939 1531 689 1214 525 91
Jammu & Kashmir Bank 5166 4550 2408 870 6438 493 553
Karnataka Bank 6847 4135 4593 - 6389 4352 3778
Karur Vysya Bank 3210 2005 2357 - 2859 788 1087
Lakshmi Vilas Bank 3077 4002 2480 - 4599 1771 2838
Nainital Bank 310 574 212 - 673 - -
Ratnakar Bank 331 409 481 - 259 84 69
South Indian Bank 2672 5301 3634 - 4339 765 2495
Tamilnad Mercantile Bank 1775 1854 1484 - 2145 626 1068
New Private Sector Banks 145680 86996 33719 40347 158610 30656 39079
Axis Bank 18063 20234 5843 8520 23934 4726 7041
Development Credit Bank 2418 753 1021 - 2150 302 491
HDFC Bank 19994 18592 3720 11520 23346 3523 4690
ICICI Bank 94753 35871 18088 16459 96078 18608 22306
IndusInd Bank 3471 4466 1919 1440 4578 947 1368
Kotak Mahindra Bank 6142 4643 1870 1334 7581 2374 3114
Yes Bank 839 2437 1259 1074 943 175 70
Foreign Banks 62964 41442 24137 501 79770 14124 26628
AB Bank - 57 - - 57 - 44
Abu Dhabi Commercial Bank 31 0 31 - - - -
American Express Banking Corp. 234 681 469 - 446 176 319
Antwerp Diamond Bank 996 - 494 - 503 174 -
Australia and New Zealand Banking Group - 281 - - 281 - -
Bank International Indonesia - - - - - - -
Bank of America 7 - 7 - - - -
Bank of Bahrain & Kuwait 277 491 245 - 523 176 234
Bank of Ceylon 15 - 0 - 15 - -
Bank of Nova Scotia 96 668 185 - 579 - 350
Bank of Tokyo-Mitsubishi UFJ 82 5 - - 87 8 8
Barclays Bank 5471 2769 2698 - 5543 1254 1473
BNP Paribas 275 - 26 86 163 41 -
Chinatrust Commercial Bank 163 393 34 - 522 92 268
Citibank 8464 10421 5298 - 13587 4238 7667
Commonwealth Bank of Australia - - - - - - -
Credit Agricole 9 - 3 - 6 - -
Credit Suisse AG - - - - - - -
DBS Bank 2147 4236 148 415 5820 774 3290
Deutsche Bank 1348 371 175 - 1544 114 287
FirstRand Bank - 220 - - 220 - -
Hongkong & Shanghai Banking Corporation 7201 1929 2722 - 6408 2203 1190
HSBC Bank oman S.A.O.G. - - - - - - -
Industrial and Commercial Bank of China - - - - - - -
JPMorgan Chase Bank 269 - 25 - 244 - -
JSC VTB Bank - - - - - - -
Krung Thai Bank - - - - - - -
Mashreqbank - - - - - -
Mizuho Corporate Bank 63 1190 - - 1253 - 877
National Australia Bank - - - - - - -
Rabobank International - - - - - - -
Royal Bank of Scotland 3465 535 1204 - 2796 933 365
Sberbank - - - - - - -
Shinhan Bank - - - - - - -
Societe Generale 12 - 4 - 7 - -
Sonali Bank 7 9 2 - 15 2 4
Standard Chartered Bank 32122 17020 10341 - 38801 3868 10098

Management Today Vol.5, No.1 January-March 2015
17
State Bank of Mauritius 210 166 26 - 350 71 154
Sumitomo Mitsui Banking Corporation - - - - - - -
UBS AG - - - - - - -
United Overseas Bank - - - - - - -
Westpac Banking Corporation - - - - - - -
Woori Bank - - - - - - -
Source: annual accounts of banks.
The increase in quantum of NPA per se is not a serious problem,
since every year a good amount is realized in NPA accounts. From
Table 4, the SBI group of public sector banks had Gross NPAs of
Rs.627,785 million and Net NPAs of Rs.281,007 million as on March
31, 2013, the difference amount of Rs.346,778 million representing
provisions. For SBI alone the provision amount was Rs.292,329
million.
The nationalized banks under public sector banks together had
Gross NPA of Rs.1,022,272 million and Net NPA of Rs.619,363
million, with provisions of Rs.402,910 million. Among nationalized
banks, Punjab National Bank is leading, with a provision of
Rs.62,293 million for NPAs followed by Bank of Baroda (Rs.37,906
million), Central Bank of India (Rs.34,680 million), Bank of India
(Rs.32,769 million). The old private sector banks had Gross and Net
NPA of Rs.52,095 million and Rs.20,864 million, respectively, with
provisions of Rs.31,231 million. Among old private sector banks, the
Federal Bank was leading with a provision of Rs.11,221 million.
Among the new private sector banks, ICICI bank was leading
with a provision of Rs.73,772 million, followed by HDFC bank
(Rs.18,657 million) and Axis Bank (Rs.16.893 million). Among
foreign sector banks Gross and Net NPAs were Rs.79,770 million
and Rs.26,628 million, respectively, with provisions of Rs.53,142
million.
Figures 3 and 4 present the trend in Gross and Net NPA ratios for
old and new private sector banks, and for public sector banks and
foreign banks, respectively. Figure 5 presents the slippage ratio for
the bank groups in the period 2010-13, and Figure 6 presents the
provisioning ratio for the bank groups in the period 2010-13.
Though the Gross and Net NPA has increased in amount, the
Gross NPA to Gross advances (Gross NPA ratio) and Net NPA to net
advances (Net NPA ratio) have shown a declining trend for old and
new private sector banks. Gross NPA ratio of public, old private, new
private and foreign sector banks were 7.8%, 7.6%, 5.0%, 5.30%,
respectively in March 2004 and declined to 3.68%, 1.9%, 2% and
2.60%, respectively by March 2013.
Net NPA to Net Advances of public sector banks was 4.5% as on
March 2004. This had come down to 1.7% in 2013, with a significant
reduction of 0.9% in 2010. The old and new private sector banks also
revealed the similar pattern, and the level of reduction of net NPA
ratio was much more than the public sector banks. This is a positive
sign, perhaps due to more provisioning as well as better recovery
done by the banks during this period. In 2012-13, among the three
channels for NPA recovery, viz., Securitisation and Reconstruction of
Financial Assets and Enforcement of Security Interest Act
(SARFAESI Act), Debt Recovery Tribunals (DRT) and Lok Adalats,
the largest amount was recovered through the SARFAESI Act. NPA
recovered through this Act accounted for about 80% of the total
amount of NPA (according to RBI’s Report on Trends and Progress
of Banking in India, 2012-13).
-
2.00
4.00
6.00
8.00
2 0 0 4 2 0 0 5 2 0 0 6 2 0 0 7 2 0 0 8 2 0 0 9 2 0 1 0 2 0 1 1 2 0 1 2 2 0 1 3
% T
O G
RO
SS A
DV
AN
CE
Fig.3: Gross and Net NPA Rat io of Old and New PRSB
Gross NPA ratio of Old PrSB Gross NPA ratio of New PrSB
Net NPA ratio of Old PrSB Net NPA ratio of New PrSB
-
5.00
10.00
2 0 0 4 2 0 0 5 2 0 0 6 2 0 0 7 2 0 0 8 2 0 0 9 2 0 1 0 2 0 1 1 2 0 1 2 2 0 1 3
% T
o A
dva
nce
Fig-4: Gross and Net NPA Rat io of PSB and FB
Gross NPA ratio of PSB Net NPA ratio of PSBGross NPA ratio of FB Net NPA ratio of FB

A Study of Non-Performing Assets in the Indian Banking Industry
18
Fig.-5: Slippage Ratio Bank Group-Wise
Source: Report on Trends and Progress of Banking in India,
2010-2013
Fig.-6: Provisioning Coverage Ratio across the Bank Groups
Source: Report on Trends and Progress of Banking in India,
2010-2013
The slippage ratio, defined as additions to NPAs during the year
as per cent of standard advances at the beginning of the year, also
showed an increase during 2012-13. On the other hand, although
there was a rise in the gross NPA ratio in 2012-13, the provisioning
coverage ratio (PCR), defined as provisions for credit loss as per cent
of gross NPAs, showed a marginal decline during the year 2013 at
the aggregate level. The decline was most perceptible for nationalised
banks. For the SBI group, however, there has been a steady
improvement in PCR since 2011. This can be regarded as a positive
development for this bank group against the backdrop of its rising
NPA ratio during this period.
(b) Impact of non-performing assets on the performance of
public sector banks:
In order to analyse the impact of NPAs on the performance of
banks, the NPAs were analysed in terms of priority sector NPAs,
non-priority sector NPAs, and public sector units’ NPAs. Priority
sector loans are advances given to agriculture, small-scale industries,
and so on. Non-priority sector loans are advances given to medium-
and large-scale industries and so on. Unfortunately, this data was
available only for public sector banks for the period 2002-12. The
components of NPAs along with the net NPA and net profit of public
sector banks are presented in Table 5 and Figures 6 and 7 below.
Table-5: NPAS of Priority Sector, Non-Priority Sector, and Public Sector Units to Net Profit
Year Priority Sector Non-Priority Sector Public Sector Units Net NPA Net Profit
2002-03 24939 26781 1087 24877 12295
2003-04 23841 25698 610 19335 16546
2004-05 21926 23249 444 16904 15784
2005-06 22374 18664 341 14566 16539
2006-07 22954 15158 490 14145 20152
2007-08 25287 14153 299 17726 26592
2008-09 24318 19251 474 21033 34394
2009-10 30848 25929 524 29644 57109
2010-11 41245 29803 278 36071 70331
2011-12 48524 34502 746 39423 81700
Source: Report on Trend and Progress of Banking in India, 2003-12
(All values are in Rs. crore)

Management Today Vol.5, No.1 January-March 2015
19
The public sector unit NPAs were negligible compared to the
NPA of priority sector and non-priority sector. Further, all three
components seemed to be in control until 2008-09, after which they
started increasing again. In fact, the increase in NPAs was more
noticeable in priority sector, which have been more active in the real
estate and housing loans segments. From 2007-08 there was an
increase in NPAs because of defaults on the loans given to the
farmers. This was reduced through a waiver package announced in
the Union Budget of 2009. Despite the huge claims settlement by the
DICGC and write-off by public sector banks, percentage wise NPAs
in priority sector advances showed an increasing trend till 2007-08
and then reversed. There was a rise in the growth of priority sector
credit in 2012-13 against a drop in overall credit growth during the
year. However, non-priority sector NPAs were higher in 2012-13
than priority sector NPAs, as presented in Figure 8 below.
Fig.-8: Trend in Priority and Non-Priority Sector NPAs
Source: Report on Trends and Progress of Banking in India, 2010-2013
Although the NPA ratio in the priority sector was consistently
higher than the NPA ratio in the non-priority sector, deterioration in
asset quality in 2012-13 was primarily on account of the non-priority
sector i.e. the non-priority sector is the major contributor of NPAs.
There was a low trend growth in net profit initially, which
accelerated after 2008-09. In particular, there was significant positive
correlation between net profit and priority sector NPAs (r = 0.9442)
and non-priority sector (r = 0.6575), but insignificant correlation
between net profit and public sector unit NPAs (r = -0.0970). Overall,
net profit was significantly positively correlated with net NPA (r =
0.9081). These correlations were corroborated through regression, as
presented in Tables 6 and 7 below.
Table-6: Regression of Net Profit on NPAs of Priority Sector,
Non-Priority Sector, and Public Sector Units
Particulars Coeff. Std. Err. t Stat
p-
value
Intercept
-
31528.83
11185.7
4
-
2.8187 0.0304
Priority Sector NPAs 2.69 0.56 4.7786 0.0031
Non-priority Sector
NPAs -0.03 0.88
-
0.0303 0.9768
Public Sector Units
NPAs -18.31 15.07
-
1.2143 0.2702
R2 = 0.9230, F Stat = 23.9639, p-value = 0.0010**
Table-7: Regression of Net Profit on Net NPAs of Public Sector
Banks
Particulars Coeff. Std. Err. t Stat p-value
Intercept -25021.13 10436.94 -2.3974 0.0434
Net NPAs 2.57 0.42 6.1321 0.0003
R2 = 0.8246, F Stat = 37.6031, p-value = 0.0003**
Am
ou
nts
in C
rore
sFig.-7: Net NPA and Net Profit of
PSB
Net NPA
Net Profit
Am
ou
nts
in C
rore
s
Fig.- 6: NPA of Priority, Non-Priority and Public Sector to Net Profit NPA of
PrioritySector
NPA ofNon-prioritySectorNPA ofPublicSector

A Study of Non-Performing Assets in the Indian Banking Industry
20
The regression results suggest that net profit is significantly
positively impacted by NPAs, and priority sector NPAs in particular.
The capital adequacy of the public sector, private sector, and
foreign banks is presented in Tables 8 and 9 below.
Table-8: Capital to Risk-Weighted Assets Ratio under Basel I
and II – Bank Group-Wise (Per Cent)
Item / Bank Group Basel I Basel II
2012 2013 2012 2013
Public Sector Banks 11.88 11.31 13.23 12.38
Nationalized Banks 11.84 11.39 13.03 12.26
SBI Group 11.07 11.14 13.70 12.67
Private Sector Banks 14.47 15.10 16.21 16.84
Old Private Sector Banks 12.47 12.33 14.12 13.73
New Private Sector Banks 14.90 15.71 16.66 17.52
Foreign Banks 17.30 18.76 16.75 17.87
Scheduled Commercial Banks 12.94 12.77 14.24 13.88
Source: Report on Trends and Progress of Banking in India,
2012-2013
Table-9: Component-Wise Capital Adequacy of Scheduled
Commercial Banks
(Amount in Rs. Billion)
Sl.
No. Item
Basel I Basel II
2012 2013 2012 2013
1.
Capital Funds (i-ii) 7,810 8,906 7,780 8,879
i) Tier I
Capital 5,686 6,595 5,672 6,580
ii) Tier II
Capital 2,124 2,311 2,109 2,299
2. Risk-weighted assets 60,376 69,742 54,621 63,969
3.
CRAR (1 as % of 2) 12.94 12.77 14.24 13.88
Of which: Tier I 9.42 9.46 10.38 10.29
Of which: Tier II 3.52 3.31 3.86 3.59
Source: Report on Trends and Progress of Banking in India,
2012-2013
The capital to risk-weighted assets ratio (CRAR) remained above
the stipulated 9% norm both at the overall banking system and bank
group levels in 2012-13, but showed a moderate decline. The core
CRAR (Tier I) under Basel II also showed a slight decline. This
decline in overall capital position was largely on account of
deterioration in the capital positions of public sector banks.
Deteriorating capital positions of public sector banks is a matter
of genuine concern given the fiscal implications of capital infusion in
these banks. Though the capital adequacy of public sector banks
remain above the statutory norm for CRAR according to Basel II, as
they migrate to the advanced Basel III framework, both the quantity
and quality (common equity) of capital will need to be improved,
while meeting the growing credit needs of the economy and
maintaining the floor for public ownership.
(c) Testing for Differences in NPAs between Bank Groups
The first test considered the difference in Gross NPAs between
public sector, private sector, and foreign banks. The results of the
one-way ANOVA test are presented in Table 10 below.
Table-10: One-Way ANOVA for Gross NPAs between Bank
Groups
Source of
variation SS df MS F
p-
value
Between
Groups
320332
6 3
1067775.0
0
25.637
2 0.0000
Within Groups
149938
1
3
6 41649.46
Total
470270
6
3
9
There was found to be a significant difference in Gross NPA of
public sector, private sector, and foreign banks. The bank group with
highest mean level of Gross NPAs was the public sector banks (with
mean Gross NPAs of Rs.711.46 crore), followed by new private
sector banks (Rs.104.65 crore), foreign banks (Rs.39.76 crore), and
lastly old private sector banks (Rs.38.19 crore). The two-way
ANOVA test was subsequently applied to control for year-to-year
variation. The results of the two-way ANOVA test are presented in
Table 11 below.
Table-11: Two-Way ANOVA for Gross NPAs between Bank
Groups
Source of
variation SS df MS F p-value
Bank groups 3203325.80 3 1067775.27 28.140 0.0000
Years 474914.75 9 52768.31 1.390 0.2400
Error 1024465.81 27 37943.18
Total 4702706.35 39
Again, there was found to be a significant difference in Gross
NPA of public sector, private sector, and foreign banks, as in one-
way ANOVA; however, there was no significant difference between
years (across time).
The next test considered the difference in Net NPAs between
public sector, private sector, and foreign banks. The results of the
one-way and two-way ANOVA tests are presented in Tables 12 and
13 below.
Table-12: One-Way ANOVA for Net NPAs between Bank
Groups
Source of
variation SS df MS F p-value
Between Groups 412198.70 3 137399.60 29.020 0.0000
Within Groups 170456.80 36 4734.91
Total 582655.50 39
Table 13: two-way ANOVA for Net NPAs between bank groups
Source of
variation SS df MS F p-value
Bank groups 412198.67 3 137399.56 29.310 0.0000
Years 43876.64 9 4875.18 1.040 0.4400
Error 126580.18 27 4688.15
Total 582655.49 39
There was found to be a significant difference in Net NPA of
public sector, private sector, and foreign banks. The bank group with
highest mean level of Net NPAs was the public sector banks (with
mean Net NPAs of Rs.254.29 crore), followed by new private sector
banks (Rs.33.43 crore), old private sector banks (Rs.14.24 crore), and
lastly foreign banks (Rs.14.03 crore). On the other hand, however,
there was no significant difference between years (across time).

Management Today Vol.5, No.1 January-March 2015
21
The next test considered the difference in Gross and Net NPA
ratios between public sector, private sector, and foreign banks. The
results of the one-way and two-way ANOVA tests are presented in
Tables 14, 15, 16, and 17 below.
Table-14: One-Way ANOVA for Gross NPA Ratio between Bank
Groups
Source of variation SS df MS F p-value
Between Groups 0.0004 3 0.0001 0.5396 0.6582
Within Groups 0.0091 36 0.0003
Total 0.0095 39
Table-15: Two-Way ANOVA for Gross NPA Ratio between Bank
Groups
Source of variation SS df MS F p-value
Bank Groups 0.0004 3 0.0002 1.8273 0.1660
Years 0.0071 9 0.0008 10.5450 0.0000
Error 0.0020 27 0.0001
Total 0.0095 39
Table-16: One-Way ANOVA for Net NPA Ratio between Bank
Groups
Source of variation SS df MS F p-value
Between Groups 0.0004 3 0.0001 1.3044 0.2879
Within Groups 0.0040 36 0.0001
Total 0.0044 39
Table-17: Two-Way ANOVA for Net NPA Ratio between Bank
Groups
Source of variation SS df MS F p-value
Bank groups 0.0004 3 0.0001 2.5364 0.0777
Years 0.0024 9 0.0003 4.7781 0.0007
Error 0.0015 27 0.0001
Total 0.0044 39
There was found to be no significant difference in Gross NPA
ratio between bank groups, but there was a significant difference in
Gross NPA ratio across time, with higher Gross NPA ratio in 2003-
06 and lowest Gross NPA ratio in 2007-08 (2.20%). Similarly, there
was found to be no significant difference in Net NPA ratio between
bank groups, but there was a significant difference in Net NPA ratio
across time, with higher Net NPA ratio in 2003-06 and lowest Gross
NPA ratio in 2011-12 (0.73%), with a slight increase in 2012-13
(0.85%). This suggests that all bank groups - public sector banks,
private sector banks, and foreign banks - are taking appropriate steps
to reduce their Gross and Net NPAs in proportion to their respective
Gross and Net Advances, respectively.
Discussion
The problem of NPAs is a critical problem that the Indian banks
are facing today. If the proper management of the NPAs is not
undertaken it could hamper the business of the banks, leading to
heavy potential losses and affecting the smooth functioning of the
recycling of funds.
The results of the study show that there has been a reduction in
the NPA ratios over the research period, which indicates
improvement in the asset quality of Indian public sector banks,
private sector banks, and foreign banks. There was significant
improvement in the management of NPAs of the public sector banks.
The stringent prudential and provisioning norms and other initiatives
taken by the regulatory bodies have pressurized banks to improve
their performance, and consequently resulted in reduction of NPA as
well as improvement in the financial health of the Indian banking
system. The various steps initiated by the RBI and the Government of
India in strengthening/improving the functioning of the Debt
Recovery Tribunals, Lok Adalats, and SARFAESI Act as a
comprehensive settlement policy certainly has resulted in improved
recovery of NPA accounts. All these efforts have improved the
efficiency and profitability of Indian banks, and have strengthened
the financial position of the public sector banks and private sector
banks. The study further reveals that despite the huge NPA level of
public sector banks, they have been successful in reducing their
respective gross and net NPA ratios at par with the private sector
banks.
Some recommendations can be made on the basis of these
findings and observations:
New bodies such as Debt Recovery Tribunals should be
established and their capacity should be enhanced.
All banks should keep stringent check on advance
being made to real estate and housing segments, as
these had contributed significantly towards the NPA in
2009-10.
Uneven scale of repayment schedule with higher
repayment in the initial years normally should be
preferred.
Public sector banks should increase their non-interest
income, as rise in NPA due to default in interest
income may affect the profits drastically.
Private sector and foreign banks should focus more on
recovery of sub-standard and doubtful assets.
There are some limitations inherent in the study. The study is
entirely based on secondary data, so that the limitations inherent in
secondary data sources will also persist in this study. Also, there were
some difficulties with data availability, with some data available for
only two/three years for private sector banks and foreign banks. This
prevented a thorough comparison of bank groups across all
dimensions.
There is vast scope for further research in the area of NPA
management. A more detailed break-up of NPAs needs to be
performed in order to identify potential risks; particularly, priority
sector lending must be analysed segment-wise to this end. Another
area that offers scope is the effectiveness of the recovery processes.
Also, the relationship between NPAs and other policy variables,
especially capital adequacy and possibly CRR/SLR, should be
examined and modelled - in fact, a model for NPAs is essential in
order for policy makers to be able to assess the implications of NPAs
and perhaps optimise the level of NPAs.
References
Khadekar, P.S. (2012). Performance of Non-Performing Assets in
India. Aweshakar Research Journal, 13(1), 136-144.
Murari, K. (2014). Comparative Evaluation of Non-Performing
Assets of Indian Banks: A Study of Public and Private Sector
Banks. Asian Journal of Research in Banking and Finance 4(5),
232-247.
Paul, P., Bose, S.K., and Dhalla, R.S. (2011). Efficiency
Measurement of Indian Public Sector Banks: Non-Performing
Assets as Negative Output. Asia Pacific Journal of Finance &
Banking Research, 5(5), 38-46.

A Study of Non-Performing Assets in the Indian Banking Industry
22
Murthy, K.V.B. and Gupta, L. (2012). Conduct of Commercial
Banking in India: A Study of Non-performing Assets. Finance
India, 26(3), 781-802.
Vadivalagan, G. and Selvarajan, B. (2013). Impact of Non-
Performing Assets (NPAs) towards Liquidity of Banks in India.
Finance India, 27(1), 147-161.
Veerakumar, K. (2012). Non-Performing Assets in Priority Sector: A
Threat to Indian Scheduled Commercial Banks. European
Journal of Economics, Finance and Administrative Sciences, 93,
6-23.
Appendix
Sector-Wise NPAs of Domestic Scheduled Commercial Banks 2011-13
Source: Report on Trends and Progress of Banking in India, 2012-2013

23
MANAGEMENT TODAY
-for a better tomorrow An International Journal of Management Studies
home page: www.mgmt2day.griet.ac.in Vol.5, No.1, January-March 2015
Bridging Gap between Experience and Theory with Reference to the
Triarchic Model of Education (Connecting Experience, Logic and Passion in
the Teaching-Learning Process in B-Schools)
Umashankar, K1 and Ranganatham, G2
1Faculty, Dept. of Behavioural Science, Manipal University, Bangalore Campus, Bangalore 2Assistant Professor, Dept. of Commerce, Sanjay Gandhi Govt. Degree College, Piler, Chittoor (Dt.), A.P.,
A R T I C L E I N F O Article history: Received 03.03.2015 Accepted 31.03.2015 Keywords:
triarchic model, gurukula system, holistic
budding professional, emotive training,
self-hypnosis method.
A B S T R A C T
Nowadays, the industries are undergoing a tremendous transformation in terms of their interaction
with the market and the competition level is also spurning due to multidimensional expectations
from the consumer market. Consequently, the industries also expect their human resources to be
highly prodigious as they constantly interact with the market or consumer and responsible for
evaluating, understanding and synthesizing the consumer requirements. As a consequence, the B-
Schools, the portals producing the quality human resource, in India has a prominent role in
identifying the needs of Industry and customize their pedagogy in order to bridge the gap between
industry expectations and the skill matrix of each budding professional. However, the teaching-
learning processes is purely connected with cognition level of the students which differ from
student to student. Further, one of the major challenges in postgraduate business education is not
just the transfer of knowledge but evolve a passionate, diligent and virtuous professional in every
postgraduate student. In this paper, the author propagates a new theory Triarchic Model of
Education, which can be implemented in B-Schools. The theory is being trichotomic dimension
which involves kinesthetic, intellectual and emotive training on the lines of contemporary industry
expectations. Further, the theory deriving its essence from the Triarchic Model of Intelligence
(Componential, Experiential and Practical) emphasizes on building a holistic individual who not
only has loads of knowledge but also the passion to work, intellect to evaluate and physical health
to drive.
Introduction
The Cambridge dictionary defines education as “the act or process of
imparting or acquiring general knowledge, developing the powers of
reasoning and judgment, and generally of preparing oneself or others
intellectually for mature life”. In the light of this definition, it can be
inferred that the education is a process that helps an individual to train
his/her intellectual skills and gain sufficient knowledge to face day to
day professional or personal challenges in life. Indeed, the role and the
vitality of education has been perpetually debated and refined since the
ancient ages of human civilizations. The oldest universities like
Platonic (Plato) Academy in Athens, Periatetic (Aristotle) school,
Greece, Nalanda (India), Taxila (India), etc… have been significant
learning centers for the pupils, wherein, the pupils were trained on
various physical and social sciences based on the prevailing societal
systems. In continuation, the same genre of education was carried
forward across the ages while adopting some changes in curriculum
and pedagogy.
-----------------------------------------------------------------------------------------------------
Responsibility of Contents of this paper rests upon the authors
and not upon GRIET publications
ISSN: 2348-3989 (Online)
ISSN: 2230-9764 (Print)
Doi: http://dx.doi.org/10.11127/gmt.2015.03.04
pp.23-27
Copyright@GRIET Publications. All rights reserved.

Bridging Gap between Experience and Theory with Reference to the Triarchic Model of Education …
24
In addition, the education system that prevailed in the Vedic India
was completely based on the Brahmanic Texts like Vedas, Upanishads,
Aryankas and Smritis. Besides, the ancient intellectual texts like
Manu’s Manusmriti, Kautilya’s Arthashastra, Patanjali’s Yogasutras,
etc… occupied a predominant position in terms of educating the
pupils. The predominant goals of education during the ancient days
were:
Character Building
Employable Skills
Life skills
Ensuring Discipline
Cultivating Passion for work
Infusing human and spiritual values
Furthermore, the ancient education was characterized by
experience based teaching-learning process except in few areas like
recitation of the Vedic mantras and the students were expected to be in
close contact with the teacher. Hence, the teacher had wide scope of
influencing the students’ personality.
Challenges in Present Education System
In India, the Gurukula System of Education emphasized on the
importance of experiential and experimental learning which was
embedded in their pedagogy. Wherein, every student was given the
education which helped them to make their livelihood and gained
applied intellectual knowledge. However, the education system in
India underwent immense metamorphosis through adopting
continental system of education during 19th century. In contemporary
India, the demand for skilled human resource has been increasing to
meet the competitive heights of business. As a result, there is a
tremendous pressure on the academic field to produce the effective
human resource with employable skills but not merely quixotic human
resource or savants with full of theoretical erudition.
A close observation into the present education system reveals that
there is a huge gap between the human resource produced by the
academia and the industry requirements. Supporting this statement, the
survey reports of The Confederation of Indian Industry (CII) reveal
that 80% of the postgraduates of management studies (having the
average score of 60% in their academics) are not fit for employment
(2000-2011). However, this revelation also infers that there is a
dichotomy between the students’ academic proficiency and their work
proficiency. Once Mahatma Gandhi quoted that the very purpose of
education will be defeated if the education fails to earn livelihood for
the pursuant. Indeed, this issue has been a major concern in the
prevailing education system of India. Hence, the transformation or
revolution should take place in terms of redesigning the curriculum and
pedagogy in order to enable the students acquire employable and life
skills.
In addition, the students of Management are well groomed over
their external disposition and other cognitive intelligence; however,
the students are naïve in terms of dealing with stress and work pressure
which gradually hampers their zeal to work and their work
effectiveness. It is quite palpable that most of the professionals suffer
tragic breakdown in terms of their psychological and physiological
well-being. As a result, their interpersonal relationships are strained
and their leadership traits are handicapped.
Objectives of the Paper
To understand the applicability of Triarchic Model of
Education with reference to the contemporary education
system in Indian B-Schools
To throw light on some training tools to execute the
Triarchic Theory
To make business education evolve holistic
professionals at the academic portals
Understanding Triarchic Model of Education
In the light of time-tested educational philosophies of the world
and the empirical research that was undertaken in the field of
Academic-industry domain, the author of this research paper presents
and advocates Triarchic Model of Education which incorporates the
components like Body, Mind & Soul. Besides, the author of this
research paper refers to the Triarchic Theory of Intelligence by
Sternberg in which he incorporates three components of intelligence
like Creative, Analytical and Practical Intelligence. In this theory,
Sternberg propagates that the knowledge gaining might happen
through passionate inclination (Creative Intelligence), logical
reasoning (Analytical Intelligence), and experiencing knowledge
(Practical Intelligence).
In the light of Sternberg’s theory of intelligence, the model infers
that the process of education should involve and connect the trinity of
an individual: Body, Mind and Soul. Once Plato rightly stated
“Knowledge which is acquired under compulsion obtains no hold on
the mind”.
Figure: 1. Triarchic Model of Education
In this paper, the three components of the model have been defined
in order to better understand the application of the theory:
1. Soul: the English dictionary defines soul as “the emotional
part of human nature; the seat of the feelings or sentiments”.
In this research paper, Soul also refers to one’s passionate
inclination to gain knowledge or skills.
2. Mind: The Dictionary of Psychology defines Mind as “the
element, part, substance, or process that reasons, thinks,
feels, wills, perceives, judges, etc.” In this research paper,
the author also refers to the analytical part of human brain
has power of logical reasoning.
3. Body: Although the dictionary, in their definition, limits the
body only for the physical essence, the author of this
research paper defines body as “an entity that reciprocates
to the activities of neurons in the mind and consequently
affecting the thought processes of the mind.” As Descartes,
French philosopher and mathematician rightly said that “the
mind and the body communicate with each other through a
small structure at the base of the brain called the pineal
gland.”
The above definitions of the three components help in better
understanding the model and its practical implications during the
Soul
MindBody

Management Today Vol.5, No.1 January-March 2015
25
process of education and it also guides an ideal teacher-student
interface for the productive outcome of teaching-learning activity.
Application of Triarchic Model of Education in the Contemporary
B-schools
It is an evident fact that the knowledge transfer between teacher
and student in the academic portals has been quite insipid. Moreover,
the current pedagogical design brings in great intensity of compulsion
on the students. As a result, the students lose their enthusiasm in
learning or sharpening their skills. Indeed, the students’ inertia towards
learning will definitely lead to a great disaster wherein the talent supply
chain might be greatly damaged as the students will turn out to be mere
book worms. Hence, it is essential for the academia to design the
curriculum and pedagogy that could enhance the learning spirit among
the students and sharpen their employable skills.
The Triarchic Model of Education attempts to promote
enthusiastic learning ambience by adopting the body-mind-soul
concept. As Mahatma Gandhi opined “True education must
correspond to the surrounding circumstances or it is not a healthy
growth”, the curriculum or pedagogy should aim at aligning the
academic proficiency with the prevailing demands in the industry.
However, a teacher’s role in achieving the objective of Triarchic
Theory is very significant as the teacher is an indispensable personage
in terms of realizing the prime objective of the prescribed model.
Further, a teacher who is adopting this model in their curriculum
delivery should be aware of the following existential facts and he/she
may be accurately gauge the learning outcome of students:
1. Body: It is said that healthy body is the sanctum of soul.
Here, the body that is perfectly tuned and sanctified can be
repository of healthy mind. Moreover, the body plays an
important role in terms of generating healthy emotions and
producing healthy attitude towards life and the world
around. Hence, the primary objectives of holistic education
should also incorporate the knowledge enrichment aligned
with physical activities. Body being the responding agent of
mind, it can represent well the emotions or thoughts
produced by the mind effectively. To quote Swami
Vivekananda “If there is no strength in body and mind, the
Atman cannot be realized. First you have to build the body
by good nutritious food—then only will the mind be strong.”
This statement emphasizes on the inter dependence between
body and mind. Further, the education psychology with
reference to the VAK (Visual, Auditory and Kinesthetic)
theory of Neil Fleming propagates that the learning styles of
students differ from person to person. In this theory,
kinesthetic style has been one of the prominent styles that
focus on physical aspects involved during the learning
processes.
2. Mind: Swami Vivekananda had an immense faith in the
absolute powers of human mind which can accomplish
anything in this world. Therefore, he said “All knowledge
that the world has ever received comes from the mind; the
infinite library of the universe is in our own mind.” It is
imperative that mind has the immense power within;
however, the teacher plays an important role in making the
students realize their power within. Hence, the education
system instead of focusing on mere teaching or content
download, it should help the students to realize their own
potentials while incorporating appropriate pedagogical tools
involving knowledge enrichment, analytical abilities,
industry oriented skills or job skills and life skills. Moreover,
it will also help in generating positive emotions and fair
outlook.
3. Soul: As it is defined, soul, in this context, does not have any
theological references and it purely the psychological
concept. Indeed, the soul is referred to the cognitive domain
that emanates passion for doing or learning something. Once
Albert Einstein stated “It is the supreme art of education
system to awaken joy in creative expression and
knowledge.” This statement justifies the author’s notion that
the academic experts should design their pedagogy such that
it should generate passion in students for learning and
gaining applied knowledge. As a result, the students may be
more creative in their learning endeavours and passionate to
gain knowledge or groom their skills in an academic
ambience. Indeed, it is this passionate learning that
differentiates between mere efficiency and effectiveness. If
the ingredient called Passion or Soul is infused during the
process of learning, definitely, it can create miracles.
The Strategies Stimulate the Trinity
1. Body: As it is defined earlier, the physical essence of a
student is being very much responsive to the information
processing in the brain. The students who learn through
kinesthetic activities feel a sense of rejuvenation and their
cognitive receptivity will be high. Hence, the learning
activities involving out-door learning and training games
will be of great impact on the students.
2. Mind: The mind encompassing the right hemisphere of the
brain is the seat of analytical/logical thinking and it is very
much receptive when it is posed with analytical/intellectual
challenges. The facilitator may adopt the strategies which
may enable the students to think and generate solutions to
the given challenges.
3. Soul: As it is inferred, Soul responds to the emotive actions
or reaction in the classroom like empathy, encouragement
and intrinsic rewards. Example: the facilitator may express
his/her appreciation towards the best performance in the
class and this piece of appreciation will help the students to
take up the learning at higher levels with passion not by
compulsion.
The management games suggested above for the students of
MBA are not centralized for any one criteria instead the games are
interlinked to trinity of concepts Body-Mind-Soul. However, the
facilitator plays a major role in establishing a link among the concepts
and the effectiveness of each game depends on how the facilitator
brings out the learning outcome touching all the three areas. The
teaching-learning strategies recommended above may be illustrative
but not descriptive as the there are many teaching aids like self-
discovery methods, peer-interaction method, experience based
learning strategies, brain simulation strategies etc.
Further, the suggested training tools have been empirically tested
in the classroom scenarios of Manipal Academy of Banking (the
academy that trains the probationary officers of various private and
nationalized banks across India) wherein most of the tools are
experimented as per the pedagogical design recommended by the
Department of Training and Development.

Bridging Gap between Experience and Theory with Reference to the Triarchic Model of Education …
26
Suggested Training Tools for Implementing the Triarchic Model of Education
Figure: 2.Training Tools for Implementing Triarchic Model
Psychological Implications of the Training Tools
According to the learning theory VAK formulated by Fleming, the
cognitive information processing differs from person to person. Hence,
Dr. Fleming infers that the cognitive learning styles drastically differ
in the classroom set up and the facilitator has to device the
methodology and tools that meet the learning style of each student of
MBA. Further, Howard Gardner’s Theory on Multiple Intelligences
encompasses various cognitive styles of a student based on Body
(Kinesthetic), Mind (Logical-mathematical) and Soul (Existential)
concept.
Further, the teaching pedagogy may include some of the time
tested psychological tools like Cognitive Behaviour Therapy, Self-
hypnosis Strategies and Personal Counseling which are to be
administered by an experienced psychologist. Indeed, these
psychological tools help in crystallizing the young minds and the
neutralization of mental ailments that hamper the effectiveness of
learning.
According to the Self-determination Theory, the psychologists
opine that the intrinsic motivation is a self-driven force within every
individual to accomplish something and they opine that the intrinsic
motivation is associate with the tasks that the individual is passionate
to accomplish. In continuation, the Triarchic Model advocates on
synchronizing the intrinsic motivation of the students with that of
learning in the academic setup. Wherefrom, the learning process will
be treated as monotonous task and in brief, the learning ventures
become a celebration.
In the light of psychological deliberations on human cognition, the
theory Triarchic Model of Education can be better administered in B-
Schools by executing the suggested training tools that touch upon the
preferred learning style of each student of MBA. Consequently, the
training effectiveness will increase adding to the classroom
effectiveness and the purpose of building holistic professional can be
achieved.
Recommended Academic and Infrastructural Requisites
As discussed earlier, the Triarchic Model recommends the
teaching pedagogy to be student-centric and aims incorporating
innovative teaching methodology with competent teaching fraternity
with the right attitude. Therefore, the B-Schools must fulfill the
following prerequisites for the application of the Triarchic model:
The pedagogy should be on the lines of training or
facilitation rather than mere classroom lecture
The teaching fraternity with the holistic attitude and
strong inner drive to transform the young minds
The teacher and student ratio of 1:30 approximately
Sufficient financial aid to carry out Out-bound-learning
programs
Smart Classrooms
Ambience supporting the spiritual practices like yoga
and meditation
Well-equipped knowledge center
A competent clinical psychologist / counselor
The state-of-art infrastructure for promoting physical
well-being
Conclusion
As it is reflected in figure 3, the Triarchic Model of Education is a
triple edged tool that focuses at evolving healthy body, sound mind
with high analytical thinking and positive attitude, and generating
passion in the students during the process of learning that will help
them to passionately pursue their studies and find the applicability of
their learning in the real life situations. Moreover, the B-Schools may
generate the holistic business professionals in their academic portals
and gift such precious human resource to the industry.
In addition, this model will also help the teacher to frame their
pedagogy in order to make their training/teaching sessions more
ignited while helping the students to experience, logically correlate,
and passionately apply their learning. The students also experience all
the three dimensions of their intellect and groom their intellect to
become a holistic professional. Since the Triarchic Model of Education
aims at creating intrinsic motivation among the students to learn, the
students will never feel the sense of monotony during the learning
process. Therefore, learning never becomes a compulsion but
celebration rather.
Body Mind Soul
Out-bound Learning Computer Games (Capitalism
II, Monopoly)
Meditation
Team Building Games Business Simulation Games Empathy Training
Outdoor/Indoor Games Strategic Games Fine Arts

Management Today Vol.5, No.1 January-March 2015
27
Figure: 3. Advantages of Triarchic Model of Education in B-
Schools
References
Brian M. Alman, Peter T. Lambrou. (1983). Self-Hypnosis: The
Complete Guide to Better Health and Self-change. Philadelphia:
Brunner/Mazel Pub.
Chakka, R., & Kulkarni, G. T. (2010). Total Quality Management in
Pedagogy (TQM_P): An Update. Indian Pharm. Educ. Res. 44(4),
Oct - Dec.
Datar, M. Srikant, Garvin, A. David & Cullen, G. Patrick. (2010).
Rethinking the MBA: Business Education a Crossroads. Boston:
Harvard Business Press.
Dunn, R., & Dunn, K. (1999). The complete guide to the learning styles
in service system. Boston: Allyn& Bacon.
Gardner, H. (1983). Frames of Mind: The theory of multiple
intelligences. New York: Basic Books.
Gardner, H. (1993). Multiple intelligences: The theory into practice.
New York: Basic Books.
Hoffman, Stefan G.; Smits, Jasper A. J. (2008). Cognitive-Behavioral
Therapy for Adult Anxiety Disorders. The Journal of Clinical
Psychiatry, 69 (4): 621–32. doi:10.4088/JCP.v69n0415
Kremer, J., Sheehy, N., Reilly, J., Trew, K., &. Muldoon, O. (2003).
Applying social psychology. New York, NY: Palgrave. Macmillan.
Lazear, David. (1991). Seven ways of teaching: The artistry of
teaching with multiple intelligences. Palatine, IL: IRI Skylight
Publishing Inc.
Penthoi, A. K. & Dash, S. (2005). Indian Higher Education in the Era
of Globalization: Challenges & Quality management strategies.
University News.
Pierson, F. C. (1999). The Education of American Businessmen. New
York: McGraw Hill.
Robert J. Sternberg. (1985). IQ: A Triarchic Theory of Human
Intelligence. London: Cambridge University Press.
Vivekananda. (1985). Complete Works of Swami Vivekananda (8
Volumes). Advaita Ashrama, Kolkata.
1. Dr. K. Umashankar has three master’s degrees in English
Literature, Linguistics and Industrial Psychology, and PhD in
English. Besides, I have been in this teaching-training domain for
past 12 years and I have trained teachers, bank officers, corporate
professionals and the students of MBA across South India. In
addition, I was with Acharya Institute of Management and Sciences
for 6 Years as Asst. Professor and Head, Dept. of English. I am
currently working for Manipal University Bangalore Campus and
the job role includes FDPs for the faculty and training POs of
various banks on Communication and Behavioural Aspects. I have
also been a resource person for the Dept. of English, Bangalore
University for past 3 years. I am passionate about doing research in
the fields of human psychology, Language and literature and I have
produced more than 17 research articles on these areas which are
published in the reputed national and international journals.
2. Dr. G.Ranganatham has two masters’ degrees in Commerce
and Mangement and Ph.D. in Commerce. And I received Andhra
Bank Gold Medal for securing First rank in M.Com. Cleared UGC-
NET in Commerce and Management. I have 10 years of teaching
and Research experience. Areas of interest include, Financial
Accounting, Financial Management, International Financial
Management, Small and medium Scale Enterprises and
Entrepreneurship. Published policy relevant articles in National and
International journals. Doctoral abstract on PHD Thesis had
published in Finance India Journal, Indian Institute of Finance, New
Delhi. Presently working as assistant professor in the Dept. of
commerce, S. G. Govt. Degree College, Piler, Chittoor Dist.
•It keeps the body healthy
•Kinesthetic movements during the learning situations (Activity based) activates the brain.
Body
•It is easy for the activated and rejuvenated mind for understanding the delivered knowledge
•The mind will be more anlaytical and logical
Mind
•Infusion of passion by creating amiable learning atmosphere andbringing more joy in learning.
•As a result, the students will apply their knowledge in their professional or personal life
Soul

28
MANAGEMENT TODAY
-for a better tomorrow An International Journal of Management Studies
home page: www.mgmt2day.griet.ac.in Vol.5, No.1, January-March 2015
Indian Stock Market and FIIs Investments – A Causality Study
Sridhar Ryakala
Research Scholar, Department of Commerce & Business Management, Kakatiya University, Warangal, Telangana, [email protected]
A R T I C L E I N F O Article history: Received 09.03.2015 Accepted 31.03.2015 Keywords:
Indian stock market, FIIs, investments,
causality study
A B S T R A C T
With small beginnings in the early nineteenth century, Indian stock market has risen to great
heights. The Government of India has formulated various policies to encourage the flow of foreign
capital into India. The Indian stock market has witnessing an increasing participation of foreign
institutional investors, which assumed to have steadily controlling the investment scenario of the
stock market. The impact of huge capital flows by them in the Indian stock market has taken the
attention of the policy makers and economists during the last decade. The present paper is an
attempt to analyze the casual relationship (both long run and short run) between Indian Stock
Market and FIIs investments.
Introduction
India has emerged as one of the most favored destinations for global
investment. This is evident from a sharp increase in the number of
foreign institutional investors (FIIs) registered with SEBI from 18 in
1993 to 882 by March 2006 and reached to 1,757 by the end of March
2013. Indian economy is growing at a rapid pace and matching with
this economic growth rate, India has also seen an incredible flow of
investment by FIIs and in fact, the FIIs have been playing a key role
ever since their entry into the country during the early 1990s. FIIs
formed nearly 70 percent of foreign investment (FDI plus net portfolio
equity flows) in India, whereas in China and Brazil the percent was 26
and 30 respectively for 2005 (Global Development Finance Report,
2006). According to MSCI Index, Indian stock market is one of the
best performing market in the global emerging markets.
The growth of foreign institutional investors in the market
possesses its own set of advantages along with certain problems. FIIs
carry a sense of ill repute since at the indication of crisis this flows into
reverse direction. Dornbusch and Park (1995) and Richards (2002)
disclosed about apprehension with the entry of FIIs in their studies
suggesting that they are positive feedback traders i.e., the traders who
purchase when the market increases and sell when the market falls, this
act as destabilizing for the reason that the sales by FIIs lead to the stock
market fall further and their buys increase the stock market. It is
essential to analyze that whether the foreign institutional investors
have a stabilizing or a destabilizing control on the stock markets. The
unreliability of FIIs emanates from their very nature since the portfolio
managers have the competence and ability to restructure and rebalance
their portfolios dynamically across the countries (Hamilton, 2005).
Gordon and Gupta (2003) found that causation running from FII
inflows to returns in BSE and FIIs act as market makers and book
profits by investing when prices are low and selling when they are
high. Banaji (2000) emphasized on the fact that the capital market
reforms like improved market transparency, automation,
dematerialization and regulations on reporting and disclosure of
standards were initiated because of the presence of the FIIs.
Thus, the increasing influence of foreign institutional investors
forms an essential component of the Indian stock market behavior and
it is essential to analyze that whether these foreign institutional
investors have a stabilizing or destabilizing control on the stock market
operations. Many research studies have examined the interaction
between foreign institutional investors and Indian stock market with
widespread econometric methods. A wide literature is available on
-----------------------------------------------------------------------------------------------------
Responsibility of Contents of this paper rests upon the authors and
not upon GRIET publications
ISSN: 2348-3989 (Online)
ISSN: 2230-9764 (Print)
Doi: http://dx.doi.org/10.11127/gmt.2015.03.05
pp. 28-32
Copyright@GRIET Publications. All rights reserved.
Management Today Vol.5, No.1 January-March 2015
29
causal relationship between foreign institutional investors’
investments and Indian stock market returns but, most of the existing
studies performed on Indian context were based on the different time
segments and mostly on the basis of the returns of the stock market.
There is dearth of studies examining the long run and short run
causality between the foreign institutional investors’ investments and
the Indian stock market.
Objective of the Study
The present study is an attempt to analyze the co-integration and
consequently to disclose the both long run and short run causal
relationship i.e., unilateral or bilateral between foreign institutional
investors’ investments and the Indian stock market.
Hypothesis of the Study
The present study aims at testing the following hypothesis:
Ho: There is no causality between foreign institutional investors’
and Indian stock market.
Ha: There is causality between foreign institutional investors’ and
Indian stock market.
Data and Research Methodology
The study is based on the monthly time series data of Foreign
Institutional Investors’ (FIIs) investments and Advances to Decline
Ratio (ADR) of BSE and NSE. Further the FIIs investments Purchase
to Sales Ratio (PSR) are calculated by the following method:
FIIPSRt= log (Pt/St)
Where, FIIPSRt is the monthly purchase to sale ratio of foreign
institutional investments and Pt denotes the monthly FIIs purchases,
whereas St denotes the monthly FIIs sales. The calculated monthly
purchase to sales ratio of foreign institutional investors’ investments is
represented by FIIPSR.
The breadth of the market is the term often used to study the
advances and declines that have occurred in the stock market.
Advances means the number of shares whose prices have increased
from the previous day’s trading and declines indicate the number of
shares whose prices have fallen from the previous day’s trading. The
ADR captures the trend of the entire market in explicit manner.
Therefore, the study uses ADR for empirical analysis instead of market
returns.
The ADR for BSE and NSE have been calculated on the basis of
monthly advances and declines of the respective stock exchanges
through following value:
ADRt=log (Xt/ Yt)
Where, Xt is the monthly advances of the stock exchange and Yt
denotes the monthly declines of the stock exchange. The calculated
ADR of BSE is represented by BSEADR and that of NSE is
represented by NSEADR.
The study covers a period from April, 2007 to December, 2013. To
carry out the predetermined set of objective and to test the hypothesis
the study uses the empirical tools such as Unit Root Tests, Co-
integration Tests and Vector Error Correction Model (VECM) as part
of research analysis.
Test of Normality
Many of the statistical procedures including correlation,
regression, t tests, and analysis of variance, namely parametric tests,
are based on the assumption that the data follows a normal distribution
or a Gaussian distribution (after Johann Karl Gauss, 1777–1855); i.e.,
it is assumed that the populations from which the samples are taken are
normally distributed.
Jarque-Bera (JB) test is used to test whether the variables
understudy follow the normal probability distribution. The Jarque-
Bera test of normality is an asymptotic or large sample test. This test
computes the skewness and kurtosis measures and uses the following
test statistic:
JB=n [S2/6+ (K-3)/24]
Where n=sample size, S= skewness coefficient, and K=kurtosis
coefficient. For a normally distributed variable, S=0 and K=3,
therefore the JB test of normality is a test of the joint hypothesis that S
and K are 0 and 3 respectively.
Unit Root Test (Stationarity Test)
Empirical research work based on time series data assumes that the
underlying time series is stationary. Broadly speaking a data series is
said to be stationary if it’s mean and variance are constant i.e., non-
changing over time and the value of covariance between two time
periods depends only on the distance or lag between the two time
periods and not on the actual time at which the covariance is computed
(Gujarati, 2003). A time series is not stationary in the sense that it is
non-stationary time series when it has time varying mean or a time
varying variance or both. Therefore, unit root tests are conducted to
verify the stationary properties of the time series data under study. The
stationarity condition has been tested using Augmented Dickey Fuller
(ADF), Phillips – Perron (PP) and Kwiatkowski-Phillips-Schmidt-
Shin (KPSS) Tests.
Co-Integration Test
In order to verify the existence of co-integration between the
variables understudy, Johansen-Juselius (1990) Co-integration
technique is used. The precondition for the conduct of Johansen co-
integration test is that all the variables must be stationary. This method
allows the empirical determination of the number of co-integrating
relations and produces maximum likelihood estimators of the
parameters of these relations. Two test statistics namely Trace Test
Statistic and the Maximum Eigen Value Test Statistic are used to
identify the number of co-integrating vectors. Finding of co-
integration implies the existence of long-term relationship between the
dependent and independent variables. If there is at least one co-
integrating relationship among the variables, then the causal
relationship among these variables can be determined by estimating
the Vector Error Correction Model (VECM).
Empirical Analysis
1. The Normality test has been conducted for BSEADR, NSEADR
and FIIPSR. The Jarque-Bera Statistics are used for this purpose. The
results are shown in Table 3-2 along with descriptive statistics. The
skewness coefficient, in excess of unity is taken to be fairly extreme
(Chou, 1969). High or low kurtosis value indicates extreme leptokurtic
or extreme plyatykurtic (Parkinson 1987). Skewness value 0 and
kurtosis value 3 indicates that the variables are normally distributed.
As per the statistics of Table I, frequencies of all the three variables are
normally distributed.

Indian Stock Market and FIIs Investments – A Causality Study
30
Table-1: Descriptive Statistics
Particulars BSEADR NSEADR FIIPSR
Mean -0.098436 -0.119869 0.035724
Median 0.000000 -0.105361 0.035657
Maximum 2.476538 2.351375 0.361191
Minimum -2.302585 -2.302585 -0.280150
Std. Dev. 1.115463 1.003239 0.161463
Skewness 0.018013 -0.233677 0.157422
Kurtosis 2.663443 3.470023 2.197799
Jarque-Bera 0.386668 1.482779 2.506456
Probability 0.824207 0.476451 0.285581
Sum -7.973293 -9.709354 2.893633
Sum Sq. Dev. 99.54062 80.51909 2.085633
Observations 81 81 81
The results are further supported by Jarque-Bera (probability >
5%) for the three variables under study. The null hypothesis of
normality assumption cannot be rejected and concludes that all the
variables under study are normally distributed. The standard deviation
indicates that the FIIPSR is relatively less volatile as compared to that
of other two variables. The BSEADR and NSEADR are more or less
having experienced similarity in volatility.
2. Stationarity test has been conducted for BSEADR, NSEADR
and FIIPSR. A time series is said to be stationary if its mean and
variance are constant over time. ADF, PP and KPSS tests are
performed to check the stationarity of the time series. The results are
shown in Table 2 and Table 3.
Table-2: Augmented Dickey-Fuller (ADF) Test and Phillips-
Perron (PP) Test
Variable ADF Test
Statistics
PP Test
Statistics Probability
BSE(ADR) -6.951356* -6.886075* 0.0000
NSE(ADR) -6.693340* -6.721198* 0.0000
FII(PSR) -6.681872* -6.691977* 0.0000
*Denotes statistically significant at 1% and 5% levels
The critical value of ADF Statistics and PP Statistics are -4.076860
and -3.466966 at 1% and 5% level of significance respectively.
The results of ADF and PP unit root tests performed to confirm the
stationary properties of the time series data shows that the absolute
value of calculated ADF test statistic and PP test statistic is greater than
its critical value at both 1% and 5% level of significance in the time
series of all the three variables understudy. It indicates that the
integration of all the series is of order I (0) and there is no unit root.
Thus, the null hypothesis of non-stationary data cannot be established
and hence all the three series are fit for further research.
Table-3: Kwiatkowski-Phillips-Schmidt-Shin (KPSS) Test
Variable KPSS Test
Statistics
Critical Value
(1%)
Critical Value
(5%)
BSE(ADR) 0.072777 0.216000 0.146000
NSE(ADR) 0.065191 0.216000 0.146000
FII(PSR) 0.054144 0.216000 0.146000
Further in order to verify the results obtained by the ADF and PP
unit root test Kwiatkowski-Phillips-Schmidt-Shin (KPSS) test is
applied. The results of KPSS test statistics for all the three variables
understudy are less than the critical values at 1% and 5%. Therefore,
the null hypothesis of stationary is not rejected. So, all three series in
the study viz. BSEADR, NSEADR and FIIPSR are stationary and
fulfills the requirements for further research process.
3. Once it is accepted that the variables are stationary, we proceed
to study whether the series under study are co-integrated or not.
Johansen co-integration test is applied to examine the bond between
the three variables. In order to conduct the co-integration test, the
appropriate lag length of the model is determined by using Vector Auto
Regression (VAR) model. Both Akaike Information Criterion (AIC)
and Schwarz Information Criterion (SIC) have selected lag 1 as
appropriate lag for the model. Therefore, for the present model lag 1 is
selected as the appropriate lag for the conduct of the co-integration test
and for running VECM.
The results of Johansen co-integration test is given in Table 4. The
null hypothesis of r co-integrating vectors is given in column 1 of the
table.
Table-4: Johansen Co-integration Test between BSEADR,
NSEADR AND FIIPSR
Unrestricted Co-integration Rank Test (Trace)
Hypothesized
No. of CE(s) Eigen value
Trace
Statistic
Critical Value
(0.05) Probability
r = 0 0.407832 83.94920* 29.79707 0.0000
r = 1 0.283405 42.55593* 15.49471 0.0000
r = 2 0.185710 16.22966* 3.841466 0.0001
Unrestricted Co-integration Rank Test (Maximum Eigen value)
Hypothesized
No. of CE(s)
Eigen
value
Max-Eigen
Statistic
0.05
Critical Value Probability
r = 0 0.407832 41.39327* 21.13162 0.0000
r = 1 0.283405 26.32627* 14.26460 0.0004
r = 2 0.185710 16.22966* 3.841466 0.0001
*denotes statistically significant at 5%
The maximum Eigen value and trace statistics are used to deduce
whether the null hypothesis of r = 0 is rejected at 5 % level of
significance. The rejection of null hypothesis implies that there exists
at least one co-integrating vector which confirms a long run
equilibrium correlation between the three variables. We reject the null
hypothesis that r, the number of co-integrating vectors if the test
statistic is greater than the critical values specified. The results of
multivariate co-integrating vectors discloses the rejection of null
hypothesis of no co-integrating vectors under both the trace statistics
and maximum Eigen value forms of test. The probabilities for different
levels of number of co-integrated equations also confirm the rejection
of null hypothesis. Therefore may infer that there is a presence of even
more than two co-integrated equations among the three variables under
study and which confirms a long run equilibrium correlation between
the variables.
4. When there is a co-integration between series, it confirms that
there exists a long-term equilibrium relationship among the variables.
The Vector Error Correction Model (VECM) can be applied only when
there is at least one co-integration equation between the variables. As
the Johansen Co-integration test revealed that there is co-integration
among the variables understudy, we can apply VECM in order to
evaluate the short run properties of the co-integrated series. The
structure lag is chosen on the basis of Vector Auto Regression (VAR)
model using maximum criterion rule. To maintain consistency, the
same lag length has been chosen as used for co-integration test.

Management Today Vol.5, No.1 January-March 2015
31
In order to find out the long run and short run causality between
the three variables viz. FIIPSR, BSEADR and NSEADR three models
of VECM are applied.
Model A: BSEADR as dependent variable and NSEADR and
FIIPSR as independent variables.
Model B: NSEADR as dependent variable and FIIPSR and
BSEADR as independent variables.
Model C: FIIPSR as dependent variable and BSEADR and
NSEADR as independent variables.
Table-5: Results of VECM for Models A, B & C
Model
Coefficient of
First Co-
integration
Equation C(1)
Std.
Error t-Statistic Prob.
Model A -1.000235 0.187885 -5.323643 0.0000*
Model B -0.690614 0.170413 -4.052582 0.0001*
Model C -0.045502 0.039785 -1.143686 0.2565
*denotes statistically significant
Coefficient of first co-integration equation (C1) is considered to
find the long run causality between dependent variable and
independent variables. The null hypothesis of no long run causality
among the variable can be rejected when the C (1) has negative value
and is significant i.e., the corresponding probability is less than 0.05.
As per the results disclosed by the VECM for Model-A, B & C, (C1)
for both the Models A and B has negative value and its corresponding
probability is significant i.e., less than 0.05. Therefore, the null
hypothesis of no long run causality is rejected and it is confirmed that
there is long run causality running from independent variables to
dependent variable i.e., both NSEADR and FIIPSR cause BSEADR,
and FIIPSR and BSEADR cause NSEADR.
Coefficient of first co-integration equations (C1) has negative
value for Model C, but its corresponding probability is more than 0.05,
which is insignificant. Therefore, the null hypothesis of no long run
causality cannot be rejected and hence confirmed that there is no long
run causality running from BSEADR and NSEADR to FIIPSR.
In order to analyze the short run causality from the independent
variables to dependent variable Wald test is employed. Lagged
Coefficients of independent variables in the Model A i.e., NSEADR
and FIIPSR are represented by C (4) and C (5) respectively, whereas
C (4) and C (5) in the Model B represents that of lagged coefficients
of FIIPSR and BSEADR respectively. For Model C Lagged
coefficients of independent variables BSEADR is C (4) and NSEADR
is C (5). The null hypothesis of no short run causality from independent
variables to dependent variables is denoted by C (4) =0 and C (5) =0.
The null hypothesis is tested with the use of Wald test, the results of
which are presented in Table VI.
Table-6: Results of Wald Test for Models A, B & C
Model Null
Hypothesis
Test Statistic
Value Probability
Model
A
C(4)=0 -1.376788 0.1728
C(5)=0 1.530870 0.1301
Model
B
C(4)=0 2.473027 0.0157
C(5)=0 -0.146570 0.8839
Model
C
C(4)=0 0.074071 0.9412
C(5)=0 0.633281 0.5285
The null hypothesis of no short run causality between the variables
can be rejected when the Wald test statistic is significant (less than
0.05). As per results disclosed in the Table VI the test statistic for C
(4) of Model B is less than 5% and the null hypothesis can be rejected.
Hence, the alternate hypothesis of short run causality is accepted.
Therefore, it confirms that there is short run causality from FIIPSR to
NSEADR. Whereas, the results of the test statistic for all the three
models except C (4) of Model B, is more than 0.05, and the null
hypothesis cannot be rejected. Therefore, it confirms that there is no
short run causality from independent variables to the dependent
variables under the three models. It can be concluded that FIIPSR
cause NSEADR in the short run and there is no short run causality
running from BSEADR and NSEADR to FIIPSR.
Conclusion
This study examined the dynamic interaction between FII’s
Investments and Indian Stock market. The statistical analysis reveals
that the there is a co-integration between foreign institutional
investors’ investments and the Indian stock market; this implies that
the variables are coupled together for long term association. The
Vector Error Correction Model (VECM) reveals uni-directional
causality running from foreign institutional investors’ investment to
Indian stock market in both long-run as well as in the short-run, which
implies that the FII’s are influencing the price changes in the Indian
stock market, but they are not influenced by the later. Whereas, there
is bi-directional causality running between BSE and NSE in long- run,
but there is no short run causality between them.
Reference
Bansal, Anand and Pasricha, J. S. (2009). Foreign Institutional
Investors’ Impact on Stock Prices in India. Journal of Academics
Research in Economics, Vol.1, No.2, pp.181-189.
Chakrabarti, Rajesh. (2001). FII Flows to India: Nature and Causes.
Money and Finance, ICRA Bulletin, Vol.2, No.7, pp.51-81.
Dickey, D. and Fuller, W. A. (1979). Distribution of the Estimates for
Autoregressive Time Series with a Unit Root. Journal of American
Statistical Association, Vol.74, pp.427-431.
Engle, R. F., & Granger, C. W. J. (1987). Co-integration and Error
Correction: Representation, Estimation and Testing.
Econometrica, Vol.55, No.21, pp.251-276.
Gorden, James and Gupta, Poonam (2003). Portfolio Flows into India:
Do Domestic Fundamentals Matters? IMF Working Paper
No.WP/03/20.
Granger, C. W. J. (1969). Investigating causal relations by econometric
models and cross-spectral methods. Econometrica, Vol.37,
pp.424-438.
Johansen, S. (1988). Statistical analysis and co integrating vectors.
Journal of Economic Dynamics & Control, Vol.12, pp.231-254.
Johansen, S., & Juselius, K. (1990). Maximum likelihood estimation
and inference on co-integration with applications for the demand
for money. Oxford Bulletin of Economics and Statistics, Vol.52,
pp.169-210.
Phillips, P. C. B., & Perron, P. (1988). Testing for unit root in time
series regression. Biometrica, Vol.75, pp.335-346.
Srinivasan Palamalai, Kalaivani Mariappan, and Christopher
Devakumar. (2014). On the Temporal Causal Relationship

Indian Stock Market and FIIs Investments – A Causality Study
32
between Macroeconomic Variables: Empirical Evidence from
India. http://sgo.sagepub.com/
Sunita Mehta and Goyal, S. K. (2014). An Analytical Study on Causal
Relationship between Institutional Investment and Indian Stock
Market. Gitam Journal of Management. Vol.12, No.1, pp.205-215.
Thenmozhi, M. and Kumar, M. (2009). Dynamic Interaction among
Mutual Fund Flows, Stock Market Return and Volatility. NSE
Working Paper No.50.
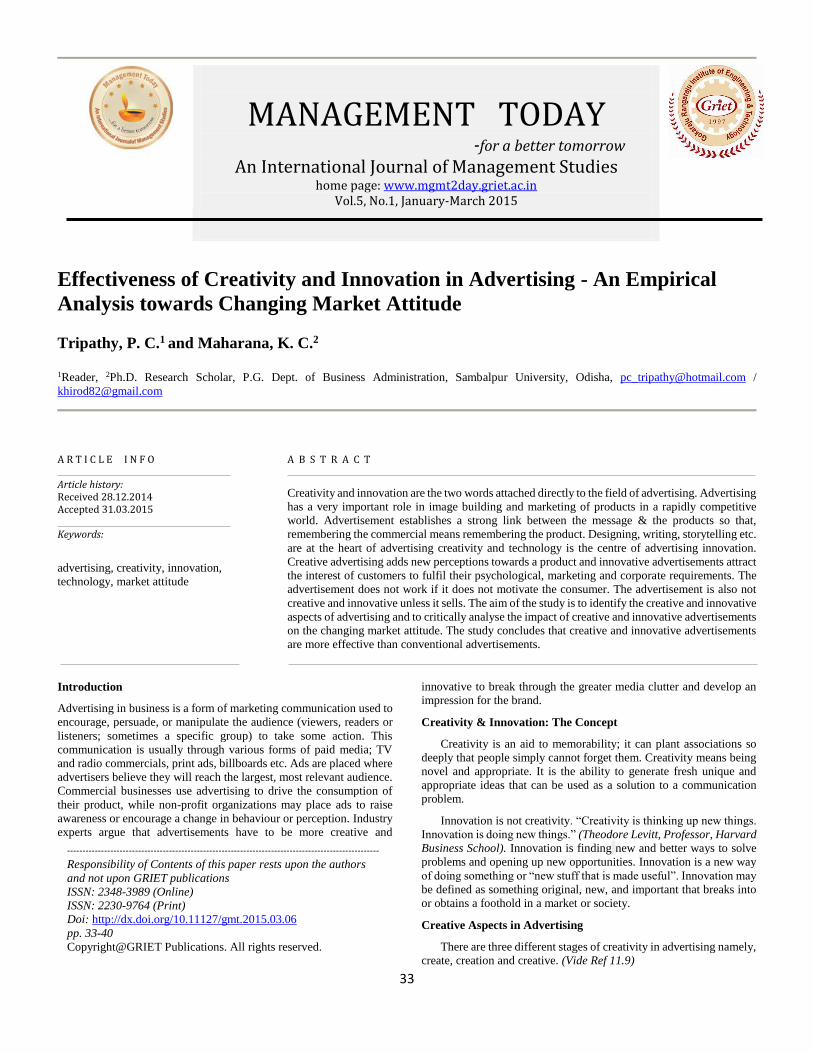
33
MANAGEMENT TODAY
-for a better tomorrow An International Journal of Management Studies
home page: www.mgmt2day.griet.ac.in Vol.5, No.1, January-March 2015
Effectiveness of Creativity and Innovation in Advertising - An Empirical
Analysis towards Changing Market Attitude
Tripathy, P. C.1 and Maharana, K. C.2
1Reader, 2Ph.D. Research Scholar, P.G. Dept. of Business Administration, Sambalpur University, Odisha, [email protected] /
A R T I C L E I N F O Article history: Received 28.12.2014 Accepted 31.03.2015 Keywords:
advertising, creativity, innovation,
technology, market attitude
A B S T R A C T
Creativity and innovation are the two words attached directly to the field of advertising. Advertising
has a very important role in image building and marketing of products in a rapidly competitive
world. Advertisement establishes a strong link between the message & the products so that,
remembering the commercial means remembering the product. Designing, writing, storytelling etc.
are at the heart of advertising creativity and technology is the centre of advertising innovation.
Creative advertising adds new perceptions towards a product and innovative advertisements attract
the interest of customers to fulfil their psychological, marketing and corporate requirements. The
advertisement does not work if it does not motivate the consumer. The advertisement is also not
creative and innovative unless it sells. The aim of the study is to identify the creative and innovative
aspects of advertising and to critically analyse the impact of creative and innovative advertisements
on the changing market attitude. The study concludes that creative and innovative advertisements
are more effective than conventional advertisements.
Introduction
Advertising in business is a form of marketing communication used to
encourage, persuade, or manipulate the audience (viewers, readers or
listeners; sometimes a specific group) to take some action. This
communication is usually through various forms of paid media; TV
and radio commercials, print ads, billboards etc. Ads are placed where
advertisers believe they will reach the largest, most relevant audience.
Commercial businesses use advertising to drive the consumption of
their product, while non-profit organizations may place ads to raise
awareness or encourage a change in behaviour or perception. Industry
experts argue that advertisements have to be more creative and
innovative to break through the greater media clutter and develop an
impression for the brand.
Creativity & Innovation: The Concept
Creativity is an aid to memorability; it can plant associations so
deeply that people simply cannot forget them. Creativity means being
novel and appropriate. It is the ability to generate fresh unique and
appropriate ideas that can be used as a solution to a communication
problem.
Innovation is not creativity. “Creativity is thinking up new things.
Innovation is doing new things.” (Theodore Levitt, Professor, Harvard
Business School). Innovation is finding new and better ways to solve
problems and opening up new opportunities. Innovation is a new way
of doing something or “new stuff that is made useful”. Innovation may
be defined as something original, new, and important that breaks into
or obtains a foothold in a market or society.
Creative Aspects in Advertising
There are three different stages of creativity in advertising namely,
create, creation and creative. (Vide Ref 11.9)
-----------------------------------------------------------------------------------------------------
Responsibility of Contents of this paper rests upon the authors
and not upon GRIET publications
ISSN: 2348-3989 (Online)
ISSN: 2230-9764 (Print)
Doi: http://dx.doi.org/10.11127/gmt.2015.03.06
pp. 33-40
Copyright@GRIET Publications. All rights reserved.

Effectiveness of Creativity and Innovation in Advertising - An Empirical Analysis towards Changing Market Attitude
34
Create: It means to bring something in to being and originate a
new and unique idea.
Creation: After the process of creating or originating, create a
new idea original product of human invention or imagination
leads to creation.
Creative: In order to understand the creativity or being creative
can be translated into seeing same thing as everybody else but
thinking differently.
For advertising being, creative three aspects are universally most
accepted:
The creative process. It means receiving most of attention,
focusing on mechanism & phases involved during the process one
partakes in a creative act.
The creative person. This relates to the personality traits of
creative people who are responsible and central to this process.
The creative situation. In this situation, the criteria &
characteristics of creativity are considered to provide workable,
acceptable and practical aspects of the situation.
Innovation in Advertising
Innovation in advertising provides advertising, communications,
consultation, branding, ad designing, web development, media
production, and ad placement. It is more fundamentally; about how
media businesses approach the way, they work with clients. With the
demands of the modern marketers changing and B2B buying habits
shifting dramatically, media teams need to be very innovative in the
way they engage their clients. The three trends as most important in
the ideation of innovative advertising concepts are participatory
culture, platform thinking & brand utility. (Vide Ref 11.3)
Participatory Culture: It is about social connections with people.
Prizes are not the only way to make people feel their contributions
matter. Participation should be valuable for everyone.
Platform Thinking: It refers to a non-linear but holistic approach
to storytelling. When assessing the importance of platform
thinking, one must consider that the internet is now everywhere.
The current media landscape is experiencing a rapid divergence in
the types of devices we use, but the content spread across these
devices is similar, yet packaged differently. The day will soon
come when our devices will be smart enough to detect content and
automatically fit it for the particular device it is being accessed
from.
Brand Utility: In a world of infinite alternatives, even quality can
become a commodity. Brands that push out products of similar
quality to their competition need to find new ways to differentiate.
This fact challenges marketer to ask the question, "What more can
I do to add value?"
Review of Literature
Piyush N. Marthak (2013) attempted to explore the relationship
among the creative advertisements and advertisement effectiveness in
India. He analysed that Creative advertisements developed greater
purchase intent for the advertised brands than control group of
advertisements.
Poonam Singh and Mrinalini Pandey (2013) in their paper
observed that innovative and interactive advertising campaigns leave
a deeper impact on the consumer and hence overall augmented reality
is currently providing brands a new exotic way of interacting with their
users and gives them great mobile marketing experience through smart
phones. Finally concluded that Augmented Reality advertising can be
excellent tools for establishing a two way contact with the customers.
Werner Reinartz and Peter Saffert (2013) empirically studied 437
TV advertising campaigns and found certain dimensions of creativity
are more effective than others in influencing purchasing behaviour and
that many companies focus on the wrong dimensions in their
campaigns. They also observed that the relative effectiveness of adding
creativity to a campaign could vary significantly and in the real world,
the longer a creative ad is aired, the more impact the creativity has on
sales.
Pramod Thapliyal (2013) discussed about the growing market
innovations which results in falling business ethics. He suggested that
global fundamental marketing ethics and principles should be
applicable to all markets.
Sangvikar and Anjali Chaudhari (2013) attempted to link between
television advertising and its influence on children and their family
spending patterns. They found that advertising influences children’s
demand for everything right from toy to snack food. These demands
create an environment of child-parent conflict.
Sangapa Rampure (2012) made an attempt to express an
innovative idea for the Outdoor Advertising Industry, by using
passenger cars on Indian roads. Here in this article the author likes to
minimize the advertising cost to the companies and to create annual
revenue to the car owners. The study concluded with making
advertisements on cars will lead to maximum market coverage of ads
at various places in terms of economy and effectiveness.
Objectives
1. To know the creative and innovative aspects of advertising
2. To analyse whether creativity and innovative aspects
enhances the effectiveness in advertising
3. To identify which aspect has highest market potential
Hypotheses
H1: Highly creative advertising has more communication-effect in
terms of advertising effectiveness.
H2: Creative and innovative aspects are effective tools in changing
the market attitude.
Research Design & Methodology
Research Design: Research design of the present study is
descriptive
Sample Design: The sample design of the present study comprises
of the following elements.
1. Sample Element: Respondents from Sambalpur district
have been chosen for the present study.
2. Sampling Technique: Judgement Sampling Technique
has been used to collect the data.
3. Sampling Unit and Sample Size: Sampling unit of the
present study consist of 150 respondents under
consideration.
Research Approach: Survey (Primary data collected through
self-structured questionnaire) .The respondents viewed 10
advertisements which was officially declared by Google India as the
most viewed ads on YouTube of 2013. Accordingly, questionnaires
have been made on the creative and innovative aspects of the
respective ads. 5-point Likert scale has been used to measure the

Management Today Vol.5, No.1 January-March 2015
35
responses. The data were collected and then analysed through Chi
Square Test & Sample Mean Score.
Limitations of the Study
1. The study is confined to Sambalpur district; hence, it may
not be suitable for other districts.
2. The Sample size is limited to 150 respondents only.
Analysis & Interpretation
Table-1: Age Group-Wise Classification of the Respondents
Sl. No. Age Group Frequency Percent
1 Below 25 years 66 44
2 25 – 35 years 19 12.7
3 35 – 45 years 33 22
4 45 – 55 years 22 14.7
5 Above 55 years 10 6.7
6 Total 150 100
χ2 = 63 ; d f = 4 ; χ2 (0.5) = 9.49
It is clear from the table that 44 % of the respondents are under
25years of age, 12.7 % are between 25 and 35 years of age, 22 % of
them are between 35 and 45 years of age, 14.7% of them are between
45 and 55 years of age and 6.7% of the respondents are above 55 years.
Thus, majority of the respondents belong to the age group of below
25years. Further, the test of significance using chi square test revealed
that the respondents differ significantly based on age.
Table-2: Gender-Wise Classification of the Respondents
Sl No Gender Frequency Percentage
1 Male 107 71.3
2 Female 43 28.7
Total 150 100
χ2 = 27.307 ; d f = 1; χ2 (0.5) = 3.84
It is evident from table 2 that, 71.3% of the respondents are male
and the remaining 28.7 % of the respondents are women. Thus, the
majority of the respondents are male. Further chi square test reveals
that the respondents differ significantly by gender.
Table-3: Profession/Occupation-Wise Classification of the
Respondents
Sl. No Occupation Frequency Percentage
1 Student 61 40.7
2 Employed 80 53.3
3 Retired Person 9 6
Total 150 100
χ2 = 54.04 ; d f = 2; χ2 (0.5) = 5.99
It is clear from the table that 40.7% of the respondents are students,
53.3% are employed and the remaining 6% of the respondents are
retired persons. That is a majority of the respondents are employed.
Chi square test reveals that the respondents differ significantly by their
occupation.
Advertisement No 01:
Dove: The Real Beauty Sketches
Published on 14th April 2013
Duration : 3 min
Ad Agency: Ogilvy & Mather
Views: 64,783,619 (10th Nov 14)
Pa
rtic
ula
rs
Ver
y
Str
on
g(5
)
Str
on
g (
4)
Av
era
ge(
3)
Wea
k(2
)
Ver
y
Wea
k(1
)
Mea
n
Sco
re
Concept
Design 41 49 32 19 9 3.62
Message 15 29 61 20 25 2.92
Punch line 31 25 36 41 17 2.96
Characters/Personalities
25 35 49 34 7 3.24
Graphics/VFX 46 53 29 16 6 3.78
Colour
Combination 60 39 21 22 8 3.80
Voice over 42 57 21 25 5 3.70
Emotion 31 35 41 23 20 3.22
Text/Font/LO
GO 21 35 41 36 17 3.04
Purchase
Intention 42 41 32 16 19 3.47
Inference
From the above table it is revealed that among various creative
aspects, the mean score of colour combination and graphics are at the
higher side i.e 3.80 and 3.78 which clearly shows that the reason
behind its popularity. However, the voice over of this ad is also quite
impressive. The respondents gave least score to the message, as the
message is neither clear nor properly communicated.

Effectiveness of Creativity and Innovation in Advertising - An Empirical Analysis towards Changing Market Attitude
36
Advertisement No 02:
Lifebuoy: Help a Child reach 5
Published on 18th Feb 2013
Duration: 3.16 min
Ad Agency: Lowe, India
Views: 19,069,635 (10th Nov 14)
Pa
rtic
ula
rs
Ver
y
Str
on
g(5
)
Str
on
g (
4)
Av
era
ge(
3)
Wea
k(2
)
Ver
y
Wea
k(1
)
Mea
n
Sco
re
Concept Design 73 32 29 9 7 4.03
Message 74 42 19 8 7 4.21
Punch line 47 51 28 21 3 3.78
Characters/Personalities 54 47 23 17 9 3.80
Graphics/VFX 17 28 65 32 8 3.09
Colour Combination 19 31 68 18 14 3.15
Voice over/Dialogue 48 38 21 33 10 3.54
Emotion 71 39 17 10 13 3.96
Text/Font/LOGO 22 18 39 49 22 2.79
Purchase Intention 53 47 32 12 6 3.86
Inference
The results of the above table shows that mean score of ad message
is highest i.e. 4.21 followed by concept designing 4.03. Respondents
have also liked the emotional aspect (3.96) strongly. The ad was based
on health awareness. Statistics shows that every year, 2 million
children fail to reach their fifth birthday because of diseases like
diarrhoea and pneumonia. Lifebuoy is on a life saving mission to
spread the importance of good hand washing habits around the world.
Most importantly, that will help more children reach their 5th birthday.
Advertisement No 03:
Kit Kat Dancing Babies
Published on 17th Jan 2013
Duration :45 sec
Ad Agency: JWT India
Views: 3,731,338 (10th Nov14)
Pa
rtic
ula
rs
Ver
y
Str
on
g(5
)
Str
on
g (
4)
Av
era
ge(
3)
Wea
k(2
)
Ver
y
Wea
k(1
)
Mea
n
Sco
re
Concept Design 54 39 37 11 9 3.78
Message 33 23 45 32 15 3.14
Punch line 49 52 15 18 16 3.67
Characters/Personalitie
s 59 45 32 11 3 3.97
Graphics/VFX 67 48 21 9 5 4.08
Colour Combination 54 49 28 7 12 3.84
Voice over 52 31 27 15 5 3.33
Emotion 65 38 29 11 7 3.95
Text/Font/Logo 59 28 27 23 13 3.64
Purchase Intention 41 39 21 26 23 3.32
Inference
It is clear from the table that the respondents gave their highest
score to graphics and VFX. They also liked the aspect emotion (3.95)
as this ad features very small babies. In the ad, a hardworking doctor
takes a Kit Kat break during his work shift. As he is enjoying his candy
bar, he notices a roomful of babies who break into a dance routine.
This particular advertisement tries to say, “Good things happen when
you take a KIT KAT break”.
Advertisement No 04:
Old Spice India: Mantastic Man
Published on: 8 October, 2013
Duration: 1:16 min
Agency: Wieden+ Kennedy Portland
Views: 2,282,259 (10th Nov 14)

Management Today Vol.5, No.1 January-March 2015
37
Pa
rtic
ula
rs
Ver
y
Str
on
g(5
)
Str
on
g (
4)
Av
era
ge(
3)
Wea
k(2
)
Ver
y
Wea
k(1
)
Mea
n
Sco
re
Concept Design 23 18 29 53 27 3.87
Message 33 48 31 20 18 3.14
Punch line 52 49 18 15 16 3.70
Characters/Personalities 65 43 22 18 2 4.00
Graphics/VFX 23 31 54 23 19 3.10
Colour Combination 15 22 48 25 40 2.64
Voice over/Dialogue 69 45 17 11 8 4.04
Emotion 9 18 45 41 37 2.47
Text/Font/LOGO 12 13 36 68 21 2.51
Purchase Intention 52 49 15 16 18 3.67
Inference
From the table, it is quite clear that the reason behind the popularity
of new old spice ad is due to the use of celebrity aspect and dialogue
delivery, as the mean score figures show 4.04 and 4.00 respectively in
comparison to other creative aspects. Old Spice has introduced a new
integrated campaign that employs the services of ‘Milind Soman’ to
launch its line of Old Spice Deodorants. Therefore, the celebrity
impact worked and the ad clicked.
Advertisement No 05:
Evian Baby and Me: Live Young
Published on 19 April 2013
Duration: 1:17
Ad Agency: BETC, Paris
Views: 95,293,812 (10th Nov 14)
Pa
rtic
ula
rs
Ver
y
Str
on
g(5
)
Str
on
g (
4)
Av
era
ge(
3)
Wea
k(2
)
Ver
y
Wea
k(1
)
Mea
n
Sco
re
Concept Design 57 39 28 15 11 3.77
Message 51 69 7 15 8 3.93
Punch line 48 38 27 20 17 3.53
Characters/Personalities 78 41 17 9 5 4.18
Graphics/VFX 72 52 9 8 9 4.13
Colour Combination 49 39 28 17 17 3.70
Voice over/Dialogue 35 25 35 42 13 3.18
Emotion 11 15 22 64 38 2.31
Text/Font/LOGO 35 69 23 18 5 3.74
Purchase Intention 53 43 34 7 13 3.77
Inference
From the above table the mean score of character/personality
aspect and graphics/VFX are more than other creative aspects (i.e. 4.18
& 4.13 respectively). Evian water is specially marketed to adults as a
premium brand, making the connection of Evian water with a healthy
lifestyle. Therefore, for the first time Evian used babies for their ad.
The reason behind the success is universal appeal of babies, use of
humour and high-end graphics.
Advertisement No 06:
Kajol reacts to Lifebuoy's Help A Child Reach 5 campaign
Published on 27 August 2013
Duration: 1:27
Ad Agency: Lowe, India
Views: 1,759,885 (10th Nov 14)
Pa
rtic
ula
rs
Ver
y
Str
on
g(5
)
Str
on
g (
4)
Av
era
ge(
3)
Wea
k(2
)
Ver
y
Wea
k(1
)
Mea
n
Sco
re
Concept Design 51 47 32 13 7 3.81
Message 61 59 10 9 11 4.04
Punch line 53 43 21 22 11 3.70
Characters/Personalitie
s 76 41 11 15 7 4.09
Graphics/VFX 24 33 41 25 27 3.01
Colour Combination 28 29 36 41 16 3.08
Voice over 65 40 15 22 8 3.88
Emotion 66 51 21 8 4 4.11
Text/Font/LOGO 18 27 36 44 45 2.92
Purchase Intention 59 41 21 18 11 3.79
Inference
From the table the mean score of message (4.04), celebrity (4.09)
and emotion aspects (4.11) are at a higher side than the other aspects.
Here ‘Kajol’ urged people to join her in supporting the cause of hand
washing with the Lifebuoy’s ‘Help a Child Reach 5’ campaign, which
aims to eradicate diarrhoea, one village at a time. The ad carries a very
strong message and celebrity impact made this ad more popular &
successful.

Effectiveness of Creativity and Innovation in Advertising - An Empirical Analysis towards Changing Market Attitude
38
Advertisement No 07:
New 5 Star Ad - Ramesh, Suresh return home
Published on 8th August 2013
Duration: 45 sec
Ad Agency: Ogilvy & Mather India
Views: 1,544,383 (10th Nov14)
Pa
rtic
ula
rs
Ver
y
Str
on
g(5
)
Str
on
g (
4)
Av
era
ge(
3)
Wea
k(2
)
Ver
y
Wea
k(1
)
Mea
n
Sco
re
Concept Design 25 35 46 23 21 3.13
Message 22 37 43 39 9 3.26
Punch line 19 38 46 19 28 3.00
Characters/Personalities 62 34 24 23 7 3.80
Graphics/VFX 19 46 39 22 24 3.09
Colour Combination 24 29 42 27 28 2.96
Voice over 21 45 42 37 5 3.26
Emotion 24 43 31 26 26 3.00
Text/Font/Logo 23 24 61 22 26 3.09
Purchase Intention 51 22 33 23 21 3.30
Inference
The above table reveals that the characters used in this ad have
scored highest (3.80), however the message and punch line also
impressed the respondents with a mean score of 3.26 each. The viewers
of this ad have also a strong intention to consume it (3.30). The reason
is obvious as because of the impact of an old brand i.e. ‘Cadbury’ and
introduction of two humorous characters namely Ramesh & Suresh.
However, the other creative aspects were found comparatively weaker.
Advertisement No 08:
Sony Xperia Z
Published on 7th Jan 2013
Duration: 2.07min
Ad Agency: McCann Erickson London
Views: 10,907,309 (10th Nov 14)
Pa
rtic
ula
rl
y
Ver
y
Str
on
g(5
)
Str
on
g (
4)
Av
era
ge(
3)
Wea
k(2
)
Ver
y
Wea
k(1
)
Mea
n
Sco
re
Concept Design 31 21 49 32 17 3.11
Message 35 37 33 40 5 3.38
Punch line 23 45 38 20 24 3.15
Characters/Personalities 42 55 31 16 6 3.74
Graphics/VFX 68 48 18 12 4 4.09
Colour Combination 53 49 28 13 7 3.85
Voice over/Dialogue 55 43 25 15 12 3.76
Emotion 8 16 33 45 48 2.27
Text/Font/LOGO 51 38 25 21 15 3.59
Purchase Intention 71 53 12 10 4 4.18
Inference
For Sony Xperia Z, the respondents gave a mean score i.e. 4.09 to
graphics and VFX. As a very attractive and high end graphics has been
used for explaining the features of the product. It also successfully
created an impact on the purchase intention (4.18) of the consumers.
Advertisement No 09:
Samsung GALAXY S4: Life Companion
Published on 14th March 2013
Duration:4.23min
Agency: Jelitta Publicity
Views: 18,697,765 (10th Nov 14)
Asp
ects
Ver
y
Str
on
g(5
)
Str
on
g (
4)
Av
era
ge(
3)
Wea
k(2
)
Ver
y
Wea
k(1
)
Mea
n
Sco
re
Concept Design 21 39 45 30 15 3.14
Message 23 34 39 24 30 2.97
Punch line 31 27 59 16 17 3.26
Characters/Personalities - - - - - -
Graphics/VFX 63 37 22 20 8 3.84
Colour Combination 59 26 39 18 8 3.73
Voice over - - - - - -
Emotion - - - - - -
Text/Font/LOGO 58 45 37 7 3 4.1
Purchase Intention 68 41 22 10 9 3.9
Inference
The above table reveals that the respondents gave very strong
response to the Logo (4.1), Graphics (3.84) and colours (3.73). In
addition, they have also a strong purchase intention (3.9) towards the

Management Today Vol.5, No.1 January-March 2015
39
product. The brand was promoted as a life companion for a richer, simpler and
fuller life. However, the other aspects were found comparatively weak. The
respondents leave characters, voiceovers and emotion field blank, as these aspects
had not been used in this ad.
Advertisement No 10:
Google Search Reunion
Published On 13th Nov 2013
Duration: 3.33 min
Ad Agency: Ogilvy & Mather India
Views: 12,327,043 (10th Nov 14)
Asp
ects
Ver
y
Str
on
g(5
)
Str
on
g (
4)
Av
era
ge(
3)
Wea
k(2
)
Ver
y
Wea
k(1
)
Mea
n
Sco
re
Concept Design 57 35 21 23 14 3.65
Message 55 41 19 21 14 3.68
Punch line 21 35 53 31 10 3.17
Characters/Personalities 61 30 21 29 9 3.70
Graphics/VFX 32 23 58 30 7 3.28
Colour Combination 25 34 49 27 15 3.18
Voice over/Dialogue 34 57 22 5 32 3.37
Emotion 68 41 18 13 10 3.96
Text/Font/LOGO 51 39 24 15 21 3.56
Purchase Intention 32 45 40 21 12 3.42
Inference
The above table reveals that emotion scored highest (3.96) among
other creative aspects. As the advertisement explains, how the two
friends are brought together, again by their grandchildren using Google
searches. This Google ad has moved people to tears across India and
Pakistan. The Reunion ad touches upon the sensitive issue of partition
and how it separated friends and families. (Survey by Afaqs News
Bureau, New Delhi)
YouTube is turning out to be a favourite destination for creative
agencies and brand campaigns that are made to engage the audiences
online. With the growth of the internet users in India, brand managers
and creative agencies are releasing the true potential of YouTube. A
survey was made on the "most engaging" commercial content on
YouTube in 2013.
Longer duration ads give more freedom to creative minds as they
have the freedom of going beyond 30 seconds limit for establishing
open communication with the consumer and inspiring people to share
the ads with their circle of friends. Creative professionals are
experiencing a new height in the era of digital platforms, which is
unshackling the talent of highly skilled advertising professionals in
India.
Humour appeal ads, ads with emotional buying motives, high tech
ads are the vital aspects that rule the market. Cadbury 5 star ad
featuring funny duo of Ramesh and Suresh, Google reunion campaign
which reunites friends split by partition have shown the success of
emotional ads on YouTube. Evian and Nestle Kit Kat baby ads
captured the imagination of netizens. (Vide Ref. 11.5)
Findings
1. Highly Creative advertising has more communication effect
in terms of advertising effectiveness when compared to
conventional advertising, as the ads reached views in
millions. Hence, our H1 is true and accepted.
2. Consumer Purchase Behaviour is significantly more
favourable towards advertised brands, which have aspects
that are more creative. Hence, our H2 is also true and
accepted.
3. Emotion is the most creative and graphics/VFX is the most
innovative aspect of advertising now a days, so most of the
top selling advertisements have given primary concentration
to it.
4. The use of celebrity personalities can have a huge impact on
a brand. In this study, ads like ‘lifebuoy’ and ‘old spice’
gained popularity for the use of celebs. There is a certain
correlation between successful celebrity branding and brand
endorsements.
5. Use of special characters, small babies can create humour or
emotion in the mind of the consumers, which can also give
an impact on the changing market attitude.
6. Advertising message has also a great impact on the
consumers, provided it should be properly planned, designed
and communicated.
7. The other aspects of creativity like voice over, use of special
fonts, logo, colour combination, punch line etc are
comparatively less effective than graphics, use of celebrities,
ad message etc.
8. Analysis done by Afaqs News Bureau, New Delhi also had
the same findings as they concluded their survey with, ads
with humour, emotions, use of small babies & use of
technology have a great potential of ruling the market.
Suggestions
1. The professionals in advertising agencies should not
underestimate the value of creativity in its effectiveness and
should give due consideration for this aspect in advertising.
2. Advertising strategists can choose such a strategy as a viable
option considering all of the performance concerns thereto.
3. The creativity norms used in the study provide clear
benchmarks for advertisers to judge the success of their
advertisements. The findings also offer some insights to
those who must develop their own guidelines concerning the
use of creativity in advertising.
4. Based on this study, advertisers can interpret how consumers
form attitudes towards the ads and for their brands.

Effectiveness of Creativity and Innovation in Advertising - An Empirical Analysis towards Changing Market Attitude
40
Conclusion
The empirical results show that intensity of advertising creativity
and innovation are the contributing factors in the effectiveness of an
ad. These results also confirm strong, positive relationships among
creativity in advertising, and purchase behaviour. Highly creative and
innovative advertising has more communication effect in terms of
advertising effectiveness which leads to higher advertising response in
terms of consumers’ purchase intention.
References
Ang, S. H. & Low, S. Y. M. (2000). Exploring the Dimensions of Ad
Creativity. Psychology and Marketing, 17 (10), 835-854.
Belch, G. E. & Belch, M. A. (2003). Advertising & Promotion.
McGraw−Hill Companies, pp 620-655.
Chunawala, S. A. & Sethia, K. C. (2011). Foundations of Advertising
– Theory & Practice. Himalaya Publishing House, pp.642-660.
Ducoffe, R. H. (1996). Advertising value and Advertising on the web.
Journal of Advertising Research, 36(5), pp.21-35.
http://www.afaqs.com/news/story/39409_Most-viewed-YouTube-
ads-in-India-in-2013
http://www.campaignindia.in/Article/367539,youtube-releases-top-
10-most-viewed-ads-in-india-for-2013.aspx
https://hbr.org/2013/06/creativity-in-advertising-when-it-works-and-
when-it-doesnt/
http://www.inc.com/profile/innovative-advertising
http://www.scribd.com/doc/21006568/Creativity-in-Advertising-
project-report
http://www.zeepedia.com/read.php?creativity_in_advertising_three_a
spects_are_most_accepted_four_rules_of_creativity_advertising_
and_promotion&b=34&c=18
Kothari, C. R. (2004). Research Methodology - Methods &
Techniques. New Age International Publishers, pp.233-238.
Kover, A. J., Goldberg, S. M., & James, W. L. (1995). Creativity vs.
Effectiveness? An Integrating Classification for Advertising.
Journal of Advertising Research, 35(6), 29-39.
Sahni, N. K., & Gupta, M. (2012). Advertising & Sales Promotion -
Text & Cases. Kalyani Publishers, pp. 15.1-15.9.
Till, B. D. & Baack, D. W. (2005). Recall and persuasion: Does
creative advertising matter? Journal of Advertising, 34 (3), 47-57.
41
MANAGEMENT TODAY
-for a better tomorrow An International Journal of Management Studies
home page: www.mgmt2day.griet.ac.in Vol.5, No.1, January-March 2015
Mergers and Acquisitions and Corporate Performance: A Critical Review
Madhumita Dasgupta
Department of Commerce, University of Calcutta, Kolkata, [email protected]
A R T I C L E I N F O Article history: Received 17.12.2014 Accepted 31.03.2015 Keywords:
Bidder firms, mergers & acquisitions, corporate performance, operative performance, shareholders, target firms.
A B S T R A C T
The age of globalization has witnessed some major trends in the corporate scenario and one of the
most promising strategies has been Mergers and Acquisitions (henceforth referred as M&A). The
M&A has been taking a fundamental area of the corporate strategy and after the liberalization of
1991 has acquired a new dimension in the global economy. Major reasons of such M&A activity
has been attributed to the enhancement of the market share, higher profitability and attainment of
economies of scale. The functional importance of Mergers and Acquisitions has been undergoing
a sea change since liberalization in India. Synergy is the reason for mergers. It implies a situation
where the combined firm is more valuable than the sum of the individual firms combining. It refers
to benefits other than those related to economies of scale. This paper is an explanatory attempt for
examining the different studies that have been carried out in the field of M&A which is one of the
most widely applied techniques of corporate restructuring. The study includes 40 papers by various
researchers and the earliest study enumerated here dates back to 1983. The latest paper in the study
is in 2010. Mainly the papers try to focus on the motives of the mergers and acquisitions.
Introduction
The age of globalization has witnessed some major trends in the
corporate scenario and one of the most promising strategies has been
Mergers and Acquisitions (henceforth referred as M&A). The ever
growing economies of the globe have increased manifold by merging
with the firms of the same discipline or with related sectors. The M&A
has been taking a fundamental area of the corporate strategy and after
the liberalization of 1991 has acquired a new dimension in the global
economy. The major reasons of such M& A activity has been attributed
to the enhancement of the market share, higher profitability and
attainment of economies of scale. The functional importance of
Mergers and Acquisitions has been undergoing a sea change since
liberalization in India. The amendments of the MRTP Act and other
legislations have ensured that companies resort to this stratagem for
growth. Further The SEBI (Substantial Acquisition of Shares and Take
over) Regulations, 1994 and 1997, have been notified. Indian
companies are selling off their non-core businesses to achieve core
competency. The economies are having an exceptional growth
trajectory and a decline in interest rates have made financing of out-
bound deals cheaper. There have been areas where the Ministry of
Finance has introduced certain key modifications which have opened
up new avenues for companies to carry out their acquisition schedule.
One of them is the overseas investment strategies.
Theoretical Framework
Business firms engage in a broad range of activities including
expanding, shrinking and otherwise restructuring asset and ownership
structures. The various activities may be grouped into the following
categories:
-----------------------------------------------------------------------------------------------------
Responsibility of Contents of this paper rests upon the authors and
not upon GRIET publications
ISSN: 2348-3989 (Online)
ISSN: 2230-9764 (Print)
Doi: http://dx.doi.org/10.11127/gmt.2015.03.07
pp.41-50
Copyright@GRIET Publications. All rights reserved.

Mergers and Acquisitions and Corporate Performance: A Critical Review
42
Expansion-Mergers and acquisitions, Tender Offers and Joint
ventures
Sell-offs-
Spin-offs: Split-offs and Split-ups
Divestitures: Equity carve-outs
Corporate control: Premium buy-backs, Standstill agreements,
antitakeover amendments and Proxy contests.
Changes in ownership structure: Exchange offers, Share
repurchases, going private and leveraged buy-outs.
The terms Merger, Acquisition and Takeovers are used
interchangeably but they all have different meanings and various legal
impacts on the firms participating in such restructuring activities.
Amalgamations can be through merger of companies pertaining to
the provisions of the Companies Act. Acquisitions can be through
takeovers which are governed by SEBI. In case of cross border
transactions, international tax considerations also arise. Amalgamation
signifies the transfer of all or some part of the assets and liabilities of
one or more existing companies to another existing company(s) or to a
new company of which the transferee company or all the members of
the transferor company(s) become, or have the rights of becoming,
members. In most cases such amalgamation is coupled with voluntary
winding–up of the transferor company(s). Under an Amalgamation,
merger or takeover, two or more companies are merged de jure through
consolidation of their undertakings or de facto through acquisition of
their controlling interest in the share capital of one by the other or of
the capital of both by the new company.
From the perspective of business structures, there can be a number
of categories. According to the relationship between the two
companies that are merging mergers are of the following types:
Horizontal merger – it involves two firms operating in the
same kind of business activity. Two companies that are
directly competitive sharing same product lines and markets
may merge together.
Vertical merger – this merger involves different stages of
production operations. For example merger might take place
between a customer and company or a supplier and company.
Conglomeration – This involves firms engaged in unrelated
type of business activity. When two companies that have no
common business areas merge together, it is called
conglomerate merger. There are mainly three types of
conglomerate mergers which are as discussed below:
Geographic Market-extension merger – involves two
firms whose operations have been conducted in non-
overlapping geographical areas.
Product-extension merger –this merger broadens the
product lines of the firm. Two companies selling
different but related products in the same market might
merge.
Pure conglomerate merger - involves unrelated
business activities that would not qualify as either
product-extension or market-extension mergers.
According to the financing methods, mergers may be
categorized into the following. Each has certain implications
for the companies and the investors involved:
Purchase Mergers - This kind of merger occurs when
one company purchases another and the purchase is
made with cash or through the issue of some kind of
debt instrument. In this case the sale is taxable under
law. Acquiring companies often prefer this type of
merger since it ensures them tax benefit. Acquired
assets are written-up to the actual purchase price. The
difference between the book value and the purchase
price of the asset is shown as annual depreciation
thereby reducing the total tax liability of the acquiring
firm.
Consolidation Mergers – This form of merger brings
into existence a brand new entity with both the firms
combining into this new firm. Tax terms are identical
to the purchase merger.
Indian Scenario
The first wave of M&As was from 1990 to 1995 where the Indian
companies started to prepare themselves or facing the foreign
competition since the market opened up to foreign entry. The second
wave since 1995 witnessed a significant involvement of multinational
firms. The macroeconomic policy changes in India facilitated the third
wave of merger movement since 2000 – overseas acquisitions by the
Indian firms. A large number of mergers were between firms
belonging to the same business groups and product lines with a view
to increase their respective controlling blocks and market power.
Paper Reviews
There has been extensive research in this area and the following
papers try to bring into focus the various inferences that have been
drawn by the papers and enumerate the different schools of thoughts
regarding the M&A activity. The papers examine both the performance
of the acquiring firms and the target firms. There are three approaches
followed in the literature for examining the performance of M&A
transactions, of which the significant one being the investigation of
gains and losses to shareholders around the deal announcement date.
The second approach is the comparison of the pre-merger and post-
merger operating performance ratios for the entire sample set of
mergers. The final approach is scrutinizing the actual improvement in
the synergy levels of the companies in the long term scenario in the
post-merger era.
One of the earliest studies in this area has been done by Healy
Palepu and Rubak (1990). For their paper titled “Does corporate
performance improve after mergers?” they studied 50 major public
industrial firms. This paper compared the operating performance
through accounting data even though it was considered that the
accounting data is an imperfect measure, as it can be affected by
managerial decisions. The pre –tax operating cash flows of the
company was also considered and therefore the industry performance
was used as a benchmark for the post-merger improvement in the firm.
The firms mainly use purchase method of transaction. Again post
acquisition earnings are also effected by method of financing i.e. if it
is a debt financing or a cash financing, but since the operating income
had been used (before interest payments and short term investment
incomes further deflated by market value of assets), the choice of
financing was not a detrimental factor for measurement. Most
importantly, they had excluded the change in equity values of the target
and acquiring firms at the merger announcement from the asset base in
the post-merger year. Also, the industry adjusted results proved that
there was an improvement in the post-merger performance, whereas
the unadjusted results give a diametrically opposite view. The
“industry related” has also been checked for any anomalies. There was
evidence that the pension per employee had declined after the merger.

Management Today Vol.5, No.1 January-March 2015
43
The overall findings suggested that the operating performance had
improved after the merger. Also, the results showed that the post-
merger operating cash flows did affect the abnormal stock returns.
Another vital observation was that stock price reaction to mergers were
driven by anticipated economic gains alter the merger.
Another paper Andrade; Mitchell &Stafford (2001), titled “New
evidence and perspectives on Mergers” mainly expressed that the
merger was clustered in a particular industry. This paper also tried to
capture the merger effects of the publicly traded shares of the US firms.
Here both the target and acquirer were US concerns. The merger
studies concentrated around the type of merger and evidences showed
that method of merger in 1980 was different from 1990, the latter being
done through stock purchases. The hostile takeovers are non-existent
in the 1980’s. In case of a particular industry, it was observed that
mergers happened in a wave i.e. for one decade they were active and
in another they were dormant. Another key reason was deregulation
which brought down the barriers to trade. This paper was able to bring
out the evidences that the event studies were used for three days before
and after the merger. The relation is positive and suggested that
mergers create value for the shareholders but the target firm
shareholders enjoyed a bigger positive return from the merger activity.
According to this paper, a target firm shareholder would earn a return
equal to earnings in a 16 month period within that three day event
window. This paper also suggested that the method of financing the
merger should be considered. It was observed that the target firms
performed positively if there was no equity financing. The combined
performance of stocks with equity financing does not outgrow the
same, if done though non-equity financing. If the long term returns
from the mergers were considered, then this paper suggested that the
mergers of the small acquirers happened to be the most robust of all.
According to the paper the previous studies were not able to precisely
enumerate the amount of abnormal returns from the merger and the
time frame considered was also not sufficient. The study also revealed
that the factor efficiency increased after the merger, if the basis of
consideration was productivity. Some researchers argued that the
mergers created value for only the target firms as there was proper
resource allocation and optimum utilization. Ultimately, it showed that
there was zero or negligible difference between the merger decision
performance and performance through any other investment decisions.
A paper by Seth, Song & Pettit, (2002) titled “Value creation and
destruction in Cross-Border Acquisitions: An empirical analysis of
foreign acquisitions of U.S. firms”, described the investigation of the
sources of gains in cross-border acquisitions wherein decision-making
was taken to be a function of different behavioral assumptions. The
paper distinguishes between cross border acquisitions that are
characterized by:
the hubris hypothesis -acquisitions occur because managers
make mistakes in evaluating target firms, and the takeover
premium merely reflects a random error. Assumption is that
the valuation of the target is a random variable whose mean is
the current market price.
the synergy hypothesis -proposes that acquisitions take place
when the value of the combined firm is greater than the sum of
the values of the individual firm
the managerialism hypothesis advocates that managers will
knowingly overpay in takeovers. The managers embark on
acquisitions to maximize their own utility at the expense of the
shareholders of the acquiring firm.
The sample is of all cross-border acquisitions of U.S. industrial
corporations from 1981-90. The data was consistent with the
expectation that multiple sources of value creation existed in
synergistic cross-border acquisitions like asset sharing, reverse
internalization of valuable intangible assets, and financial
diversification. The data thus provided shows evidence for multiple
theories of FDI, suggesting that it is important to use the malfunctional
approach to understand performance difference in a case like this. For
value-destroying acquisitions that are expected to be driven by
managerialism however, it is observed that the data are consistent with
only one of the sources of value destruction, i.e., risk reduction. In
these acquisitions, the evidence also suggests that large relative size of
the target to the bidder mitigates the negative effects of risk reduction.
Another paper prepared by Carline, Linn & Yadav (2003) titled
“Can the stock market systematically make use of firm- and deal-
specific factors when initially capitalizing the real gains from Mergers
and Acquisitions?” studies the impact of firm-specific and deal-
specific factors on the change in industry-adjusted operating
performance around corporate mergers and acquisitions. The sample
taken is domestic UK mergers. It shows that mergers in the UK during
this period were associated with improvements in operating efficiency
and the total abnormal revaluations of bidder/target pairs are both
positive. The results further suggest operating performance
improvement depends on whether the merger was friendly or hostile.
Here, operating performance means EBT (+ depreciation & goodwill
+ net interest income). The study shows that the industry adjusted cash
flows, improve in the post-acquisition period. Some of the conclusions
drawn are, the larger the deal the smaller is the gain. Secondly, the
performance is worse if there is a bigger Board of directors. It is found
that stock offers and hostile offers are associated with smaller changes
than are cash or non-hostile offers and another observation is the larger
offers tend to be associated with lower gains.
The paper by Rosen (2003) titled “Merger momentum and investor
sentiment: The stock market reaction to merger announcements”
examine whether the market reaction to a merger announcement
depends on the recent merger history of the overall market and of the
bidding firm. The paper analyses three different theories that are each
consistent with merger momentum.
The neoclassical theory of mergers - managers act to maximize
shareholder value. Under this theory, merger momentum may
result from shocks that increase synergies for a group of
mergers.
A second theory is that there are managerial motivations for
mergers. If managerial objectives drive merger decisions, then
acquisitions during waves may be worse than other mergers.
The third theory examines that momentum results from overly
optimistic beliefs on the part of investors and possibly
managers.
The data set on mergers and acquisitions by U.S. firms announced
between 1982 and 2001 as given in the Securities Data Corporation
(SDC) database suggests momentum in merger markets. Mergers
announced during hot stock markets tend to get a better reaction from
the market than those announced in a cold market. Evidence proves
that the short-run reaction to an announcement is reversed in the long
run. Acquisitions announced in hot merger markets lead to long-run
declines in the bidder’s stock price while there is some evidence that
acquisitions announced in hot stock markets are associated with long-
run returns that are not higher, and possibly lower, than those
announced in cold stock markets. There is even some evidence that,

Mergers and Acquisitions and Corporate Performance: A Critical Review
44
holding all else equal, the short-run reaction to an announcement is
fully reversed over the next three years. If investors expect a broad
range of mergers to create synergies, then they react positively to
merger announcements. When investor expectations are based more
on optimistic expectations than reality, the short-run boost in price
caused by a merger announcement are reversed in the long run as the
track record of the merger becomes known. Studies have noted that
mergers often cluster within an industry and follow industry wide or
economy-wide shocks. If these shocks increase the synergies available
for mergers, then they could lead to merger momentum. But,
synergistic shocks alone cannot explain the market reaction to mergers.
The long run reversal in the returns to bidding firms’ stock requires
something additional. A third explanation for mergers is that they
result from managers acting in their private interests. Managerial
motivations can spark a defensive merger wave. If so, then mergers
during waves should be worse than mergers at other times. We find
evidence consistent with this, especially for the merger wave of the
1990s. Overall, there is some evidence that the long-run return to a
merger is worse if the merger was made during a wave.
Another important paper titled “Towards understanding the
merger – wave in the Indian corporate sector: A comparative
perspective” by Beena (2004) tries to understand the motives and
implications of the merger wave in the second half of the nineties. The
analysis was conducted by dividing the firms into two categories:
Indian owned and Foreign owned. The motives of mergers are based
on certain theories and they are: i) efficiency enhancing measures ii)
concentration and monopoly enhancing iii) driven by macroeconomic
changes and iv) driven by financial motives. The sample consists of
115 actual mergers which accounts for 22% of the total number of
M&As that occurred in the Indian manufacturing sector in the time
frame of 1995-2000. The sample includes only MNE related firms
already operating in India as foreign subsidiaries. The performance has
been measured in terms of price –cost margin, rate of return,
shareholder’s profit, debt-equity ratio, export intensity, R&D intensity
and capacity utilization. The study also tested the significance of their
mean difference between pre and post-merger phase by using t-
statistic. It has been observed that foreign –owned acquiring firms have
been performing better than Indian owned acquiring firms. Also the
return on shareholder’s equity has increased after merger. The paper
argues that the main motive was to increase the equity size, which
could be further used to borrow resources for modernization. As far as
export intensity and R&D intensity are concerned, they showed mixed
results and no substantial conclusions could be drawn. The study could
not locate any significant data of efficiency-related actors being the
chief stimulant of M&A that took place in the Indian corporate sector
during the second half of the nineties. It has also been noticed that the
firm’s growth in terms of asset-size, market share and intensification
of the controlling bloc acts as a defense mechanism against takeover
bids. The behavioral pattern of the acquiring companies rings a bell for
reviewing and establishing a desirable and workable Competition
policy and corporate governance regime for the economy.
The paper by Calderon (2004) titled “Greenfield foreign direct
investment and Mergers and Acquisitions: Feedback and
macroeconomic” states that FDI boom has also raised two major
concerns. The first one involves the uncertain future prospects of FDI
to developing countries. The second concern relates to the growth
impact of FDI flows, which has attracted renewed interest in the wake
of the FDI boom. The purpose of this paper was to address these
concerns by examining the link between the two components of FDI
flows – Greenfield and M&A -- and their respective relationship with
aggregate investment and growth in a large cross-country time-series
data set. An expansion of M&A is indeed followed by an increase in
Greenfield FDI. The paper explains that an increase in M&A by 1
percent of GDP leads to a rise in Greenfield FDI by about 1 and 1.5
percentage points of GDP in industrial and developing countries,
respectively. Second question addressed in the paper was the causality
(in the sense of time precedence) between the two forms of FDI and
domestic investment and economic growth. Therefore, economic
growth, as the most important indicator of domestic rates of return,
serves as an effective “pull” factor for foreign investment; and in turn,
FDI helps increase domestic investment in the future.
The focus of the paper by Chari, Ouimet & Tesar (2004) titled
“Cross Border Mergers and Acquisitions in emerging markets: The
stock market valuation of corporate control” is on the stock price
reaction, an inherently ex-ante measure, to news of an acquisition as a
summary statistic to capture the gains and losses from an acquisition.
The paper uses the Securities Data Corporation (SDC) Thompson’s
International Mergers and Acquisitions database to identify merger
and acquisition events in emerging markets over the period 1988-2003.
DataStream and Bloomberg are the sources used for stock price
information. The benchmark results from firm level panel data
estimations suggest that, target firms in emerging markets experience
positive monthly returns when a cross border acquisition is announced.
The rate ranges from 5.05% to 6.68%. The results in this paper show
that monthly returns for acquirer firms show a statistically significant
increase of 1.65% to 3.05%. This paper uses the stock price reaction
of acquiring and target firms to the announcement of an acquisition as
a summary statistic for value creation through foreign acquisitions.
The stock price reaction of both firms to the announcement of an
acquisition shows:
the potential wealth creation from the merger
how the gains and losses from an acquisition are assigned to
the acquiring and target firms.
The results from panel data estimations suggest that the stock
market anticipates significant value creation from the merger for the
target and the acquiring firms. The benchmark results indicate that
target firms benefit from the acquisition, experiencing monthly returns.
The paper also compares acquirer returns for US firms when the
acquisition is announced in a developed market rather than in an
emerging market. The data suggest that positive acquirer returns are
specific to acquisitions in emerging markets, and that gaining
corporate control is the key feature of transactions that deliver positive
returns. Overall, the results in the paper suggest that the boom in FDI
flows to emerging markets in the late 1990s led to a transfer of control
to foreign acquirers. Also it results in substantial gains to shareholders
of both the acquiring and the target firms.
Subramaniam (2004) in his article titled “Option pricing on stocks
in Mergers and Acquisitions” stated that there are a lot of pending
deals in the stock markets which tend to affect the stock option prices
of the involved firms. The studies reveal that the options are able to
reflect the market reaction towards a successful deal or a pending deal.
The model used by the researcher is an extension of the Black-Scholes
constant volatility model. The data set used consists of daily stock and
option price data for each company involved in a stock for stock
merger deal announced during 2001 where both the target and the
acquirer have traded options. The paper presents an arbitrage-free and
complete framework to price options on the stocks of firms involved
in a merger or acquisition deal with the possibility that the deal might
be called off thus creating discontinuous impacts on the prices of one
or both stocks. The study models the stock price processes as jump
diffusions and derive explicit relationships between the parameters of
the stock price processes.

Management Today Vol.5, No.1 January-March 2015
45
The study done by Savor and Lu, (2004-05) titled “Do stock
mergers create value for Acquirers?” suggests that the stock financed
mergers are more costly for the acquirer. The main goal of this paper
is to determine whether stock-financed bids create value for the
acquirer’s long-term shareholders. Stock acquisitions serve the
interests of bidder’s long-term shareholders. The market-timing theory
of acquisitions predicts that stock-financed mergers benefit the
acquiring firms long-term shareholders by converting overvalued
equity into (less overvalued) hard assets. The comparison between
successful and failed acquirers indicates that, despite the negative
announcement and post-event returns for stock acquirers, their long-
term shareholders are still better off than they would have been without
these deals. The evidence presented is consistent with the hypothesis
that stock-financed acquirers create value for their long-term
shareholders and that one mechanism by which they do so is their use
of overvalued equity to purchase hard assets at an effective discount.
It is found that unsuccessful stock bidders underperform successful
ones in an economically meaningful and statistically significant way.
This underperformance increases with the length of the holding period.
The motives behind the various managers’ actions are:
a) It creates a strong incentive for firms to artificially boost their
stock price, even though this effect might be costly and purely
temporary. Some affected firms might ultimately not be
successful in executing an acquisition, but this does not
necessarily make the stock price manipulation irrational from
an ex-ante perspective (with respect to the interests of long-
term shareholders).
b) Managers might pursue deals where the joint fundamental
value of the acquirers and targets assets is reduced by
combining them in a single firm. As long as market-timing
gains outweigh the costs of this inefficiency, long-term
shareholders will profit from the merger.
The key aim of this paper prepared by Ferrett (2005) titled
“Greenfield investment versus Acquisition: Positive Analysis” is to
explain the Greenfield/ acquisition choice by building a model where
the form of FDI (Greenfield-FDI vs. acquisition-FDI) is endogenously
selected. The stimuli driving the paper are:
Greenfield / acquisition distinction is quantitatively important
in empirical data (on both flow values and project numbers):
neither type of FDI is ever reported as being trivial.
Second, intuition suggests that the distinction is also
qualitatively important: at least in the short run, it is reasonable
to expect acquisition-FDI to result in a more “concentrated”
market structure than Greenfield-FDI, which implies that the
welfare effects of the two forms of entry may differ markedly.
First, it was found that, relative to Greenfield-FDI, acquisition-FDI
is a “soft” response by the incumbents to the entry threat: in
intermediate-sized markets, acquisition- FDI provokes, but
Greenfield-FDI deters entry. It was seen that if both incumbents invest
in process R&D, the effect of changes in the trade cost on the incentive
for acquisition-FDI depends crucially on the R&D technology: if the
probability of R&D success is small (large), then trade liberalization
(i.e., falls in the trade cost) discourages (encourages) acquisition-FDI.
Managers may want to make acquisitions to increase their firm’s
size and hence reduce the likelihood that it is taken over. If managers
do not care very much about private benefits of control, only profitable
acquisitions occur. However, if managers care very much about private
benefits of control, they may engage in unprofitable defensive
acquisitions that preempt some profitable acquisitions. The
profitability of acquisitions tends to decrease in the acquirer’s size.
Large acquirers overpay while small acquirers tend to engage in
profitable acquisitions. Firms of intermediate size sometimes engage
in profitable and sometimes in unprofitable acquisitions. Also the
paper explains the three stylized facts about mergers. They are
mentioned as follows – first, that acquirers, on average, lose money.
Second, mergers concentrate in industries in which regime shifts can
be identified and third mergers come in waves. The study shows that
industry structure (the size distribution of the firms in the industry) is
an important factor for merger dynamics. Industries in which many
firms are similar in size to the largest firm with profitable acquisition
opportunities are prone to defensive merger waves. This happens if
managers care a lot about private benefits of control. Quite opposite is
the case where firms are of different sizes. They are prone less to
unprofitable acquisitions. Here the relation of profitable acquisitions is
inversely proportional with the care of managers for private benefits of
control. In industries in which some but not all firms are of similar size,
merger waves are most likely, because they occur if private benefits
are either low or high. The profitability of acquisitions tends to
decrease in the acquirer’s size. Large acquirers overpay while small
acquirers tend to engage in profitable acquisitions. Firms of
intermediate size sometimes engage in profitable and sometimes in
unprofitable acquisitions. The theory can explain why mergers are
concentrated in industries for which a regime shift can be identified.
At the same time, it can explain why acquirers lose money, on average,
and why mergers often occur in waves. All these were studied in detail
in the paper by Gorton, Kahl & Rosen (2005) titled “Eat or be eaten
alive: a theory of merger and merger waves”.
The same idea that target firms enjoy better gains as compared to
acquirers has been proved by Baxamusa (2006) in his paper titled
“Mergers That Create Value”. The study included 423 acquisitions
from 1994 to 1999. It has also been observed that mergers done by well
governed acquirers are profitable and by badly managed acquirers
though destroy value but increases the operating performance. This
paper tries to know how the performance increases for the former. It
documents the operating mechanisms that generate post-merger
efficiencies. The researcher compares the operating ratios of the
combined firm pre and post-merger. The G index of acquirer and target
is compared to combined firm. Repurchases, purchases of minority
stakes, self-tenders and recapitalizations are excluded and the firms are
publicly traded. The measure of value creation is the free cash flows
and the performance ratios are considered. The friendly mergers
perform the best, followed by hostile merger and lastly neutral
mergers. It can be concluded that post-merger performance of the firm
is high if the corporate governance is higher and also, if the managers
are able to exploit the inefficient market effects. In general, this paper
demonstrates the benefits of better corporate governance in the context
of mergers.
The paper by Francis, Hasan & Sun (2006) titled “Financial
market integration and the value of global diversification: Evidence
for US acquirers in cross-border mergers and acquisitions” examines
how differences in financial market integration across nations impact
the performance of firms that diversify globally. It proposed that when
a pair of merging firms come from two countries with different degrees
of financial market integration (a proxy of average firms’ ability to
access foreign capital in a particular country), the benefits of the newly
created internal capital market will be larger than those created by a
pair of merging firms from countries with similar degrees of financial
market integration. The sample used is 1,491 US bidders. Results
demonstrate that the financial market integration status of targets’
home countries has a statistically significant relation with the
announcement effects for US bidders. And this relation is driven
Mergers and Acquisitions and Corporate Performance: A Critical Review
46
primarily by unrelated transactions. There is a positive relationship
between post-merger operating performance and the bidders’
abnormal returns. It is argued that the value of global diversification
varies with the target countries’ capital market integration. The
findings from both the post-merger operating performance and stock
price reaction support the inference that the performance of the merged
firm is enhanced when the merging firms are from countries or markets
with different or opposite financial market integration status. Firms in
segmented capital markets may be able to resolve their capital
constraints since more capital may be available or maybe transferred
internally from firms based in integrated markets to them. This renders
the above argument as conceivable.
The paper by Betrand, Hakkala and Norbäck (2007) titled “Cross-
Border Acquisition or Greenfield Entry: Does it Matter for Affiliate
R&D” investigates empirically whether the choice of entry mode of
FDI, that is M&A or Greenfield entry, is of importance for affiliate
R&D activities. Data is collected from Research Institute of Industrial
Economics about Swedish multinational firms. It is found that acquired
affiliates are more likely to do R&D and have a higher level of R&D
intensity than Greenfield affiliates. There is no evidence that R&D in
acquired affiliates is terminated, or to a higher degree reduced over
time than in affiliates created through Greenfield entry. In terms of
policy implications, these results show that restricting cross-border
acquisitions in order to favor Greenfield investments may lead to a
reduction in MNEs’ technology transfers to the host countries. Another
main finding is that the gap in affiliate R&D performance between the
entry modes is explained by differences in parent, affiliate and country
characteristics, but also by the fact that affiliate R&D performance
reacts differently to these characteristics. Findings suggests that R&D
activities of acquired and Greenfield affiliates follow different
statistical relationships. The latter result provides support for the new
and fast-growing literature on cross-border acquisitions, emphasizing
that Greenfield entry and cross-border acquisitions are likely to be
driven by different strategic motives.
According to Doeswijk, (2007) his paper titled “Mergers and
Acquisitions in the Dutch stock market”, mentions that for the relative
stock-price performance of mergers and acquisitions, it is important to
make a clear distinction between the abnormal return around the
announcement date and the long-term abnormal returns. The
shareholders of takeover targets are the main beneficiaries around the
announcement date, while the picture for acquirers and/or mergers is
less clear. The data size is 11 mergers and therefore too small to attach
any statistical significance. The study has excluded takeovers of
foreign companies by Dutch firms Share prices of companies involved
in a merger usually show a run-up in the period leading up to the
announcement. Market rumors of a potential deal can push up prices.
In the long term, the shares have not shown any signs of improvement
in this study. Monday is popular because deals are often finalized at
the weekend when the financial markets are closed and when rumors
or information leaks cannot influence the stock price.
The paper on stock split Guo, Liu & Song ( 2007) “Stock Splits as
a Manipulation Tool: Evidence from Mergers and Acquisitions”
examines whether some firms use stock splits as another tool to
perhaps manipulate their stock price before an acquisition. Acquiring
firms are more likely to split their stocks before acquisition
announcements than after acquisition announcements. It was observed
that the value of the firm‘s earnings and the probability of stock split
are inversely related to each other. The target firm should be confident
about the acquirer and its performance. The larger the deal, the higher
the probability of a stock split and moreover if the deals are stock
financed, the chances are even higher. The paper proposed to expect
that the lower the quality of a firm’s earnings before the acquisition
announcement, the more likely the acquirer was prone to use stock split
as a tool to manipulate its equity value. The empirical evidence
supported this prediction. The study found that firms with lower
earnings quality were more likely to split their stocks before
acquisition announcements compared to otherwise. Results suggest
that target shareholders should be cautious when evaluating proposed
merger offers. Target firms may consider such information when
discriminating among acquirers to ensure that stock prices are not
being manipulated and that exchanges are conducted on fair terms. It
is to be checked whether they have recently conducted a stock split and
how high their discretional accruals are.
The paper by Kumar and Rajib (2007) titled “Mergers and
corporate performance in India: An empirical study” tries to capture
the variations in the operating performance of the merged firms from
1995 to 2002. The sample consists of 57 large mergers. There are
mainly two main research approaches which rationalize Mergers and
acquisitions profitably. The event studies examine the abnormal
returns to shareholders in the period surrounding the announcement
date such activity. The accounting studies examine the reported
financial results of the acquirers or the new firm before and after such
activity to establish the positive or negative changes in the financial
performance. Three alternative methodologies were used in the study.
The cash flows were deflated by the market value of the assets, book
value of assets and the sales value. Of the three alternatives, the model
using the market value of the assets does not support the hypothesis
that performance improves after mergers. The other two approaches
show that it does. The market based measure of cash flow returns
explained in the paper has a limitation. An efficient market capitalizes
the value of any expected post restructuring improvement in the
acquirer’s performance at the takeover announcement date. If the
equity revaluations are included in the asset base, then cash flow
routine would not reflect any abnormal increase even though the
merger results in an increase in the same. A cross-sectional regression
approach is used to compare the performance o the firms before and
after the merger.
In contrast to all the other studies the paper by Luypaert (2007)
titled “Determinants of Growth through Mergers and Acquisitions:
Empirical Results from Belgium” tries to enumerate the effects of
mergers on economies, industry growth, and deregulation. Also, the
countries considered in the study are not US or UK firms; rather they
are the continental Europe. Multivariate logit results show that unlike
earlier other research, internal cash flow generation and the stock of
cash slack do not affect the M&A decision in a typical Continental
European setting. Firms that are relying more heavily on bank loans
are less likely to initiate M& As. M&As are more likely in industries
where incumbents are operating at a relatively low scale. Besides,
M&As have a higher probability of occurrence in industries that are
less concentrated and that were recently deregulated. Also, larger firms
are more likely to go for M&As as external financing is easily
available. Aggregate financial market conditions, however, do not
affect the M&A decision. The sample data included all the deals that
were announced, even though they were not concluded. The synergies
are not one of the main reasons why there is a trend of external growth.
The paper by Mantravadi & Reddy (2007) titled “Relative Size in
Mergers and Operating Performance: Indian Experience” aimed at
analyzing the post-merger operating performance for acquiring firms
in Indian industry. The period is post-reform period, from 1991-
2003.The post-merger operating performance of acquiring firms for
different relative sizes (of acquiring and acquired firms) were
analyzed. The objective was to observe if differences in sizes of

Management Today Vol.5, No.1 January-March 2015
47
acquiring and acquired firms can cause a different impact on the
outcome compared to general results of merger studies. The analysis
of pre- and post-merger operating performance ratios for the acquiring
firms in the sample seems to indicate that relative size does make some
difference to the post-merger operating performance of acquiring
firms. These results suggest that where the relative size of the target
firm is more than the acquiring firm, there is no impact on the post-
merger operating performance compared to the pre-merger
performance. However, in such cases, there has been a significant
decline in returns on net worth and capital employed, and a marginal
increase in financial leverage. In case of a different size ratio, results
suggest that where the merging and merged firms are of relatively the
same size by market capitalisation, there is no impact on the post-
merger operating performance compared to the pre-merger
performance, i e, that mergers cause no change in operational
efficiency of acquiring firms in similar size mergers. The paper
mentions three distinct trends in the M&A activity in India after the
reforms in 1991.
In the initial period, a consolidation wave was witnessed and
intense investment. Companies tried to prepare for the
potential aggressive competition in domestic and overseas
markets, through acquisitions and mergers, to achieve
economies of scale and scope.
In the second trend, from 1995, there was increased activity in
consolidation of subsidiaries by multinational companies
operating in India, followed by the entry of several
multinational companies into Indian markets. Indian
companies focused on capital and business restructuring, and
cleaned up their balance sheets. There was consolidation in the
domestic industries such as steel, cement and telecom.
The third wave of mergers and acquisitions in India, evident
since 2002, is that of Indian companies venturing abroad, and
making acquisitions in developed and other developing
countries, for gaining entry into international markets.
The study done by Samitas & Kenourgios (2007) titled “Impact of
mergers and acquisitions on stock returns of tramp shipping firms”,
focuses on the tramp shipping companies which are members of
NASDAQ & NYSE. The event study analysis has been done through
bootstrap method. The results clearly indicate that the event studies
bring positive returns to the firms and the stock returns are also
positive.
Srinivasan & Mishra (2007) in their article titled “Why do firms
merge/acquire: An analysis of strategic intent in recent M&A activity
among Indian firms”, tried to analyze the motives of M&As among
the Indian firms. The number of companies is 30. In their paper they
did “content analysis” of the statements made by the top management
of the firms involved in the media to analyze the intent. Content
analysis is “a research technique for making replicable and varied
inferences from data according to their context.” It is done at two
levels: manifest content and latent content. Some of the propositions
that have emerged from the study are:
Marker entry may be a dominant motive of MNCs to acquire
domestic firms.
On the other hand, domestic firms’ sell-off may help to
generate cash and increase growth opportunities.
Another purpose is to wipe out the accumulated loss and this
can be done by selling loss-making firms to more efficient
management.
MNCs may offer higher premiums for acquisition as compared
to domestic ones.
The more the intent between the two parties is complementary,
the more the synergy is likely to be leveraged.
This paper does not consider the issues of taxation and regulation
and the propositions can be extended over a higher sample size and can
be validated for three to five financial years.
Ashenfelter and Hosken (2008) in their paper titled “The effects of
mergers on consumer prices: Evidence from five selected case studies”
studied the effect of mergers from a different point i.e. the consumers
instead of investors. In the late 1990’s, the U.S. economy witnessed
the largest merger wave in its history. The number of merger filings
doubled in 1999 as compared to 1994 yet the number of people
employed as economists and lawyers in antitrust agencies was fairly
constant. Given the huge surge in workload, the agencies had to make
difficult choices in deciding which of the cases it wanted to pursue
during this time period. Five mergers were taken as a case study and
showed that four of them witnessed a rise in prices. Also, the study
does not study the effects if the mergers are rejected, even though they
would be favorable. The study does not focus on the post-merger
performance of the financial statistics of the firm.
The paper titled “Trends and Perspectives on Corporate Mergers
in Contemporary India” by Beena (2008) states that out of the total
sample cases chosen for this study, around 70 per cent were horizontal
M&As, 11 per cent were vertical M&As while 18 per cent were
conglomerate mergers. Product-groups in which there has been
incidence of at least one merger or acquisition during 1995-2000 were
considered and were divided into 52 categories. The main objective of
this paper is to examine whether there is any significant difference in
their performance between pre- and post-merger phases and if there is
any significant difference in the performance of acquiring firms during
1990-2005 as compared to the average performance of the
manufacturing sector as a whole. Evidence suggests that the new
economic environment of the 1990s has facilitated M&As between
companies under domestic or foreign ownership. Firms under the same
business groups and similar product lines dominated the merger wave.
The average performance of acquiring firms based on all indicators
during 1990-2005 was relatively better than that of the manufacturing
sector as a whole.
The study done by Diecidue (2008) titled “Shareholders’
expectations, aspiration levels, and mergers” show that shareholder
expectations, captured as aspiration levels in stock prices, can motivate
managers to favor mergers, even when the expected value of takeovers
is lower than alternative investments. This merger seeking behavior
increases in stock momentum, particularly in overvaluation. Also,
managers opt for riskier mergers in order to meet shareholder
optimism. In this paper the researcher also analyzed the merger
decision making behavior of a better informed manager. In the model,
the key idea is that shareholder expectations, as expressed in firm
valuation, constitute an aspiration level for management. The paper
has certain limitation and they are:
The decisions taken by managers are considered since
individual decisions are governed by predictive behavior. The
manager’s behavior was modeled as a decision problem,
abstracting entirely away from all strategic interactions with
other players. In reality, other market players such as the
target firm will react taking into account the motives behind
the manager’s decision.

Mergers and Acquisitions and Corporate Performance: A Critical Review
48
Secondly, in the model the manager is uniquely motivated by
the aspiration level. In practice, managers will not be so
insensitive to other factors, in part because owners of firms
will give other incentives than firing the manager in case of
disappointing results.
The paper titled “Stock returns in mergers and acquisitions” by
Hackbarth and Morellec (2008) develops a model for the dynamics of
the stock returns. There are two endogenous variables, the timing and
the terms of takeovers and they result from value-maximizing
decisions. The sample taken is 1086 takeovers of publicly traded U.S.
firms between 1985 and 2002. The paper presents a theory and also
examines the implications of that theory. In the model, the more
inefficient firm sells its asset to the less inefficient firm and thus
employed the resources to their best use. In the model, investment
decisions have two vital characteristics. Firstly, there is uncertainty
regarding their benefits and secondly these decisions are at least
moderately irreversible. The paper shows that beta does not exhibit
significant change prior to the takeover and drops moderately after a
merger announcement for the full sample. If the sample is split into
two sub-groups of a higher and lower pre-announcement beta with
their targets, then the patterns of the beta of acquiring firms are
coherent with the model’s predictions.
Another paper by Mantravadi & Reddy (2008) titled “Type of
Merger and Impact on Operating Performance: The Indian
Experience” emphasizes that the mergers are in trends. The first trend
being within the nation where small firms consolidated to face the
competition from the foreign players while the second phase started
from 1995, witnessing the coming of multinationals to acquire the
Indian subsidiaries. The third trend shows that Indian companies going
abroad and acquiring the developed markets. The main objective of the
study was to enumerate the method of mergers which improves the
performance at the maximum. The measures of performance are
Operating profit margin, G.P. margin, N.P margin, RNW, ROCE, D/E
ratio. Sample includes the listed companies at NSE/ BSE. According
to the findings, it has been established that mergers do not improve the
performance as the measures of performance did not give any positive
returns. The negative effects were greater in case of RNW and ROCE.
Comparison of post- vs pre-merger operating ratios, for the different
types of mergers suggested that horizontal mergers had caused the
highest decline in the operating performance of the merging
companies, followed by conglomerate and vertical mergers
respectively. The declines were more prominent in terms of returns on
net worth and capital employed, and to a lesser extent on net profit
margin, among all types of mergers. The declines in profitability
margins at the operating and gross level were not significant among
the various types. The differences between different combinations of
mergers however, were not statistically significant, leading to the
conclusion that merger outcomes were similar for all merger types.
The paper by Mehrotra, (2008) tiled “Impact of Japanese Mergers
on Shareholder Wealth: An Analysis of Bidder and Target
Companies” examines whether rescue mergers occur in Japan and
what role the main bank plays in these mergers. The study was carried
on in Japan and it was found that the second merger wave in Japan was
caused by economic shocks. The paper takes 91 mergers between
listed companies in the period 1982-2003 and examines whether the
main bank was involved in mergers in which a failing firm was
involved. For target and bidder companies with a main bank the study
measured leverage as main bank loans divided by total debt. Test
period starts 50 days prior to the announcement date and stops 50 days
after. It is found that the stock price of the target company starts to rise
as early as fifty days before the announcement. The findings are
enumerated as follows:
The corporate control market in Japan reacts differently from
that in the U.S. It is seen that in stark contrast to the pro-
cyclical U.S. merger waves, mergers in Japan are counter-
cyclical. This is true in terms of the general economy and with
respect to stock market valuations.
Second, it is observed that a significant fraction of Japanese
mergers are coordinated by the main banks and therefore a
striking pattern emerges. When the main bank is the same for
the bidder and Target Company, its involvement does not
create shareholder wealth. The performance of at least one of
the merging companies is strong, indicating that the same main
bank is primarily motivated to protect its own interests as
creditor. This was especially evident in the period after the
stock price bubble burst and the same main bank arranged
mergers of weak borrowers with a financially strong buyer. In
the entire period the same main bank’s involvement in mergers
between two weak companies is low.
The positive pre-announcement returns accruing to both
bidders and targets, with bidders capturing approximately half
the gains that accrue to target firms.
Most of the merger literature mainly focuses on the operating
performance of the firms. A study by Ramakrishnan (2008) titled
“Long term post-merger performance of firms in India” proves this
fact. This paper tries to validate if the long term post-merger
performance of the firms improves. The basis of performance is the
operating cash flow-scaled by the assets, operating margin and sales
turnover. It says that on an average the merging firms have performed
better in India as compared to their pre-merger performance. It says
that the operating performance has improved due to the merger. The
study did not consider the cross-border mergers, financial sector
mergers. The time frame used is -3 to -1 for pre-merger year, though
the year of the merger is excluded from the analysis. The 3 year period
post-merger witnesses a growth in the operating performance. Another
observation is that, the sales turnover of the firms does not change after
the merger. The mergers are mainly studied from the standpoint of US
firms and the global implications, if considered, would also affect the
Indian manufacturing sectors.
The study done by Kumar & Panneerselvam (2009) titled
“Mergers, acquisitions and wealth creation: A comparative study in
the Indian context” tries to explore the stock market reaction to M&A
announcements on a comparative basis. Some of the questions that
were addressed in this paper were whether the stock prices of the
merging firms reflected the information on mergers immediately, was
there any abnormal return, both positive and negative. If yes, then how
these returns were apportioned between the target and the bidder
firms? The market efficiency was also measured. The results are as
follows:
The announcement date highest returns are for target firms
involved in mergers, followed by acquirer firms in mergers.
The third in the line are acquirer firms in acquisitions.
The gains of target firms are higher in all time windows for
merger activity than any other one.
The overall gain in wealth in case of mergers is much higher
as compared to acquisitions.
The analysis also shows that the efficient market hypothesis is
accepted as the prices of the stock incorporate the changes in
the structure of the company due to M&A.

Management Today Vol.5, No.1 January-March 2015
49
The study also documents that the stockholders of the
acquiring firms gain more as compared to the target firms in
acquisitions. The case is reversed in case of mergers.
Finally based on the study it can be concluded that mergers are
a better value creating tool as compared to the acquisitions
process.
A paper by Saboo & Gopi (2009), titled “Comparison of post-
merger performance of acquiring firms (India) involved in domestic
and cross – border acquisitions” aimed at reviewing the operating
performance of firms advancing the M&As path for their expansion
plans in the Indian corporate scenario post 2000. It was also an attempt
to test whether there were any variations in the outcome due to mergers
in domestic market as compared to those in overseas market. The
results of the analysis show that the performances of the acquiring
firms have been impacted negatively after the foreign merger. The
decrease was observed when the results were analyzed for
performance ratios of pre and post 1-year of merger and pre and post
2 –years of mergers. The hypothesis that Merger of cross – border
firms has improved the operating performance of the acquiring firm
was rejected. Another point which has emerged from the analysis is
that merger has different effect when a domestic firm is acquired or
when a cross- border firm is acquired. Therefore, the hypothesis that
Merger effect does not depend on whether it is cross border acquisition
or domestic acquisition is also rejected. There are certain limitations
of the study and the different samples are not of the same
characteristics. Another factor which may cloud the real effect is that
the sample period is 2000- 2007 and there have been two bubble
bursts- the dot com bubble and the real- estate bubble during this time
frame.
The paper by Saraswathy (2010) titled “Cross-border mergers and
acquisitions in India: extent, nature and structure” focuses on the
merger wave in the overseas economies where the M&A is the favorite
mode of corporate restructure as compared to Greenfield investment.
The paper uses firm level data for identifying three distinct phases of
merger activity of India. The pre mid 1990s merger scenario was
dominated by domestic deals, followed by an increasing number of
cross-border deals within the country since the mid-1990s. Finally, the
last stage of overseas deals during the post 2000 period shows that the
economy is shaping gradually for merger motives. The study shows
that the service sector mergers are the major force of the world FDI
movement. It was concluded that 35% of the mergers and acquisitions
deals occurred in India during 1978 to November 2007 were cross-
border. It significantly increases only after mid-1990s. Sector-wise,
manufacturing has been the largest seller, whereas the service sector
made the majority of the purchases. The share of primary sector share
remained to be insignificant. Within manufacturing, Drugs and
Pharmaceutical industry, other chemicals, domestic appliances,
automobiles were the dominant sectors and within services it was
banking and finance. The value analysis shows that majority of the
deals were small but there was a considerable number of mega deals
which accounted for the 87% of the value involved. Another
interesting dimension of M&A scenario is the recent increase both in
terms of number and value of the acquisitions by the Indian companies
as a part of their market expansion strategy. They account for a much
higher share than the inbound deals. This phenomenon emphasizes the
acquisition spree of the Indian firms. During the time span of 1994 to
November 2007, there were 563 such deals of which the majority took
place after 2000. A gradual shift from foreign investment to
Brownfield investment can be observed which would eventually lead
technology spillovers and thereby higher productivity and efficiency.
The incidence of large number of horizontal deals principally the
cross-border deals raises another issue -foreign control. The data also
shows that maximum of the deals are mega deals and are frequently
engaging in consolidation strategies in order to grow faster. Thus the
current rush in cross-border deals should be viewed in a multi-factor
dimension involving the push factors from home country such as
market constraint, need for low priced factors of production, increasing
global competition as well as the pull factors from foreign countries
such as the wider market, technology, efficient operation.
Concluding Remarks
This paper is an explanatory attempt for examining the different
studies that have been carried out in the field of M&A which is one of
the most widely applied techniques of corporate restructuring. The
study includes 38 papers by various researchers and the earliest study
enumerated here dates back to 1983. The latest paper in the study is in
2010. Mainly the papers try to focus on the motives of the mergers and
acquisitions. Some papers measure the performance changes in the pre
and post-merger scenario while others measure the gains of the
shareholders of the participating firms. All the above papers though are
not exhaustive but mainly emphasize on the mergers and its effects.
Maximum of the papers show that the target firms are more beneficial
as compared to the acquirers. The Indian merger scenario took a
quantum jump after the post liberalization period. One interesting
phenomenon is the comparison of the Greenfield Investment and the
Merger, both having the same source of Finance i.e. the FDI flows. It
is seen that the mergers in Indian economy is in the third phase of its
development and mostly the firms are venturing abroad for acquiring
the firms. Since the former involves mainly new capital assets, while
the latter is just a transfer of existing ones. Greenfield FDI would affect
growth more through increased physical investment, while M&A FDI
would be more likely to do so through enhanced productivity growth.
Synergy is the reason for mergers. It implies a situation where the
combined firm is more valuable than the sum of the individual firms
combining. It refers to benefits other than those related to economies
of scale. The combination of two firms will yield a more valuable
entity than the value of the sum of the two firms if they were to stay
independent:
Value (A + B) > Value (A) + Value (B)
Mergers and Acquisitions are an important sphere of the corporate
strategy and after the liberalization of 1991 have acquired a new
dimension in the Indian economy. Even though it is difficult to count
the deals since most of them are not declared in public and many are
anonymous but the trend shows that M&A are coming up in the world
economy in a big way. With the changing economic structure, mergers
could well be a major driving force.
References
Andrade, Gregor; Mitchell, Mark; & Stafford, Erik. (2001). New
Evidence and Perspectives on Mergers. The Journal of Economic
Perspectives, Vol. 15, No. 2. 103-120.
Ashenfelter, Orley & Hosken, Daniel. (2008). The effect of mergers
on consumer prices: Evidence from five selected case studies.
National Bureau Economic Research, NBER Working Paper No.
13859.
Baxamusa, Mufaddal. (2006). Mergers That Create Value. Carlson
School of Management, University of Minnesota, JEL
classification: G30; G34
Beena, P. L. (2004). Towards understanding the merger wave in the
Indian corporate sector: A comparative perspective. Working
Paper 355, JEL Classification: D43, G34, L5.

Mergers and Acquisitions and Corporate Performance: A Critical Review
50
Beena, P. L. (2008). Trends and Perspectives on Corporate Mergers in
Contemporary India. Economic & Political Weekly, 48-56.
Bertrand, Olivier; Hakkala, Katariina & Norbäck, Pehr-Johan. Cross-
Border Acquisition or Greenfield Entry: Does it Matter for
Affiliate R&D? JEL classification: F23, L10, L20, O30.
Calderon, César; Loayza, Norman & Servén, Luis. (2004). Greenfield
foreign direct investment and mergers and acquisitions: Feedback
and macroeconomic effects. World Bank Policy Research Working
Paper- 3192, The World Bank, January.
Carline, Nicholas F.; Linn, Scott C. & Yadav, Pradeep K. (2003). Can
the stock market systematically make use of Firm- and Deal-
Specific factors when initially capitalizing the real gains from
Mergers and Acquisitions? Department of Business and
Economics, Monash University, Clayton VIC 3800, Australia.
Chari, Anusha; Ouimet, Paige & Tesar, Linda L. (March 2004). Cross
border Mergers and Acquisitions in emerging markets: The stock
market valuation of corporate control. Center for International
Business Education at the University of Michigan, NBER Research
paper series.
Diecidue, Enrico; Ven, Jeroen van de; & Weitzel, Utz. (2008).
Shareholders’ expectations, aspiration levels, and mergers.
INSEAD research.
Doeswijk, Ronald Q.; & Floor, Adriaan. (2007). Mergers and
Acquisitions in the Dutch stock market. IRIS.
Ferrett, B. (2003/02). Greenfield Investment versus Acquisition:
positive analysis. Leverhulme Centre for Research on
Globalization and Economic Policy, research paper series. JEL
classification: F21, F23, L12, O31, Research Paper.
Francis, Bill B; Hasan, Iftekhar & Sun, Xian. (2006). Financial market
integration and the value of global diversification: evidence for US
acquirers in cross-border mergers and acquisitions. Bank of
Finland Research Discussion Papers. Bank of Finland Discussion
Papers, 24.
Gorton, Gary; Kahl, Matthias & Rosen, Richard. (May 2005). Eat or
be eaten: A theory of merger and merger waves. National Bureau
of Economic Research, NBER Working Paper No. 11364 .JEL No.
G3.
Guo, Shourun; Liu, Mark H. & Song, Weihong. (2005). Stock Splits
as a Manipulation Tool: Evidence from Mergers and Acquisitions.
Financial Management Association Meetings Boston college,
Hackbarth, Dick & Morellec, Erwan. (June 2008). Stock returns in
mergers and acquisitions. The Journal of Finance, Vol. LXIII, No.
3, 1213-1252.
Healy, Paul M.; Palepu, Krishna C.; & Rubak, Richard S. (1990). Does
corporate performance improve after mergers? NBER Working
Paper Series, WP 3348.
Kumar, B. Rajesh & Rajib Prabina. (Jan-June, 2007). Mergers and
corporate performance in India: An empirical study. Decision, Vol.
34, No.1, pp. 121-147.
Luypaert, Mathieu & Huyghebaert, Nancy. (2007). Determinants of
growth through Mergers and Acquisitions: Empirical results from
Belgium. EFM Association.
Mantravadi, Pramod & Reddy, A Vidyadhar. (2008). Type of Merger
and Impact on Operating Performance: The Indian Experience.
Economic and political weekly, 66-74.
Mantravadi, Pramod & Reddy, A Vidyadhar. (2007). Relative Size in
Mergers and Operating Performance: Indian Experience.
Economic and political weekly, 3936-3942.
Mehrotra, Vikas; Schaik, Dimitri; Spronk, Jaap & Steenbeek, Onno W.
(2008). Impact of Japanese Mergers on Shareholder Wealth: An
Analysis of Bidder and Target Companies. ERIM Report Series,
Research in Management, Erasmus Research Institute of
Management (ERIM).
Ramakrishnan, K. (June 2008). Long term post-merger performance
of firms in India. Vikalpa, IIM-A, Vol. 33, No. 2, pp. 47-63.
Rosen J. Richard. (2003). Merger momentum and investor sentiment:
the stock market reaction to merger announcements. Journal of
Business, JEL classification: G34, G14.
Saboo, Siddarth & Gopi, Sunil. (2009). Comparison of post-merger
performance of acquiring firms (India) involved in domestic and
cross-border acquisitions. Munich Personal Repec Archive. Paper
No. 19274.
Samitas, Aristeidis G. & Kenourgios, Dimitris F. (2007). Impact of
mergers and acquisitions on stock returns of tramp shipping firms.
International Journal of Financial Services Management, Vol. 2,
No. 4, pp.327-343.
Saraswathy, Beena. (2010). Cross-border mergers and acquisitions in
India: extent, nature and structure. Working paper 434, Centre for
Development Studies, JEL classification: D43, G37, L40, F23
Savor Pavel, G. & Lu, Q. (2004-05). Do Stock Mergers Create Value
for Acquirers? Boston College Journal.
Seth, Anju; Song, Kean P.; & Pettit, R. Richardson. (Oct., 2002). Value
Creation and Destruction in Cross-Border Acquisitions: An
Empirical Analysis of Foreign Acquisitions of U.S. Firms.
Strategic Management Journal, Vol. 23, No. 10, 921-940.
Srinivasan, R & Mishra, B.P. (2007). Why do firms merge/acquire: an
analysis of strategic intent in recent M&A activity among Indian
firms? IIMB Management Review, 388-402.
Subramaniam, Ajay. (April 2004). Option Pricing on Stocks in
Mergers and Acquisitions. The Journal of Finance, VOL. LIX, NO.
2, 795-830.
Note about the author: Ms. Madhumita Dasgupta;
I have been a MBA faculty from the year 2007 and have been
part of various B-schools. Presently I am pursuing my Ph.D from
the Department of Commerce, University of Calcutta and working
in the finance background and my area of research is Mergers and
Acquisitions. The present work is a review paper of the existing
literature in this area and it is an attempt to design the platform of
my doctoral thesis which would be reviewing the performance of
the merged firms in the post-merger era.

SUBSCRIPTION FORM
Name:
Mailing Address:
Tel. No. Fax (if any):
E-mail:
Payment Particulars: (DD/ NEFT Details):
(Subscription can be paid as per the rates given hereunder either through a DD taken on a bank located in Hyderabad, Andhra Pradesh, India or through the direct deposit in or transfer to the account given hereunder in the core banking system.)
Subscription Rates Period Indian Foreign
One Year Rs: 1500 $100
Two Years Rs. 2400 $160
Three Years Rs. 3600 $240
Details of the Bank Account for direct deposit or transfer of the Subscription Amount Account Holder Name of the Bank and Address Account Details
Managing Editor, Management Today, GokarajuRangaraju Institute of Engineering and Technology, Bachupally, Kukatpally, Hyderabad-500090
Oriental Bank of Commerce, GRIET Campus Branch, Bachupally, Ranga Reddy Dt., Hyderabad – 500090, Telangana State, INDIA.
Account No: 18822041001544
Cust. ID: 35103686
MICR Code: 500022038
IFS Code: ORBC0101882 Mailing Address: Dr. K.V.S.Raju, Managing Editor, Management Today, Department of Management Studies, Gokaraju Rangaraju Institute of Engineering and Technology, Bachupally, Kukatpally, Hyderabad, Telangana State, India, PIN – 500090 Tel: +91-40-65864440, 65864441, Fax: +91-40-230408060, Mobile No: +91-9949655559, Website: http://www.griet.ac.in, E-mail: [email protected] Place: Date: (Signature of Subscriber)

Published by Gokaraju Rangaraju Institute of Engineering & Technology, Hyderabad
COPYRIGHT TRANSFER FORM
(Duly filled in and signed copyrights transfer form should accompany the paper submitted for publication in Management Today)
Title of the Paper:
Author(s):
Address(es):
All the author(s) hereby agree for the following:
1. I/we hereby declare that this paper is a product of original research work carried on by me/us.
2. I/we am/are responsible for plagiarism or copyright violation if any. 3. Copyright rights of this work/paper are hereby transferred to Management Today. The
transferred rights include information rights to electronic media, translation rights, adaptation rights and utilization rights of the above mentioned paper.
4. This work or a substantial part of this has not been published elsewhere and is not currently under consideration for publication anywhere and in any language.
5. This work shall not contravene upon the rights of any third party.
Name of Author(s): Signature(s)
Date: