4th oecd world forum statistics, knowledge and policy: measuring wellbeing for development and...
TRANSCRIPT

4th OECD World Forum Statistics, Knowledge and Policy: Measuring Wellbeing for Development and Policy Making
Jose Viegas16-19 October 2012 in New Delhi, India

Proximity and transport provide access to key components of quality of life
Health Education Jobs

Accessibility is affected by risks for life and for personal health
Traffic safety Noise and pollution

We Already Benchmark Road Safety
India:
• 135 000 killed in 2010
• Per capita rate up x3
in last 30 years
• Per vehicle this is 40
times higher than best in
OECD
4
IndiaArmeniaGeorgia
AzerbaijanAlbania
MoldovaUkraineRussia
BelarusMontenegro
FYROMRomania
Bosnia-Herz.TurkeySerbiaLatviaKorea
BulgariaCroatia
HungarySlovakia
PolandLithuaniaPortugalGreece
Czech Rep.United States
EstoniaBelgium
New ZealandSloveniaCanadaFranceAustria
DenmarkIreland
AustraliaItaly
SpainLuxembourg
FinlandGermany
JapanNetherlands
NorwaySwitzerland
MaltaUK
SwedenIceland
0 250 500 750 1000 1250 1500
Road deaths per million motor vehicles 2010ITF Stats

Measuring urban access• Multiple indicators are possible - choice dictated by purpose and
data availability
• Main targets of urban access are jobs, education (by advancement level), health (by sophistication level).
• Example:– Travel time (differentiated by mode) to reach 25% of jobs / school
positions / available doctor appointments
– Ratios of these indicators for private car vs. public transport vs. active modes
• These aspects are important not only for individual quality of life but also for social inclusion and economic development
5
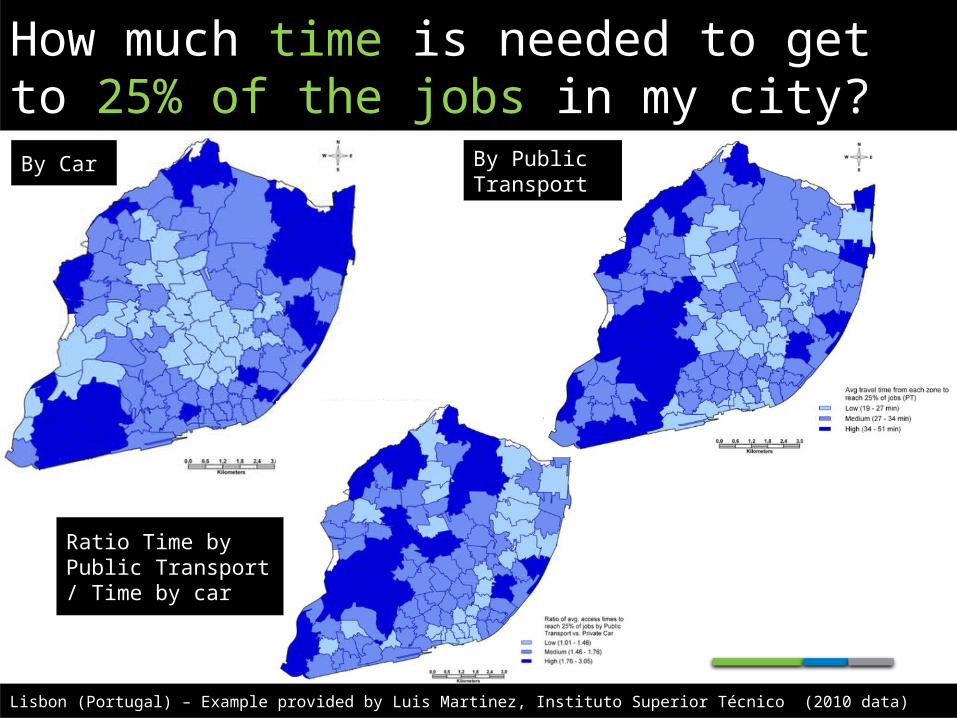
How much time is needed to get to 25% of the jobs in my city?
Lisbon (Portugal) – Example provided by Luis Martinez, Instituto Superior Técnico (2010 data)
By Car By Public Transport
Ratio Time by Public Transport / Time by car

How many jobs can I access in 30 minutes by car?
Minneapolis – St. Paul, Minnesota (USA) 2005, Map by University of Minnesota Traffic Observatory

How many jobs can I access in 30 minutes by public transport?
Minneapolis – St. Paul, Minnesota (USA) 2005, Map by University of Minnesota Traffic Observatory

Conclusions• Accessibility is a necessary component for measuring well-being
– Methods and approaches can be adjusted to data available
• Measurement of other transport-related components can be improved
– Traffic safety risk, exposure to noise and pollution
• International Transport Forum can contribute to policy discussion and
measurement
• This will lead to better policies towards inclusive well-being
9