4fp-structure: a robust local region feature descriptor
TRANSCRIPT
Delivered by Ingenta to: ?IP: 5.10.31.210 On: Fri, 22 Dec 2017 12:41:29
Copyright: American Society for Photogrammetry and Remote Sensing
4FP-Structure: A Robust Local Region Feature Descriptor
Jiayuan Li, Qingwu Hu, and Mingyao Ai
Abstract Establishing reliable correspondence for images of the same scene is still challenging work due to repetitive texture and unknown distortion. In this paper, we propose a region-matching method to simultaneously filter false matches and maximize good correspondence between images, even those with irregular distortion. First, a novel region descrip-tor, represented by a structure formed by four feature points (4FP-Structure), is presented to simplify matching with severe deformation. Furthermore, an expansion stage based on the special 4FP-Structure is adapted to detect and select as many high location accuracy correspondences as possible under a local affine-transformation constraint. Extensive experiments on both rigid and non-rigid image datasets demonstrate that the proposed algorithm has a very high degree of correctness and significantly outperforms other state-of-the-art methods.
IntroductionAs a basic step for many remote sensing and computer vision applications, such as image registration (Brown and Lowe, 2003), structure from motion (Snavely et al., 2006), and simultaneous localization and mapping (SLAM) (Montemerlo et al., 2002), automatic image matching has been well studied in recent years. Current feature matching algorithms (Bay et al., 2008; Ke and Sukthankar, 2004; Lourenço et al., 2012; Lowe, 2004; Rublee et al., 2011; Tola et al., 2010) typically consist of three major stages: keypoint detection, keypoint description and keypoint matching. In the first stage, salient and stable interest points are extracted. These keypoints are then described based on their photometric neighborhoods using properties such as local gradients. In the third step, the distances between the descriptor vectors are calculated to recognize reliable correspondences. Among these methods, the most famous is the scale-invariant feature transform (SIFT) (Lowe, 2004) due to its robustness to image scale, rotation, illumination and viewpoint change.
For rigid scenes, such a framework can achieve remarkable results. Point correspondences can be produced with high correctness rate. Although there are some false matches be-cause of ambiguities that arise from poor or repetitive texture, a postprocessing step such as RANSAC (Fischler and Bolles, 1981) or graph matching (Conte et al., 2004) can be adopted.
The RANSAC algorithm is a robust technique for model fitting with noise and outliers, which has been widely used in computer vision and machine learning. The basic idea of RANSAC is simple but effective: first, randomly select a subset of correspondences to compute the candidate fundamental or homography matrix because perspective images satisfy the epipolar or homography constraint. Then, count the number of correspondences that support this transformation model. If the number is sufficiently large, the transformation matrix can be considered a good solution. The matches that sup-port it will be accepted as inliers; in contrast, others will be discarded as outliers. RANSAC, however, works well only if
two prerequisites are satisfied. The first is a sufficiently high inlier rate. Literature (Liu and Marlet, 2012) reports that RANSAC-like (Chum and Matas, 2005b; Chum et al., 2003; Torr and Zisserman, 2000) methods may fail and become very time-consuming when the inlier rate is less than 50 percent. If the inlier rate is very small, the number of required itera-tions becomes huge. The other is the transformation model. A putative model must be given in advance, and the inlier set should satisfy this model well.
Graph matching (Cho and Lee, 2012; Conte et al., 2004; Duchenne et al., 2011) is another powerful and general tool for feature matching. It represents scene images as graphs using feature points, and correct correspondences can be ex-tracted by solving a global optimization function to minimize the structural distortions between graphs (Cho and Lee, 2012). Unlike the RANSAC algorithm which only uses rigid geometric constraints, graph matching can also be applied to non-rigid scenes. However, current methods still assume that the inlier rate is relatively high. The large number of outliers aris-ing from strong distortion may make them impractical. For instance, Duchenne et al. (2011) show that if the outlier rate is more than 70 percent, the performance of graph matching will severely drop. Another problem of graph matching is that it is NP-hard, so the computational costs in time and memory limit the permissible sizes of input graphs.
In this paper, we also focus on feature matching for non-rigid scenes, e.g., fisheye images. A fisheye lens has a large field of view (FOV), which is needed for many vision tasks in photogrammetry and computer vision. For instance, five fisheye images are sufficient for 360° panoramic stitching, but nine perspective images are needed; self-driving vehicles (Geiger et al., 2012) need a large FOV to accurately sense the environment to plan their route. However, fisheye images have an inherent drawback: distortion is severe. Because of that, SIFT (Lowe, 2004) usually cannot work well, and the outlier rate may be very high (higher than 50 percent). In addition, a fisheye image no longer satisfies the homography constraint and has its own epipolar geometry, which can be applied only if the calibration information is provided. These issues make feature matching challenging, as the prerequisites of RANSAC and graph matching are not well satisfied.
To exactly distinguish inliers from outliers for both rigid and non-rigid images, a region-matching method is proposed. We first define a 4FP-Structure, formed by four neighbor-hood feature points, to represent the local region. Using local regions instead of feature points for matching has two advantages: (a) The 4FP-Structure is a 4-node graph that has the ability to resist the distortion in a small region, and it contains four feature points that can restrain each other to
School of Remote Sensing and Information Engineering, Wuhan University, Wuhan, China ([email protected]).
Photogrammetric Engineering & Remote SensingVol. 83, No. 12, December 2017, pp. 813–826.
0099-1112/17/813–826© 2017 American Society for Photogrammetry
and Remote Sensingdoi: 10.14358/PERS.83.12.813
PHOTOGRAMMETRIC ENGINEERING & REMOTE SENSING November 2017 813

Delivered by Ingenta to: ?IP: 5.10.31.210 On: Fri, 22 Dec 2017 12:41:29
Copyright: American Society for Photogrammetry and Remote Sensing
maintain geometric consistency. These properties ensure that good matches can be separated from false matches. (b) Once the local region has been correctly matched, the local affine transformation of this region can be computed based on the four good correspondences. We use four feature points to con-struct the structure because of the consideration of redundant observations. Taking advantage of the special 4FP-Structure, we propose an expansion stage. Many good matches are unde-tected by SIFT because of the strong distortion, and the expan-sion stage has the ability to find as many of them as possible. In addition, our 4FP-Structure consists of only six connecting lines, so the computational complexity is small. The results on a variety of datasets indicate that our work is robust to outliers and can outperform recent state-of-the-art algorithms.
Figure 1 shows the schematic diagram of the main ideas in this paper. Given a pair of images, we first compute a set of initial matches based on feature matching methods, such as SIFT (Lowe, 2004), SURF (Bay et al., 2008), and ORB (Rublee et al., 2011). For each correspondence, we carefully select its three neighbors to construct a local structure called the 4FP-Structure. The 4FP-Structure is then matched based on a region descriptor. The local affine transformation is also es-tablished simultaneously by the specially designed structure. Finally, matches inconsistent with the transformation are removed as outliers, and keypoint pairs consistent with the transformation are accepted as inliers. The proposed method is able to eliminate outliers and maximize good correspon-dences simultaneously. In addition, it is suitable for both rigid and non-rigid image scenes.
The rest of the paper is organized as follows: The next section reviews several related works, followed by details of the proposed region matching method. In the next section, we show the experimental results on both rigid and non-rigid image datasets.Finally, we present a conclusion.
Related WorkEstablishing reliable correspondence between a pair of images has been studied extensively. This section briefly reviews several related works, including RANSAC-like methods, graph-based group and other recently presented techniques.
As mentioned earlier, RANSAC uses a hypothesize-and-verify technique, which alternately computes a putative cor-respondence set and estimates the geometric transformation. There are several variants of RANSAC, such as MLESAC (Torr and Zisserman, 2000), LO-RANSAC (Chum et al., 2003), and PROSAC (Chum and Matas, 2005a). MLESAC introduces a new robust estimator to maximize the likelihood rather than just the inliers. LO-RANSAC enhances RANSAC with a local optimi-zation step, which improves both the speed and the quality
of traditional RANSAC. In PROSAC, the random sampling step is improved. PROSAC draws random samples based on local similarity ordering instead of uniform sampling. Similarly, Li et al. (Li et al., 2017a) propose a normalised barycentric coor-dinate system (NBCS) to improve the random sampling step. A comparative analysis of the RANSAC family may be found in (Raguram et al., 2008).
Unlike the RANSAC family, which assumes rigid geometric constraints, the graph-matching group is also suitable for non-rigid scenes. Progressive graph matching (PGM+MPM) (Cho and Lee, 2012) focuses on the initial construction problem of graphs and presents a move-making approach for graph matching. The progressive framework alternately performs graph probabilistic progression and graph matching steps. Torresani et al.,(2008) cast this task as an energy minimiza-tion problem with an objective function depending on feature similarity, geometric consistency, and spatial coherence. The dual decomposition approach is then adopted to optimize this function. In this work, the geometric consistency term is measured by a “neighborhood system.” Cho et al. (2014) introduce a max-pooling strategy to graph matching (MPM), which is robust to deformations and outliers. Each candidate correspondence is evaluated by its neighbors with contextual information, and the matching scores are gradually propa-gated to update the most promising neighbors. Similar to Tor-resani’s method and MPM, our method also uses local feature neighbors to improve the matching performance. Unlike these methods, the local neighbors of our method form a special structure that can identify the local neighbors as good match-es or not and estimate the local affine transformation. In addi-tion, in Torresani’s method and MPM, local feature neighbors are only used to compute geometric consistency and matching scores in the graphs, respectively. Compared with these global optimization problems, the proposed local-region matching approach is much more efficient and requires less memory.
Cho et al. (2009) formulate image matching as a cluster-ing problem and present a novel linkage model and a new dissimilarity metric in the framework of hierarchical agglom-erative clustering (ACC). In this approach, initial compact correspondence clusters are first formed, and then, locally connected matches are progressively merged with high confi-dence. Literature (Ma et al. (2015a) introduces the L2E estima-tor to estimate the transformation between correspondence sets. Similar to the famous iterative closest point (ICP) (Best and McKay, 1992) algorithm, it also iteratively establishes the point correspondences and estimates the transforma-tion. Wang et al. (2015) use a probability model, called the mixture of asymmetric Gaussian model (MoAG) (Kato et al., 2002), to represent each point set. The matching task is then formulated as an optimization problem and solved under
Figure 1. The schematic diagram of the proposed method. Given a set of putative correspondences, we first construct a local region structure, i.e., 4FP-Structure, for each correspondence. The special 4FP-Structure is then described by a compact descriptor and an expansion stage is performed to extract as many good matches as possible.
814 November 2017 PHOTOGRAMMETRIC ENGINEERING & REMOTE SENSING
Delivered by Ingenta to: ?IP: 5.10.31.210 On: Fri, 22 Dec 2017 12:41:29
Copyright: American Society for Photogrammetry and Remote Sensing
regularization theory in Reproducing Kernel Hilbert Space (RKHS). These methods are time consuming and memory consuming because of the techniques they use. To focus on both correctness and efficiency, Li et al. propose a lq-estimator (Li et al., 2016; Li et al., 2017c) and affine-invariants (Li et al., 2017b) for outlier removal; Ma et al., (2014) propose vector field consensus (VFC) and locally linear transforming (LLT) (Ma et al., 2015b) for robust feature matching. VFC uses a vector field to estimate a consensus of inlier correspondences that follow a non-parametric geometrical transformation. This is formulated as a posteriori maximization problem of the Bayesian model and solved using the Expectation Maximization (EM) algorithm. FastVFC (Ma et al., 2014) reduces the complexity of original VFC; however, the iterative-based method is still slow when the number of tentative matches is large. Similar to VFC, LLT formulates this task as a maximum-likelihood estimation of a Bayesian model. In this model, the local geometrical con-straint, represented by locally linear transforming, is used to preserve local structures. LLT is similar to the proposed method; however, it only uses the local geometrical informa-tion among neighboring features. In contrast, our method uses both geometrical information and texture information among neighboring feature points, making it more robust.
Todorovic and Ahuja (2008) proposed a region matching method by posing image matching as a tree matching prob-lem. First, directed acyclic graphs (DAGs) were generated by merging adjacent nodes of the trees. Then, transitive closures of the DAGs were produced, and a bijection between the two transitive closures on DAGs was established. Thus, the match-ing is to search a maximum subtree isomorphism between the transitive closures. Similar to our method, both geometric and photometric properties are considered. Different from ours, their method is a global region matching method which identifies the largest region with similar information between an image pair.
Closer to our 4FP-Structure descriptor is the KVLD (Liu and Marlet, 2012) method, which also uses virtual lines that join neighboring feature points. KVLD uses k local line matches as photometric constraints to identify inliers or outliers. The main limitation is that KVLD is sensitive to repetitive texture. Differently, we make extensions to KVLD that we consider both photometric and geometric constraints in our method. We define a more compact structure based on local lines called 4FP-Structure descriptor, which not only inherits the advantages of KVLD, but also represents a local region. Local geometric constraint can be efficiently established based on the proposed 4FP-Structure; thus, verification step can be eas-ily adapted to improve the robustness to repetitive texture. In addition, local affine expansion can help us to find as many high location accuracy correspondences as possible, which is important to sparse 3D reconstruction and TIN surface model.
Local Region Matching In this section, we will detail our method, local region match-ing, in the order of the three stages 4FP-Structure construction, 4FP-Structure description and correspondence expansion (Fig-ure 1). The main contribution is the proposed 4FP-Structure region descriptor. 4FP-Structure descriptor is based on line segments which are described by a KVLD-like (Liu and Marlet, 2012) method. It is robust to local geometric distortions and repetitive texture. Benefit from the proposed descriptor, lo-cal affine geometric constraints can be efficiently adapted to remove outliers and find more good matches. We assume that initial matches and keypoints are given as the input of our algorithm, e.g., correspondences generated by SIFT. Certainly,
the performance of the proposed approach does not rely on the particular method used to extract initial feature corre-spondences. This will be verified in the experiment section.
4FP-Structure ConstructionWe define a structure formed by four neighborhood feature points, i.e., 4FP-Structure, to represent a local region. The 4FP-Structure is composed of six connecting lines. To describe this special structure, we first introduce a simple line descrip-tor similar to KVLD (Liu and Marlet, 2012).
Line DescriptorGiven a straight line lpi,pj
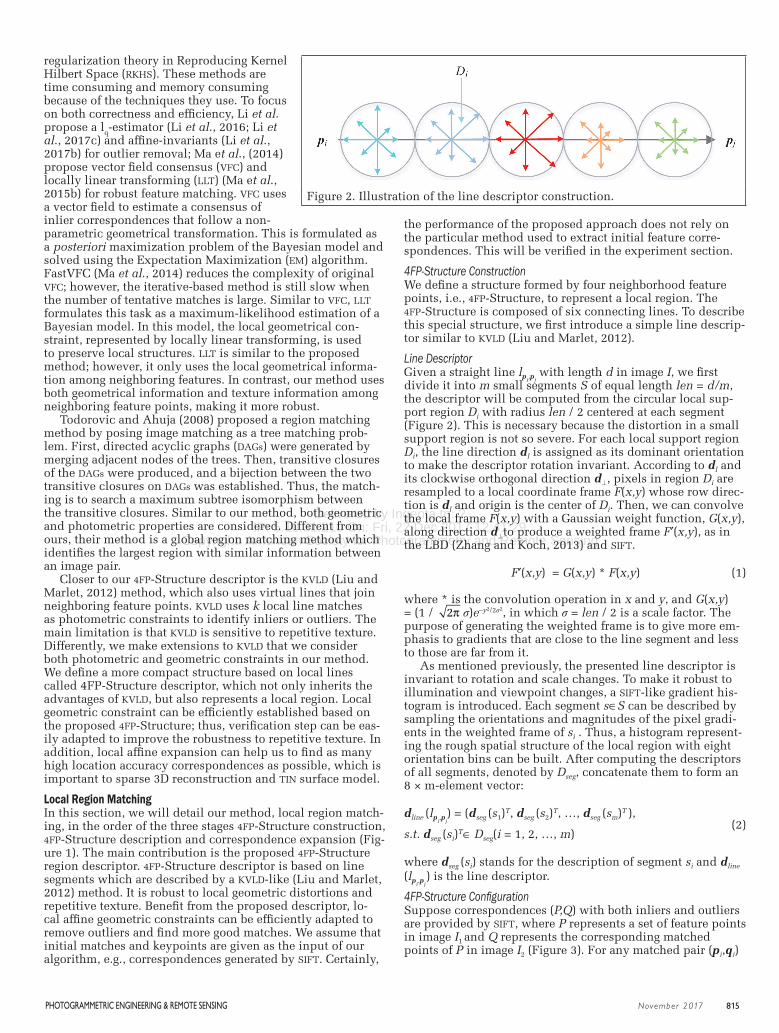
with length d in image I, we first divide it into m small segments S of equal length len = d/m, the descriptor will be computed from the circular local sup-port region Di with radius len / 2 centered at each segment (Figure 2). This is necessary because the distortion in a small support region is not so severe. For each local support region Di, the line direction dl is assigned as its dominant orientation to make the descriptor rotation invariant. According to dl and its clockwise orthogonal direction d^, pixels in region Di are resampled to a local coordinate frame F(x,y) whose row direc-tion is dl and origin is the center of Di. Then, we can convolve the local frame F(x,y) with a Gaussian weight function, G(x,y), along direction d^to produce a weighted frame F′(x,y), as in the LBD (Zhang and Koch, 2013) and SIFT.
F′(x,y) = G(x,y) * F(x,y) (1)
where * is the convolution operation in x and y, and G(x,y) = (1 / 2π σ)e–y2/2σ2, in which σ = len / 2 is a scale factor. The purpose of generating the weighted frame is to give more em-phasis to gradients that are close to the line segment and less to those are far from it.
As mentioned previously, the presented line descriptor is invariant to rotation and scale changes. To make it robust to illumination and viewpoint changes, a SIFT-like gradient his-togram is introduced. Each segment s∈S can be described by sampling the orientations and magnitudes of the pixel gradi-ents in the weighted frame of si . Thus, a histogram represent-ing the rough spatial structure of the local region with eight orientation bins can be built. After computing the descriptors of all segments, denoted by Dseg, concatenate them to form an 8 × m-element vector:
dline (lpi,pj) = (dseg (s1)T, dseg (s2)T, …, dseg (sm)T ),
s.t. dseg (si)T∈ Dseg(i = 1, 2, …, m) (2)
where dseg (si) stands for the description of segment si and dline
(lpi,pj) is the line descriptor.
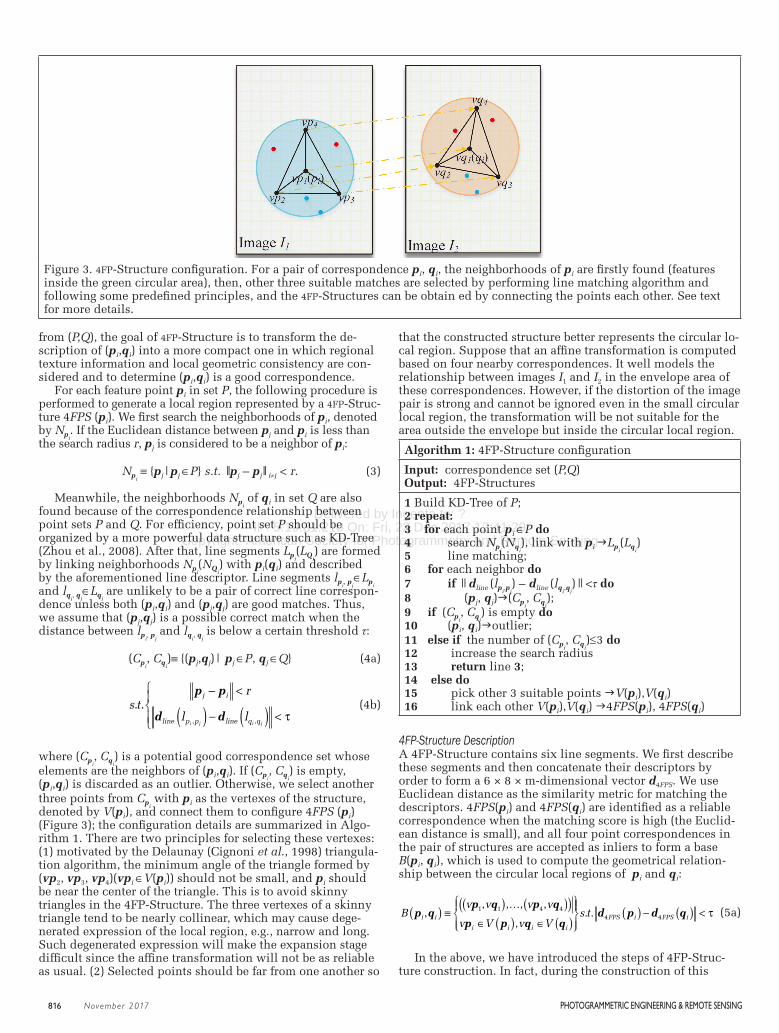
4FP-Structure ConfigurationSuppose correspondences (P,Q) with both inliers and outliers are provided by SIFT, where P represents a set of feature points in image I1 and Q represents the corresponding matched points of P in image I2 (Figure 3). For any matched pair (pi,qi)
Figure 2. Illustration of the line descriptor construction.
PHOTOGRAMMETRIC ENGINEERING & REMOTE SENSING November 2017 815
Delivered by Ingenta to: ?IP: 5.10.31.210 On: Fri, 22 Dec 2017 12:41:29
Copyright: American Society for Photogrammetry and Remote Sensing
from (P,Q), the goal of 4FP-Structure is to transform the de-scription of (pi,qi) into a more compact one in which regional texture information and local geometric consistency are con-sidered and to determine (pi,qi) is a good correspondence.
For each feature point pi in set P, the following procedure is performed to generate a local region represented by a 4FP-Struc-ture 4FPS (pi). We first search the neighborhoods of pi, denoted by Npi
. If the Euclidean distance between pj and pi is less than the search radius r, pj is considered to be a neighbor of pi:
Npi ≡ {pj|pj ∈P} s.t. || pj – pj| | i≠j < r. (3)
Meanwhile, the neighborhoods Npi of qi in set Q are also
found because of the correspondence relationship between point sets P and Q. For efficiency, point set P should be organized by a more powerful data structure such as KD-Tree (Zhou et al., 2008). After that, line segments Lpi
(LQi) are formed
by linking neighborhoods Npi(NQi
) with pi(qi) and descri bed by the aforementioned line descriptor. Line segments lpi, pj
∈Lpi
and lqi, qj∈Lqi
are unlikely to be a pair of correct line correspon-dence unless both (pi,qi) and (pj,qj) are good matches. Thus, we assume that (pj,qj) is a possible correct match when the distance between lpi, pj
and lqi, qj is below a certain thre shold τ:
(Cpi, Cqi
)≡ {(pj,qj)| pj ∈P, qj ∈Q} (4a)
s tr
l l
j i
line p p line q qi j i j
. ., ,
p p
d d
− <
( ) − ( ) <
τ
(4b)
where (Cpi, Cqi
) is a potential good correspondence set whose elements are the neighbors of (pi,qi). If (Cpi
, Cqi) is empty,
(pi,qi) is discarded as an outlier. Otherwise, we select another three points from Cpi
with pi as the vertexes of the structure, denoted by V(pi), and connect them to configure 4FPS (pi) (Figure 3); the configuration details are summarized in Algo-rithm 1. There are two principles for selecting these vertexes: (1) motivated by the Delaunay (Cignoni et al., 1998) triangula-tion algorithm, the minimum angle of the triangle formed by (vp2, vp3, vp4)(vpi ∈V(pi)) should not be small, and pi should be near the center of the triangle. This is to avoid skinny triangles in the 4FP-Structure. The three vertexes of a skin ny triangle tend to be nearly collinear, which may cause dege-nerated expression of the local region, e.g., narrow and long. Such degenerated expression will make the ex pansion stage difficult since the affine transfor mation will not be as reliable as usual. (2) Selected points should be far from one another so
that the constructed structure better represents the circular lo-cal region. Suppose that an affine transfor mation is computed based on four nearby correspondences. It well models the relationship between images I1 and I2 in the envelope area of these correspondences. However, if the distortion of the image pair is strong and cannot be ignored even in the small circular local region, the trans formation will be not suitable for the area outside the envelope but inside the circular local region.
Algorithm 1: 4FP-Structure configuration
Input: correspondence set (P,Q)Output: 4FP-Structures
1 Build KD-Tree of P;2 repeat:3 for each point pi ∈P do4 search Npi
(Nqi), link with pi Lpi
(Lqi)
5 line matching; 6 for each neighbor do7 if ||dline (lpi,pj
) – dline (lqi,qj)||<τ do
8 (pj, qj)(Cpi, Cqi
);9 if (Cpi
, Cqi) is empty do
10 (pi, qi)outlier;11 else if the number of (Cpi
, Cqi)≤3 do
12 increase the search radius13 return line 3;14 else do15 pick other 3 suitable points V(pi),V(qi) 16 link each other V(pi),V(qi) 4FPS(pi), 4FPS(qi)
4FP-Structure DescriptionA 4FP-Structure contains six line segments. We first describe these segments and then concatenate their descriptors by order to form a 6 × 8 × m-dimensional vector d4FPS. We use Euclidean distance as the similarity metric for matching the descriptors. 4FPS(pi) and 4FPS(qi) are identified as a reli able correspondence when the matching score is high (the Euclid-ean distance is small), and all four point corres pondences in the pair of structures are accepted as inliers to form a base B(pi, qi), which is used to compute the geometrical re lation-ship between the circular local regions of pi and qi:
Bv v v v
v V v Vi i
i i i i
p qp q p q
p p q q,
, , , ,
,( ) ≡
( ) ( )( )∈ ( ) ∈ ( )
1 1 4 4
( ) − ( ) <s t FPS i FPS i. . d p d q4 4 τ
(5a)
In the above, we have introduced the steps of 4FP-Struc-ture construction. In fact, during the construction of this
Figure 3. 4FP-Structure configuration. For a pair of correspondence pi, qi, the neighborhoods of pi are firstly found (features inside the green circular area), then, other three suitable matches are selected by performing line matching algorithm and following some predefined principles, and the 4FP-Structures can be obtain ed by connecting the points each other. See text for more details.
816 November 2017 PHOTOGRAMMETRIC ENGINEERING & REMOTE SENSING

Delivered by Ingenta to: ?IP: 5.10.31.210 On: Fri, 22 Dec 2017 12:41:29
Copyright: American Society for Photogrammetry and Remote Sensingstructure, most outliers can be filtered by matching the line segments because the matching score is high only if both vertexes of the line segment are good correspondences. That is, if the vertexes pi of Lpi
and qi of Lqi are mis matched, it is
hard to find even one reliable line match for configuring the structure. However, repetitive texture may reduce the power of the line matching method. Consider the following special case: points (q′i, vq′2, vq′3, vq′4) are the true matches of (pi, vp2, vp3, vp4); area A (rendered in cyan) and area B (rendered in orange) have the same texture (Figure 4). Because of the repetitive texture, (pi, vp2, vp3, vp4) are matched with (qi, vq2, vq3, vq4) by SIFT. Moreover, if the pixel information around lines Lqi ,vq4
and Lq′i ,vq4 is similar, the line matching algorithm
will construct a false corresponding structure 4FPS(qi) of 4FPS(pi). In this case, especially for deformable images, the proposed approach is much more powerful than most current algo rithms (including line- and point-matching methods and RANSAC-like post-processing algorithms) since addi tion al information (Lvq2,vq4
, Lvq3,vq4) is considered in our novel descrip-
tor for distinguishing 4FPS(qi) from 4FPS(q′i). In addition, our region matching algorithm can handle the extreme case that all four matches of the constructed structures are false cor-respondences with similar infor mation. In other words, the four corresponden ces are all in the repetitive texture region B and all are false matched. We will illustrate how our method works in the following section.
Correspondence ExpansionSo far, we have obtained a set of local region correspondences that each contains a four-match base. To model the relation-ship of each correspondence, affine transfor mation is chosen. The reason why we prefer affine over other rigid transforma-tions (such as similarity) is that it has the ability to resist
distortion in a small local region (Guo and Cao, 2012). Three non-collinear matches are sufficient for computing the affine matrix since it only has six degrees of freedom. However, for estimation accuracy, redundant observations are con sidered. Moreover, using four matches to compute the affine matrix also allows the correctness of the constructed 4FP-Structure to be verified: if the 4FP-Structure is constructed incorrectly, the residuals of some vertexes will be very large.
Figure 5 gives an example to explain the procedure of expansion under the affine constraint. Areas A and B are a pair of local region correspondence, which is represented by the 4FP-Structure whose vertexes V(•) are denoted by gray squares in the figure. The relationship of the base B(pi, qi) is modeled as follows:
XB = Haffine XA (6)
where XA and XB are matrixes whose columns are the homoge-neous coordinate vectors of V(pi) and V(qi), res pectively. Haffine is an affine transformation matrix. Ideally, vpj ∈V(pi)(j = 1,2,3,4) from region A is pro jected into vqj ∈V(qi)(j = 1,2,3,4) in region B when the affine trans formation Haffine is performed. Once we obtain the affi ne matrix of a local region correspondence, the point matches inside the region can be classified into inliers and outliers by checking if they support the transformation model. In fact, each match (pi, qi)∈(P,Q) can only be assigned one property, inlier or outlier. If some matches are classified as inliers in one region and outliers in another region, these matches will be treated as unreliable. We will increase the area of their local regions and recons truct the 4FP-Structure to identify these unreliable matches. Because of this strategy, our method has the ability to address some difficult extreme cases, such as the case shown in Figure 6. In this case, the vertexes of structure 4FPS(pi) are all in the repetitive texture region (orange circular area in Figure 6a) and are all falsely matched, i.e., (piqi, vp2vq2,vp3vq3,vp4vq4); furthermore, these matches have almost the same information as the true match-es, so the match (pi, qi) is classified as an inlier. Suppose that there is another region (cyan circular area in Figure 6b) that also contains match (pi, qi). The match will be classified as an outlier if the affine matrix of this region is computed co rrectly. As a result, match (pi, qi) has two properties, both inlier and outlier, so match (pi, qi) will be treated as an unreliable cor-respondence that needs to be identified further.
In addition, we implement a match-exploration stage for the remaining SIFT keypoints (feature points unmatched by SIFT) to extract as many good matches as possible. In Figure 5, we use FP and FQ to denote the feature points of region A and
Figure 4. An example to explain the robustness of our local region descriptor. The proposed method can easily filter the outliers, even if some matches have similar textures (three false matches have similar textures to the correct matches in this case). See text for more details.
Figure 5. Match exploration.
PHOTOGRAMMETRIC ENGINEERING & REMOTE SENSING November 2017 817

Delivered by Ingenta to: ?IP: 5.10.31.210 On: Fri, 22 Dec 2017 12:41:29
Copyright: American Society for Photogrammetry and Remote Sensing
B, res pectively. For each feature point fpi∈FP inside region A, the ideal location of its mat ching point fq′i in region B can be predicted through Haffine (Figure 5). In practice, the model noise cannot be ignored, and projection residuals exist. A candidate circular area with radius R around fq′ (small orange area in Figure 5) is introduced. The features fqj∈FQ inside the circle (black dots) are defined as candidate matches of fpi. We use the formulation in Equation 7) to measure the similarity between fpi and its candidate match fqj:
distij = e–R/dij·||dSIFT ( fpi)– dSIFT( fqj)|| (7)
where dij is the Euclidean distance between fqj and the ideal match fq′i, dSIFT (x) stands for the SIFT descriptor of feature x, and||·|| is the two-dimensional norm operator. The first term e–R/dij∈(0,1) is a weight function whose role is to give more emphasis to the candidate matches that are close to the ideal match fq′i. If the minimum distance distmin is below τ, the cor-responding candidate feature is accepted as the true match of feature fpi.
Experimental EvaluationWe evaluate the proposed algorithm on both rigid and non-rigid image datasets. All the experiments are performed on a laptop PC with an Intel Core i5-3210M 2.5 GHz CPU and 8 GB of RAM. In the Experimental Settings Section, we first describe the dataset information and experimental settings; in
Parameter Settings Section and Robustness to Feature Extrac-tor Section, we study the parameters and validate the robust-ness of the proposed method to different feature extractors, respectively; we then compare our method with six state-of-the-art algorithms in the next Section.. The robustness to noise and running time are reported in following Sections.
Experimental SettingsTable 1 gives the details of the experimental settings, in-cluding parameters, dataset infor mation, algorithms for comparison and evaluation metrics. We use both rigid and non-rigid datasets for evaluation. The rigid Oxford dataset (Mikolajczyk and Schmid, 2005) contains eight categories that have diff erent geometric and photometric transformations, such as blur, viewpoint change, zoom, rotation, illumination change,and JPEG compression (Figure 7). Each sequence of the Oxford dataset contains six images with increasing varia-tion, and the first image is matched with the others. As sug-gesting by Liu et al. (Liu and Marlet, 2012), matches whose projection error is less than five pixels under the ground-truth transformation are considered inliers. For the non-rigid experiment, 24 challenging image pairs without ground truth are coll ected, as shown in Figure 8.
To establish the ground truth, i.e., determine the cor-rectness of each correspondence, we confirm the results artificially. The putative correspondences are determined by SIFT, ORB, or SURF. The ratio of the Euclidean distances of the
(a)
(b)
Figure 6. An extreme case involving repetitive texture. See text for more details.
818 November 2017 PHOTOGRAMMETRIC ENGINEERING & REMOTE SENSING

Delivered by Ingenta to: ?IP: 5.10.31.210 On: Fri, 22 Dec 2017 12:41:29
Copyright: American Society for Photogrammetry and Remote Sensing
closest neighbor and the second-closest neighbor is set to 0.8. We compare the proposed method with six state-of-the-art algorithms whose source codes are publicly available. Similar to TCM (Guo and Cao, 2012), we use two evaluation metrics, i.e., the number of correct matches Ncorrect and the matching correctness Precision. These two aspects are sufficient to evaluate the performances of the abovementioned algorithms because the feature detection scheme, initial matches and ground-truth rule are the same.
Parameter StudyWe study the parameters τ, m, and r on the Oxford dataset. We use SIFT to generate the initial matches and refine these matches using the proposed method with different param-eters. We perform three independent experiments in this sec-tion, in which each experiment has only one parameter as the variable and the others are constant. The details can be found in Table 2. We report the average Ncorrect and Precision of all 40 image pairs in Figure 9.
From the plots, we can make the following observations: first, the highest Ncorrect and the highest Precision cannot be achieved simultaneously. Higher Ncorrect means lower Precision and vice versa. Second, Ncorrect is proportional to τ and r and is inversely proportional to m. In contrast, Precision is propor-tional to m and is inversely proportional to τ and r. Third, the proposed method is robust to different parameter settings. The ranges of Ncorrect and Precision are small. The lowest Preci-sion and Ncorrect values are 92.38 percent and 1698.35, respec-tively, while the initial Precision and Ncorrect values are 74.15 percent and 1167.73 (Figure 9). With the analysis described above, we make a tradeoff between Ncorrect and Precision. We fix τ = 0.3, m = 5 and r = max(w,h)/20 in the following experi-ments. For m and r, we do not use large values because large m and r will increase the computational complexity of the proposed method.
Robustness to Feature ExtractorIn this section, we validate the robustness of the proposed method to different feature extractors on the Oxford dataset.
(a)
(b)
(c)
(d)
(e)
(f)
(g)
(h)
Figure 7. Example images of Oxford dataset. Each image dataset has different geometric and photometric transformation. For example, Bikes and Trees, blur; Graf and Wall, viewpoint change; Bark and Boat; zoom and rotation; Leuven, illumination change; UBC, JPEG compression.
Table 1. The details of experimental settings.
Settings Information
Parameters segments number: m = 5;neighborhood search radius: r = max(w,h)/20, w and h stand for the image width and height, respectively;match score threshold: τ = 0.3;expansion radius: R = 3.
Datasets Rigid: the Oxford dataset (Mikolajczyk and Schmid, 2005), total 40 image pairs with ground truth (Figure 7);
Non-rigid: 24 challenging image pairs, ground truth is established artificially (Figure 8).
Putative correspondenceproducer
ORB, opencv; SURF, opencv;SIFT, implemented by Lowe.
Methods for comparison Section ExperimentalEvaluation Section
ACC, Matlab & C++, open source;PGM+MPM, Matlab & C++, open source;FastVFC, Matlab, open source;LLT, Matlab, open source;KVLD, C++, open source;RANSAC, Matlab, open source;
Evaluation metrics Number of correct matches: Ntotal;
Matching correctness: Precision = NN
correct
total
where Ntotal is the number of matches.
PHOTOGRAMMETRIC ENGINEERING & REMOTE SENSING November 2017 819

Delivered by Ingenta to: ?IP: 5.10.31.210 On: Fri, 22 Dec 2017 12:41:29
Copyright: American Society for Photogrammetry and Remote SensingFigure 8. Non-rigid image pair dataset. This dataset contains 24 image pairs with different transformations.
Figure 9. The results of parameters τ, m, and r. We perform three independent experiments, in which each experiment has only one parameter as the variable and the others are constant. The experiment setting details can be found in Table 2.
Figure 10. The results of different feature extractors. ORB, SURF, and SIFT are applied for initial feature matching on the Oxford dataset.
820 November 2017 PHOTOGRAMMETRIC ENGINEERING & REMOTE SENSING

Delivered by Ingenta to: ?IP: 5.10.31.210 On: Fri, 22 Dec 2017 12:41:29
Copyright: American Society for Photogrammetry and Remote Sensing
We use ORB, SURF, and SIFT to determine putative correspon-dences. The average values of Ncorrect and Precision of all 40 image pairs (excluding failure cases) are shown in Figure 10.
As can be seen, the proposed method achieved 29.6 per-cent, 19.79 percent, and 19.68 percent growth rates of Preci-sion compared with the initial matches of ORB, SURF and SIFT, respectively. It also achieved 103.18 percent, 63.49 percent and 71.74 percent growth rates of Ncorrect compared with the initial matches of ORB, SURF and SIFT, respectively. According to this figure, the proposed method can achieve very impres-sive performance (Precision is higher than 93 percent) for all the three feature extractors. It seems that ORB is the best. However, the failure cases, i.e., the cases in which there are no correct matches in the putative correspondence set, are not included in the reported performance. The ORB feature extrac-tor is sensitive to scale and viewpoint changes and has 11 failure cases among 40 image pairs, while SURF and SIFT only have 2 and 0 failure cases, respectively. We choose SIFT as the putative correspondence provider in the following sections because of its robustness and stability.
Individual Contribution of Single StepOur matching method consists of three steps, i.e., 4FP-Struc-ture matching, local affine verification, and local expan-sion. The first two steps improve the matching correctness
Precision and the last one improves the number of correct matches Ncorrect. We perform an experiment to study the indi-vidual contribution of each single step on the non-rigid da-taset. We first perform 4FP-Structure matching on initial SIFT matches (4FP-Structure); then, we add local affine verification step to clean the 4FP-Structure matching result (4FP-Struc-ture & verification); finally, we adapt local expansion to find as many high location accuracy correspondences as possible (4FP-Structure & verification & expansion). The result of each image pair is shown in Figure 11 and Figure 12.
Compared to UNN (original SIFT matching), 4FP-Structure can largely improve the matching correctness Precision. How-ever, it is not very robust to repetitive texture. For example, 4FP-Structure only gets 79.34 percent average Precision on image pair 18~22. A Verification step can effectively draw this issue. The average Precision on image pair 18 through 22 is increased to 94.02 percent. The Expansion step can help us to find as many high location accuracy correspondences as possible, which is important to sparse 3D reconstruction and TIN surface model. It extracts 407.33 more correct correspon-dences compared with UNN.
Comparison with State-of-the-Art MethodsWe compare the proposed approach with six state-of-the-art methods, i.e., PGM+MPM, ACC, FastVFC, LLT, KVLD, and RANSAC (for the rigid Oxford dataset only). We obtain the implemen-tations of these methods from the authors’ websites and use the same SIFT implementation to provide the putative cor-respondences. For PGM, we use MPM as the graph-matching module. For RANSAC, we use the homography model. The pa-rameters are set according to the authors’ recommendations. We also report the performance of the distance ratio method (UNN) (as a baseline) which provides the initial correspon-dences. Throughout all the experiments, the seven algorithms’ parameters are all fixed. Note that we regard Ncorrect and Preci-sion as zero if the algorithm fails to match an image pair.
Rigid image matching: The results on the rigid Oxford dataset are summarized in Figure 13 and Figure 14. The average (Ncorrect, Precision) pair of each method is reported in Table 3. Our method significantly increases the number of correct matches, benefitting from the match expansion stage. It extracts 836 more correct correspondences than UNN, which ranks second in terms of Ncorrect. For matching correctness Precision, RANSAC achieves the best performance. This may be expected because the image pairs of the Oxford dataset are either of planar scenes or taken by pure rotation. The images, therefore, always obey the homography constraint. In addi-tion, the inlier rates are high in most situations. PGM+MPM does not perform well on this dataset, which is just slightly better than the initial matches (UNN). It is sensitive to zoom and rota tion changes. For some cases of the Bark and Boat sequences, PGM+MPM fails to extract even one good match. LLT and ACC have similar performance; KVLD performs well on this dataset. However, their accuracies are not as high as those of VFC, Our method and RANSAC. They are not very stable when the geometric or photometric transformation is severe. For example, the values of Precision of LLT, ACC, and KVLD on the fourth image pair of Graf are 30 percent, 0 percent, and 0 per-cent, respectively. FastVFC achieves very good performance. It performs as well as our method and RANSAC in most image
Table 2. The details of parameter settings.
Experiments Variable Fixed parameters
Parameter τ study τ = [0.2, 0.25, 0.3, 0.35, 0.4, 0.45] m = 5, r = max(w,h)/20, R = 3
Parameter m study m = = [3, 5, 7, 9, 11, 13] τ = 0.3, r = max(w,h)/20, R = 3
Parameter r study r = a*max(w,h)/20,a = [0.5, 0.6, 0.7, 0.8, 0.9, 1.0, 1.1, 1.2, 1.3, 1.4, 1.5]
m = 5, τ = 0.3, R = 3
Figure 11. Number of correct matches measured on the non-rigid dataset for single step contribution study.
Figure 12. The matching correctness measured on the non-rigid dataset for single step contribution study.
PHOTOGRAMMETRIC ENGINEERING & REMOTE SENSING November 2017 821

Delivered by Ingenta to: ?IP: 5.10.31.210 On: Fri, 22 Dec 2017 12:41:29
Copyright: American Society for Photogrammetry and Remote Sensing
pairs. However, it is worse than our method for extremely dif-ficult cases. The Precision of our method ranks second and is only 0.08 percent lower than that of RANSAC. It achieves 8.12 percent, 1.33 percent, 6.19 percent, and 3.64 percent growth rates compared with ACC, FastVFC, KVLD, and LLT, respec-tively. Considering both Ncorrect and Precision, the proposed method performs the best among these eight methods.
Non-rigid image matching: Figure 15 shows the results on five selected non-rigid image pairs in Figure 8. These five image pairs have different transformations, i.e., image pair 1 (multiple geometric models), image pair 9 (strong defor-mation + 180° rotation), image pair 11 (small deformation), image pair 12 (strong deformation + viewpoint change) and image pair 19 (deformation + repetitive texture). As shown, PGM+MPM performs well only if the transformation is simple. It is sensitive to multiple geometric models, strong deforma-tions, large viewpoint changes, large rotations and repetitive
texture. ACC achieves good precision on image pairs 1, 11, 12 and 19. However, it may fail when the rotation change is suf-ficiently large, such as in image pair 9. LLT is also very sensi-tive to large rotations. In addition, LLT becomes unreliable in cases with strong deformation and repetitive texture regions, such as image pair 12 and the white building of image pair 19. KVLD is sensitive to repetitive texture, for example, the Precision of KVLD on image pair 19 is only 69.6 percent. Both FastVFC and our method can achieve very impressive per-formance on all five image pairs. Our method is more robust than FastVFC for multiple geometric model transformations. For example, FastVFC and LLT extract two of the three cluster matches in image pair 1, while the proposed method extracts all three cluster matches.
Figure 16 and Figure 17 plot the results of Ncorrect and Precision for each image pair in the non-rigid dataset, re-spectively. As can be seen, the proposed method achieves
(a) (b) (c) (d)
(e) (f) (g) (h)
Figure 13. Number of correct matches measured on the Oxford dataset.
(a) (b) (c) (d)
(e) (f) (g) (h)
Figure 14. The matching correctness measured on Oxford dataset.
Table 3. Performance comparison on the Oxford dataset.
Metric UNN PGM+MPM ACC FastVFC LLT RANSAC KVLD Ours
Ncorrect 1167.73 367.03 1083.7 1154.9 1155.8 1162.18 1143.1 2003.7
Precision/% 74.15 75.04 85.3 92.09 87.23 93.5 89.78 93.42
822 November 2017 PHOTOGRAMMETRIC ENGINEERING & REMOTE SENSING

Delivered by Ingenta to: ?IP: 5.10.31.210 On: Fri, 22 Dec 2017 12:41:29
Copyright: American Society for Photogrammetry and Remote Sensing
Figure 16. Number of correct matches measured on the non-rigid dataset.
Figure 17. The matching correctness measured on the non-rigid dataset.
Figure 15. The results of five selected non-rigid image pairs in Figure 8. From left to right, columns are the results of image pair 1 (multiple geometric models), image pair 9 (strong deformation + 180° rotation), image pair 11 (small deformation), image pair 12 (strong deformation + viewpoint change) and image pair 19 (deformation + repetitive texture). For better visualization, no more than 100 randomly selected matches are plotted.
PHOTOGRAMMETRIC ENGINEERING & REMOTE SENSING November 2017 823

Delivered by Ingenta to: ?IP: 5.10.31.210 On: Fri, 22 Dec 2017 12:41:29
Copyright: American Society for Photogrammetry and Remote Sensing
the best performance on both Ncorrect and Precision, i.e., the red curves of our method are the highest for most image pairs. Our method has the ability to detect a larger number of correct matches than other state-of-the-art methods, while preserving extremely high detection correctness. The average (Ncorrect, Precision) pair of each method is reported in Table 4. Our method identifies 407.33 more correct correspondences compared with UNN. For matching correctness Precision, the matches obtained by PGM+MPM are even worse than the initial matches (UNN). This method is sensitive to all kinds of trans-formations. ACC performs well in most cases, except for large rotations. LLT becomes unreliable for image pairs with strong deformation, repetitive texture, and large rotation. FastVFC achieves very good results. It performs even better than our method in several cases. KVLD is sensitive to repetitive texture. Its performance largely decreases on image pair 18,
19, 20, 21, and 22 which contains many repetitive texture re-gions. Our method ranks first in terms of Precision. It achieves 13.56 percent, 2.01 percent, 19.97 percent, and 8.97 percent Precision growth rates compared with ACC, FastVFC, LLT, and KVLD, respectively.
Robustness to NoiseA good correspondence detection algorithm should be robust to noisy images, which is very important for some applica-tions, such as image searching and scene recognition. There-fore, an additional experiment is performed to investigate the validity of the proposed method. We use 30 images, including the first image of each category in the Oxford dataset and the first image of 22 non-rigid image pairs in Figure 8 (non-rigid image pairs 4 and 13 are not used), to form C 2
30 = 435 image pairs for evaluation. There is no doubt that the ground-truth number of correct matches of each image pair is zero. The cumulative distribution curve of each method is reported in Figure 18, and the average (number of matches, standard deviation) pairs are displayed in Table 5. As shown, KVLD and the proposed method are the most robust among all the compared methods. ACC and RANSAC are better than FastVFC and LLT. PGM+MPM is much worse than even UNN. There is only one image pair that has a non-zero number of matches among the 435 image pairs for our method. This image pair is shown in Figure 19. As can be seen, the matched areas almost have the same information, including texture and geometric structure.
Computational Complexity and Running TimeWhen searching neighbors for each matching point in P us-ing the K-D Tree, the time complexity is close to O((K
– + N)
logN), where K–
is the average number of neighbors and N is the number of initial matches. The time complexity of the line descriptor for each line is O(N). Hence, the time complexity of 4FP-Structure construction is O((K
–N + N logN). The time com-
plexity of 4FP Structure description is O(N). The time com-plexity of expansion is O(M
–N), where M
– is the average number
of keypoints inside the local circular region. The total time complexity of the proposed method is O((K
–+M–
)N + N logN).
Table 4. Performance comparison on the non-rigid dataset.
Metric UNN PGM+MPM ACC FastVFC LLT KVLD Ours
Ncorrect 690.5 452.33 460.5 644.71 569.75 628.68 1097.83
Precision/% 75.94 61 84.14 95.69 77.73 88.73 97.7
Table 5. Robustness to noise.
Metric UNN PGM+MPM ACC FastVFC LLT RANSAC KVLD Ours
number of matches 97.58 506.77 7.17 17.63 27.18 8.22 0.36 0.05
standard deviation 72.5 168.93 18.73 27.13 37.11 3.07 3.7 1.05
Figure 19. The only one image pair that our method has non-zero number of matches. Left is our matching result. Middle and right are the enlarged areas of the blue box in the left figure.
Figure 18. The cumulative distribution curves of noise image test.
824 November 2017 PHOTOGRAMMETRIC ENGINEERING & REMOTE SENSING

Delivered by Ingenta to: ?IP: 5.10.31.210 On: Fri, 22 Dec 2017 12:41:29
Copyright: American Society for Photogrammetry and Remote Sensing
We measure the running times of each method on 40 im-age pairs of the Oxford dataset. FastVFC, LLT, and RANSAC are implemented in MATLAB, PGM+MPM, ACC, and Ours are implemented based on MATLAB&C++; KVLD is implemented in C++. There are many matrix operations in FastVFC and LLT; thus, rewriting them in MATLAB&C++ would likely not result in significant improvements in their running times. The average, maximum and standard deviation of the run-ning time are summarized in Table 6. Although this is only a rough comparison because the codes are not implemented on a uniform platform, it can reflect many problems. As shown, our method is much more efficient than graph-based meth-ods, i.e., PGM+MPM and ACC. The time complexity of FastVFC is O(D3 N3), which means that the running time of FastVFC increases quickly with the number of initial matches. For example, the running time of FastVFC on the first image pair of the Wall category (6268 initial matches) is 25.6 seconds. RANSAC becomes very slow on low inlier rate image pairs. For instance, the running time is up to 171 seconds for the second last image pair of the Graf category (3.95 percent inlier rate). KVLD contains scale space construction stage, thus, it is slightly slower than the proposed method. The standard deviation of the proposed method is only larger than that of LLT, whose time complexity is O(K3N + NlogN), where K is the parameter for the number of nearest neighbors. In addition, the implementation of the proposed method is very rough and could be greatly optimized.
Table 7 summarizes the comprehensive performances of these seven methods in several aspects, including suitability for rigid and non-rigid image pairs, Precision, Ncorrect, robust-ness to transformations, robustness to noise and efficiency.
ConclusionsIn this paper, we proposed a region matching method for simultaneous outlier removal and good match maximization. We introduced a special and novel 4FP-Structure to describe this local region. In addition, an expansion stage to detect and select high location accuracy correspondences under a local affine transformation constraint was presented. The method is general and robust, able to handle both rigid and non-rigid image pairs in cases of severe outliers, and hence applicable to various vision tasks. We tested our method in various situ-ations, including rigid scenes, non-rigid scenes and irrela-tive scenes. As shown in the results, the proposed method achieved impressive performance in terms of correct matches and correctness compared with other state-of-the-art methods.
We believe the local region matching method introduced here is worth further research for applications such as structure from motion and 3D reconstruction from non-rigid images.
AcknowledgmentsThe authors would like to express their gratitude to the editors and the reviewers for their constructive and helpful comments for substantial improvement of this paper. This work was supported by National Natural Science Founda-tion of China (No. 41271452 and No. 41701528), the Fun-damental Research Funds for the Central Universities (No. 2042017KF0235), the Key Technologies R&D Program of China (No. 2015BAK03B04), and the National High-tech R&D Program of China (863 Program) Grant No.2013AA102401.
ReferencesBay, H., A. Ess, T. Tuytelaars, and L. Van Gool, 2008. Speeded-
up robust features (SURF), Computer Vision and Image Understanding, 110:346–359.
Best, P.J., and N.D. McKay, 1992. A method for registration of 3-D shapes, IEEE Transactions on Pattern Analysis and Machine Intelligence, 14:239-256.
Brown, M., and D.G. Lowe, 2003. Recognising panoramas, Proceedings of the International Conference on Computer Vision 2003, pp. 1218.
Cho, M., and J. Lee., 2009. Feature correspondence and deformable object matching via agglomerative correspondence clustering, Proceedings of the 2009 IEEE 12th International Conference on Computer Vision,. IEEE, pp. 1280–1287.
Cho, M., and K.M. Lee, 2012. Progressive graph matching: Making a move of graphs via probabilistic voting, Proceedings of the 2012 IEEE Conference on Computer Vision and Pattern Recognition (CVPR), IEEE, pp. 398–405.
Cho, M., J. Sun, O. Duchenne, and J. Ponce, 2014. Finding matches in a haystack: A max-pooling strategy for graph matching in the presence of outliers, 2014. Proceedings of the IEEE Conference on Computer Vision and Pattern Recognition (CVPR), IEEE, pp. 2091–2098.
Chum, O., and J. Matas, 2005a. Matching with PROSAC-progressive sample consensus, IEEE Computer Society Conference on Computer Vision and Pattern Recognition, 2005, CVPR, IEEE, pp. 220–226.
Chum, O., and J. Matas, 2005b. Matching with PROSAC-progressive sample consensus, 2005 Proceedings of the IEEE Computer Society Conference on Computer Vision and Pattern Recognition (CVPR’05), IEEE, pp. 220–226.
Table 6. Running time comparison on the Oxford dataset.
Metric PGM+MPM ACC FastVFC LLT RANSAC KVLD Ours
mean 73.13 106.71 1.67 0.86 8.92 4.78 3.62
std 41.41 331.74 3.99 1.24 37.34 2.91 2.78
max 204.27 1942.8 25.6 7.02 171.69 15.48 11.36
Table 7. The comprehensive comparison of different methods.
metric PGM+MPM ACC FastVFC LLT RANSAC KVLD Ours
rigid (Y/N) Y Y Y Y Y Y Y
non-rigid (Y/N) Y Y Y Y N Y Y
Precision (√) √ √√ √√√ √√ √√√ √√ √√√
Ncorrect(√) √ √√ √√ √√ √√ √√ √√√
robustness to transformations (√) √ √√ √√√ √√ √√√ √√ √√√
robustness to noise (√) × √√ √ √ √√ √√√ √√√
efficiency (√) √ √ √√√ √√√ √√ √√ √√
PHOTOGRAMMETRIC ENGINEERING & REMOTE SENSING November 2017 825

Delivered by Ingenta to: ?IP: 5.10.31.210 On: Fri, 22 Dec 2017 12:41:29
Copyright: American Society for Photogrammetry and Remote Sensing
Chum, O.,J. Matas, and J. Kittler, 2003. Locally optimized RANSAC, Proceedings of the Joint Pattern Recognition Symposium, Springer, pp. 236–243.
Cignoni, P., C. Montani, and R. Scopigno, 1998. DeWall: A fast divide and conquer Delaunay triangulation algorithm in Ed, Computer-Aided Design, 30:333–341.
Conte, D., P. Foggia, C. Sansone, and M. Vento, M., 2004. Thirty years of graph matching in pattern recognition, International Journal of Pattern Recognition and Artificial Intelligence, 18:265–298.
Duchenne, O., F. Bach, I.-S. Kweon, and J. Ponce, 2011. A tensor-based algorithm for high-order graph matching, IEEE Transactions on Pattern Analysis and Machine Intelligence,33: 2383–2395.
Fischler, M.A., and R.C. Bolles, 1981. Random sample consensus: A paradigm for model fitting with applications to image analysis and automated cartography, Communications of the ACM, 24:381–395.
Geiger, A., M. Lauer, F. Moosmann, B. Ranft, H. Rapp, C. Stiller, and J. Ziegler, 2012. Team AnnieWAY’s entry to the 2011 Grand Cooperative Driving challenge, IEEE Transactions on Intelligent Transportation Systems, 13:1008–1017.
Guo, X., and X. Cao, 2012. Good match exploration using triangle constraint, Pattern Recognition Letters, 33:872–881.
Kato, T., S. Omachi, and H. Aso, 2002. Asymmetric gaussian and its application to pattern recognition, Proceedings of the Joint IAPR International Workshops on Statistical Techniques in Pattern Recognition (SPR) and Structural and Syntactic Pattern Recognition (SSPR), Springer, pp. 405–413.
Ke, Y., and R. Sukthankar, 2004. PCA-SIFT: A more distinctive representation for local image descriptors, , 2004. CVPR 2004. Proceedings of the 2004 IEEE Computer Society Conference on Computer Vision and Pattern Recognition, IEEE, pp. II-506–II-513.
Li, J., Q. Hu, and M. Ai, 2016. Robust Feature Matching for Remote Sensing Image Registration Based on $ L_ {q} $-Estimator, IEEE Geoscience and Remote Sensing Letters, 13:1989–1993.
Li, J., Q. Hu, and M. Ai, 2017a. Robust feature matching for geospatial images via an affine-invariant coordinate system, The Photogrammetric Record, September 2017, pp. 317–331.
Li, J., Q. Hu, M. Ai, and R. Zhong, 2017b. Robust feature matching via support-line voting and affine-invariant ratios, ISPRS Journal of Photogrammetry and Remote Sensing, 132:61–76.
Li, J., Q. Hu, R. Zhong, and M. Ai, 2017c. Exterior orientation revisited: A robust method based on l q-norm, Photogrammetric Engineering & Remote Sensing, 83:47–56.
Liu, Z., and R. Marlet, 2012. Virtual line descriptor and semi-local matching method for reliable feature correspondence, Proceedings of the British Machine Vision Conference 2012, pp. 16.11–16.11.
Lourenço, M., J.P. Barreto, and F. Vasconcelos, 2012., IEEE Transactions on srd-sift: Keypoint Detection and Matching in Images with Radial Distortion, Robotics, 28:752–760.
Lowe, D.G., 2004. Distinctive image features from scale-invariant keypoints, International Journal of Computer Vision, 60:91–110.
Ma, J., W. Qiu, J. Zhao, Y. Ma, A.L. Yuille, and Z. Tu, 2015a. Robust estimation of transformation for non-rigid registration, IEEE Transactions on Signal Processing, 63:1115–1129.
Ma, J., J. Zhao, J. Tian, A.L. Yuille, and Z. Tu, 2014. Robust point matching via vector field consensus, IEEE Transactions on Image Processing, 23:1706–1721.
Ma, J., H. Zhou, J. Zhao, Y. Gao, J. Jiang, and J. Tian, 2015b. Robust feature matching for remote sensing image registration via locally linear transforming, IEEE Transactions on Geoscience and Remote Sensing, 53:6469–6481.
Mikolajczyk, K.,and C. Schmid, 2005. A performance evaluation of local descriptors, IEEE Transactions on Pattern Analysis and Machine Intelligence, 27:1615–1630.
Montemerlo, M., S. Thrun, D. Koller, B. Wegbreit, 2002. FastSLAM: A factored solution to the simultaneous localization and mapping problem, Proceedings of the Innovative Applications of Artificial Intelligence Conference, AAAI/IAAI, pp. 593–598.
Raguram, R., J.-M. Frahm, and M. Pollefeys, 2008. A comparative analysis of RANSAC techniques leading to adaptive real-time random sample consensus, Proceedings of the European Conference on Computer Vision, Springer, pp. 500–513.
Rublee, E., V. Rabaud, K. Konolige, and G. Bradski, 2011. ORB: An efficient alternative to SIFT or SURF, 2011 Proceedings of the IEEE International Conference on Computer Vision (ICCV), IEEE, pp. 2564–2571.
Snavely, N., S.M. Seitz, and R. Szeliski, 2006. Photo tourism: Exploring photo collections in 3D, ACM Transactions on Graphics (TOG), Association for Computing Machinery, pp. 835–846.
Tola, E., V. Lepetit, and P. Fua, 2010. Daisy: An efficient dense descriptor applied to wide-baseline stereo, IEEE Transactions on Pattern Analysis and Machine Intelligence, 32:815–830.
Torr, P.H., and A. Zisserman, 2000. MLESAC: A new robust estimator with application to estimating image geometry, Computer Vision and Image Understanding, 78:138–156.
Torresani, L., V. Kolmogorov, and C. Rother, 2008. Feature correspondence via graph matching: Models and global optimization, Proceedings of the European Conference on Computer Vision, Springer, pp. 596–609.
Wang, G., Z. Wang, Y. Chen, and W. Zhao, 2015. A robust non-rigid point set registration method based on asymmetric gaussian representation, Computer Vision and Image Understanding, 141:67–80.
Zhang, L., and R. Koch, 2013. An efficient and robust line segment matching approach based on LBD descriptor and pairwise geometric consistency, Journal of Visual Communication and Image Representation, 24:794–805.
Zhou, K., Q. Hou, R. Wang, B. and Guo, B., 2008. Real-time KD-tree construction on graphics hardware, ACM Transactions on Graphics (TOG), 27:126.
826 November 2017 PHOTOGRAMMETRIC ENGINEERING & REMOTE SENSING
View publication statsView publication stats