4.5mb pdf - hydrogen student design contest
TRANSCRIPT
Design Proposal for a
Hydrogen Power Park
Eureka, California
© 2005, Schatz Energy Research Center
David Carter—Team Leader Juliette Bohn Nicole Campbell
Dustin Jolley Stephen Kullmann Steve Lora Matthew Marshall
Avram Pearlman Douglas Saucedo Anand Gopal – Faculty Advisor
Evolution Energy Systems™ i
Executive Summary Fossil fuels have made possible a standard of living unparalleled in history, yet our planet must now face the consequences of their abundant use. Global warming, pollution, and political instability continue to increase as worldwide reserves dwindle. International competition for decreasing resources and supplies is linked to steadily increasing costs. Hydrogen is an energy carrier that can play a significant role in the development of new energy infrastructures addressing these concerns. This report presents the design of a hydrogen power park to be located in the City of Eureka on the Northern Coast of California. The Power Park will be capable of providing about 442 kW of electric power and 132 kW of thermal power as hot water to new businesses along the Eureka waterfront. The primary power consumer will be the Eureka Waterfront Hotel and Spa, a planned 200-bed hotel/spa complete with conference center. Additionally, the power park will be capable of producing 10.5 kg/hr of gaseous hydrogen for use as vehicle fuel. The primary consumer of H2 fuel produced at the power park will be Humboldt County Motor Pool vehicles, which are garaged in a facility next to the proposed power park site. Secondary consumers of H2 vehicle fuel will be one Eureka city transit bus operated by the Humboldt Transit Authority and “early adopters” within the public sector. A Public Awareness/Marketing and Education Plan and a comprehensive Safety Analysis are included in the design. A proprietary software model has been developed by Evolution Energy Systems™ to simulate the stochastic arrival of vehicles to the fueling pumps and the responses of the storage system and production units to those arrivals. The model was used to optimize the system by identifying the minimum cost design that provided 99.999% reliability for vehicle fueling. Design variables include the number of fuel cells, which controls the amount of hydrogen available for the system, and the number of low-, medium-, and high-pressure storage tanks needed per year. Landfill gas from the Cummings Road Landfill will be used as feedstock to produce the energy and hydrogen at the power park. Landfill gas is considered an eligible renewable energy source in the Renewable Portfolio Standard of 12 states, including California. The gas will be scrubbed and then transmitted through the Pacific Gas and Electric natural gas grid to the power park. The feed gas will be internally reformed into hydrogen and carbon dioxide within two 250 kW molten carbonate fuel cells manufactured by FuelCell Energy. The DFC-300 fuel cells act as combined heat and power plants as well as hydrogen production units. Hydrogen production and recovery is accomplished using the DFC-H2 methodology developed by FuelCell Energy (Jahnke et al. 2004). The overall net efficiency of the power park will be an estimated 65.5%. With the price of the electricity produced by the power park at $0.075/kwh and the price of heat produced by the power park at $0.60/Therm, the price of vehicle grade H2 fuel produced by the power park is estimated to be $2.50/kg with a ten-year rate of return on investment. Evolution Energy Systems’ Eureka Power Park will reduce CO2/kWh emissions by an estimated 40%, when compared to California grid electricity generation. This CO2 reduction becomes even greater when considering the emissions avoided through cogenerated heat and H2 fueled vehicles.

Evolution Energy Systems™ ii
Table of contents Executive Summary ..................................................................................................................................... i
List of Tables .............................................................................................................................................. iv
List of Figures............................................................................................................................................. iv
List of Acronyms ......................................................................................................................................... v
1 Data Table ............................................................................................................................................. 1
2 Technical Design ................................................................................................................................... 2 2.1 Introduction ....................................................................................................................................... 2 2.2 Site location and Zoning.................................................................................................................... 3 2.3 Hydrogen Fueling Station Simulation ............................................................................................. 3 2.3.1 Single-Station, Multi-Channel Queuing Theory............................................................................... 3 2.3.2 Cascade Storage Algorithm .............................................................................................................. 4 2.3.3 Results .............................................................................................................................................. 4 2.4 Source of Power Park Feedstock...................................................................................................... 5 2.5 Plot plan view..................................................................................................................................... 6 2.6 Electricity and Cogeneration System............................................................................................... 6 2.6.1 Fuel Cell ........................................................................................................................................... 6 2.6.2 Microturbine ..................................................................................................................................... 8 2.6.3 Cogeneration Heat Recovery Unit.................................................................................................... 8 2.6.4 Cogeneration Loop ........................................................................................................................... 9 2.7 Hydrogen Recovery, Storage, and Dispensing System................................................................... 9 2.7.1 Water Gas Shift Reactor ................................................................................................................... 9 2.7.2 Anode Gas Cooling and Drying Heat Exchanger............................................................................. 9 2.7.3 Cooling Tower................................................................................................................................ 10 2.7.4 Demister ......................................................................................................................................... 10 2.7.5 Low-Pressure Compressor.............................................................................................................. 10 2.7.6 Pressure Swing Adsorption ............................................................................................................ 10 2.7.7 High Pressure Compressor ............................................................................................................. 10 2.7.8 Storage............................................................................................................................................ 11 2.7.9 Hydrogen Dispensers...................................................................................................................... 11 2.7.10 Plumbing....................................................................................................................................... 11
3 Safety Analysis .................................................................................................................................... 12
3.1 Introduction ..................................................................................................................................... 12 3.2 Approval from Fire Department.................................................................................................... 13 3.3 Major Failure Modes....................................................................................................................... 13 3.3.1 Accident Involving Public/Hydrogen Interface.............................................................................. 13 3.3.2 Vehicle Crashing into the H2 Dispensing or Storage ...................................................................... 13 3.3.3 Vehicle drives away with refueling hose attached ......................................................................... 14 3.4 Natural Disasters ............................................................................................................................. 14

Evolution Energy Systems™ iii
4 Economic/Business Plan Analysis ..................................................................................................... 15 4.1 Initial investment ............................................................................................................................. 15 4.2 Revenues and expenses.................................................................................................................... 16 4.3 Energy Balance ................................................................................................................................ 16 4.4 Utility Rate Structure...................................................................................................................... 16 4.5 Cost Relative to Local Utility Costs ............................................................................................... 18 4.6 Selling Price of Hydrogen ............................................................................................................... 18
5 Environmental Analysis ..................................................................................................................... 19 5.1 CO2 Analysis .................................................................................................................................... 19 5.1.1 Energy Generation.......................................................................................................................... 19 5.1.2 Hydrogen Production...................................................................................................................... 20 5.1.3 Vehicle Fleet Conversion ............................................................................................................... 20 5.2 Permitting and Emissions ............................................................................................................... 21 5.3 Landfill Gas Value Proposition ...................................................................................................... 21 5.4 Renewable Energy Generation Availability .................................................................................. 21
6 Public Awareness/Marketing and Education................................................................................... 22 6.1 NEPA/CEQA Compliance .............................................................................................................. 22 6.2 Adaptive Management Plan ........................................................................................................... 22 6.2.1 Administrative Structure................................................................................................................. 23 6.3 Marketing Plan ................................................................................................................................ 23 6.4 One Page Advertisement................................................................................................................. 24
7 References ........................................................................................................................................... 25

Evolution Energy Systems™ iv
List of Tables Table 1: Optimal design from 2010 through 2019 using the D2 model.......................................... 5 Table 2: Pressure Rating, Certification and Price of Hydrogen Storage Tanks............................ 11 Table 3: Overview of Existing and Proposed Codes (NHA 2005, SERC 2002). ......................... 12 Table 4: Variable capital cost summary........................................................................................ 15 Table 5: Summary of revenues and expenses ............................................................................... 16 Table 6: Power park energy balance............................................................................................. 17 Table 7: Comparison of power park rates to PG&E rates ............................................................ 18 Table 8: California Gross System Power (GSP) for the year 2003, including mass of CO2
produced................................................................................................................................ 19 Table 9: Carbon Dioxide emissions for electrical and heat energy production for a modern power
plant....................................................................................................................................... 20 Table 10: Normalized CO2 emissions for analysis. ...................................................................... 20 Table 11: CO2 emissions, both molar and mass ratio, for hydrogen production. ......................... 20
List of Figures Figure 1: Location of Eureka Power Park....................................................................................... 3 Figure 2: Plot plan view.................................................................................................................. 7 Figure 3: Process schematic............................................................................................................ 7 Figure 4: Load profiles for facilities serviced by the Eureka Power Park. ................................... 17 Figure 5: Sensitivity of vehicle fuel selling price to "six nines" market price. ............................ 18

Evolution Energy Systems™ v
List of Acronyms AC Alternating Current HRU Heat Recovery Unit ADG American Distributed Generation HSU Humboldt State University AM Adaptive Management HWMA Humboldt Waste Management Authority ANSI American National Standards Institute IEC International Electric Code ASME American Society of Mechanical Engineers kWh Kilowatt hour BTU British Thermal Unit LFG Landfill Gas CEC California Energy Commission LPT Low Pressure Tank CEQA California Environmental Quality Act MBTU Million BTU CFR Code of Federal Regulations MCFC Molten Carbonate Fuel Cell CGA Compressed Gas Association MPT Medium Pressure Tank CH4 Methane N2 Nitrogen CO Carbon Monoxide NCUAQMD North Coast Unified CO2 Carbon Dioxide Air Quality Management District CPUC California Public Utility Commission NEPA National Environmental Policy Act CSA Canadian Standards Association NFPA National Fire Protection Association DFC Direct Fuel Cell NG Natural Gas DOE Department of Energy NHA National Hydrogen Association DOT Department of Transportation OSHA Occupational Safety & Health Admin. EES Evolution Energy Systems™ PG&E Pacific Gas and Electric FC Fuel Cell PLC Programmable Logic Controller FCE FuelCell Energy PNG Pipeline Natural Gas FMEA Failure Modes and Effects Analysis PSA Pressure Swing Adsorption FTI Fueling Technologies International, Inc. psig Pounds per square inch gage GEG Gas Electricity Generation RFP Request for Proposal gpm Gallons per Minute scf Standard Cubic Foot GSP Gross System Power scfm Standard Cubic Feet per Minute H2 Hydrogen USDOE United States Department of Energy H2O Water UTR U-tube Heat Recovery Series HPT High Pressure Tank WGS Water Gas Shift

Evolution Energy Systems™ Page 1 of 27
1 Data Table
EVOLUTION ENERGY SYSTEMS™ 2005 H2U Design Contest Data Sheet
Section Description Quantity 1.1 General
Requirements
Location of Power Park Eureka, California - Humboldt County
Footprint 20,625 square feet 1.2 Technical
Requirements General H2 Feedstock Landfill gas/natural gas Number of dispensers 4 (2 pumps with 2 dispensers each) Fueling medium H2 gas Fueling pressure 5000 psig Fueling time 7.2 mins Peak fueling capacity 47.3 kg/hr Daily fueling capability in 2010 108 kg/day Daily fueling capability in 2020 292 kg/day Hydrogen Production Production method Steam reformation Rate of H2 generation (2019) 10.5 kg/hr Storage medium Gas
Rated storage pressure
high pressure: 6667 psig medium pressure: 3200 psig low pressure: 2200 psig
Storage capacity (2019) 293 kg + 408 kg tanker Electrical Generation Peak power capacity 442 kW 1.3 Economic Analysis Capital cost $3.43 million Running cost – year 2010 $21428 Running cost – year 2019 $36335
Average price of H2 as sold from Evolution Energy $2.50/kg
Average cost of electricity provided by Evolution Energy $0.075/kWh
Average cost of electricity provided by local grid $0.12 /kWh Average cost of hot water provided $0.60/therm 1.4 Environmental Analysis Evolution Energy CO2 from H2 production 11,800 grams CO2/Kg H2
CO2 from electrical production 293 grams CO2/kWh Local Grid
CO2 produced from local grid power 489 grams CO2/kWh
1.5 Bonus Points
Renewable energy technology Landfill gas
Local Fire Marshal approval Yes (Appendix)

Evolution Energy Systems™ Page 2 of 27
2 Technical Design
2.1 Introduction While the consequences of global warming become more apparent, worldwide demand for oil continues to rise. Meanwhile, political instability in oil rich areas increases volatility in global economic markets. These trends affect us all and, as a result, the search for answers to our energy insecurity is becoming a higher priority. Although no single “answer” exists, hydrogen, as an energy carrier, has the potential to play a significant role in a carefully designed energy infrastructure. Hydrogen can be safely used both as clean transportation fuel and as fuel in a reliable electricity generation and distribution plan, producing power efficiently where and when it is needed. Current electrical generation methods rely on centralized production facilities with long distance transmission networks. Failures in such systems can result in large numbers of customers being without power. Planned interruptions in service are also a problem, particularly during the summer months in the western states, when cooling loads can cause rolling brownouts. Strategically located power parks, providing decentralized energy services to a cooperative or region of commercial interests, can decrease and minimize service interruptions, while delivering energy products in a more efficient manner. The National Hydrogen Association (NHA) and the United States Department of Energy (USDOE) have solicited designs for a hydrogen power park. This report presents Evolution Energy Systems™’ (EES), the Humboldt State University (HSU) design team, proposal for a hydrogen power park in the City of Eureka, California. Located along northern California’s scenic north coast, the Eureka area is home to approximately 70,000 people. The waterfront in Old Town Eureka is currently undergoing a transformation into a thriving tourist district with five new major developments planned. The Hydrogen Power Park will be designed to provide combined heat and power to these developments as well as H2 fuel for county, mass transit, and public vehicles. The combined heat and power, as well as the stored hydrogen, will be produced using FuelCell Energy’s (FCE) DFC-300 molten carbonate fuel cells; the cells will be fitted with hydrogen recovery and purification systems designed to recover most of the estimated 20% of reformed hydrogen that is not utilized in the electrochemical reaction. The design of the hydrogen recovery system is based on a paper delivered by FCE engineers at the NHA’s 2004 conference (Jahnke et al. 2004). The hydrogen produced at the Eureka Power Park will be research grade, purified to the “six nines” level (99.9999% by volume) through a pressure swing adsorption (PSA) process (Mezei 2004). The power park is designed to operate continuously at full capacity between scheduled maintenance intervals. Hydrogen is produced in excess of quantities specified in the design guidelines. The excess hydrogen is enough to warrant the rental of two jumbo tube trailers, which would transport research grade hydrogen to clientele in the semiconductor industry, and analytical laboratories in Silicon Valley. This aspect of the design also allows for expansion of the hydrogen fueling infrastructure in northern California. Should demand warrant such expansion, tube trailers could be delivered to satellite stations along State Highway 299 and/or U.S. Highway 101. The stations would consist of a high pressure hydrogen compressor, a high pressure storage tank, and a fueling dispenser.

Evolution Energy Systems™ Page 3 of 27
2.2 Site location and Zoning The EES Power Park will be located in the Waterfront District of Eureka, Ca. (Figure 1). The approximate lot location is: Latitude/Longitude 40.8049°N, 124.1615°W; UTM zone 10 (X,Y) 402031 , 4517747.
Figure 1: Location of Eureka Power Park.
The lot is zoned Commercial Waterfront according to the City of Eureka General Plan. Because of the proximity to residential-zoned lots, noise levels shall be considered. The largest sources of noise pollution are the two H2 compressors and the two microturbines. These will be located inside the facility with appropriate soundproofing and are rated at acceptable levels as specified in section B-6 of the Eureka General Plan (§ 156.076 MC — COASTAL DEPENDENT INDUSTRIAL DISTRICTS).
2.3 Hydrogen Fueling Station Simulation A significant number of design parameters depend on the day-to-day fueling demands placed on the hydrogen refueling station. To gain insight into the design, the refueling station was simulated using a stochastic queuing theory model (the D2 model) coupled with a cascade storage algorithm developed by EES engineers (Carter et al. 2004). The simulation was constructed as a computer program written in FORTRAN 90. Post-processing algorithms were written in FORTRAN 90 and MatLabTM. The simulation model runs on a per second time discretization with system output timesteps as specified by the user. The simulation allows the user to test a fueling station storage tank and hydrogen production configuration while changing the number of service pumps available to the customer. The simulation provides the following information:
• Cursory economic information • Variation of vehicle tank pressures • Vehicle queuing times • Variation of storage tank pressure • Fueling station reliability (greater than 99.999%)
Example output files and an animation showing three-days of fueling station performance in the year 2019 are included on the compact disc enclosed with this design proposal.
2.3.1 Single-Station, Multi-Channel Queuing Theory Queuing theory is often used in simulation of fueling processes. In this simulation to optimize the components in the power park, a single station, four-channel queue was used. This represents a station with two pumps and four dispensers. The hours of operation of the station were limited to between 6am and 9pm, with a stochastic program defining arrival times between those hours.

Evolution Energy Systems™ Page 4 of 27
Monte Carlo simulation was used with exponential distribution for the stochastic interarrival times. Daily arrivals were defined as follows: 10 vehicles per 15 hour service day with one bus in 2010 increasing by four vehicles per 15 hour service day to 46 vehicles and one bus in 2019. These arrivals were set by the design guidelines and were assumed to follow a Poisson distribution. The bus was assumed to have a tank that can hold four times as much hydrogen as a car tank. Other design assumptions include 10 minutes pump time per vehicle with 7.2 minutes contributed to actual fueling of vehicle. Fueling times result from the maximum mass flow rate (0.008 kg/s) typically allowed into vehicle hydrogen tanks. From the simulation, queuing times were observed and analyzed for power park optimization. The maximum queue/year occurred in 2019 with 28 of 16,586 vehicles having an average wait time of two minutes.
2.3.2 Cascade Storage Algorithm Each second of the simulation, the pressure of vehicle tanks on the channels is adjusted as follows. The algorithm selects from the storage array the tank with the pressure closest to, but greater than, the vehicle tank pressure. The Beattie-Bridgeman equation of state governs the mass transfer and pressure dynamics of the tanks during equalization. When the difference between the pressures of the two tanks reaches 100psig, they are isolated via solenoid valves and the next lowest tank in the storage array is opened to the vehicle tank. This logic is followed until the vehicle tank pressure reaches 5000 psig. For recharge, 5.26 kg H2/hr is delivered from the compressor (2010 through 2014). The recharge algorithm selects tanks to fill based on the pressure of hydrogen in each tank, with preference for the high-pressure tanks. Such prioritization for recharge maximizes the probability that a given car tank will be filled completely. Refer to the supplemental CD .avi file for an animation showing tank response to the cascade algorithm. Assumptions of the algorithm include:
• Hydrogen is not an ideal gas at high pressures • Discharge and recharge allowed for the same storage tank simultaneously • Constant tank temperature of 26.85oC1
Please refer to the referenced Carter and Saucedo report for greater detail on the cascade storage algorithm and fueling station simulation. Also please note that some components of the simulation have changed in the proposed design since that report was written.
2.3.3 Results The model was used to optimize the station design by identifying the minimum equipment configuration that would provide 99.999% success of fueling events for each year of the design life. Design variables were number of fuel cells simulating the amount of H2 available for the system, and the number of low-, medium-, and high-pressure storage tanks per year. The optimal trajectory can be seen in Table 1, and sample results are included in the appendix.
1 Assumption based on 0.008 kg/s flow rate into vehicle tank.
Evolution Energy Systems™ Page 5 of 27
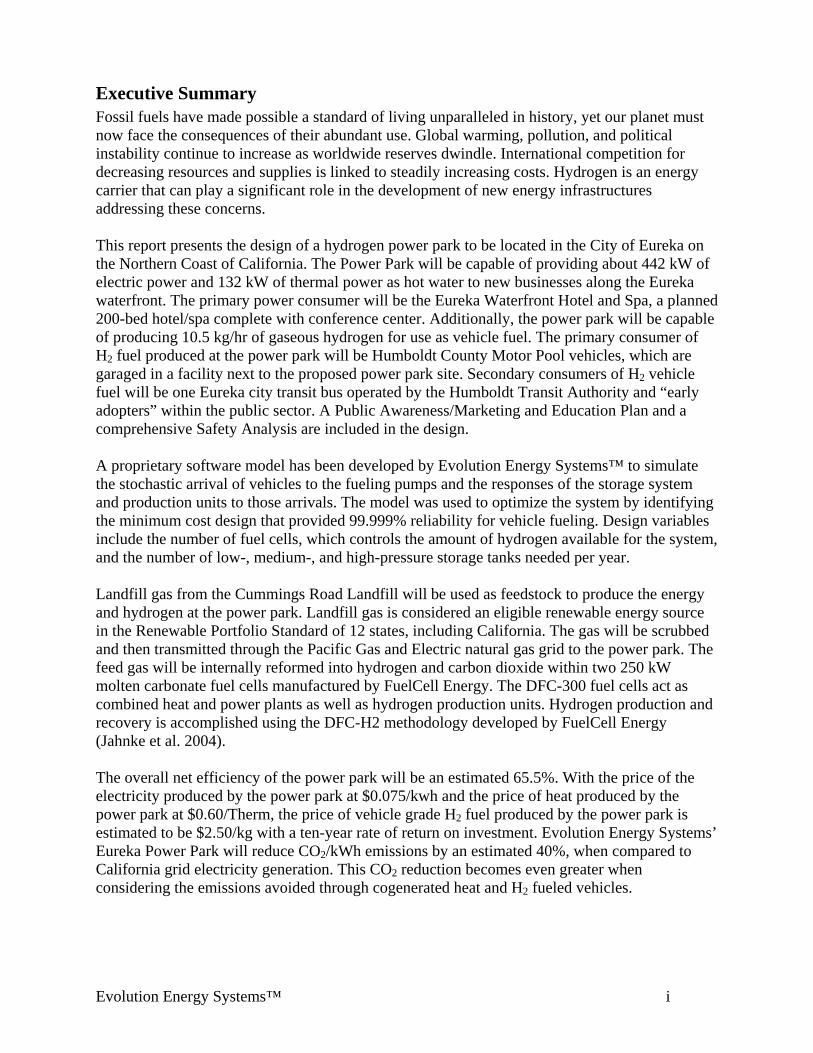
Table 1: Optimal design from 2010 through 2019 using the D2 model.
Year LPT MPT HPT FCs
Minimum observed reliability
2010 4 0 4 1 99.999% 2011 6 0 4 1 99.999% 2012 6 0 5 1 99.999% KEY
2013 6 4 7 1 99.999% FC Fuel Cell 2014 6 4 7 2 99.999% LPT Low Pressure Tank 2015 6 4 7 2 99.999% MPT Medium Pressure Tank 2016 6 4 7 2 99.999% HPT High Pressure Tank 2017 6 4 7 2 99.999% 2018 6 4 7 2 99.999% 2019 6 6 8 2 99.999%
Nine trials with the equipment configurations shown in Table 1 were simulated for each year. For each year, a maximum of 1 car out of 100,000 left the station with a partially filled tank due to inadequate pressure in the high-pressure storage tank array.
2.4 Source of Power Park Feedstock Hydrogen is only as renewable as the feedstock source or the energy used in producing it. EES firmly believes the benefits of a renewable hydrogen source are as important as the move toward economic security brought about by a hydrogen economy. The request for proposal (RFP) emphasizes the use of renewable energy, and EES has incorporated a renewable source of natural gas (NG) into the design of the power park itself. The proposed source for renewable biogas is the Cummings Road Landfill, owned and operated by the Humboldt Waste Management Authority (HWMA). Pursuant to the California Code of Regulations Title 27 Section 20921 (CRC 2005), Cummings Road Landfill has been extracting and flaring landfill gas (LFG) (Kindsfather 2005). The LFG is flared to destroy environmentally hazardous constituents found within the gas. However, utilization of this gas stream would bring economic and environmental benefits for the landfill and the community. Realizing the economic benefit to the landfill, HWMA has been searching for a method to utilize Cummings Road Landfill LFG. Cummings Road Landfill is projected to produce sufficient amounts of LFG to fuel the EES hydrogen power park in the design years of 2010 through 2019. The potential biogas production at the landfill was last assessed in June 2004 by SCS Engineers. The findings of the SCS study were summarized in a memorandum to the HWMA and projected an LFG flowrate of 371 scfm in 2010, decreasing to 196 scfm in 2019 (SCS 2004). Using a nominal LFG heating value of 450 BTU/scf (Tchobanoglous et al. 1993) and a landfill gas recovery rate of 95%, the landfill will be able to produce 1.59 therms/min in 2010, decreasing to 0.838 therms/min in 2019 (SCS 2004). This production is enough to meet the needs of the Power Park for the ten-year design horizon. The LFG produced at Cummings Road Landfill will have to be treated before being delivered through the existing natural gas grid to the proposed power park site. Treatment of the LFG will be performed by using an LFG treatment skid supplied by Prometheus Energy Company. These treatment skids use both cryogenic and adsorbent

Evolution Energy Systems™ Page 6 of 27
bed treatment processes to produce pipeline grade natural gas (PNG) from the LFG. The LFG treatment skid captures 85% of the BTUs entering as LFG. The treated gas stream will contain greater than 97% methane by volume with some CO2 and N2 gas remaining (Barclay 2005). The LFG treatment skid would be able to deliver 133 scfm in 2010 decreasing to 70.2 scfm in 2019 of PNG at 1014 BTU/scf. EES performed an economic analysis of LFG extraction and delivery based on the SCS study, pricing data from Dr. Barklay of Prometheus Energy Company, and tariffs from PG&E. The results of the analysis were presented to Gerald Kindsfather, General Manager of HWMA in the form of a proposal. A gas price of $0.35 /therm is estimated to offer a five year payback on a $600,000 capital investment2 with an additional $415,000 in profits being realized over the final five years of the design life. An annual O&M cost of $100,000 was included in the analysis. Mr. Kindsfather’s letter of endorsement to supply purified LFG for the power park is included in the appendix. EES representatives met with Ivan Maruffo, Senior Major Accounts Manager for Pacific Gas and Electric (PG&E), to discuss the logistics of transmitting the LFG to the power park via the PG&E gas grid. Mr. Maruffo indicated that there are no provisions for LFG injection to PG&E pipelines however; the utility does recognize that suitable scrubbing equipment does exist and is researching the logistics involved. In concept, the practice will be developed by 2010 and the purified LFG will be injected into an existing three-inch pipeline adjacent to the landfill. The Gas Electricity Generation (GEG) rate tariff was applied to calculate the transmission charges associated with using the PG&E gas grid. EES will act as its own gas broker in all dealings with HWMA and PG&E.
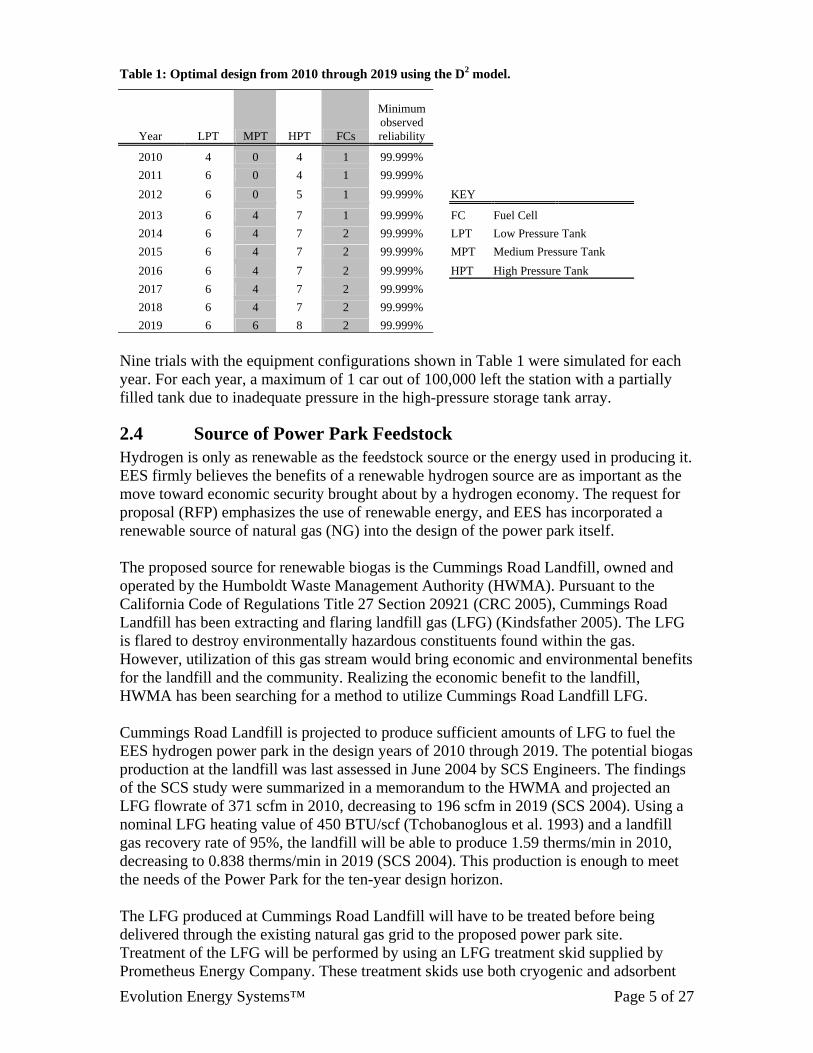
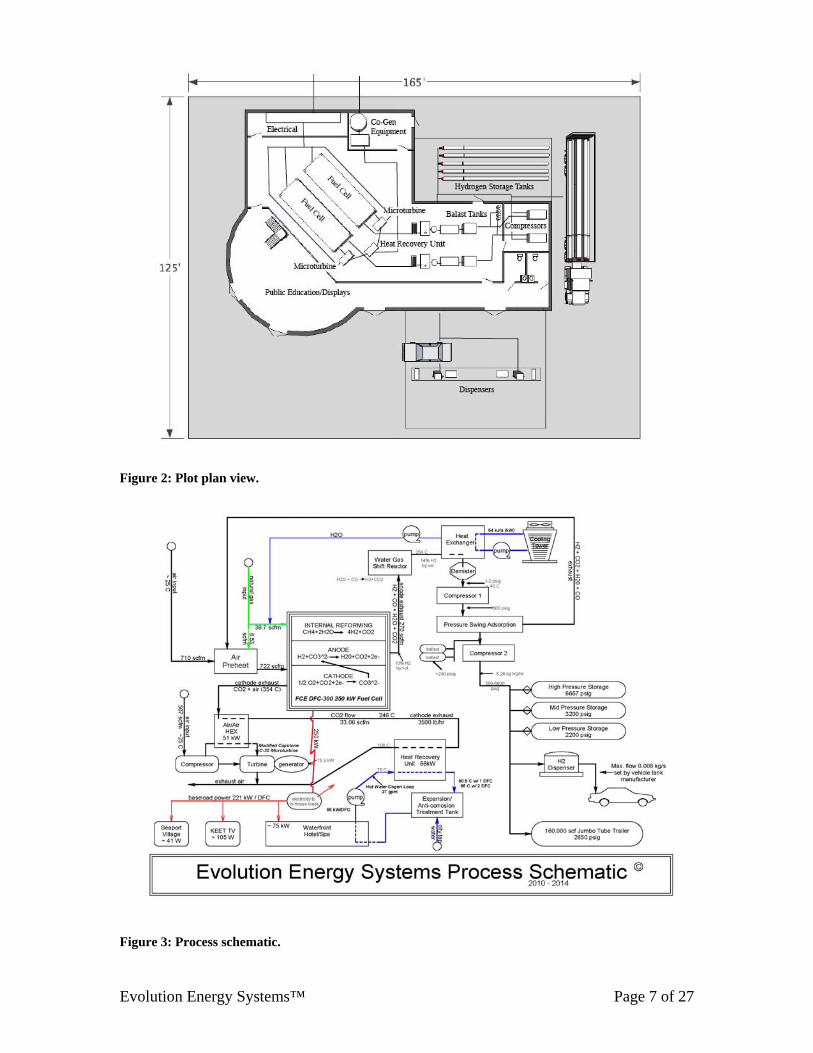
2.5 Plot plan view The various components are explained in the following section (Figure 2). This section outlines the components that have been optimized in the fueling station simulation model (Section 2.3). The design Schematic is shown in Figure 3.
2.6 Electricity and Cogeneration System
2.6.1 Fuel Cell At the center of the EES power park design lays the molten carbonate fuel cell (MCFC), trademarked Direct FuelCell (DFC®) by FuelCell Energy, Inc. DFC 300, 250kW MCFCs will provide the bulk of the electricity produced at the power park.. Approximately 15.3 kW of additional electricity will be generated by using heat from cathode exhaust to drive a Capstone C-30 microturbine per FCE’s Direct Fuel Cell/Turbine© pilot project (Ghezel-Ayagh et al. 2004). The high operating temperature (650 0C) of the DFC allows for hydrocarbon fuels, such as natural gas and landfill gas (Section 2.4), to be reformed into hydrogen and carbon dioxide within the fuel cell. Only about 80% of the reformed hydrogen is used by the DFC to produce electricity.
2 Capital investment includes $500,000 for a scrubber and $100,000 for extraction well drilling, resulting in a 95% biogas recovery rate.
Evolution Energy Systems™ Page 7 of 27
Figure 2: Plot plan view.
Figure 3: Process schematic.

Evolution Energy Systems™ Page 8 of 27
In the EES design, the unused hydrogen is recovered for use as vehicle fuel per the DFC-H2 methodology (Jahnke et al. 2004). In 2010, the EES design calls for one DFC 300 with hydrogen recovery, a bottoming cycle, and cogeneration equipment. To maximize capital utilization, the D2 model (Section 3.3) was used to determine that 2014 is the optimal year to add the second DFC 300H2/Turbine system. Each system contributes a net value of 221 kW electric power , 66 kW heat, and 5.26 kg H2/hour to the power park output. Jahnke et al. (2004) state that if feed gas additional to the amount required for normal operation is sent into a DFC, the reforming process will continue, thereby enriching the hydrogen in the anode exhaust stream. In the EES design, an additional 3.2 scfm of feed gas is supplied beyond the 36.5 scfm needed for normal operation. This boosts the mass flow rate of purified hydrogen from 4.6 kg/hr to 5.3 kg/hr and enables the 99.999% fueling reliability for all years in the design life.
2.6.2 Microturbine The heat supplied by the fuel cell’s cathode exhaust is used to produce additional electricity utilizing a Brayton bottoming cycle. The electricity is produced when compressed air is indirectly heated by the fuel cell’s cathode exhaust gas and then expanded through a turbine. EES has selected an unfired Capstone C30 gas microturbine for this task. One Capstone C-30 is capable of providing up to 30kW of power and 85kW of heat for combined heat and power applications. The microturbine incorporates a compressor, recuperator, combustor, turbine and permanent magnet generator. The rotating components are mounted on a single shaft supported by patented air bearings and spinning at up to 96,000 rpm. This is the only moving part of the microturbine. The generator is cooled by inlet air flow. The system uses no oil, lubricants, coolants, or other hazardous materials, and has no pumps, gearbox or other mechanical subsystems. System output is variable frequency (480 V, 50/60 Hz) 3-phase AC power (Capstone 2004). In the EES design, air, the working fluid in the microturbine, is first pressurized to approximately 4 atm and then heated to 335°C indirectly by the DFC® exhaust gases. This produces a turbine output of 15.3 kW.
2.6.3 Cogeneration Heat Recovery Unit The heat from the fuel cell’s cathode exhaust is first used to produce electricity via the Capstone C30 microturbine and then to heat water for a neighboring hotel and spa via the heat recovery unit (HRU) manufactured by Cain Industries. The U-tube heat recovery series (UTR) has a heat transfer core constructed of SA178 boiler tubing that is housed in a 0.25” carbon steel shell. The HRU is designed to receive the fuel cell’s cathode exhaust gas (after it leaves the microturbine) at about 264 0C. Heat is transferred to the cogeneration water loop at a rate of about 66.5 kW (assuming 85% heat exchanger efficiency) and the gas stream exits the unit at about 106 0C. This heat energy will raise the water temperature in the cogeneration loop from 75 to 85 0C with one fuel cell operating, and from 75 to 96 0C with two fuel cells operating. Should the water in the cogeneration loop return from the hotel at a temperature of 94o C or greater, a modulation valve will open in the HRU allowing the cathode exhaust to bypass the heat exchanger.

Evolution Energy Systems™ Page 9 of 27
2.6.4 Cogeneration Loop The heated water in the cogeneration loop will be pumped at a rate of 25 gpm approximately 200 meters to the hotel/spa where the heat will be transferred to the hotel boiler feed water. The pump will be a 326 series centrifugal unit manufactured by Aurora Pumps and have a capacity of 140 gpm at 55 ft. of head. The pipe will be manufactured by Permapipe™ and will be buried in a 4 ft deep trench.
2.7 Hydrogen Recovery, Storage, and Dispensing System
2.7.1 Water Gas Shift Reactor Approximately 5% of the anode exhaust gas is carbon monoxide, which is formed due to the incomplete oxidation of methane during steam reformation. When catalytically combined with water vapor, this CO produces more hydrogen, which increases the power park’s total recovered hydrogen by about 40%. A water gas shift (WGS) reactor is used for this purpose. NexTech Materials, Ltd. WGS reactors that will be used in the EES power park utilize expensive catalysts laid out in a proprietary design (NexTech 2005). Hence the cost of a WGS unit is directly dependent on its volume. Table 3 reveals an almost exponential increase in the reactor volume with temperature. In order to avoid prohibitive costs, EES will purchase a unit that will operate at 350 o C, approximately equal to the anode exhaust gas temperature. Table 3: Variation of WGS reactor volume and catalyst weight with operating temperature.
Temperature Equilibrium CO WGS Reactor WGS Catalyst (degrees Celsius) Conversion Volume (liters) Weight (grams)
400 78.81% 4.66 1,400 350 80.29% 12.27 3,680 300 86.65% 36.66 11,000
The anode exhaust gas exits each fuel cell and enters directly into the WGS reactor, with no need for cooling. During the WGS reaction, the hydrogen content in the anode exhaust stream is increased from 10% to approximately 14% resulting from an 80% CO conversion (Table 4) (NexTech 2005). Table 4: Anode Exhaust Gas Stream Composition by volume.
Species Entering WGS Leaving WGS H2 10% 14%
CO 5% 1% CO2 45% 49% H2O 40% 36 %
2.7.2 Anode Gas Cooling and Drying Heat Exchanger The PSA process that produces research grade hydrogen requires the gas to be pressurized to around 300 psig and dried. Since the pressure of the anode exhaust exiting the fuel cell is only of the order of 2 psig, a compressor is employed just upstream of the PSA unit. The anode gas has to be cooled and dried in order to meet this diaphragm compressor’s specifications. This is accomplished using an Ultramax shell and plate heat

Evolution Energy Systems™ Page 10 of 27
exchanger model number UM-20-H-05-US-40 manufactured by Tranter. The majority of the water in the anode gas stream drops out of this heat exchanger and is collected in a reservoir and subsequently pumped back to the fuel cell’s anode feed.
2.7.3 Cooling Tower Heat from the anode exhaust is transferred to a 50/50 ethylene/water mix, and pumped to a Marley Cooling Technologies model 490A AquaTower on the roof of the power park. Approximately 54 kW is dissipated at the cooling tower. The circulation pump will be a Bell & Gossett series 80 centrifugal pump rated at 57 gpm and 30 ft of head.
2.7.4 Demister The majority of the water is removed in the heat exchanger and collected in a reservoir and subsequently pumped back to the fuel cell where it is reused in the reformation step. The water remaining in the anode exhaust flow is removed to trace levels using a KOY style 326 demister pad in a 10’’ diameter 316 ss vessel of sufficient length to allow for collection and draining of water.
2.7.5 Low-Pressure Compressor A PDC machines diaphragm compressor will be used to bring the cooled gas up to 300 psig, the operating pressure of the pressure swing adsorption unit. PDC’s metallic diaphragm compressors are designed to compress gas without incurring any contamination of the product gases or leakage into the atmosphere. Each compressor is fully automated, with auto-unloading system, auto-recycle, inter-stage and aftercoolers, and meets NEC Class I, Division II, Groups B,C,D standards (PDC 2005).
2.7.6 Pressure Swing Adsorption Pressure swing adsorption is a batch process that uses multiple adsorber vessels to process a constant feed flow, which produces a constant product and off-gas flow. The interconnected vessels contain one or more adsorbents that selectively remove CO2, CO and H2O. The impurities are purged from the adsorbent and sent into the off-gas stream while the hydrogen is released into the product gas stream. Some hydrogen is lost in the process (UOP 1999). EES’ power park will use an H-3200 PSA unit, supplied by QuestAir Technologies, Inc., to extract pure hydrogen (99.9999 mol%) from a 176 scfm gas stream that contains 23% H2, 77% CO2 (by volume) and trace amounts of CO and H20. Each H-3200 unit is capable of processing around 200 scfm; therefore, one PSA unit will be used at the termination of each fuel cell’s anode exhaust stream. The hydrogen recovery for each PSA is 85% by volume (Mezei 2005), that will result in a total hydrogen flow rate of 5.26 kg/hr from each DFC.
2.7.7 High Pressure Compressor For the purposes of compressing the final purified hydrogen gas from the PSA for storage in the cascading hydrogen storage system, the EES’ power park will use a hydrogen compressor manufactured by PDC Machines, Inc. The selected three-stage metallic diaphragm compressor has been specified to receive hydrogen at an inlet pressure of 300 psig (from the PSA unit) and release the gas at pressures ranging from 500-6600 psig (to the storage tanks). At an inlet pressure of 300 psig, each compressor is capable of handling about 35 scfm of H2; therefore, one compressor will be used for each fuel cell’s

Evolution Energy Systems™ Page 11 of 27
anode exhaust stream. At the designed load each compressor will consume 36.2 kW of electric power (al-Qasem 2005).
2.7.8 Storage Hydrogen is stored in high, medium and low pressure tanks manufactured by FIBA Technologies Inc. The high pressure tanks are ASME certified while the medium and low pressures ones are DOT certified. The pressure rating, certifying agency and the price of each tank is shown in Table 2. The number of tanks used varies through the design life of the EES power park. This is explained in section 2.3.3 above. Table 2: Pressure Rating, Certification and Price of Hydrogen Storage Tanks.
High Medium Low
Pressure rating (psig) 6667 3200 2200 Certification ASME DOT DOT Price $18,500 $12,000 $4,500
2.7.9 Hydrogen Dispensers The hydrogen will be dispensed to vehicles with one of two dual hose hydrogen dispensers manufactured by Fueling Technologies International Inc. (FTI). FTI has used their knowledge of compressed natural gas dispensing to lead the way in hydrogen refueling technologies. In the EES design, the FTI dispenser is used to refill a vehicle tank with 4.3 kg of hydrogen at pressures of 5,000 psig in 7.2 minutes. The FTI dispensers use a programmable logic controller (PLC) to communicate with each storage tank equipped with a pressure transducer and solenoid valve. This storage-dispenser interaction is what enables the cascade dispensing of the hydrogen. Each pump is equipped with wireless communication support for direct communication with the vehicle while refueling. Breakaway hoses are utilized to mitigate the danger of a vehicle driving away with the nozzle still engaged.
2.7.10 Plumbing There are three main plumbing systems in the power park design.
• Cogeneration (hot water) • Air lines (hot air) • Hydrogen Plumbing • Inert gas purge system
All plumbing will meet standards as specified in Section 3. A detailed plumbing diagram, including all associated fittings, is located in the appendix. As hot water is one of the products offered by the power park, the need to minimize heat loss is important in the EES power park design. Insulated iron piping such as Permapipe™ shall be used for hot water transport to the businesses consuming this commodity. High pressure hydrogen lines are specified to be SS-316 rated as manufactured by Swagelok Company with compatible fittings. As the cathode exhausts are at high temperatures the plumbing used for air transport will be made of welded steel, rated for high temperatures and insulated for heat retention during transport to the microturbine.

Evolution Energy Systems™ Page 12 of 27
3 Safety Analysis
3.1 Introduction Safety is of paramount concern in situating a hydrogen power park in a populated area. The pubic perception and acceptance of hydrogen as a viable fuel will depend on the success of first generation hydrogen facilities—even the appearance of potential safety failures must be avoided. All components of the power generation, distribution, and housing are designed to meet or exceed all applicable building and safety codes for the City of Eureka. H2 gas, smoke, H2 flame detectors and fire-suppression systems will be strategically placed around the power park. High pressure storage tanks will be protected by reinforced blast walls, and an inert gas purge system will be in place for the flammable gas plumbing Additional safety equipment and procedures used in the power park facility are listed below:
• Various sensors are used in cooperation with a programmable logic control to automatically detect hazardous conditions and make adjustments accordingly. These sensors include: thermocouples, pressure transducers, hydrogen sensors, oxygen sensors, hydrogen flame detectors, and smoke detectors. Solenoid valves are actuated through the PLC to shut down certain processes, divert flows, and release extinguishing agents or fire retardants.
• Pressurized inert gas (nitrogen or helium) is stored on-site and is connected to hydrogen lines in strategic locations (plumbing schematic in appendix ). Inert gas is used to purge plumbing lines of flammable fluids (hydrogen or oxygen) in emergency and/or maintenance procedures.
• Ballast tanks are used to ensure that all plumbing lines retain a positive pressure at all times to avoid intake of unwanted materials that may result in explosive conditions.
• Manual emergency shut-down “panic buttons” are strategically placed in and outside the facility to initiate immediate shut-down of all processes and purge hydrogen lines.
Several national and international agencies are in the process of developing safety codes for hydrogen power generation and refueling stations (NHA 2005). Table 3 provides an overview of existing and proposed codes to be followed in the development and operation of Evolution Energy Systems’ hydrogen power park. (For the purpose of this proposal, EES is concentrating on codes specifically pertaining to hydrogen. All applicable codes, standards and regulations pertaining to water, electrical, and natural gas distribution have been developed and tested over time and will be followed rigidly.) Table 3: Overview of Existing and Proposed Codes (NHA 2005, SERC 2002).
Component Codes, Standards, and Regulations Fuel Cell Power Plants ANSI /CSA America FC1-2004; NFPA 853; IEC TC 105 Fuel Cell Modules CSA No. 5.99; IEC TC105 H2 Fuel Gas Piping and Transmission NFPA 54; ASME B31.8; DOT 49; CGA G-5.4
Storage, Dispensing, and Venting
NFPA 55; ISO-TC 58, 197, 220; CGA G-5.4, 5.5; ASME Boiler and Vessel Code
H2 Dispensing Station NFPA 70A, 50A, 52; ANSI/CSA NGV4; ISO/TC 197 Safety and Emergency Response CGA P-1-1991; NFPA 70; OSHA Part 1910 of 29 CFR Code

Evolution Energy Systems™ Page 13 of 27
To emphasize safety, access to all hydrogen production and energy generation equipment and machinery is limited to trained personnel. Safety systems are designed with a degree of redundancy to minimize the chances of mechanical or operator error. Special attention is given to mitigating effects of potential natural disasters, specifically earthquakes and tsunamis. A Failure Modes and Effects Analysis (FMEA) is used to determine the most significant and probable failure modes (FMEA spreadsheet included on CD); the highest probability mode is analyzed.
3.2 Approval from Fire Department Captain Chris Emmons, City of Eureka Fire Marshal, endorses (in concept only) the design of the EES Power Park. The letter of endorsement from Captain Emmons is included in the appendix. In a meeting with the design team from EES on January 4, 2005, the Eureka Fire Department was given a chance to review the design concept and discuss concerns, recommendations, and requirements. As a result of this dialogue, the Eureka Fire Department is welcoming to the concept of a hydrogen power park and is optimistic about the EES design.
3.3 Major Failure Modes Despite scrupulously followed safety regulations in the construction and operation of the power park, extraordinary hazards may still be present. The FMEA was used to assist in the determination of the major failure modes. The top seven failure modes, ranked in order of greatest to least probability, are:
1. Accident involving public/hydrogen interface 2. Fire or explosion due failure of high-pressure hydrogen storage or distribution
systems. 3. Failure of the DFC 300 causing shutdown of operation 4. Fire spreading to power park from outside the facility 5. Electrical shock hazard from high voltage transmission lines 6. Natural gas pipeline fire 7. Terrorist attack or sabotage
3.3.1 Accident Involving Public/Hydrogen Interface Accidents involving the public interfacing with the hydrogen fueling and distribution system are considered the most probable failure modes because they involve non-professional and untrained persons who may be unaware of the appropriate safety precautions. Two potential failure modes identified and analyzed along with precautions taken are:
• Vehicle crashing into the fuel dispenser or hydrogen storage • Vehicle driving away with refueling hose attached
3.3.2 Vehicle Crashing into the H2 Dispensing or Storage The hydrogen storage and production areas are situated well away from vehicle traffic and are protected by high strength reinforced walls. The area around the dispenser will experience the most vehicular activity and therefore, it is the most likely collision site. The hazard of this type of incident increases if a collision results in the rupture of a high-pressure hydrogen line. The most important precautions will be to minimize any possibility of a vehicle crash and high-pressure hydrogen line rupture, should such a crash occur. The dispenser island is protected by bollards and the direction of traffic flow

Evolution Energy Systems™ Page 14 of 27
will be controlled. Landscaped berms will prevent vehicles from striking the dispensers perpendicularly at high velocity. Even if struck perpendicular to traffic flow, damage will be greatly reduced because the dispenser is placed on an elevated island and constructed of strong steel. In the unlikely case a hydrogen line does rupture at the dispenser, steps will be taken to stem the hydrogen flow while simultaneously minimizing the chances of ignition. If the integrity of the pressure transducer at the dispenser is lost, the programmable logic controller (PLC) will immediately shut the valve controlling flow to the dispenser, close all the storage tanks, and stop the compressor. In addition, manual system shutdown switches are located at several locations around the station, which can be tripped to close the solenoid valves and shut down the distribution system. If necessary, the hydrogen in the lines will vent to the atmosphere and an inert gas purge of the hydrogen lines will occur automatically. A 400-square foot area around the dispensers is designated as smoke and cell phone free, strictly enforced by the operator. Also, any electrical equipment (e.g. overhead lighting) will meet Class 1, Div. 2 hazardous location requirements. In the event of a ruptured line, the small amount of hydrogen that may escape will disperse quickly because of the outdoor location of the dispenser and low density of hydrogen. The dispensing area, as well as the entire power park, is well equipped with fire fighting and suppression capabilities and a 911-hotline link.
3.3.3 Vehicle drives away with refueling hose attached Since hydrogen fueling stations incorporate nascent technologies, self-service will not be permitted; refueling will be performed by a trained operator. In the low-likelihood event that a vehicle drives away with the fueling hose attached, the central PLC will close the cylinders’ solenoid valves and shut down the system if the pressure transducer in the hose loses its integrity. Breakaway hoses with automatic shut-off are specified for the pump. In the unlikely event that the released hydrogen does ignite, an automatic shut-off valve will stop the flow of hydrogen so the flame will not spread to the tanks, allowing relatively easy containment.
3.4 Natural Disasters Eureka is located close to the Mendocino “triple junction” (the junction of the North American, Pacific, and Juan de Fuca plates) and is one of the most seismically active areas in the world. The building codes in this region extensively address earthquake issues and will be followed for all power park structures. Rigid plumbing connections between components have strain relief features that allow relative movement between components without rupture. All components, including the DFCs, compressors, and storage tanks will be anchored tightly in place. In addition to the danger from a potential earthquake, EES has also considered the possibility of tsunamis that can follow even distant seismic activity. Although located on the Eureka Bay waterfront, the proposed site is protected from severe seas by Woodley Island. According to tsunami hazard maps, the proposed site of the EES Hydrogen Power Park is designated a “No Hazard” area (Redwood Coast Tsunami Workgroup 2004).

Evolution Energy Systems™ Page 15 of 27
4 Economic/Business Plan Analysis
4.1 Initial investment Building costs for the Eureka Power Park are estimated to be $208/ft2 (RSK 2004). Total construction costs for the 7000 ft2 facility are estimated to be $1.56 million including $84,000 for raw land purchase (Willis et al. 2004). In 2010, an initial investment of $1.07 million will procure and install all equipment needed to begin operations (Table 4). Assuming demand for hydrogen vehicle fuel grows as predicted in the RFP, additional investments in equipment will be needed in 2014 and 2019 at levels of $0.97 and $0.29 million respectively. These capital investments assume rebates of $2,500/kW will be awarded by the California Public Utility Commission (CPUC) under the Self Generation Incentive Program (FCE 2004). Table 4: Variable capital cost summary
Capital CostsItem Quantity $ Quantity $ Quantity $
Fuelcell 1 $375,000 1 $375,000 0 $0Core Replacement (every 5 years) 0 $0 1 $250,000 1 $250,000Microturbine 1 $30,000 1 $30,000 0 $0Capstone modification (gas-->heat) 1 $8,000 1 $8,000 0 $0Heat recovery unit 2 $16,000 0 $0 0 $0Co-gen pump 2 $1,500 0 $0 0 $0Expansion tank 1 $500 0 $0 0 $0Co-gen plumbing 1 $10,000 0 $0 0 $0Water gas shift reactor 1 $9,200 1 $9,200 0 $0Heat exchanger 1 $9,656 1 $9,656 0 $0Cooling Tower 1 $3,600 1 $3,600 0 $0Demister hardware 1 $500 1 $500 0 $0Demister cartridges 4 $4,000 4 $4,000 0 $0Low pressure compressor 1 $20,000 1 $20,000 0 $0PSA 1 $120,000 1 $120,000 0 $0Ballast tanks 2 $400 2 $400 0 $0High pressure compressor 1 $85,000 1 $85,000 0 $0Low pressure tanks 6 $27,000 0 $0 0 $0Medium pressure tanks 4 $48,000 0 $0 2 $24,000High pressure tanks 7 $129,500 0 $0 1 $18,500Dispenser 2 $97,200 0 $0 0 $0Electrical load center 1 $15,000 0 $0 0 $0Helium Tanks 6 $1,200 0 $0 0 $0Tube trailer gas connector 1 $1,000 0 $0 0 $0O2 analyzer PlumbingControl Units (sensors ect)Solenoid valves Pressure transducers Building costs 1 $1,455,851 0 $0 0 $0Asphalt /sq. ft. 14000 $24,500 0 $0 0 $0Bollards /unit 2 $400 0 $0 0 $0Fencing /ft. 78 $1,014 0 $0 0 $0Eureka land purchase 1 $84,000 0 $0 0 $0Marketing Package 1 $6,325 0 $0 0 $0Cost of Incorporation 1 $100 0 $0 0 $0Total investment in year required $2,643,206 $974,116 $292,500Total discounted capital cost
2019
1 1 0
$3,431,786
$58,760 $58,760 $0
2010 2014

Evolution Energy Systems™ Page 16 of 27
4.2 Revenues and expenses Due to the high quality of hydrogen produced at the power park, substantial revenues can be earned through the bulk sale of research grade hydrogen. High tech industries and analytical laboratories in central California provide an active market for the sale of this commodity (Klefner 2004). Output files from the D2 model estimate average excess hydrogen production rates of 63.5 kg/day over the design life. The net revenue garnered from the sale of this hydrogen greatly enhances power park economics allowing EES to subsidize the selling price of hydrogen to vehicles. Additional revenues from the remaining two energy products along with expenses are shown in Table 5. Table 5: Summary of revenues and expenses
Tube Trailers Vehicles
From H2
2010 1029 115 1144 178 12 183 100 21 1030 4702011 718 152 870 178 12 177 100 21 762 3062012 446 184 630 178 12 177 100 21 522 1592013 199 213 412 178 12 177 100 21 304 262014 1952 246 2198 297 24 177 195 28 2119 4412015 1696 277 1973 297 24 177 195 35 1886 8552016 1399 312 1712 297 24 177 195 35 1625 6952017 1143 343 1487 297 24 177 195 35 1400 5572018 902 373 1275 297 24 177 195 35 1188 4272019 605 408 1012 297 24 177 195 36 924 82
Electric Heat Cash Flow
Discounted Cash Flow
Expenses ($1000/yr)
Continual Costs Fuel O&M
Revenues ($1000/yr)
Year
Hydrogen
The overall annual expenses encompass the operation and maintenance for the power park equipment, employee salaries and benefits, water and waste charges, and feed gas supply. With the exception of the rented tube trailers and core replacement of fuel cell stacks, all equipment will be maintained by employees of EES. Every five years the fuel cell stacks will be replaced. To account for unforeseen maintenance, 2% of initial capital investment per year is assumed for all equipment maintenance costs unless otherwise specified. Straight line depreciation of both the equipment and the building was used to determine the taxable income for each year of the design life. Depreciation rates used were 10% for equipment and 2.56% for the building. Federal and state tax rates of 34% and 8.84% respectively, were applied to the resulting taxable income. The resulting after tax cash flow was discounted using a 10% discount rate. Salvage value for equipment was also incorporated into the analysis.
4.3 Energy Balance Methane is converted at the power park into three energy products, electricity, heat, and hydrogen fuel. The energy balance has been summarized in Table 6.
4.4 Utility Rate Structure Utility bills and other load data were obtained by EES in order to estimate energy consumption for the power park loads (Schoenherr 2004) (Weston 2004). Natural gas rates for the hotel, the KEET public television studio, and the Seaport Village fall under

Evolution Energy Systems™ Page 17 of 27
Table 6: Power park energy balance.
Energy In kW Energy Out kW46.19scfm-1 755.4 Compressor Low 5 Hydrogen 207.5
CH4 Compressor High 35 Electricity 221.0Fans, pumps, lights etc. 4 Heat 66.4
Total 755.4 44 494.9Net System Efficiency 65.51% Gross System efficiency 71.34%
Energy In kW Energy Out kW92.4scfm-1 1511.2 Compressor Low 10 Hydrogen 415.0
CH4 Compressor High 70 Electricity 442.0Fans, pumps, lights etc. 4 Heat 132.8
Total 1511.2 84 989.8Net System Efficiency 65.50% Gross System efficiency 71.06%
System Parasitic Loads kW
System Parasitic Loads kW
2010
2019
PG&E’s G-NR1 rate schedule. PG&E’s E-19 Secondary rate schedule is applicable for electricity billing at these facilities. The estimated electric load profiles for the aforementioned facilities are shown in Figure 4.
0
10000
20000
30000
40000
50000
60000
70000
80000
90000
100000
0 2 4 6 8 10 12
Month
kW
h/
mo
nth
Hotel
KEET
Seaport Village
Base load provided to KEET @ 105 kW
Base load provided to hotel @ 75 kW
Base load provided to Seaport Village @ 41 kW
Figure 4: Load profiles for facilities serviced by the Eureka Power Park. In concept, baseload power will be supplied to the aforementioned facilities by the power park. The facilities will each pay an appropriate reservation charge under the E-19 S rate schedule to reserve capacity sufficient to meet their peak demands. The first fuel cell will be dedicated to servicing these loads. Any excess capacity will be purchased by PG&E. When the second fuel cell is installed in 2014, the entire 225kW capacity will be sold to PG&E under a short term avoided cost arrangement for $0.05 - $0.08 per kWh unless EES can identify additional regional clients. Data indicates that the proposed Waterfront Hotel and Spa will have thermal loads large enough to absorb the entire heat output of the power park (Weston 2004).

Evolution Energy Systems™ Page 18 of 27
4.5 Cost Relative to Local Utility Costs The power park can offer electricity and heat at prices at or below rates offered by PG&E (Table 7). Power park customers will receive added value in price stability, increased energy reliability due to redundancy with grid, and also the market advantages of “green” business labeling. Table 7: Comparison of power park rates to PG&E rates
PG&E avg. rates (E-19) Power Park rates PG&E avg. rates (G-NR1) Power Park rates $/kWh $/kWh $/Therm $/Therm
Part Peak 0.12 0.09 Summer 0.78 0.6 Off Peak 0.09 0.09 Winter 0.83 0.6
4.6 Selling Price of Hydrogen In approaching the design of the power park EES optimized the overall station design by minimizing overall system costs using the D2 model. The output files from this model provided data on the amount of research quality hydrogen produced. These data were used to estimate the number of 160,000 scf tube trailers that could be filled for each year of the design life. Distribution Sales Manager for Air Liquide, Bob Klefner, provided estimates of the market value of the hydrogen ranging from $10/100ft3 to $12/100ft3. Mr. Klefner also furnished transportation costs per mile and trailer rental costs. With this information the revenues from sales research grade hydrogen was estimated for each year. The final selling price of hydrogen for vehicle fueling is highly dependent on these revenues (Figure 5).
$0.00
$1.00
$2.00
$3.00
$4.00
$5.00
$6.00
$7.00
$10 $11 $12
$/100 ft^3 from tube trailer sales
Selli
ng p
rice
of h
ydro
gen
($/k
g)
Figure 5: Sensitivity of vehicle fuel selling price to "six nines" market price.
Clearly, the sales of hydrogen vehicle fuel at these prices is not optimal in a strictly for profit business. However, given that a 10% return on investment will be realized with this design, EES believes that subsidizing vehicle fuel in this way is a sound investment in the in the hydrogen economy.

Evolution Energy Systems™ Page 19 of 27
5 Environmental Analysis The main source of energy for the power park is methane (CH4) derived from purified landfill gas. This is a hydrocarbon fuel and will release carbon into the environment as it is oxidized through the following reaction:
CH4 + 2O2 → 2H2O + CO2
5.1 CO2 Analysis The CO2 analysis includes three sections:
• CO2 production related to energy generation • CO2 production related to hydrogen production • CO2 related to vehicle fleet conversion
5.1.1 Energy Generation The California Gross System Power for 2003 was used for grid production calculations (CEC 2004). The California energy distribution as well as the CO2 production is summarized in Table 8. The masses of CO2/kwh by fuel type are as defined by the DOE (DOE 2000) and Environmental Update (EU 2004). Table 8: California Gross System Power (GSP) for the year 2003, including mass of CO2 produced.
Fuel Type GSP GSP Percentage Kg CO2/kwh
Weighted average (kg CO2 /kwh)
Coal 59016 21.3% 0.950 0.202 Large Hydro 44926 16.2% 0.000 0.000 Natural Gas 102005 36.9% 0.596 0.220 Nuclear 41925 15.2% 0.000 0.000 Renewables 28740 10.4%
Biomass 5574 2.0% 3.325 0.066 Geothermal 13771 5.0% 0.000 0.000 Small Hydro 5146 1.9% 0.000 0.000 Solar 758 0.3% 0.000 0.000 Wind 3491 1.3% 0.000 0.000
TOTAL 276612 1 0.541 0.489 In a set of written comments to the California Energy Commission, the President of American Distributed Generation (ADG), Robert A. Panora, describes the expected CO2 emissions from distributed natural gas heating systems (Panora 2004). These comments were used to estimate, per MBTU, how much CO2 would be produced from a boiler heating water using natural gas and summarized with the emissions from Table 8 (Table 9).

Evolution Energy Systems™ Page 20 of 27
Table 9: Carbon Dioxide emissions for electrical and heat energy production for a modern power plant using natural gas as reported in ADG's written comments to the California Energy Commission (Panora 2004). Values have been normalized and converted to SI units.
Energy Component Normalized CO2 emissions Electricity
(California GSP) 489 g CO2 / KWhe (delivered)
Heat (on-site boiler) 54.7 kg CO2 / MBTU
Using these numbers, the CO2 produced using conventional means are compared to the CO2 produced by the power park using normalized CO2 emissions (Table 10). The system was analyzed at full capacity (two DFC-300s and two Capstone C-30 microturbines) as occurs for the years 2014 to 2020. Table 10: Normalized CO2 emissions for analysis.
Normalized CO2 emissions (heat)
Normalized CO2 emissions (electricity)
Conventional energy generation
54.7 kg/Million BTU 488 g CO2/kWh
Hydrogen Power Park 0 kg/Million BTU 293 g CO2/kWh
5.1.2 Hydrogen Production The hydrogen used for vehicle fleets is a byproduct of the energy generated by the DFC-300; the CO2 produced from this process is related to the purification process. In the water gas shift reactor the remaining carbon monoxide (CO) is converted to carbon dioxide (as described in Section 2.7.1) This reaction is summarized in Table 11. Table 11: CO2 emissions, both molar and mass ratio, for hydrogen production.
Energy Component Normalized CO2 emissions (Molar Ratio)
Normalized CO2 emissions (Mass ratio)
Hydrogen Production 0.5 moles CO2/mole H2 11.8 grams CO2/gram H2
5.1.3 Vehicle Fleet Conversion Another source of CO2 to be offset by the power park includes emissions from county vehicles. In the year 2020, a minimum of 50 county vehicles traveling an average of 80 miles per day as well as one municipal bus traveling an average of 131 miles per day will have been converted to hydrogen fuel cell vehicles (HTA 2004). Assuming an average fuel efficiency of 15 miles per gallon (mpg) and assuming 19.63 lbs CO2 (8.9 kg CO2) per gallon of gas used for gasoline powered vehicles (EPA 1995), the amount of CO2 the 50 vehicles and one bus would produce is estimated at 2,452 kg CO2 / day. The hydrogen fuel cell vehicles, by comparison, produce no CO2 emissions.

Evolution Energy Systems™ Page 21 of 27
5.2 Permitting and Emissions The Power Park will increase carbon dioxide emissions within the vicinity. The amount of CO2 to be emitted is not a significant impact on local air quality based on air quality standards published by the North Coast Unified Air Quality Management District (NCUAQMD). NCUAQMD policies regarding natural gas combustion are addressed in Regulation 1 – Air Quality Control Rules. Relevant sections of this document include Mandatory Monitoring Requirements. Discussion with NCUAQMD stationary source permit program manager, Al Steer, confirmed that exhaust stream monitoring would allow for permitting the power park at the proposed location. Mr. Steer approached the subject of permitting the proposed power park enthusiastically since the technology demonstrates a clear advantage in regional energy utilization and resulting emissions. Based on the mandatory air quality monitoring requirements, the power park must monitor air contaminant emissions. Required monitoring practices are summarized in Appendix B of NCUAQMD’s Regulation 1 document. The proposed power park’s impact on local air quality is considered not significant with a required mitigation of continuous exhaust gas monitoring and reporting to the NCUAQMD.
5.3 Landfill Gas Value Proposition The design emphasis on renewable energy led to a research effort to identify a suitable renewable energy source. LFG used for electricity production is considered to be CO2 neutral and therefore a “renewable energy source” (CEC 2004). The unused LFG from Cummins Road Landfill was selected because of professional documentation of production volumes and proximity to the power park. Using purified LFG under a contract with HWMA allows for the power park to fix a fuel cost for the entire design horizon since the applicable transmission tariffs do not fluctuate with natural gas markets. While insufficient supply of LFG will not affect the technical performance of the power park due to other sources of NG, if predictions of LFG production at the Cummins Road landfill prove to be incorrect, additional costs may be incurred if natural gas prices rise as predicted by the DOE (Energy Information Agency 2004). The primary criterion used by EES in determining if LFG would be feasible was if a contract could be developed that can provide LFG at a cost less than or equal to that of conventional NG. The economic analysis presented to the HWMA proved to be an attractive investment opportunity therefore resulting in an opportunity to pursue a contract, in concept only, between HWMA and EES.
5.4 Renewable Energy Generation Availability Harvesting natural gas from a landfill in Eureka will offset the natural gas used by the power park. Landfill gasses as well as gasses produced at wastewater treatment facilities are flared (or burned off) if not harvested, producing CO2 without the benefit of energy or hydrogen generation. As natural gas is harvested from these sources and used as a fuel, no additional carbon is added to the atmosphere because the oxidation reaction occurs either way. Because of this the energy generated from the design is considered renewable.
Evolution Energy Systems™ Page 22 of 27
6 Public Awareness/Marketing and Education A positive public perception of hydrogen is critical to the success of emerging hydrogen technologies. Employing hydrogen technologies in an urban setting, specifically the high-pressure storage and dispensing of hydrogen, is often a source of concern for the general public. Recognizing the pivotal role of the public in the acceptance of hydrogen technologies, EES will develop and execute education and public awareness programs designed to build public acceptance of hydrogen. A marketing scheme will also be developed to further promote hydrogen technologies.
6.1 NEPA/CEQA Compliance EES will be engaging the public throughout the design process in accordance to National Environmental Policy Act (NEPA) and California Environmental Quality Act (CEQA) guidelines for public meetings. An Environmental Impact Report was drafted by Humboldt State University (HSU) students outlining potential impacts and mitigations (RESU 2004).
6.2 Adaptive Management Plan The public education and awareness plan will employ an adaptive management (AM) strategy. One definition of adaptive management is a “systematic process for continually improving management policies and practices by learning from the outcomes of operational programs.” (Ministry of Forests 2000). The AM strategy will establish clear objectives, baseline conditions, a dynamic process for attaining the goals, and a systematic approach for improving education. The objective of the AM plan is to develop education and public awareness programs that actively improve the public perception of hydrogen as a fuel. The strategy of the plan is to educate, inform, and involve the public while monitoring the effectiveness of the various approaches. The Pat Henry Group, a marketing research company, will assist in the monitoring process by developing questionnaires, compiling and analyzing the questionnaire responses, providing reports and suggesting “next steps.” Using an outside research firm will insure that the questions developed are psychologically non-biasing. All answers will be quantifiable, as they will be scaled (rank on a scale of one to five), multiple choice, or yes/no. Example baseline questions include: “How safe are hydrogen storage tanks?” (One to five), and “Have you heard of the Hindenburg explosion? If so, what was the cause?” (a, b, c, d). The first step in implementing the AM plan is to develop baseline conditions by compiling public opinion data. Baseline questionnaires will be administered to quantify the public’s perception of hydrogen safety and investigate the grounding of these perceptions. Written questionnaires will be administered to randomly selected participants at town meetings and through the mail. In addition, telephone interviews will be employed. The data collected from administering the baseline questionnaires will be used to develop effective education and outreach programs. The issues that will be included in the questionnaires are: the Hindenburg explosion, politicians’ announcements of hydrogen agendas, and the person’s perception of their own knowledge. An open-ended question will be included to allow participants to describe any other thoughts or concerns that they have about hydrogen.

Evolution Energy Systems™ Page 23 of 27
Activities that will be implemented in the design of the educational plan are:
• Press releases • Public relations outreach activities • Grand opening fair • Power park tours • Public meetings • Pamphlets
Other educational activities will be considered and chosen based on their cost, ease of implementation, estimated effectiveness, and size of population affected. The initial list of activities that will be considered for implementation includes:
• Booth at alternative energy and sustainable living fairs • On-site conference room that will be available for public use • Classroom demos in local schools • Encourage field trips (send out press release to schools) • Television and radio commercials and informational video • Interpretive sign and/or mural in front of facility describing
the renewable H2 cycle
6.2.1 Administrative Structure EES will appoint a Power Park Safety Committee to address the past, current, and future state of the public’s perception of hydrogen, including their opinions on the safety of a hydrogen power park. The Safety Committee, composed of the Power Park Manager, two power park employees, and three Eureka city council members, will be responsible for adjusting the education and public awareness plans based on their proven effectiveness. Every six months, the Safety Committee will review and compile the Pat Henry marketing and research data and develop a plan of action to improve the effectiveness of their public awareness programs.
6.3 Marketing Plan In order to actively promote the fueling station, an advertising campaign will be implemented to reach out to potential customers. The message is direct yet subtle regarding the economic transition represented by the power park, promoting the idea that the next historical time period after the Industrial Revolution will be known as the “Industrial Evolution.” A one page advertisement is included in Section 6.4. Cox Rasmussen & Co. Inc. has been hired to head the campaign. Cox Rasmussen & Co. Inc. will provide an informational campaign targeting local media, including strategic billboard location, print, radio and television advertising. A detailed estimate is included in the Economic Analysis (Section 4) and appendix.

Evolution Energy Systems™ Page 24 of 27
6.4 One Page Advertisement

7 References al-Qasem, Osama (2004) Personal Communication via e-mail, December 15, 2004.
Barclay, J. Prometheus Energy Systems (2005). Personal Communication.
Capstone C30 Microturbine Specifications Sheet (2004) [Online] Available:
http://www.capstoneturbine.com/Documents/C30biogas.pdf, January 10, 2005 Carter, D. and Saucedo, D. (2004). Simulation - Optimization of a Hydrogen
Fueling Station Cascading Storage System. Semester Project for Humboldt State University Course ENGR 501 - Environmental Systems Analysis I.
CEC (2004) Renewable Portfolio Standard Eligibility Guidebook, Publication number
500-04-002F1 [online] Available: http://www.energy.ca.gov/portfolio/documents/guidebooks/2004-08-20_500-04-002F1.PDF, Jan 12, 2005
CEC Gross System Electricity Production. (2004) [Online] Available
http://www.energy.ca.gov/electricity/gross_system_power.html, January 10, 2005 Chamberlin, Dr. Charles (2005). Personal Communication. January 10, 2005, Arcata,
Ca. CRC (2005). California Code of Regulations. [Online] Available: http://ccr.oal.ca.gov/,
January 2005. DOE Carbon Dioxide Emissions from the Generation of Electric Power in the United
States (2000) [Online] Available: http://eia.doe.gov/cneaf/electricity/page/co2_report/co2emiss.pdf, January 10, 2005
Echols, Elzy (2005), Engineer, Koch-Otto York Separations Technology, Personal
Communication, January 11, 2005 Energy Information Agency. (2005) [Online] Available http://www.eia.doe.gov. January
11, 2005. EPA, U.S. Environmental Protection Agency. (1995). State Workbook:
Methodologies for Estimating Greenhouse Gas Emissions, Second Edition, EPA230-B-95-001, Washington, D.C.
FCE (2004). FeulCell Energy, Inc. Personal Communication. Foreman, Jonathon (2005). NexTech Materials, Ltd. Personal Communication via e-
mail, December 27,28,2004 & January 3,4,2005.
Evolution Energy Systems™ Page 25 of 27

Geographical locator 2004[online]http://www.esg.montana.edu/cgibin/ gl?124.19040.782124.14240.81808000800124.165940.8004?475,291
Ghezel-Ayagh, Hossein; Leo, Anthony J.; Maru, Hans. (2004). Direct FuelCell/Turbine
Hybrid System for Ultra High Efficiency Power Generation. FuelCell Energy. Danbury, CT.
HTA (2004). Personal Communication. December 17, 2004, Arcata, Ca. Hydrogen Codes and Safety. (2002). Schatz Energy Research Center, Arcata, CA. Jahnke, Fred C., Stephen Torres, and Pinakin Patel. Fuel Cell Energy (FCE). (2004)
Distributed Generation of Hydrogen Using High Temperature Fuel Cells. Presented at NHA’s 15th annual U.S. Hydrogen Conference. April 17, 2004
Kindsfather, G. Humboldt Waste Management Authority (HWMA)(2004). Personal Communication. Klefner, Bob. (2005) Sales Distribution Manager, Air Liquide. Personal
Communication. January 5, 2005, Arcata, Ca. Mezei, Sean (QuestAir Technologies, Inc.) (2004) Personal Communication via e-mail,
December 16, 2004 & telephone, January 10, 2005.
Ministry of Forests. Definitions of Adaptive Management (2000) [Online] Available. http://www.for.gov.bc.ca/hfp/amhome/Amdefs.htm January 3,2005
NHA Fuel Cell/Hydrogen Infrastructure Codes & Standards [Online] Available
http://www.fuelcellstandards.com/ January 09, 2005. North Coast Unified Air Quality Management District (NCUAQMD). Regulation 1 –
Air Quality Control Rules. [Online](available): http://www.ncuaqmd.org/regulations/Reg1.PDF Accessed: December 2004
Padilla, Joe (2005), Engineer, Marley Cooling Technologies, Personal Communication, January 10, 2005
Panora, Robert A. Tecogen Inc. and AmericanDG (2004). Written Comments to the
California Energy Commission’s “Draft Strategic Plan for Distributed Generation.” Pdc Machines, Inc. (2000-2002) [Online] Available
www.pdcmachines.com/diaphragm_compressors.asp , January 07, 2005. Peterson, Jeff (2005), Engineer, Qcon/Trantor Heat Exchanger Representative, Personal
Communication, January 10, 2005 Redwood Coast Tsunami Workgroup Tsunami Hazard Map 4: Eureka to Fields
Landing. (2004) [Online] Available
Evolution Energy Systems™ Page 26 of 27
http://www.humboldt.edu/~geodept/earthquakes/rctwg/hazard/firstpublicdraft4.pdf. January 09, 2005.
RESU Consulting, Hydrogen Power Park Draft Environmental Impact Report (2004).
Report for Environmental Impact and Analysis, Humboldt State University. RSK Associates, Conceptual Design of the Schatz Energy Research Center, Prepared for
Bob Schultz, Director of Physical Services, Humboldt State University. Schoenherr, R.. (2005) Executive Director Keet-TV Empire Public Television. Personal
Communication. January 5, 2005, Arcata, Ca. SCS Energy, (2004). Power and Heat Generation Feasibility Study Cummings Road
Landfill. Prepared for Humboldt Waste Management Authority, Eureka, Ca. Steer, Al. Stationary Source Permit Program Manager - North Coast Unified Air Quality
Management District. (1 December 2004). Personal Communication. Tchobanoglous, George; Thesien, Hilary; Vigil, Samuel. (1993). Integrated Solid Waste Management, Engineering Principles and Management Issues. McGraw-Hill, USA
Tennessee Power Company Environmental Update (EU 2004) [Online] Available
http://home.earthlink.net/~tpco/cc.html (January 10, 2004) UOP. Polybed PSA Systems Gas Extraction and Purification. (1999) [Online] Available
http://www.uop.com/objects/108PolybPSAGasExtPur.pdf , January 9, 2005. Weston, E. (2005). Personal Communication. January 3, 2005, Arcata, Ca. Willis and Disiere Realtors. (2004) Personal Communication. September 30, 2004,
Arcata, Ca.
Evolution Energy Systems™ Page 27 of 27

Appendix

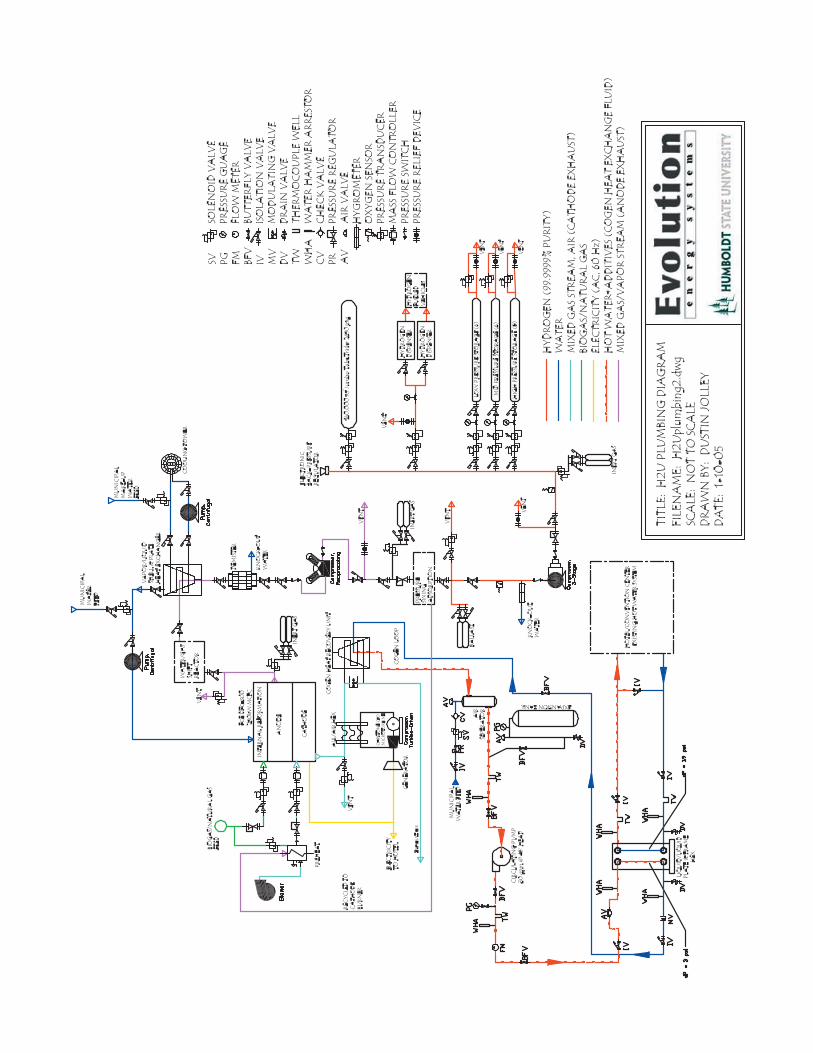


Simulation model sample results
0
10
20
30
40
50
60
70
0 10 20 30 40 50 60 70 80 90100 110 120 130 140 150 160 170 180 190 200
More
Bin (kg-H2)
Freq
uenc
y
.00%
20.00%
40.00%
60.00%
80.00%
100.00%
120.00%
Frequency Cumulative %
Daily average: 38.8 kg/dayDaily Standard Deviation: 26.1 kg/day
Figure 1: Distribution of kg/day delivery to tube trailers for 2019
0
20
40
60
80
100
120
0 5 10 15 20 25 30 35 40 45 50 55 60 65 70 75
vehicles/day
Freq
uenc
y
.00%
20.00%
40.00%
60.00%
80.00%
100.00%
120.00%
Frequency %Cumulative
Ave: 45.4StDev: 7.5max kg/day: 212.6
Figure 2: Distribution of vehicles per day for 2019
0
1
2
3
4
5
6
0 30 60 90120 150 180 210 240 270 300
sec/queu
Freq
uenc
y
.00%
20.00%
40.00%
60.00%
80.00%
100.00%
120.00%
Frequency %Cumulative
Total queued: 28, Total arrivals: 16586Average sec/queu: 120.6
Figure 3: Distribution of queuing times for 2019