$428 uncovers a ota f 29bn dedicate or more ii
TRANSCRIPT

WITH
SOUTHERN
$428.29BN IN ASSETS IFI STRATEGIES
BAROMETER
WEST AFRICAMOVES UP FROM
EASTAFRICA$18.24BN$15.4BN TO
DEDICATED TO IFI
INCREASED $399.45BN DEDICATED
AFRICA
ESG INTEGRATION IN ALL 3 REGIONSTAKES THE LEAD
STILL IN THE LEADWITH
AN
TO IFI
DEDICATED TO 1 OR MORE
UNCOVERS A TOTAL OF
STRATEGIES
REMAINS STABLE $10.6BN
ALLOCATED TO IFI
THE AFRICAN INVESTING FOR IMPACT BAROMETER2 0 1 7 / 5 T H E D I T I O N
RESEARCH TEAM: Mr. Xolisa Dhlamini Associate Professor Stephanie Giamporcaro Miss. Teboho Makhabane

OVERVIEW“The African Investing for Impact (AIFI) Barometer provides a snapshot of the growing investing for impact (IFI) market and strategies which are implemented on the African continent.”
The 2017 edition has maintained the same coverage of Africa’s formal investment markets as last year’s as it strives to objectively depict the spectrum of investments which seek to combine financial returns and positive impact on society and the environment.
The Barometer is compiled from publicly available information sourced from fund manager disclosures on their websites, reports and fund- fact sheets as at 31 July 2017. Additional information is sourced from regulators and industry associations, again where information is publicly available.
WEST AFRICA
= =
RWANDA
KENYA
UGANDATANZANIA
26
10
7
11
18
7
2
2
NIGERIA GHANA
98
69
224
SOUTH AFRICA
EAST AFRICA
NO. OF IFI FUNDSCOVERAGE: NO. OF FUNDS MANAGED FUND MANAGERS
= 55% 29%
SOUTHERN AFRICA
EX-SA
96
103
285
TOTAL
EASTAFRICA
85WESTAFRICA
135 197
=57% = 51%
SOUTHERN AFRICA
338
1493
% IFI funds vs. TOTAL funds
surveyed
SOUTHERN AFRICA
338
1493
234
1028
761
235
206
28
66
26
68
167
92
66
167
1208
761
206
92
106124
430
857857
WHAT WE SURVEYED
THE AFRICAN INVESTING FOR IMPACT BAROMETER | 2017

Integration of ESG data into research and analysis 1
Integration of ESG data into valuation and ratings 1
Integration of ESG data into portfolio construction 1
Integration of ESG into financial performance measurement 1
Presence of ESG objectives into staff KPIs 1
Investor engagement process and/or policy publicly disclosed 1
Votes and engagements on ESG issues reported or disclosed 1
Evident engagement on corporate governance matters 1
Evident engagement on environmental matters 1
Evident engagement on social matters 1
ESG impact/results of the engagement disclosed or reported 1
IFI STRATEGY
IMPACT INVESTMENTInvestment intentionally aimed at generating measurable positive E and/or S impact alongside a financial return.
SUSTAINABILITY THEMED INVESTMENTInvestments made along the themes of environmental sustainability and sustainable development.
INVESTOR ENGAGEMENTAn investment strategy which seeks to influence company behaviour by active ownership through proxy voting, board participation and/or engagement with companies on ESG matters.
Disclosure of ESG screening criteria/policy 1
Disclosure of screening process and rationale 1
Evidence of environmental screening in investment process 1
Evidence of social screening in investment process 1
Reporting 1
Statement of sustainability themes along E & S issues 1
Evidence of investments aligned to E & S themes 1
Showcasing investment cases with measure of impact 1
Identify as impact investors or describe investment process according to impact investment definition 1
Articulation of E & S impact objectives 1
Visibility of the impact projects 1
Reporting on impact 1
ESG INTEGRATIONThe systematic integration of Environmental, Social and Governance (ESG) factors into investment analysis, valuation and decision-making based on appropriate research sources and metrics.
SCREENINGInclusion or exclusion of investments based on ESG or ethical screening. The screening may be positive, negative, norms-based or best-in-sector screening.
INDICATORS USED TO ASSESS IMPLEMENTATION
POINTS
THE AFRICAN INVESTING FOR IMPACT BAROMETER | 2017
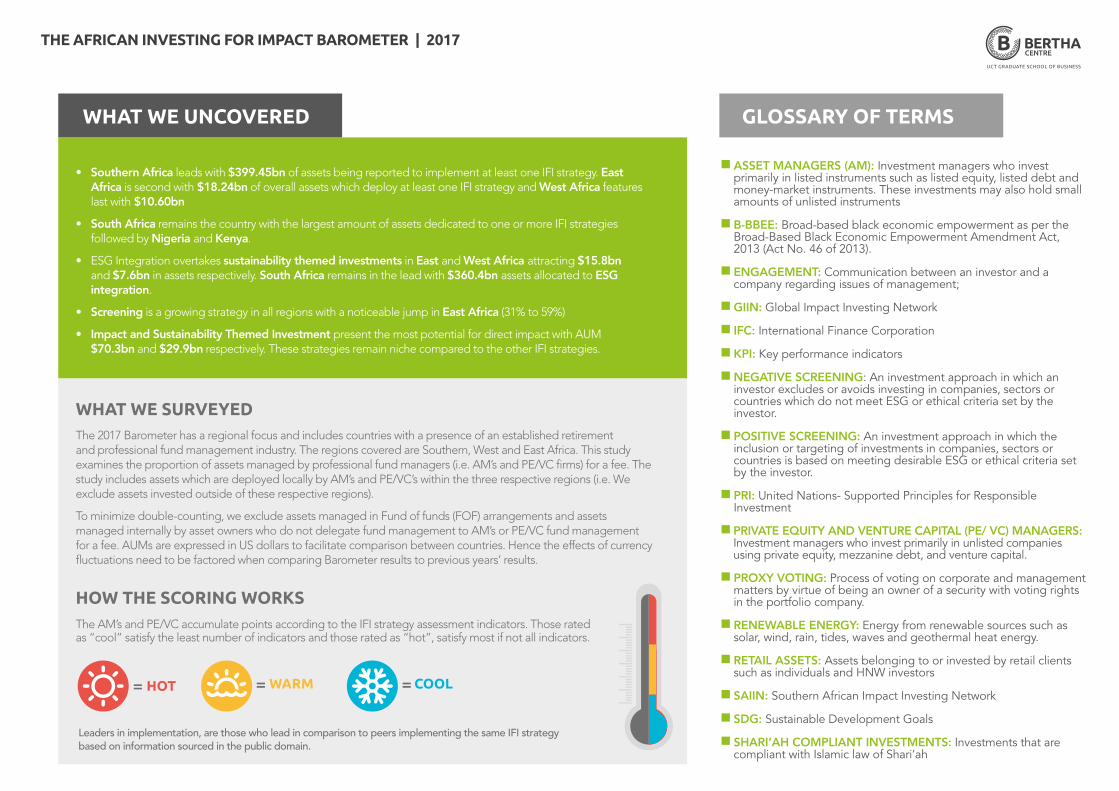
Leaders in implementation, are those who lead in comparison to peers implementing the same IFI strategy based on information sourced in the public domain.
The 2017 Barometer has a regional focus and includes countries with a presence of an established retirement and professional fund management industry. The regions covered are Southern, West and East Africa. This study examines the proportion of assets managed by professional fund managers (i.e. AM’s and PE/VC firms) for a fee. The study includes assets which are deployed locally by AM’s and PE/VC’s within the three respective regions (i.e. We exclude assets invested outside of these respective regions).
To minimize double-counting, we exclude assets managed in Fund of funds (FOF) arrangements and assets managed internally by asset owners who do not delegate fund management to AM’s or PE/VC fund management for a fee. AUMs are expressed in US dollars to facilitate comparison between countries. Hence the effects of currency fluctuations need to be factored when comparing Barometer results to previous years’ results.
The AM’s and PE/VC accumulate points according to the IFI strategy assessment indicators. Those rated as “cool” satisfy the least number of indicators and those rated as “hot”, satisfy most if not all indicators.
HOW THE SCORING WORKS
WARM COOLHOT
WHAT WE SURVEYED
• Southern Africa leads with $399.45bn of assets being reported to implement at least one IFI strategy. East Africa is second with $18.24bn of overall assets which deploy at least one IFI strategy and West Africa features last with $10.60bn
• South Africa remains the country with the largest amount of assets dedicated to one or more IFI strategies followed by Nigeria and Kenya.
• ESG Integration overtakes sustainability themed investments in East and West Africa attracting $15.8bn and $7.6bn in assets respectively. South Africa remains in the lead with $360.4bn assets allocated to ESG integration.
• Screening is a growing strategy in all regions with a noticeable jump in East Africa (31% to 59%)
• Impact and Sustainability Themed Investment present the most potential for direct impact with AUM $70.3bn and $29.9bn respectively. These strategies remain niche compared to the other IFI strategies.
n ASSET MANAGERS (AM): Investment managers who invest primarily in listed instruments such as listed equity, listed debt and money-market instruments. These investments may also hold small amounts of unlisted instruments
n B-BBEE: Broad-based black economic empowerment as per the Broad-Based Black Economic Empowerment Amendment Act, 2013 (Act No. 46 of 2013).
n ENGAGEMENT: Communication between an investor and a company regarding issues of management;
n GIIN: Global Impact Investing Network
n IFC: International Finance Corporation
n KPI: Key performance indicators
n NEGATIVE SCREENING: An investment approach in which an investor excludes or avoids investing in companies, sectors or countries which do not meet ESG or ethical criteria set by the investor.
n POSITIVE SCREENING: An investment approach in which the inclusion or targeting of investments in companies, sectors or countries is based on meeting desirable ESG or ethical criteria set by the investor.
n PRI: United Nations- Supported Principles for Responsible Investment
n PRIVATE EQUITY AND VENTURE CAPITAL (PE/ VC) MANAGERS: Investment managers who invest primarily in unlisted companies using private equity, mezzanine debt, and venture capital.
n PROXY VOTING: Process of voting on corporate and management matters by virtue of being an owner of a security with voting rights in the portfolio company.
n RENEWABLE ENERGY: Energy from renewable sources such as solar, wind, rain, tides, waves and geothermal heat energy.
n RETAIL ASSETS: Assets belonging to or invested by retail clients such as individuals and HNW investors
n SAIIN: Southern African Impact Investing Network
n SDG: Sustainable Development Goals
n SHARI’AH COMPLIANT INVESTMENTS: Investments that are compliant with Islamic law of Shari’ah
GLOSSARY OF TERMSWHAT WE UNCOVERED
THE AFRICAN INVESTING FOR IMPACT BAROMETER | 2017

20 %
16.
4 %
15.5
%
13.6
%
10.9
%
SME
’S
AG
RIC
ULT
UR
E
FIN
AN
CIA
L SE
RV
ICE
S
EN
ER
GY
HE
ALT
H
East Africa
BAROMETER RESULTS
LEADERS IN IMPLEMENTATION
ONE ACRE FUND
PHATISA
FONERWA $0.09bn
$0.29bn
$0.32bn
ASSETS (USD)BILLIONS
LEADERS IN IMPLEMENTATION
STANLIB KENYA
THE ABRAAJ GROUP
ACTIS
ASSETS (USD)BILLIONS
$1.37bn
$1.16bn
$1.20bn
LEADERS IN IMPLEMENTATION
GROFIN
PHATISA
FONERWA
ASSETS (USD)BILLIONS
$0.29bn
$0.35bn
$0.09bn
LEADERS IN IMPLEMENTATION
ACTIS
THE ABRAAJ GROUP
EMERGING CAPITAL PARTNERS
ASSETS (USD)BILLIONS
$1.37bn
$0.90bn
$1.20bn
$0.03bn
ASSETS (USD)BILLIONS
$0.10bn
$0.35bn
LEADERS IN IMPLEMENTATION
ACUMEN
GROFIN
AGRIVIE
33.3% 35.4% 31.3%14.3% 9.5% 76.2% 8.3% 4.2% 87.5% 29% 61.3% 9.7%
ESG INTEGRATION: US$ 15.85bn
SCREENING:US$ 13.29bn
IMPACT INVESTMENT: US$ 9.66bn
INVESTOR ENGAGEMENT: US$ 8.25bn
13.3% 0.0% 86.7%
Top 5 investment themes among Impact & Sustainability Themed Investors
SUSTAINABILITY THEMED INVESTMENT:
US$ 13.04bn
NB: Organisations surveyed can implement more than one IFI strategy to the same pool of assets.
Investing for impact continues to be dominated by international and local PE/VCs
AM’s vs PE/VC’s: Size of assets managed per IFI strategy
SCREENINGESG INTEGRATION
INVESTOR ENGAGEMENT
IMPACT INVESTMENT
SUSTAINABILITY THEMED
INVESTMENT
$14.41 $1.44 $7.01 $1.24 $8.25 $13.09 $13.29 $13.04$13.03 $9.65 $9.66$0.2$15.85 $0.01 $0.01
5 2116 4 1511 2 2422 1 4746 1 3130
KENYA RWANDA UGANDA TANZANIA
TOTA
L
PE
/ V
C
AM
TOTA
L
PE
/ V
C
AM
TOTA
L
PE
/ V
C
AM
TOTA
L
PE
/ V
C
AM
TOTA
L
PE
/ V
C
AM
Number of Impact Investment Funds per country within the regions
UGANDARWANDATANZANIAKENYA
124
35
KENYA RWANDA UGANDA TANZANIA
42.9%
59.0%
36.6%
70.3%
57.9%
Imp
act
Inve
smen
t
Scre
enin
g
Inve
sto
r En
gag
emen
t
ESG
Inte
gra
tio
n
Sust
aina
bili
ty T
hem
ed In
vest
men
t
Number of new fund managers entering the impact investing space remains stable but noticeable increase in AUM.
Weight of IFI strategiesas % of total assets
EXPRESSED AS $ BILLION
THE AFRICAN INVESTING FOR IMPACT BAROMETER | 2017
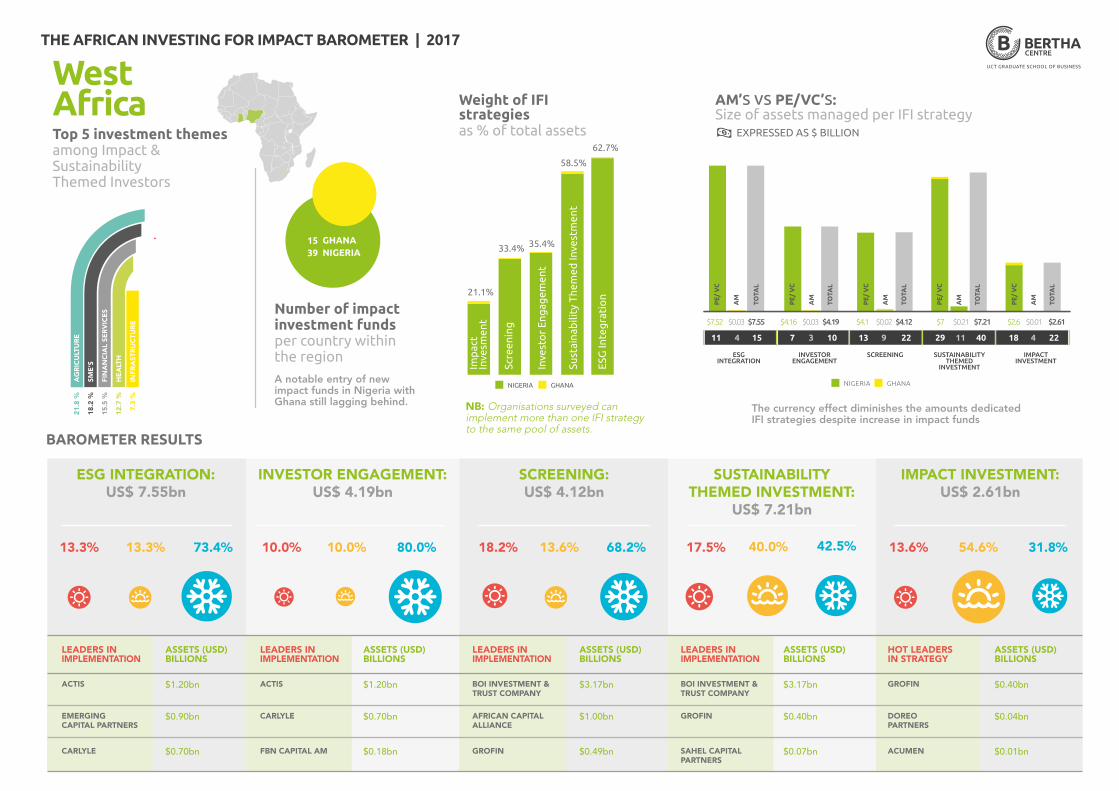
West AfricaTop 5 investment themes among Impact & Sustainability Themed Investors
IMPACT INVESTMENT: US$ 2.61bn
13.6% 54.6% 31.8%
$0.40bn
ASSETS (USD)BILLIONS
$0.04bn
$0.01bn
HOT LEADERS IN STRATEGY
GROFIN
DOREO PARTNERS
ACUMEN
SCREENING: US$ 4.12bn
18.2% 13.6% 68.2%
LEADERS IN IMPLEMENTATION
BOI INVESTMENT & TRUST COMPANY
BOI INVESTMENT & TRUST COMPANY
AFRICAN CAPITAL ALLIANCE
GROFIN SAHEL CAPITAL PARTNERS
ASSETS (USD)BILLIONS
$3.17bn
$1.00bn
$0.49bn
INVESTOR ENGAGEMENT: US$ 4.19bn
10.0% 10.0% 80.0%
LEADERS IN IMPLEMENTATION
ACTIS
CARLYLE
FBN CAPITAL AM
ASSETS (USD)BILLIONS
$1.20bn
$0.70bn
$0.18bn
ESG INTEGRATION: US$ 7.55bn
13.3% 13.3% 73.4%
LEADERS IN IMPLEMENTATION
ASSETS (USD)BILLIONS
ACTIS $1.20bn
EMERGING CAPITAL PARTNERS
$0.90bn
$0.70bnCARLYLE
SUSTAINABILITY THEMED INVESTMENT:
US$ 7.21bn
17.5% 40.0% 42.5%
LEADERS IN IMPLEMENTATION
GROFIN
ASSETS (USD)BILLIONS
$0.40bn
$3.17bn
$0.07bn
BAROMETER RESULTS
The currency effect diminishes the amounts dedicated IFI strategies despite increase in impact funds
$7.52 $0.03 $4.16 $0.03 $4.19 $4.1 $4.12 $7.21$7 $2.6 $2.61$0.02 $0.21 $0.01$7.55
NIGERIA GHANA
SCREENINGESG INTEGRATION
INVESTOR ENGAGEMENT
IMPACT INVESTMENT
SUSTAINABILITY THEMED
INVESTMENT
4 1511 3 107 9 2213 11 4029 4 2218
TOTA
L
PE
/ V
C
AM
TOTA
L
PE
/ V
C
AM
TOTA
L
PE
/ V
C
AM
TOTA
L
PE
/ V
C
AM
TOTA
L
PE
/ V
C
AM
Number of impact investment funds per country within the regionA notable entry of new impact funds in Nigeria with Ghana still lagging behind.
GHANANIGERIA
1539
NIGERIA GHANA
33.4%
21.1%
35.4%
58.5%
Imp
act
Inve
smen
t
Scre
enin
g
Inve
sto
r En
gag
emen
t
62.7%
ESG
Inte
gra
tio
n
Sust
aina
bili
ty T
hem
ed In
vest
men
t
NB: Organisations surveyed can implement more than one IFI strategy to the same pool of assets.
Weight of IFI strategies as % of total assets EXPRESSED AS $ BILLION
21.8
%
18.2
%
15.5
%
12.7
%
7.3
%
AG
RIC
ULT
UR
E
SME
’S
FIN
AN
CIA
L SE
RV
ICE
S
HE
ALT
H
INFR
AST
RU
CTU
RE
AM’s vs PE/VC’s: Size of assets managed per IFI strategy
THE AFRICAN INVESTING FOR IMPACT BAROMETER | 2017
33.6
%
30.0
%
21.8
%
20.9
%
18.2
%
SME
’S
TRA
NSF
OR
MA
TIO
N
INFR
AST
RU
CTU
RE
HE
ALT
H
EN
ER
GY
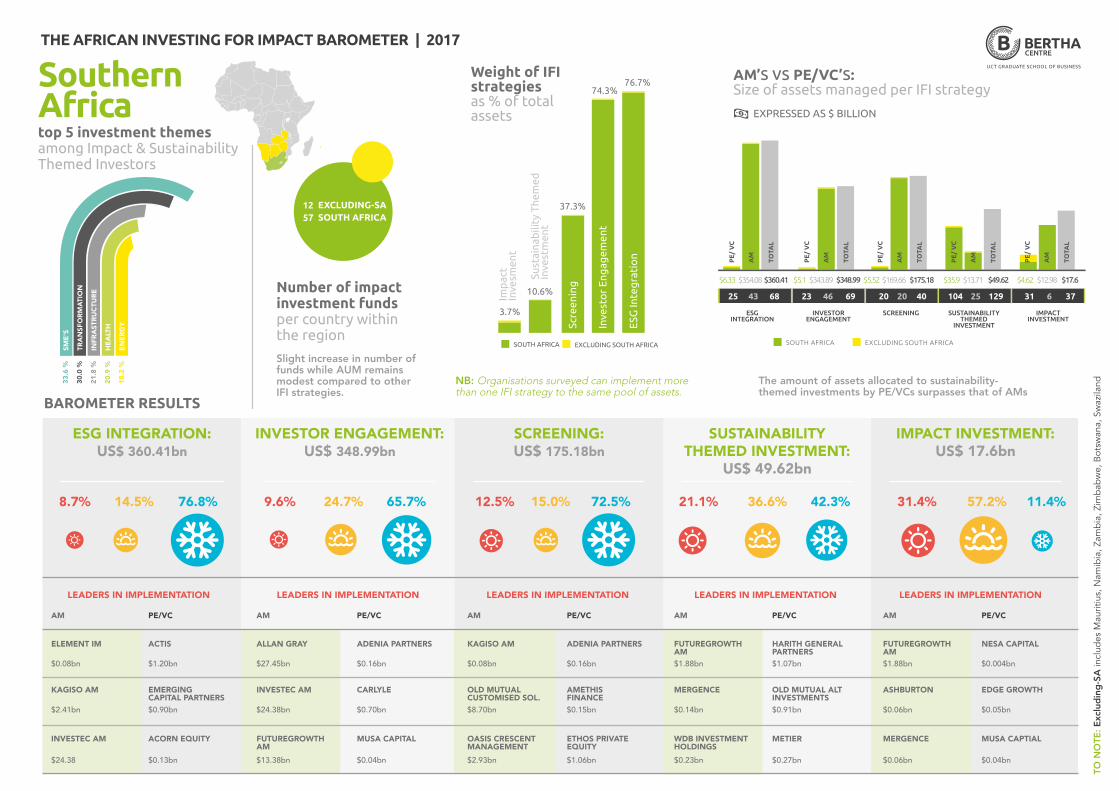
Southern Africa
The amount of assets allocated to sustainability-themed investments by PE/VCs surpasses that of AMs
TO N
OTE
: Exc
lud
ing
-SA
incl
udes
Mau
ritiu
s, N
amib
ia, Z
amb
ia, Z
imb
abw
e, B
otsw
ana,
Sw
azila
nd
Number of impact investment funds per country within the region
top 5 investment themes among Impact & Sustainability Themed Investors
Slight increase in number of funds while AUM remains modest compared to other IFI strategies.
AM’s vs PE/VC’s: Size of assets managed per IFI strategy
$6.33 $354.08 $5.1 $343.89 $348.99 $175.18 $49.62 $17.6$169.66 $13.71 $12.98$360.41 $5.52 $4.62$35.9
SOUTH AFRICA EXCLUDING SOUTH AFRICA
SCREENINGESG INTEGRATION
INVESTOR ENGAGEMENT
IMPACT INVESTMENT
SUSTAINABILITY THEMED
INVESTMENT
43 6825 46 6923 20 4020 25 129104 6 3731
TOTA
L
PE
/ V
C
AM
TOTA
L
PE
/ V
C
AM
TOTA
L
PE
/ V
C
AM
TOTA
L
PE
/ V
C
AM
TOTA
L
PE
/ V
C
AM
EXCLUDING-SASOUTH AFRICA
1257
SOUTH AFRICA EXCLUDING SOUTH AFRICA
3.7%
10.6%
74.3%76.7%
37.3%
Imp
act
Inve
smen
t
Sust
aina
bili
ty T
hem
ed
Inve
stm
ent
Scre
enin
g
Inve
sto
r En
gag
emen
t
ESG
Inte
gra
tio
n
NB: Organisations surveyed can implement more than one IFI strategy to the same pool of assets.
Weight of IFI strategies as % of total assets EXPRESSED AS $ BILLION
SCREENING: US$ 175.18bn
SUSTAINABILITY THEMED INVESTMENT:
US$ 49.62bn
IMPACT INVESTMENT: US$ 17.6bn
12.5% 15.0% 72.5% 21.1% 36.6% 42.3% 31.4% 57.2% 11.4%
INVESTOR ENGAGEMENT: US$ 348.99bn
9.6% 24.7% 65.7%
$27.45bn
INVESTEC AM
$24.38bn
FUTUREGROWTH AM
$13.38bn
ALLAN GRAY ADENIA PARTNERS
CARLYLE
$0.70bn
MUSA CAPITAL
$0.04bn
$0.16bn
FUTUREGROWTH AM
$0.14bn
MERGENCE
WDB INVESTMENT HOLDINGS
$0.23bn
$1.88bn
HARITH GENERAL PARTNERS
OLD MUTUAL ALT INVESTMENTS$0.91bn
METIER
$0.27bn
$1.07bn
FUTUREGROWTHAM
ASHBURTON
$0.06bn
MERGENCE
$0.06bn
$1.88bn $0.004bn
$0.05bn
EDGE GROWTH
MUSA CAPTIAL
$0.04bn
NESA CAPITAL
OLD MUTUAL CUSTOMISED SOL.
OASIS CRESCENTMANAGEMENT
$2.93bn
$0.08bn
KAGISO AM
$8.70bn $0.15bn
ETHOS PRIVATE EQUITY
$1.06bn
$0.16bn
ADENIA PARTNERS
AMETHIS FINANCE
ESG INTEGRATION: US$ 360.41bn
8.7% 14.5% 76.8%
$0.08bn
$2.41bn
INVESTEC AM
$24.38
ELEMENT IM
KAGISO AM
ACTIS
$0.90bn
$0.13bn
ACORN EQUITY
AM PE/VC AM PE/VC AM PE/VCAM PE/VCAM PE/VC
$1.20bn
EMERGING CAPITAL PARTNERS
BAROMETER RESULTS
LEADERS IN IMPLEMENTATION LEADERS IN IMPLEMENTATION LEADERS IN IMPLEMENTATION LEADERS IN IMPLEMENTATION LEADERS IN IMPLEMENTATION
THE AFRICAN INVESTING FOR IMPACT BAROMETER | 2017
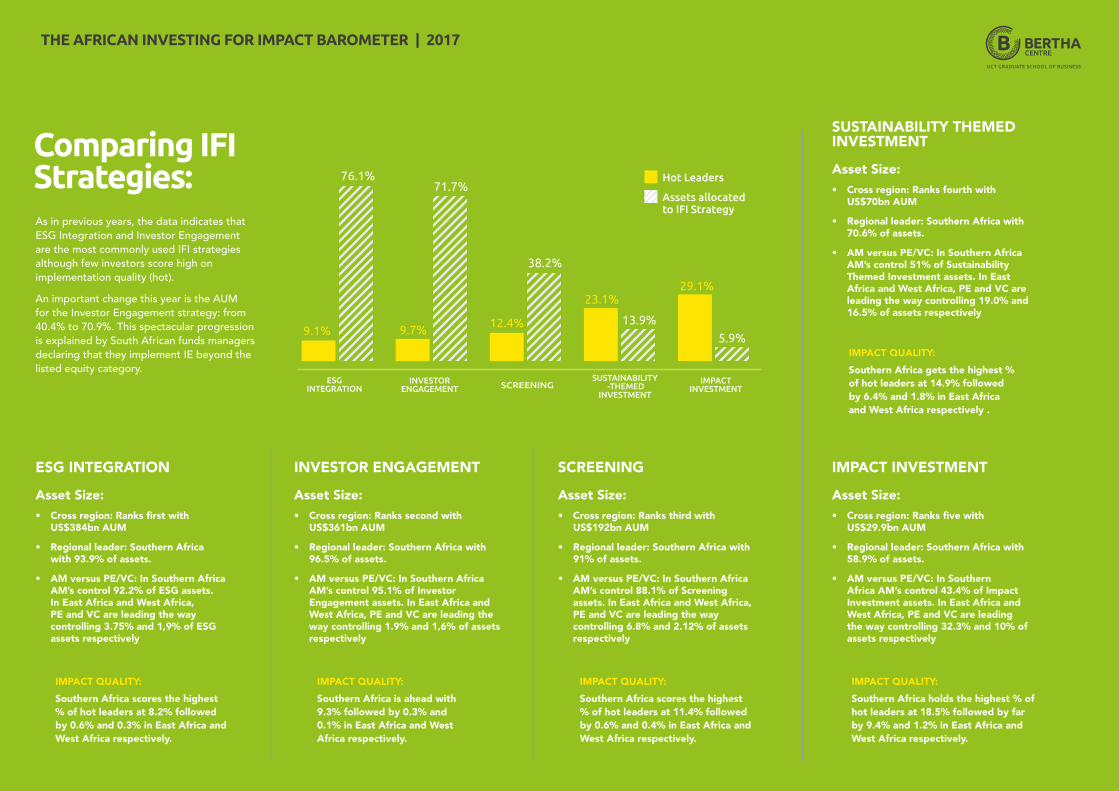
Comparing IFI Strategies:
ESG INTEGRATION
Asset Size:• Cross region: Ranks first with
US$384bn AUM
• Regional leader: Southern Africa with 93.9% of assets.
• AM versus PE/VC: In Southern Africa AM’s control 92.2% of ESG assets. In East Africa and West Africa, PE and VC are leading the way controlling 3.75% and 1,9% of ESG assets respectively
IMPACT QUALITY:
Southern Africa scores the highest % of hot leaders at 8.2% followed by 0.6% and 0.3% in East Africa and West Africa respectively.
SCREENING
Asset Size:• Cross region: Ranks third with
US$192bn AUM
• Regional leader: Southern Africa with 91% of assets.
• AM versus PE/VC: In Southern Africa AM’s control 88.1% of Screening assets. In East Africa and West Africa, PE and VC are leading the way controlling 6.8% and 2.12% of assets respectively
IMPACT INVESTMENT
Asset Size:• Cross region: Ranks five with
US$29.9bn AUM
• Regional leader: Southern Africa with 58.9% of assets.
• AM versus PE/VC: In Southern Africa AM’s control 43.4% of Impact Investment assets. In East Africa and West Africa, PE and VC are leading the way controlling 32.3% and 10% of assets respectively
IMPACT QUALITY:
Southern Africa scores the highest % of hot leaders at 11.4% followed by 0.6% and 0.4% in East Africa and West Africa respectively.
INVESTOR ENGAGEMENT
Asset Size: • Cross region: Ranks second with
US$361bn AUM
• Regional leader: Southern Africa with 96.5% of assets.
• AM versus PE/VC: In Southern Africa AM’s control 95.1% of Investor Engagement assets. In East Africa and West Africa, PE and VC are leading the way controlling 1.9% and 1,6% of assets respectively
IMPACT QUALITY:
Southern Africa is ahead with 9.3% followed by 0.3% and 0.1% in East Africa and West Africa respectively.
IMPACT QUALITY:
Southern Africa holds the highest % of hot leaders at 18.5% followed by far by 9.4% and 1.2% in East Africa and West Africa respectively.
IMPACT QUALITY:
Southern Africa gets the highest % of hot leaders at 14.9% followed by 6.4% and 1.8% in East Africa and West Africa respectively .
SUSTAINABILITY THEMED INVESTMENT
Asset Size:• Cross region: Ranks fourth with
US$70bn AUM
• Regional leader: Southern Africa with 70.6% of assets.
• AM versus PE/VC: In Southern Africa AM’s control 51% of Sustainability Themed Investment assets. In East Africa and West Africa, PE and VC are leading the way controlling 19.0% and 16.5% of assets respectively
ESG INTEGRATION
23.1%
SCREENING
12.4%
38.2%
13.9%
IMPACTINVESTMENT
29.1%
5.9%
SUSTAINABILITY -THEMED
INVESTMENT
Hot Leaders
Assets allocated to IFI Strategy
9.1%
76.1%
INVESTORENGAGEMENT
9.7%
71.7%
As in previous years, the data indicates that ESG Integration and Investor Engagement are the most commonly used IFI strategies although few investors score high on implementation quality (hot).
An important change this year is the AUM for the Investor Engagement strategy: from 40.4% to 70.9%. This spectacular progression is explained by South African funds managers declaring that they implement IE beyond the listed equity category.
THE AFRICAN INVESTING FOR IMPACT BAROMETER | 2017

ACKNOWLEDGEMENTS:Director of publication: Associate Professor Stephanie Giamporcaro
Researchers: Mr. Xolisa Dhlamini (Bertha Scholar) and Miss. Teboho Makhabane (Research Assistant)
We thank the Innovative Finance initiative, Dr Francois Bonnici and Mrs. Olwen Manuel from the Bertha Centre for Social Innovation and Entrepreneurship, a specialised unit at the UCT Graduate School of Business, for their support and contribution.
We would also like to thank the Flanders Government for their generous support that made this report and research possible.
8 Portswood Road, Green Point, Cape Town, South Africa | +27 (0) 21 406 1524
[email protected] | www.gsb.uct.ac.za/berthacentre
Key Insights
01 ESG INTEGRATED ACROSS ALL ASSETS?
ESG integration is the leading IFI strategy in the three regions covered. Meanwhile many AMs and PE/VCs still provide minimum communication on what their ESG integration entails. AIFIB’s position remains that if AMs and PEs declare that they apply ESG integration across all assets, their claims are to be duly considered and accounted for. The AUM amount reported in ESG integration, however, appears overstated and not reflecting what happens in practice.
The Barometer scoring of this strategy reveals that implementation needs substantial improvement. Three areas of improvement are proposed for AMs and PE/VCs implementing ESG integration: Firstly demonstrate how human and knowledge resources are actually dedicated to implementing ESG integration (e.g. communicate whether there are ESG analysts in the teams, how ESG analysts work with portfolio managers to systematically integrate ESG, and provide transparent, quality information on how ESG integration influences funds’ performance); secondly demonstrate how ESG integration is applied across all geographical areas of investment; thirdly demonstrate the implementation of ESG integration across a wider range of asset classes beyond equity such as fixed income instruments as advocated recently by the Principles for Responsible Investment Initiative (PRI).
02 INVESTOR ENGAGEMENT: THE NEXT FRONTIERS
Investor engagement has the second largest allocation of assets. It’s dominated by mainstream AMs who manage significantly larger portions of assets relative to their PE/VC counterparts. There has been a steady improvement in disclosure of engagement activities by AMs, particularly those in Southern Africa.
This disclosure of engagements, however, has largely been in relation to listed equity; predominantly through disclosure of proxy voting activities. The disclosures remain poor at demonstrating the impact of engagement on society, the environment or corporate behaviour. This year, large South African AMs such as Allan Gray, Old Mutual Investment Group declared that their investor engagement on ESG issues was conducted across all asset classes, including fixed income.
Whilst some AMs are moving to the next frontier of engaging bond issuers on ESG issues there is a need for this practice to be pervasive amongst African AMs. It is encouraging that the PRI continues to guide investors in engaging with both private and public bond issuers on ESG issues. The same can be said for PE/VCs surveyed in the AIFIB who were found to disclose their philosophies and approaches to investor engagement yet disclose engagement activities and resultant outcomes inconsistently.
03 SCREENING 2.0. MOVING BEYOND NEGATIVE SCREENING
For the past 3 past years, screening as a strategy did not particularly stand out for innovative product development or practices. Fund managers have been found to engage largely in negative screening with Islamic (Shari’ah-compliant) funds dominating in product offerings.
There have been increased efforts to grow Islamic Finance across East and West Africa, evident in the recent development and listing of 5 sovereign Islamic bonds (Sukuks) in 2016. A recent and notable issuance in West Africa is Nigeria’s N100 Billion Sukuk which was oversubscribed by institutional and retail investors.
The funds raised have been channelled to infrastructure developmental projects in Nigeria. This presents opportunities for fund managers to create innovate investment products beyond negative screening of investee companies. Opportunities also exist for fund managers to develop Best-in-class screening products for the retail market. Old Mutual Plc has recently progressed on this front by partnering with MSCI to develop the Responsible Equity Index Fund launched in April 2016, but for now, this is only available to institutional investors. It remains to be seen whether other AMs will leapfrog to develop Best in class listed equity and listed fixed income investment products for both the institutional and retail market.

Key Insights
ACKNOWLEDGEMENTS:Director of publication: Associate Professor Stephanie Giamporcaro
Researchers: Mr. Xolisa Dhlamini (Bertha Scholar) and Miss. Teboho Makhabane (Research Assistant)
We thank the Innovative Finance initiative, Dr Francois Bonnici and Mrs. Olwen Manuel from the Bertha Centre for Social Innovation and Entrepreneurship, a specialised unit at the UCT Graduate School of Business, for their support and contribution.
We would also like to thank the Flanders Government for their generous support that made this report and research possible.
8 Portswood Road, Green Point, Cape Town, South Africa | +27 (0) 21 406 1524
[email protected] | www.gsb.uct.ac.za/berthacentre
06 VENTURE CAPITAL INVESTMENTS: POTENTIAL IFI VEHICLES FOR
HNWIS
Policy makers in South Africa, Kenya and Nigeria have taken strides to encourage investments in SMEs through registered venture capital companies (VCCs). With investments in SMEs being among the top 5 impact investment themes, there is potential to attract high net worth individuals (HNWI) to allocate more capital towards investing for impact.
South Africa’s Section 12 J of the Income Tax Act, Kenya’s First Schedule of the Income Tax Act and Nigeria’s Venture Capital (Incentives) Act incentivise HNWIs and other institutional investors to invest in SME’s through registered VCCs with impact potential.Nesa Capital, a South African firm, is an example of a leading VCC with an impact investment offering for investors.
Other VCC players in East and West Africa have the potential to capitalise on these developments by catering to the niche market of HNWI who would like to minimise their tax liabilities whilst maximising the positive social or environmental outcomes that their investments could generate.
04 SUSTAINABILITY THEMED INVESTORS: CRUCIAL PLAYERS AS
AFRICAN NATIONS EMBRACE SDGS
The allocation of assets to sustainability themed investments is growing but remains the second lowest at $70 bn amongst the 5 IFI strategies. The top investment themes were found to be investments in Agriculture, SME’s, Health, Energy, infrastructure and Inclusive Finance which are aligned to some of the 17 Sustainable Development Goals (SDGs). Policy makers in the countries covered by the Barometer are embracing the global movement to create sustainable and prosperous nations through the achievement of the SDGs.
Countries such as Uganda, Botswana, Kenya, Nigeria, Zimbabwe and Namibia are disclosing their progress towards achieving SDGs goals under the political guidance of the United Nations. Uganda, for instance, is reported to be the first country in the world to mainstream SDGs into its national development plan whilst Zimbabwe has prioritised 10 SDGs for its national development agenda.
The willingness of African policy makers towards achieving the SDGs presents an opportunity for institutional investors to channel more assets towards impact in Africa. It also creates opportunities for AMs and PE/VCs to create innovative investment products to enable institutional and retail investors to invest towards the SDGs. The stage is being set for these crucial players in the financial markets to invest for impact. Will they rise to the occasion?
05 IMPACT INVESTING MEASUREMENT
Impact measurement is considered a hallmark for impact investors to demonstrate their performance against their intention to generate financial returns and social or environmental impact.
The lack of consensus regarding impact measurement best practice remains a global challenge and this is evident in the variety of ways in which impact investors covered in the Barometer are reporting impact. Acumen, Grassroots Business Fund, One Acre Fund and Grofin, for instance, are some hot leaders investing in East and West Africa who quantify impact, disclose their impact measurement approaches publicly, report on the impact output and report impact outcomes of their investments.
These hot leaders, however, are still a minority. Whilst the lack of global consensus on standard impact measurement is considered a challenge, it also presents a perfect opportunity for the impact investors to pioneer best practice in impact measurement.