42 chapter two – tools for examining consensus …
TRANSCRIPT

42 CHAPTER TWO – Tools for Examining Consensus Development
Problem Solving/Response to Intervention Evaluation Tool Technical Assistance Manual
Beliefs SurveyDescription & Purpose
Theoretical Background
The Beliefs Survey is a self-report measure that was developed by Project staff to assess educators’ beliefs about Problem-Solving/Response to Intervention (PS/RtI) practices. Research suggests that educators’ beliefs about student learning and in-structional strategies impact whether they are willing to implement new practices (Fang, 1996). Thus, what educators believe about PS/RtI practices should theo-retically be related to implementation of the PS/RtI model. Foundational beliefs espoused by proponents of the PS/RtI model include but are not limited to:
Every student is everybody’s responsibility, • PS/RtI is a General Education initiative, not Special Education, • Improving the effectiveness of core instruction is basic to the PS/RtI pro-• cess, No Child Left Behind really means “NO,” • Assessment data should both inform and evaluate the impact of instruction, • Policies must be consistent with beliefs, • Beliefs must be supported by research, and • Focus on barriers to learning should be on alterable variables (Batsche et al., • 2005).
Description
The Beliefs Survey contains items that measure educators’ beliefs about service delivery regarding assessment practices, core instruction, intervention, and special education eligibility determination. The instrument consists of 27 items divided into two parts. Part I (Items 1-5) asks for background information (education and work-related) on the respondent. Part II contains items (Items 6-27) that take the from of belief statements to which respondents are asked to rate their extent of agreement/disagreement using the following response scale: 1= Strongly Dis-agree; 2 = Disagree; 3 = Neutral; 4 = Agree; 5 = Strongly Agree.
Purpose
The Beliefs Survey is intended to be used to inform consensus development in two primary ways. One purpose is to assess the impact of professional development ef-forts on educator beliefs about PS/RtI practices. The second purpose is to identify commonly held beliefs among educators that will likely help facilitate or hinder implementation efforts. Specifically, items on the Beliefs Survey provide ongoing

Beliefs Survey 43
Problem Solving/Response to Intervention Evaluation Tool Technical Assistance Manual
information on educator beliefs regarding the academic abilities and performance of students with disabilities, data-based decision making, and the functions of core and supplemental instruction. Results from these domains can be used as indica-tors of the extent to which educators have the beliefs necessary for implementation of PS/RtI practices to occur.
Intended Audience
Who Should Complete the Beliefs Survey?
School-Based Leadership Team (SBLT) members complete the Beliefs Survey in-dividually. SBLTs are comprised of approximately six to eight staff members se-lected to take a leadership role in facilitating PS/RtI implementation in a school. Staff included on the SBLT should have the following roles represented: admin-istration, general education teachers, student services, special education teachers, and content specialists (e.g., reading, math, behavior). SBLT members should re-ceive training on the PS/RtI model including strategies for facilitating implementa-tion (i.e., systems change principles and strategies referred to in the Introduction). Individuals on the team also should adopt roles and responsibilities to ensure ef-ficient and productive planning and problem-solving meetings. Important respon-sibilities include a facilitator, time-keeper, data coach, and recorder, in addition to providing expertise in the particular content areas or disciplines listed above.
All instructional staff not represented on the SBLT also complete the instrument. Common instructional staff includes general education teachers, special education teachers, and those that assist with delivering curriculum and interventions to stu-dents (e.g., student services personnel, reading specialists, interventionists).
Who Should Use the Results for Decision-Making?
The SBLTs who complete the Beliefs Survey should receive the results for their school. District-Based Leadership Team (DBLT) members also should receive the results for the district’s schools individually as well as aggregated at the district level. Members of the DBLT provide leadership to schools implementing PS/RtI practices. Examples of leadership provided by DBLT members include facilitating the creation of policies and procedures to support implementation, providing ac-cess to professional development targeting the knowledge and skills of educators in the district, and meeting with schools to review implementation and student outcomes. Staff included on the team mirror the SBLT in terms of representation of disciplines and roles and responsibilities.
Results of the Beliefs Survey also should be shared with instructional staff in the buildings that complete the instrument. Sharing the results with instructional staff can be used as a strategy for facilitating discussions about how the school should teach students, obtain input from staff regarding the school’s PS/RtI initiative, and facilitate consensus building regarding the rationale for implementing PS/RtI prac-tices.
Facilitator: Responsibilities of facilitators tend to include preparation for meetings, ensuring participation and involvement of team members, encouraging team members to reach consensus regarding decisions being made, and keeping the conversations focused on the task being discussed (e.g., problem-solving student performance, planning for professional development).
Timekeeper: Timekeepers are responsible for providing periodic updates to team members regarding the amount of time left to complete a given task or discussion during meetings.
Data Coach: Data coaches provide assistance with interpreting data and using it to inform decisions.
Recorder: Recorders are responsible for taking notes for the purpose of capturing the important discussions and outcomes of meetings.

44 CHAPTER TWO – Tools for Examining Consensus Development
Problem Solving/Response to Intervention Evaluation Tool Technical Assistance Manual
Directions for Administration
Methods of Administration
The Beliefs Survey can be administered in venues such as trainings, staff meet-ings, or grade-level meetings. The survey also may be administered through dis-semination in staff mailboxes with directions for returning the survey. Finally, the instrument can be administered electronically through district supported or com-mercially available technology resources (e.g., SurveyMonkey). Regardless of the method chosen to administer the surveys, every effort should be made to ensure high return rates from SBLT and staff members to ensure that the information gathered adequately reflects the beliefs of the school. Following the procedures outlined below for providing directions to educators completing the survey is sug-gested regardless of the method used.
Directions to Educators Completing the Survey
Prior to administration, it is highly recommended that the building principal ex-plain the reason that the Beliefs Survey is being administered, and why the infor-mation obtained is important to the school and district. The Florida PS/RtI Project staff have found that having principals explain the importance of collecting these data can lead to more complete and accurate information returned. After the Beliefs Survey is introduced by the school’s principal, individuals responsible for admin-istration (e.g., district-based PS/RtI Coaches, RtI Coordinators, DBLT members) should provide staff with a description of the survey, the purpose of collecting the data, how the survey data will be used, and specific instructions for completing the instrument. Specific instructions for completing the survey will vary based on the method used for administration. Regardless of the method selected, it should be clarified that the Beliefs Survey should be completed individually. It is also recom-mended that individual responses remain anonymous and that opportunities to ask questions be provided.
Frequency of Use
When determining how often educators should complete the Beliefs Survey, it is important to consider the resources available within schools and districts so that plans for data collection are adequately supported. Important considerations in-clude the time needed for completion of the instrument; the time required to enter, analyze, graph, and disseminate data; the personnel available to support data col-lection, and other data collection activities in which SBLT members and school staff are required to participate. In other words, decisions about how often to col-lect Beliefs Survey data should be made based on the capacity to administer, ana-lyze, and use the information to inform plans to scale-up PS/RtI implementation.
Although schools and districts will need to make adjustments given available re-sources, general recommendations for completing the Beliefs Survey are provided below. General recommendations are to administer the survey:

Beliefs Survey 45
Problem Solving/Response to Intervention Evaluation Tool Technical Assistance Manual
Prior to beginning professional development targeting the beliefs of educa-• tors regarding PS/RtI practices.At the end of the first year of professional development activities to deter-• mine the extent to which beliefs changed.At least one time each subsequent year to monitor belief levels as implemen-• tation efforts continue. Administration at the end of each year can be used to provide information on the relationship between professional development activities and beliefs during the year as well as serve as a baseline for the impact of next year’s activities.
In addition to measuring long-term changes in educators’ beliefs, the survey can be administered at both the beginning and end of trainings targeting beliefs about PS/RtI practices. This procedure allows educators to measure the immediate, short-term changes in educators’ beliefs as a result of the training provided. The informa-tion obtained can be used to inform the content and delivery of future professional development.
Technical Adequacy
Content Validity Evidence
To inform development of the Beliefs Survey, Project staff reviewed relevant lit-erature, presentations, instruments and previous program evaluation projects to develop an item set that would be representative of beliefs important to consider when implementing PS/RtI practices. Next, a draft of the instrument was sent to an Educator Expert Validation Panel (EEVP), which consisted of educators from varying disciplines in a neighboring school district who had basic background knowledge in PS/RtI, for review. The Panel provided feedback on the represen-tativeness of the beliefs covered by the instrument, clarity and quality of the in-dividual items, and suggested modifications to items before the final survey was developed. More information on the EEVP used to examine the content validity of the survey is available from the Florida PS/RtI Project.
Construct Validity Evidence
Exploratory common factor analytic procedures were used to determine the un-derlying factor structure of the Beliefs Survey. A common factor analysis was con-ducted using the responses from a sample of 2,430 educators in 62 schools from seven school districts across Florida. The educators were participants in the Florida PS/RtI Project during the Fall of 2007. Factors were extracted using principal axis factor extraction method. Based on examination of eigenvalues and a scree plot, three factors were retained and rotated using an oblique rotation (Promax) to aid in the interpretability of the factors. Collectively, the three factors accounted for 72% of the common variance in respondent ratings of the belief statements. The resultant factors were labeled 1) Academic Abilities and Performance of Students With Disabilities, 2) Data-Based Decision Making, and 3) Functions of Core and Supplemental Instruction (see Beliefs Survey: Table 1 in Supplements, page 58 for the final factor solution).
Content validity: Content-related validity evidence refers to the extent to which the sample of items on an instrument is representative of the area of interest the instrument is designed to measure. In the context of the Beliefs Survey, content-related validity evidence is based on expert judgment that the sample of items on the Beliefs Survey is representative of the educator beliefs facilitative of positive implementation of PS/RtI practices.
Construct validity: Construct-related validity evidence refers to the extent to which the individuals’ scores derived from the instrument represent a meaningful measure of a trait or characteristic. In the case of the Beliefs Survey, an exploratory factor analysis was conducted to assess the internal structure of the instrument and to develop evidence to support the validity of interpretations based on individuals’ scores on the resultant factors. Results of the factor analysis suggest that the Beliefs Survey measured three underlying belief domains (or factors).

46 CHAPTER TWO – Tools for Examining Consensus Development
Problem Solving/Response to Intervention Evaluation Tool Technical Assistance Manual
Thus, the results of the common factor analysis suggest that the Belief Survey taps into educator beliefs in three domains: beliefs about the academic ability and per-formance of students with disabilities, beliefs about data-based decision making, and beliefs about functions of core and supplemental instruction.
Internal Consistency Reliability
Internal consistency reliability estimates (as measured by Cronbach’s alpha) for each of the three factors (domains) yielded by the factor analysis are as follows:
Factor 1• (Academic Ability and Performance of Students with Disabilities): α = .87Factor 2• (Data-Based Decision Making): α = .79Factor 3• (Functions of Core and Supplemental Instruction): α = .85
Scoring
Analysis of Responses to the Beliefs Survey
The Florida PS/RtI Project primarily utilizes two techniques for analyzing survey responses for evaluation purposes. First, the mean rating for each item can be cal-culated to determine the average belief level reported by educators that completed the Beliefs Survey. Second, the frequency of (i.e., frequency distribution) each response option selected (e.g., Strongly Disagree, Disagree, Neutral, Agree, and Strongly Agree) can be calculated for each survey item.
Calculating item means provides an overall impression of the belief level of those individuals within a school, district, etc. Calculating average beliefs can be done at the domain (i.e., factor) and/or individual item levels. Examining beliefs at the domain level allows educators to examine general beliefs about (1) the academic abilities and performance of students with disabilities, (2) data-based decision-making, and (3) functions of core and supplemental instruction. A score for each of the three domains measured by the instrument may be computed for each respon-dent to the survey by calculating the sum of the ratings of the items that comprise the domain. These values can then be added together and divided by the number of items within the domain to determine the average level of belief for each do-main. The items that comprise each domain are as follows:
Factor 1• (Academic Ability and Performance of Students With Disabilities): Items 9A, 9B, 10A, 10B, 11A, and 11B.Factor 2• (Data-Based Decision Making): Items 12, 13, 14, 15, 16, 17, 20, 21, 22, 23, 24, 25, and 27.Factor 3• (Functions of Core and Supplemental Instruction): Items 7A, 7B, 8A, and 8B.
Average levels of beliefs also can be examined by item. Calculating the mean rat-ing for each item within a domain allows key stakeholders to identify the extent to which educators agree with particular belief statements. This information can be used to identify specific beliefs held by educators that may facilitate or hinder
Internal consistency reliability: Internal consistency reliability evidence is based on the degree of homogeneity of scores (i.e., the extent to which the scores cluster together) on items measuring the same domain. In the context of the Beliefs Survey, an internal consistency reliability estimate provides a measure of the extent to which educators’ who responded one way to an item measuring a belief domain (or factor) tended to respond the same way to other items measuring the same domain.
For example, if an educator selected SA, A, A, N, A, A when completing the 6 items that comprise the beliefs regarding “Students with Disabilities Academic Abilities and Performance” domain, the values corresponding with those responses would be added together to obtain a total value of 24 (i.e., 5+4+4+3+4+4 = 24). The total value of 24 would be divided by the number of items (6) to obtain the average domain score (i.e., 24/6 = 4). An average domain score of 4 could be interpreted as the educator, on average, agreeing with belief statements regarding students with disabilities academic abilities and performance.

Beliefs Survey 47
Problem Solving/Response to Intervention Evaluation Tool Technical Assistance Manual
implementation of PS/RtI practices, but does not provide much information on the variability of specific beliefs.
Calculating the frequency of educators who selected each response option for an item, on the other hand, provides information on the range of belief levels. This information can be used to determine what percentage of respondents agree or disagree with a given belief. When making decisions about consensus levels, in-formation on the number of educators who agree with statements consistent with PS/RtI practices can help inform decisions regarding moving forward with imple-mentation (e.g., decide to address a belief or set of beliefs held by many educators or decide not to address the belief or set of beliefs because they did not agree with a given beliefs statement) (see Year 1 Evaluation Report, Beliefs graphs, pages 19-22).
It is recommended that key stakeholders analyze Beliefs Survey data in ways that best inform the evaluation questions they are asking. The data collected from the instrument can be used to answer a number of broad and specific questions re-garding the extent to which educators agree with beliefs consistent with the PS/RtI model. To facilitate formative decision-making, stakeholders should consider aligning the analysis and display of the data with specific evaluation questions. For example, questions regarding general trends in beliefs regarding data-based decision-making across time may best be answered by calculating and displaying domain scores. Questions about specific beliefs across a school or district may best be answered by calculating and displaying the number of educators that report disagreement, neutrality, or agreement with the beliefs being evaluated. In other words, identifying which evaluation question(s) are currently being answered will guide how to analyze the data and communicate the information to facilitate deci-sion making (see Year 2 Evaluation Report, Beliefs graphs,pages22-24).
Technology Support
School personnel should consider using district supported or commercially avail-able technology resources to facilitate analyses of the data. Software andweb-based programs vary in terms of the extent to which they can support administra-tion of an instrument (e.g., online administration) and automatic analysis of data, aswell as howuser-friendly they are.Decisions aboutwhat technology to useto facilitate analysis should be made based on available resources as well as the knowledge and skills possessed by those responsible for managing and analyzing data from the survey.
Training Required
Training Suggested for Administering the Beliefs Survey
A brief training is recommended prior to administering the Beliefs Survey. Al-though administering surveys is common in school settings, issues such as specific administration procedures and the amount of questions administrators are likely to receive about survey content vary. Therefore trainings of individuals responsible for administering the survey should include the components listed below. The con-

48 CHAPTER TWO – Tools for Examining Consensus Development
Problem Solving/Response to Intervention Evaluation Tool Technical Assistance Manual
tents of this manual can serve as a resource for developing and conducting train-ings on the Beliefs Survey.
Theoretical background on the relationship between beliefs and whether • educators will adopt new practicesDescription of the instrument including brief information on the items and • how they relate to each other (e.g., domains of beliefs the items assess)Administration procedures developed and/or adopted• Common issues that arise during administration such as frequently asked • questions and how to facilitate better return rates from school settings
Training Suggested for Analyzing, Interpreting, and Disseminating Beliefs Survey Results
The knowledge, skills, and experience of educators in analyzing, interpreting, and using data for formative decision-making vary. If the stakeholders responsible for these activities possess the knowledge and skills required then training specific to the Beliefs Survey may not be necessary. However, should the stakeholders re-sponsible for using the data lack any of the aforementioned skill sets, training and technical assistance is recommended. Topics that support might be provided on are listed below:
Appropriate use of the survey given its purpose and technical adequacy• Guidelines for analyzing and displaying data derived from the survey• Guidelines for interpreting and disseminating the results•
Interpretation and Use of the Data
Examination of Broad Domains
When examining the Beliefs Survey data (see Year 2 Evaluation Report, pages 22-24), it is recommended to start by examining the 3 broad domains, or fac-tors, measured by the survey (i.e., academic abilities and performance of students with disabilities, data-based decision-making, functions of core and supplemen-tal instructional practices). Educators can examine graphically displayed data to evaluate trends in educator beliefs regarding each domain measured by the Beliefs Survey. Each of the methodologies for scoring mentioned above (i.e., calculating average beliefs at the domain and item levels and calculating the frequency/per-cent of educators who selected each response option at the item level) can be used to examine the broad domains. One methodology used frequently by Project staff when examining data from the Beliefs Survey is to take note of the percent of edu-cators who reported strongly agreeing (5) or agreeing (4); the percent who reported a neutral view (3); as well as the percent of staff members who reported disagree-ing (2) or strongly disagreeing (1) with beliefs within each domain. This type of vi-sual analysis (an example of a graph displaying educator beliefs using this format is provided below) allows stakeholders to determine the extent to which educators tend to agree, disagree, or remain neutral regarding beliefs consistent with PS/RtI practices. This approach can be used to examine beliefs for any given administra-tion as well as to examine trends over time.

Beliefs Survey 49
Problem Solving/Response to Intervention Evaluation Tool Technical Assistance Manual
Identification of Specific Needs
After examining data from the broad domains measured by the Beliefs Survey, it is recommended that teams examine responses to individual items. Stakeholders should consider examining graphically displayed data to determine levels of staff agreement with certain big ideas associated with a PS/RtI model. If a large num-ber of staff disagrees with a certain belief or set of beliefs about PS/RtI practices, additional training and professional development can be developed to specifically target the big idea assessed by the relevant items. It is important to note that deci-sions about beliefs to target should be made based on multiple sources of informa-tion. In other words, discussions about the extent to which the data are consistent with stakeholder perspectives and other sources of relevant information should occur before deciding on a course of action. It also should be noted that while be-liefs are a necessary component of consensus, they are not a sufficient condition. For example, educators can have strong, positive beliefs about PS/RtI practices, but not buy-in to implementation due to a number of factors such as a lack of time to focus on implementation, funding constraints, other competing initiatives, poor communication among staff, etc.
Data Dissemination to Stakeholders
It is recommended that the data be shared with DBLTs, SBLTs, instructional school staff, and any other relevant stakeholders as quickly and frequently as possible following survey administrations. Quick access to the data allows stakeholders in leadership positions (e.g., DBLTs, SBLTs) to discuss the results from the Beliefs Survey, develop and/or modify consensus-building goals, and design professional development activities to facilitate changes in educators’ beliefs. SBLT members also may share their school’s Beliefs Survey data with instructional school staff who are not members of the SBLT. SBLT members can use the data presented to facilitate consensus-building discussions and to obtain staff input regarding factors that contribute to the beliefs they reported.
One helpful strategy for facilitating discussions about Beliefs Survey data is to pro-vide educators with guiding questions. The use of guiding questions is designed to facilitate discussions about issues such as current belief levels, additional profes-sional development that might be necessary, and goals for developing staff con-sensus. Listed below are examples of guiding questions used by the Florida PS/RtI Project to facilitate discussions among SBLT members when examining Beliefs Survey data. The questions were developed to provide scaffolding when inter-preting the data and focus discussions toward using the information to facilitate consensus building. However, stakeholders in leadership positions can generate additional guiding questions to better meet their particular needs.
Did your building’s beliefs change from the first to the second administra-• tion? If yes, in what areas did the greatest change occur?What do you think these changes mean in the context of implementing a • PS/RtI model in your building?

50 CHAPTER TWO – Tools for Examining Consensus Development
Problem Solving/Response to Intervention Evaluation Tool Technical Assistance Manual
School-Level Example of Beliefs Survey Data
The following example demonstrates how key stakeholders may use data derived from the Beliefs Survey to inform PS/RtI implementation. Data from the Beliefs Survey are displayed graphically. Following the graph, background information on the school’s initiative and an explanation of what is represented on the graph is provided. Finally, ways in which the data were used by the school to monitor progress and identify needs is discussed. Importantly, although the example occurs at the school-level, the concepts discussed canbe generalized to other units ofanalysis(e.g.,district-level,state-level).

Beliefs Survey 51
Problem Solving/Response to Intervention Evaluation Tool Technical Assistance Manual
Figu
re 4
. Exa
mpl
e Be
liefs
Sur
vey
Gra
ph.

52 CHAPTER TWO – Tools for Examining Consensus Development
Problem Solving/Response to Intervention Evaluation Tool Technical Assistance Manual
Explanation of the Graph
The SBLT at Citrus Elementary wanted to assess the degree to which instructional school staff beliefs aligned with the core beliefs of PS/RtI. To evaluate staff be-liefs, SBLT members decided to administer the Beliefs Survey at the beginning and end of the first year of PS/RtI implementation and at the end of the year thereaf-ter. Figure 4 above displays data on beliefs regarding the academic abilities and performance of students with disabilities from the first two years of implementa-tion. The six items that comprise the domain are displayed (i.e., items 9a, 9b, 10a, 10b, 11a, and 11b). The three bars located above each item represent the level of agreement at the beginning of Year 1 (BOY 1), end of Year 1 (EOY 1), and end of Year 2 (EOY 2). For each bar, the green section represents the percentage of staff members who reported agreement (i.e., selected strongly agree or agree) with the specific belief statement, the yellow section represents those staff members who selected neutral for the specific belief statement, and the red section represents those staff members who disagreed (i.e., selected strongly disagree or disagree) with a specific belief statement. These data were shared with SBLT members and school staff shortly after each administration.
Citrus Elementary’s Use of the Data for Decision Making
Examination of broad Beliefs Survey domains. When examining staff beliefs after each survey administration, Citrus Elementary SBLT members started by visually analyzing the data across items assessing the academic abilities and performance of students with disabilities. Immediately evident from the graph in Figure 4 is that the levels of agreement were on the low end for most items. Less than 50% of staff members agreed with four of the six belief statements across administra-tions. Agreement levels for the remaining two items were substantially higher (ex-ceeding 60% across administrations). Therefore, SBLT members decided that they needed to examine the specific items to determine why differences existed.
Identification of specific needs. The graph in Figure 4 above suggests that approxi-mately 30-40% of staff reported agreeing (35-50% disagreed) with the belief state-ments assessed by items 9a-10b across administrations. Approximately 70% of staff reported agreeing with the beliefs statements assessed by Items 11a-11b. Fol-lowing the first administration at the beginning of Year 1, SBLT members identi-fied the fact that there seemed to be a large discrepancy between staff beliefs about students with disabilities current achievement of academic benchmarks (assessed by Items 9a-10b) and their capability of meeting benchmarks with the right sup-ports (Items 11a-11b). Given this discrepancy, SBLT members decided to present the data reflected above to the staff. The data were presented with guiding ques-tions to facilitate small group discussions before sharing out with the entire faculty. The guiding questions included questions about (1) why staff believed students with disabilities are capable of meeting academic benchmarks but are not currently doing so, (2) what factors contributed to the discrepancy, and (3) what could be done to address the identified factors. SBLT members then presented basic infor-mation on how the PS/RtI model can increase the performance of all students,

Beliefs Survey 53
Problem Solving/Response to Intervention Evaluation Tool Technical Assistance Manual
including students with disabilities. Finally, SBLT members shared information with staff about the school’s PS/RtI initiative and indicated that future professional development activities would focus on practices associated with the model.
Monitoring of beliefs over time. Following each subsequent administration of the Beliefs Survey, Citrus Elementary’s SBLT monitored how beliefs changed. Changes in the beliefs reported at the end of Year 1 and end of Year 2 varied by the belief assessed. A 5-10% increase in staff who agreed that students with learning disabilities met academic benchmarks occurred (Items 9a & 9b) across the two-year period. In addition to the increase in agreement levels, a decrease of approximately 15% of staff disagreeing with the same belief statements was ob-served. SBLT members discussed this trend and decided that the beliefs regarding students with learning disabilities meeting academic benchmarks was consistent with the school’s AYP data (as well as other data sources) for students with dis-abilities. The SBLT concluded that the staff was starting to recognize that efforts to implement practices to improve the outcomes of all students resulted in increased performance of students with learning disabilities.
A slight increase in the percentage of staff (less than 5%) who believed students with disabilities can achieve reading benchmarks occurred across the two-year pe-riod (Item 11a). Conversely, slight decreases (less than 5%) in agreement occurred during the same time frame for the remaining items. The remaining items assessed beliefs about whether students with emotional/behavioral disabilities achieve aca-demic benchmarks (Items 10a & 10b) and whether students with disabilities can achieve math benchmarks (Item 11b). SBLT members discussed reasons why the increase noted for beliefs about students with learning disabilities did not occur for these other beliefs. Potential reasons generated for the slight decreasing trend ob-served for beliefs regarding students with emotional/behavioral disabilities meeting academic benchmarks included that the school was focusing much more on read-ing when implementing PS/RtI practices than behavior (i.e., behavior problems not being addressed may be inhibiting student learning) and that fewer staff have had experience with students with emotional/behavioral disabilities. Potential reasons generated for the small changes in beliefs about the capability of students with disabilities included high levels of initial agreement, staff turnover, and that the approximately 30% of staff who did not agree may be rethinking their traditional ideas about the ability of students with disabilities to perform academically (the percent of disagreement decreased across the two years) but need additional time and information to believe they can perform. SBLT members concluded that more information was needed before a decision could be made regarding the reasons for the patterns observed and what, if anything, to do about the trends. In particularly, SBLT members wanted to compare beliefs regarding students with emotional/be-havioral disabilities not meeting academic benchmarks with the actual outcomes of the students to determine how accurate staff perceptions were.
54 Beliefs Survey — Supplements
Problem Solving/Response to Intervention Evaluation Tool Technical Assistance Manual
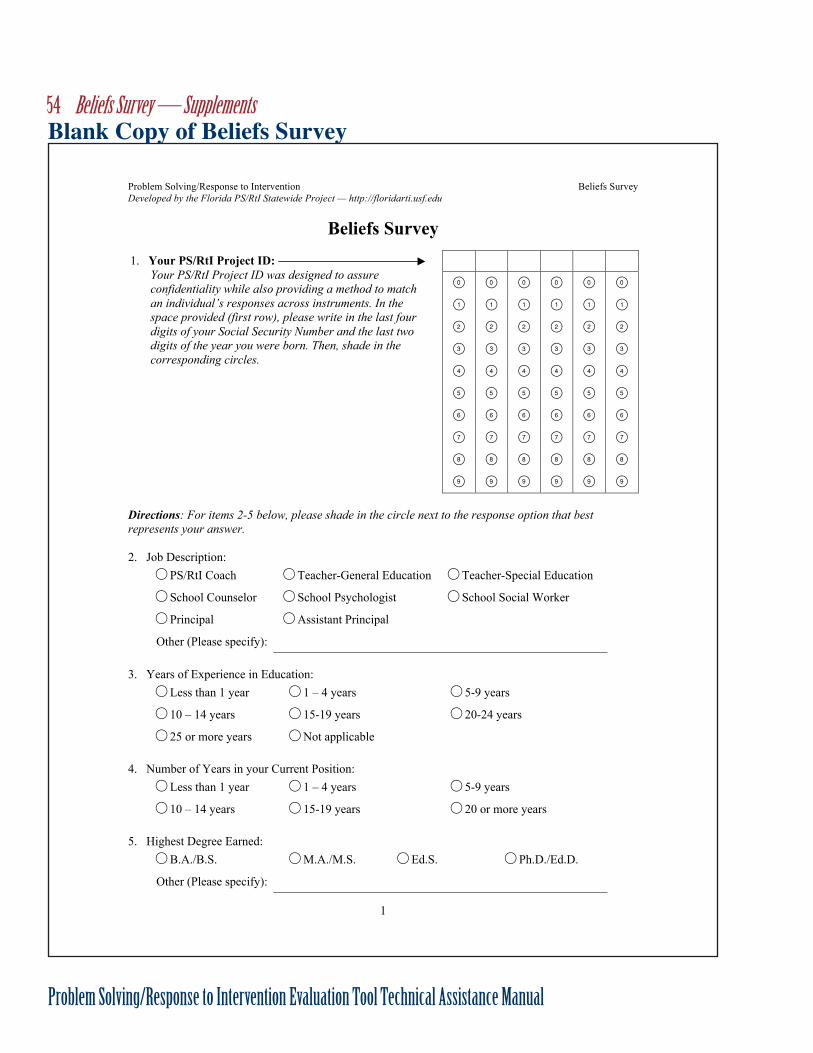
Problem Solving/Response to Intervention Beliefs Survey
Developed by the Florida PS/RtI Statewide Project — http://floridarti.usf.edu
1
Beliefs Survey
Directions: For items 2-5 below, please shade in the circle next to the response option that best
represents your answer.
2. Job Description:
PS/RtI Coach Teacher-General Education Teacher-Special Education
School Counselor School Psychologist School Social Worker
Principal Assistant Principal
Other (Please specify):
3. Years of Experience in Education:
Less than 1 year 1 – 4 years 5-9 years
10 – 14 years 15-19 years 20-24 years
25 or more years Not applicable
4. Number of Years in your Current Position:
Less than 1 year 1 – 4 years 5-9 years
10 – 14 years 15-19 years 20 or more years
5. Highest Degree Earned:
B.A./B.S. M.A./M.S. Ed.S. Ph.D./Ed.D.
Other (Please specify):
1. Your PS/RtI Project ID:
Your PS/RtI Project ID was designed to assure
confidentiality while also providing a method to match
an individual’s responses across instruments. In the
space provided (first row), please write in the last four
digits of your Social Security Number and the last two
digits of the year you were born. Then, shade in the
corresponding circles.
Blank Copy of Beliefs Survey

Beliefs Survey — Supplements 55
Problem Solving/Response to Intervention Evaluation Tool Technical Assistance Manual
Problem Solving/Response to Intervention Beliefs Survey
Developed by the Florida PS/RtI Statewide Project — http://floridarti.usf.edu
2
Directions: Using the scale below, please indicate your level of agreement or disagreement with each of
the following statements by shading in the circle that best represents your response.
= Strongly Disagree (SD)
= Disagree (D)
= Neutral (N)
= Agree (A)
= Strongly Agree (SA)
SD D N A SA
6. I believe in the philosophy of No Child Left Behind (NCLB) even if I
disagree with some of the requirements.
7. Core instruction should be effective enough to result in 80% of the
students achieving benchmarks in
7.a. reading
7.b. math
8. The primary function of supplemental instruction is to ensure that
students meet grade-level benchmarks in
8.a. reading
8.b. math
9. The majority of students with learning disabilities achieve grade-level
benchmarks in
9.a. reading
9.b. math
10. The majority of students with behavioral problems (EH/SED or EBD)
achieve grade-level benchmarks in
10.a. reading
10.b. math
11. Students with high-incidence disabilities (e.g. SLD, EBD) who are
receiving special education services are capable of achieving grade-level
benchmarks (i.e., general education standards) in
11.a. reading
11.b. math
12. General education classroom teachers should implement more
differentiated and flexible instructional practices to address the needs of
a more diverse student body.
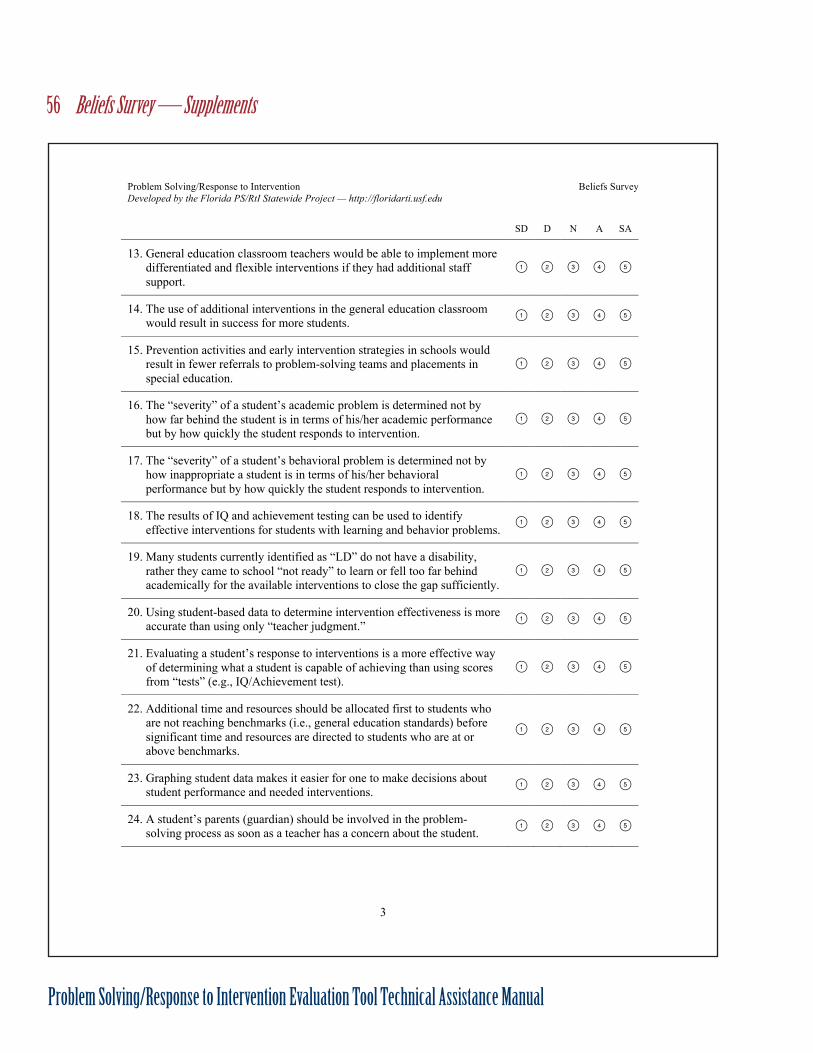
56 Beliefs Survey — Supplements
Problem Solving/Response to Intervention Evaluation Tool Technical Assistance Manual
Problem Solving/Response to Intervention Beliefs Survey
Developed by the Florida PS/RtI Statewide Project — http://floridarti.usf.edu
3
SD D N A SA
13. General education classroom teachers would be able to implement more
differentiated and flexible interventions if they had additional staff
support.
14. The use of additional interventions in the general education classroom
would result in success for more students.
15. Prevention activities and early intervention strategies in schools would
result in fewer referrals to problem-solving teams and placements in
special education.
16. The “severity” of a student’s academic problem is determined not by
how far behind the student is in terms of his/her academic performance
but by how quickly the student responds to intervention.
17. The “severity” of a student’s behavioral problem is determined not by
how inappropriate a student is in terms of his/her behavioral
performance but by how quickly the student responds to intervention.
18. The results of IQ and achievement testing can be used to identify
effective interventions for students with learning and behavior problems.
19. Many students currently identified as “LD” do not have a disability,
rather they came to school “not ready” to learn or fell too far behind
academically for the available interventions to close the gap sufficiently.
20. Using student-based data to determine intervention effectiveness is more
accurate than using only “teacher judgment.”
21. Evaluating a student’s response to interventions is a more effective way
of determining what a student is capable of achieving than using scores
from “tests” (e.g., IQ/Achievement test).
22. Additional time and resources should be allocated first to students who
are not reaching benchmarks (i.e., general education standards) before
significant time and resources are directed to students who are at or
above benchmarks.
23. Graphing student data makes it easier for one to make decisions about
student performance and needed interventions.
24. A student’s parents (guardian) should be involved in the problem-
solving process as soon as a teacher has a concern about the student.

Beliefs Survey — Supplements 57
Problem Solving/Response to Intervention Evaluation Tool Technical Assistance Manual
Problem Solving/Response to Intervention Beliefs Survey
Developed by the Florida PS/RtI Statewide Project — http://floridarti.usf.edu
4
SD D N A SA
25. Students respond better to interventions when their parent (guardian) is
involved in the development and implementation of those interventions.
26. All students can achieve grade-level benchmarks if they have sufficient
support.
27. The goal of assessment is to generate and measure effectiveness of
instruction/intervention.
THANK YOU!

58 Beliefs Survey — Supplements
Problem Solving/Response to Intervention Evaluation Tool Technical Assistance Manual
Table 1
Promax Oblique Factor Solution of Statements from the Beliefs Survey
Factor Loadings Item
#
Item
I II III
10a The majority of students with behavioral problems
(EH/SED or EBD) achieve grade-level benchmarks in
reading
.86 -.11 .09
10b The majority of students with behavioral problems
(EH/SED or EBD) achieve grade-level benchmarks in
math
.85 -.09 .07
9b The majority of students with learning disabilities
achieve grade-level benchmarks in math
.82 -.13 .09
9a The majority of students with learning disabilities
achieve grade-level benchmarks in reading
.81 -.14 .09
11b Students with high-incidence disabilities (e.g. SLD,
EBD) who are receiving special education services are
capable of achieving grade-level benchmarks (i.e.,
general education standards) in math.
.58 .39 -.24
11a Students with high-incidence disabilities (e.g. SLD,
EBD) who are receiving special education services are
capable of achieving grade-level benchmarks (i.e.,
general education standards) in reading.
.54 .41 -.25
14 The use of additional interventions in the general
education classroom would result in success for more
students.
-.05 .63 .05
15 Prevention activities and early intervention strategies in
schools would result in fewer referrals to problem-
solving teams and placements in special education.
-.02 .59 .02
12 General education classroom teachers should implement
more differentiated and flexible instructional practices to
address the needs of a more diverse student body.
.15 .50 .05
16 The “severity” of a student’s academic problem is
determined not by how far behind the student is in terms
of his/her academic performance but by how quickly the
student responds to intervention.
.13 .47 .03
13 General education classroom teachers would be able to
implement more differentiated and flexible interventions
if they had additional staff support.
-.08 .47 .04
17 The “severity” of a student’s behavioral problem is
determined not by how inappropriate a student is in terms
of his/her behavioral performance but by how quickly the
student responds to intervention.
.15 .46 .00
24 A student’s parents (guardian) should be involved in the
problem-solving process as soon as a teacher has a
concern about the student.
-.16 .45 .07
23 Graphing student data makes it easier for one to make
decisions about student performance and needed
interventions.
-.02 .44 .10
Beliefs Survey: Table 1

Beliefs Survey — Supplements 59
Problem Solving/Response to Intervention Evaluation Tool Technical Assistance Manual
Table 1
Promax Oblique Factor Solution of Statements from the Beliefs Survey
Factor Loadings Item
#
Item
I II III
27 The goal of assessment is to generate and measure
effectiveness of instruction/intervention.
.06 .43 .13
25 Students respond better to interventions when their
parent (guardian) is involved in the development and
implementation of those interventions.
-.09 .41 .05
21 Evaluating a student’s response to interventions is a more
effective way of determining what a student is capable of
achieving than using scores from “tests” (e.g.,
IQ/Achievement test).
-.06 .41 .00
20 Using student-based data to determine intervention
effectiveness is more accurate than using only “teacher
judgment.”
-.02 .37 .08
22 Additional time and resources should be allocated first to
students who are not reaching benchmarks (i.e., general
education standards) before significant time and
resources are directed to students who are at or above
benchmarks.
-.05 .30 .04
26 All students can achieve grade-level benchmarks if they
have sufficient support.
.20 .28 .08
19 Many students currently identified as “LD” do not have a
disability, rather they came to school “not ready” to learn
or fell too far behind academically for the available
interventions to close the gap sufficiently.
.03 .24 .05
6 I believe in the philosophy of No Child Left Behind
(NCLB) even if I disagree with some of the
requirements.
.18 .23 .21
18 The results of IQ and achievement testing can be used to
identify effective interventions for students with learning
and behavior problems.
.08 .18 .06
8a The primary function of supplemental instruction is to
ensure that students meet grade-level benchmarks in
reading.
-.07 .11 .81
8b The primary function of supplemental instruction is to
ensure that students meet grade-level benchmarks in
math.
-.08 .10 .80
7b Core instruction should be effective enough to result in
80% of the students achieving benchmarks in math.
.15 .07 .73
7a Core instruction should be effective enough to result in
80% of the students achieving benchmarks in reading.
.15 .07 .72
Note. Only items with factor loadings > .30 were retained for each factor.
Items not loading on any of the 3 factors were items 6, 18, 19, and 26.