41894 txt p1 - annualreports.com
TRANSCRIPT

Annual Report
2005
YAMANAVISION
Ya
ma
na
Go
ld In
c.
2005 A
nn
ua
l Re
po
rt
Chapada
FazendaBrasileiro
Fazenda Nova
São Vicente
São Francisco
La Libertad
San Andrés
Y A M A N A G O L D I N C.
YAMANA GOLD INC. is a Canadiangold mining company with a diversified portfolio of gold mining operations, developmentproperties, and exploration-stageproperties in Brazil and CentralAmerica.Yamana is listed on theToronto Stock Exchange (YRI), theAmerican Stock Exchange (AUY) and the London Stock ExchangeAlternative Investment Market (YAU).
• Latin America focused gold producer.• Five(1) operating mines.• One fully-financed project under construction
- forecast to be completed fourth quarter 2006.• Forecast gold production to exceed 340,000
ounces in 2006, increasing to more than 500,000 ounces in 2007; target production of 750,000 ounces for 2008 (not including proposed acquisition of Desert Sun Mining Corp.).
• Significant land position in Brazil with close to 650,000 hectares of exploration concessions.
• Strong South America presence.• Commitment to exploration.(1) Including mines acquired through the amalgamation with RNC Gold Inc.
effective February 28, 2006.
A cautionary note regarding forward-looking statements and non-GAAP measures follows the Management’s Discussion and Analysis of Operations and Financial Condition.
All figures are in US dollars unless otherwise indicated.
Contents
Corporate ProfileYamana - At a Glance
6 Why Invest in Yamana? 7 Our 2005 Achievements 9 Message to Shareholders
12 Delivering Results 13 Our Strategic Vision 15 Near-term Goals 16 How Yamana is Different 17 Leveraging Expertise 18 Brazil 21 Operations and Activities32 Exploration41 Environmental, Health and Safety 42 Reserves and Resources45 Management’s Discussion and Analysis85 Management’s Responsibility86 Auditors’ Report87 Consolidated Financial Statements90 Notes to the Consolidated Financial
Statements112 Corporate Information
C1 SantaLuz
.COMYAMANA

Annual Report
2005
YAMANAVISION
Ya
ma
na
Go
ld In
c.
2005 A
nn
ua
l Re
po
rt
Chapada
FazendaBrasileiro
Fazenda Nova
São Vicente
São Francisco
La Libertad
San Andrés
Y A M A N A G O L D I N C.
YAMANA GOLD INC. is a Canadian
gold mining company with a
diversified portfolio of gold
mining operations, development
properties, and exploration-stage
properties in Brazil and Central
America.Yamana is listed on the
Toronto Stock Exchange (YRI), the
American Stock Exchange (AUY)
and the London Stock Exchange
Alternative Investment Market (YAU).
• Latin America focused gold producer.• Five(1) operating mines.• One fully-financed project under construction
- forecast to be completed fourth quarter 2006.• Forecast gold production to exceed 340,000
ounces in 2006, increasing to more than 500,000 ounces in 2007; target production of 750,000 ounces for 2008 (not including proposed acquisition of Desert Sun Mining Corp.).
• Significant land position in Brazil with close to 650,000 hectares of exploration concessions.
• Strong South America presence.• Commitment to exploration.(1) Including mines acquired through the amalgamation with RNC Gold Inc.
effective February 28, 2006.
A cautionary note regarding forward-looking statements and non-GAAP measures follows the Management’s Discussion and Analysis of Operations and Financial Condition.
All figures are in US dollars unless otherwise indicated.
Contents
Corporate Profile
Yamana - At a Glance
6 Why Invest in Yamana?
7 Our 2005 Achievements
9 Message to Shareholders
12 Delivering Results
13 Our Strategic Vision
15 Near-term Goals
16 How Yamana is Different
17 Leveraging Expertise
18 Brazil
21 Operations and Activities
32 Exploration
41 Environmental, Health and Safety
42 Reserves and Resources
45 Management’s Discussion and Analysis
85 Management’s Responsibility
86 Auditors’ Report
87 Consolidated Financial Statements
90 Notes to the Consolidated Financial
Statements
112 Corporate Information
C1 SantaLuz
.COMYAMANA

YAMANAAT A GLANCEY A M A N A G O L D I N C.
2005 Estimated Proven & Probable Measured & Indicated
2005 Cash 2006 Reserves(3)(4) Resources(3) 2006 Beyond(as of February 28, 2006) Production Costs(3) Production Contained gold oz/copper lbs Contained gold oz/copper lbs Objectives 2006
Fazenda Nova Mine (Brazil) • constructed at a total capital cost 36,159 oz $208 30,000 - 33,000 oz 92,300 oz 114,200 oz • targeted cash costs • deep resourceGold of approximately US$6.5 million /oz gold at less than US$200 potentialShallow, open pit, heap leach operation • began commercial production Commercial /ounce
May 1, 2005 production28,780 oz
Fazenda Brasileiro Mine (Brazil) • more than 14 years of operating 72,074 oz $320 80,000 - 85,000 oz 206,700 oz 444,200 oz • add resources and • current resources Gold experience /oz gold convert existing support 4-6 yearProducing underground operation • E-Deep definition drilling and mine resources into mine life at average
development ongoing reserves 80,000 oz per year• increase mine life • mining from higher• cost reductions grades from C-Quartz
and E-Deep areas
São Francisco Mine (Brazil) • begins commercial operation in early 2006 4,050 oz – 100,000 - 126,000 oz Main ore: 1.1 M oz 1.65 M oz • attain commercial • production for moreGold • production upside from conversion of (pilot plant) gold ROM(5): 0.3 M oz production than 10 years at lessAdvanced open pit, gravity/heap leach project resources to reserves and grade upside 1.4 M oz than $210/oz
due to coarse gold effect
Chapada Project (Brazil) • construction on schedule – – 15,000 - 19,000 oz 2.5 M oz Measured and • completion of • 19 year mine lifeCopper, Gold • targeted production by fourth quarter 2006 gold 2.3 B lbs Indicated 3.0 M oz construction and • Total production of Shallow open pit mining project with initial 5 year high-grade starter pit Measured and commence 2 B lbs of copper
• less than 2 year pay-back Indicated 2.8 B lbs production and 1.3 M oz of gold• Most of gold production
in first five years
San Andrés Mine(1) (Honduras) • production of 402,700 oz over the last 61,236 oz – 50,000 - 60,000 oz n/a n/a • increase production • Potential reserve Gold 5 years at an average cash cost of $237/oz gold • lower costs increaseProducing underground operation • exploration potential to extend 5-year • significant
mine plan exploration
La Libertad Mine(1) (Nicaragua) • 18,300 hectares of mining and exploration 33,860 oz – 45,000 - 50,000 oz n/a n/a • improve recovery • Underground miningGold concessions gold rates potentialOpen pit heap leach operation • contract mining • recapitalize
• historical under capitalization to be corrected • improve efficiencyonce process plan improvements are initiated
São Vicente (Brazil) • feasibility stage project with potential – – – Main ore: 361,300 oz 660,500 oz • feasibility study • constructionGold for a stand-alone open pit mine ROM(5): 108,700 oz including a new (assuming a positiveDevelopment Project • bulk samples suggest grades may exceed 470,000 oz reserve estimate feasibility study)
drill indicated grades and reserve grades • continue resource expansion throughexploration
C1 Santa Luz (Brazil) • located on the Rio Itapicuru Greenstone – – – 556,000 oz 982,400 oz • feasibility study • construction Gold Belt north of Fazenda Brasileiro Mine (assuming a positiveDevelopment Project • potential for stand-alone open pit and u/g mine feasibility study)
• significant resources - reserves are increasing
Ernesto (Brazil) • located on the Santa Elina Gold Belt – – – – 141,800 oz • feasibility study • construction Gold south of São Francisco (assuming a positiveDevelopment Project • potential for stand-alone mine feasibility study)
(1) Acquired through the amalgamation with RNC Gold Inc. effective February 28, 2006. (3) Gold price assumption $425/oz (4) Subset of Measured(2) Average cash costs for 2005 - $289 per ounce excluding mines acquired from RNC Gold Inc. Copper price assumption $1.00/lb and Indicated Resources
(5) ROM - Run-of-mine
GROWTHVALUE
A n n u a l R e p o r t 2 0 0 5
YAMANA - AT A GLANCE

Promised and delivered:Growth and Value
Our Vision continues…
41894_txt_p1 3/19/06 4:56 PM Page 1

41894_txt_p3 3/19/06 4:35 PM Page 3

41894_txt_r1_p4 3/23/06 4:22 PM Page 4

41894_txt_r1_p5 3/23/06 4:22 PM Page 5

Yamana Gold Inc., Share Price
S&P/TSX Capped Gold Index comparison
from December 31, 2004 to December 12, 2005
*Source: Bloomberg Financial Services
76
.11
%
35.3
1%
33.2
4%
31.1
2%
24.0
9%
15.7
3%
14.9
2%
11.6
0%
9.48
%
7.24
%
6.95
%
3.21
%
-7.1
7%
-9.2
6%
-16.
13%
-40.
70%
-44.
611%
Other gold companiesYamana Gold
• Track Record: rapidly growing, robust intermediate gold company.
• Upside: significant operational and valuation upside.
• Production Profile: steadily increasing.
• Balance Sheet: strong, demonstrated ability to enter into both the capital and debt markets.
• Experience: proven management and operations teams.
• Assets: five producing gold mines, one project under construction, and four development stage projects, all advancing positively.
• Positioning: unhedged and leveraged to gold; hedged 50 million lbs. of 2007 copper production.
• Potential: a large exploration portfolio in Brazil and Central America with significant budget to uncover value.
• Commodity Markets: rising for both gold and copper.
Growth, Value and Vision
GROWTHVALUE
6
A n n u a l R e p o r t 2 0 0 5
WHY INVEST IN YAMANA?Growth, Value and Vision
41894_txt_p6 3/19/06 4:36 PM Page 6

YAMANAVISION
7
Y A M A N A G O L D I N C.
OUR 2005 ACHIEVEMENTSDelivering Results
• Cash balance of $151.8 million as at December 31, 2005 and cash flow from operations of $6.5 million (before changes in non-cash working capital items) for the year.
• Achieved average cash costs of $289 per ouncefrom its Fazenda Nova and Fazenda Brasileiro mines.
• Commenced commercial production at its Fazenda Nova Mine.
• Completed construction of its São Francisco Mine.
• Ahead of schedule with the construction of its Chapada copper-gold project.
• Raised gross proceeds of $49.6 million from the early exercise of its publicly traded warrants that otherwise would not have been available to the Company until July 2008.
• Raised $105.3 million in net proceeds from the issue of 26 millioncommon shares.
• Closed debt financing in the amount of $100 million for the construction of the Chapada copper-gold project.
• Entered into smelter off-take agreements for 150,000 tonnes of copper concentrate from its Chapada project currently under construction.
• Initiated a hedging program that is intended to help secure a less than two year payback at its Chapada copper-gold project.
• Entered into an arrangement agreement with RNC Gold Inc. that has added two operating mines and one development project bringing total forecast gold production to approximately 550,000 ouncesby 2007 and targeted production of up to 750,000 ounces by 2008 (transaction closed February 28, 2006).
• Advanced three projects to the point where they each have the potential to become a new mine.
• Share appreciation of 284% from C$3.60 in January 2005 to C$10.22 as at February 28, 2006.
41894_txt_r1_p7 3/23/06 4:22 PM Page 7

41894_txt_p8 3/19/06 4:36 PM Page 8

YAMANAVISION
9
Y A M A N A G O L D I N C.
Dear Shareholders
n last year’s message to shareholders, I spoke about delivering value and growth. We have been unwavering in
this commitment and are happy to nowshare with you our vision for the future of this Company.
Our objective, as stated in last year’sannual report, has evolved. Today our commitment is to produce at least 750,000ounces of gold per year beginning in 2008,resulting in strong cash flow, profitabilityand returns to you, our shareholders. Our next growth phase is well underway,establishing Yamana firmly as an intermediate gold producer with our vision of becoming a major gold producerover the next decade.
Over the past year we have significantlyincreased both our production and ourcash flow. We have continued with ouraggressive exploration program and arestarting to see some great results.
Since our creation in 2003, we have successfully turned undervalued Brazilianproperties into profitable, producing mining operations. We have effectively met our commitments to you, ourinvestors.
Our objective over the next two years is equally ambitious, as we plan to furtherincrease value and to build on our solidfoundation for future growth. Let us share our vision with you.
Today we are proud to have the profile of a growing intermediate gold company.We now have three producing mines,Fazenda Brasileiro, Fazenda Nova and São Francisco. Fazenda Brasileiro hasannual gold production of 80,000 ounceswith current resources to support a furtherfour to six year mine life and we are confident of the potential for increasingreserves and resources at the mine.Fazenda Nova produces 30,000 to 33,000ounces of gold per year for another threeor four years at an attractive cash cost of about $200 per ounce. There is alsopotential for a reserve life increase at this mine.
São Francisco is now completed. We will meet our promise of production andexpected upside from both the coarse goldeffect, demonstrating that the actual gradeis higher than the reserve grade, and conversion of resources into reserves.Simply put, we expect to recover more gold than contemplated in our feasibilitystudy because of the nugget or coarse gold effect and longer reserve life. At São Francisco we have already shown anincrease in reserves of 324,000 ouncesfrom what we had a year ago.
We are on target for Chapada, due to be completed later this year, and we haveopted to hedge a portion of our first year’scopper production to provide considerablevalue for you our shareholders, by securinga less than two year payback at Chapada.
MESSAGE TO SHAREHOLDERSOur Vision
I
41894_txt_p9 3/19/06 4:36 PM Page 9

GROWTHVALUE
10
A n n u a l R e p o r t 2 0 0 5
This profit optimization program requiresno margin, collateral or any other securityfrom Yamana. We opted to monetize some of our copper to better position ourselves as a gold producer and allow usto concentrate solely on gold opportunities.
With cash flow generated from FazendaBrasileiro and Fazenda Nova we are continually increasing our already strongfinancial position from which we are well positioned to finance exploration development and capital investment. We have a cash balance of $152 million as of our year end, allowing us to takeadvantage of acquisition opportunities.
On the exploration front, we are veryhappy to report very encouraging and successful initial results leading to theadvancement of three potential new mines. The first of these is on the ItapicuruGreenstone Belt, north of our FazendaBrasileiro mine. The remaining two arelocated on the Santa Elina Gold Belt near our São Francisco mine. We plan toincrease our targeted production profile by more than 225,000 ounces per year
from these potential deposits. We will continue our extensive exploration program by focusing on priority targets on approximately 650,000 hectares of mineral concessions. We will continue todedicate a significant amount of funds this year for exploration.
We are committed to our ambitious plan for internal growth but we intend onsupplementing our growth profile withadditional acquisitions of producing and/or development stage projects. The principal focus of this effort will be inLatin America. We promised that we wouldpursue acquisition targets so that by 2008our production levels, together with production from our existing properties,would exceed 750,000 ounces per year.
The organic growth we’ve achieved has more than met our commitment toshareholders, but we intend on growingeven faster through acquisitions. The firstof those was finalized in February with our purchase of RNC Gold Inc. which provides us with operations in Hondurasand Nicaragua.
“WE HAVE EFFECTIVELY MET OUR commitments to you our investors. Our objective over
the next two years is equally ambitious, as we plan
to further increase value and to build on our solid
foundation for future growth.”
41894_txt_p10 3/19/06 4:36 PM Page 10

YAMANAVISION
11
RNC will immediately increase our total production by 120,000 ounces tomore than 340,000 ounces in 2006 and500,000 ounces in 2007. These productionlevels bring us within very close strikingdistance of our overall goal of 750,000ounces by 2008. Importantly, this will beour beachhead in Latin America where we intend to leverage our mining andfinancial expertise in a region with excellent mineral potential.
More than that, as we were completingthe RNC acquisition, we announced the proposed acquisition of Desert SunMining Corp. Shareholder approval of this acquisition was in progress as this letter was prepared and we anticipate that the transaction will be closed as thisletter reaches our shareholders. We areconfident that this transaction will be completed as proposed. With this, we will become the dominant gold miningcompany in Brazil in terms of gold production and exploration concessions.We recognize significant synergies andstrategic benefits from this acquisition.With this, our annualized production thisyear will increase to 450,000 ounces thenexpected to exceed 700,000 ounces in2007 and 800,000 ounces in 2008.
I began by referring to vision. As weadvance this transaction, we recognize thatwe are now on track to exceed our initialgoal of 750,000 ounces by 2008 which we set forth just a few months ago. Our vision is now to increase our 2008production target to one million ounceswhich we believe we can achieve from our existing mines and projects being evaluated for development.
Sincerely,
Peter Marrone
President and Chief Executive Officer
March 9, 2006
Y A M A N A G O L D I N C.
41894_txt_p11 3/19/06 4:37 PM Page 11

GROWTHVALUE
12
A n n u a l R e p o r t 2 0 0 5
DELIVERING RESULTSMarking Progress
• Complete construction of São Francisco and Chapada.- São Francisco is expected to commence commercial production in Q2
of 2006. Currently, ore is being stacked on the heap leach pads and the gravity circuit is operational.
- Construction of Chapada is on schedule and mining operations are expected in Q4 of 2006 compared to Q1 of 2007 as originally contemplated.
• Establish new reserves and resources at Fazenda Brasileiro to support additional mine life.- Mine life at Fazenda Brasileiro has an additional 4-6 years at production
levels of 80,000 ounces per year.
• Complete reserve and mine plan update for São Vicente.- Bulk samples at São Vicente suggest grades that will exceed drill indicated
reserve grades. Reserves and resources support a stand-alone mine rather than treating São Vicente and São Francisco on a combined basis as originally contemplated. A feasibility study and reserve estimate is plannedfor 2006. Construction is forecast for 2007 assuming a positive feasibility study.
• Define a stand-alone resource on the Rio Itapicuru Greenstone Belt from one or more deposits.- C1 Santa Luz is one of eight priority targets on the Rio Itapicuru Greenstone
Belt. Assay results to date support the potential for a stand-alone mine.
• Define a stand-alone resource on the Santa Elina Gold Belt.- Ernesto is located on the Company’s 450,000 hectares of mineral claims
on the Santa Elina Gold Belt 65 kilometres from São Francisco. A current drilling program supports the potential for a stand-alone mine.
• Aggressively advance our extensive exploration portfolio.- $15.4 million spent on exploration initiatives during 2005.
41894_txt_p12 3/19/06 4:37 PM Page 12

Gold Production
Targets
(Ozs)
2005 2006E 2007E 2008E
+ 3
50
,00
0
+ 5
50
,00
0
+ 5
75
,00
0
11
2,5
06
Market
Capitalization
(Cdn$ millions)
YAMANAVISION
13
Y A M A N A G O L D I N C.
• Achieve target production from internal growth of at least 750,000 ounces of gold per year by 2008;
• Advance three of its most advanced exploration properties to development;
• Pursue potential acquisition targets that will further increase production targets to 1 million ounces of gold per year within the next three years;
• Increase mine life primarily at Fazenda Brasileiro and São Francisco;
• Continue aggressive exploration of its extensive exploration portfolio; and
• Take advantage of the current strength in the copper market by monetizing a portion of its copper production at robust prices thereby adding to the financial strength of the Company and increasing value to shareholders.
The program is now underway and will continue through to 2008.
OUR STRATEGIC VISION
Includes plans to:
2004 2004 2005
$4
61
.1
$6
20
.6
$1
,57
5.5
*(Feb. 29)
Gold Reserves
and Resources
(Ozs Au)
Proven and probable reservesincluded in total measured and indicated resources.
InferredMeasured and
Indicated
Provenand
Probable
2,5
96,1
00
5,2
34,9
007
,040,2
00
*
*
41894_txt_p13 3/19/06 4:37 PM Page 13

41894_txt_p14 3/19/06 4:37 PM Page 14

Yamana Gold Share Price History
versus S&P/TSX Capped Gold Index
and Gold Price
Cdn $
$11.00
$10.00
$ 9.00
$ 8.00
$ 7.00
$ 6.00
$ 5.00
$ 4.00
$ 3.00
$ 2.00
Gold Price S&P/TSX CappedGold Index
Yamana GoldShare Price
Feb’03
May’03
Aug’03
Nov’03
Feb’04
May’04
Aug’04
Nov’04
Feb’05
May’05
Aug’05
Nov’05
Feb’06
4
3
2
1
0
millions
10
20
Feb’03
May’03
Aug’03
Nov’03
Feb’04
May’04
Aug’04
Nov’04
Feb’05
May’05
Aug’05
Nov’05
Feb’06
TSXVolume(YRI)
AMEXVolume(AUY)
Weekly Share Trading Volumes
(millions)
YAMANAVISION
15
Y A M A N A G O L D I N C.
• Production of 340,000-370,000 ounces at average cash costs of $260-$275 per ounce for 2006 from five operating mines(not including pending acquisition of Desert Sun Mining Corp.).
• Commence commercial production at São Francisco.São Francisco is expected to commence commercial production in Q2 of fiscal 2006.
• Complete construction of Chapada by the end of 2006.Construction of Chapada is expected to be completed during Q4 of fiscal 2006 with commercial production commencing in fiscal 2007.
• Effectively and efficiently integrate operationsof the La Libertad and the San Andrés mines (acquired in February of 2006).
• Compliance with SOX 404 (Sarbanes Oxley).
• Prioritize development of late-stage projects and complete feasibility studies and make construction decision for one or more projects.
• Increase reserves at São Francisco from a current infill drilling and strike extension program to establish a mine life of over ten years.
NEAR-TERM GOALS
41984_txt_p15 3/27/06 2:50 PM Page 15

urable value in a mining company goes well beyond geology. You also need the technical expertise
to produce metals profitably, the experienceto operate efficiently in challenging terrain,and the financial aptitude to take advantageof opportunities as they arise. Finding allthose qualities in a single intermediate-sized company is rare.
Yamana is that company. The Companywas created in 2003 with an ambitious planto turn undervalued Brazilian propertiesinto profitable, producing mining operations. In only two and a half years, we have built a foundation to deliver up to750,000 ounces of gold per year by 2008.
In August 2003, the Company acquired its Brazilian assets, including oneproducing gold mine, Fazenda Brasileiro.We immediately achieved junior gold producer status with annual production of 100,000 ounces. By the end of 2005, the Company had completed constructionof its Fazenda Nova Mine and its São Francisco Mine and commenced construction of its Chapada copper-goldproject.
Unlike many mining companies, we are not reliant on a single major mine. In a region of the world with excellent mineralization and mining infrastructure,we have a portfolio of producing mines,development projects and promising exploration properties.
We have a workforce that is well trained and almost 100% local and we have consistently found ways to processore at lower cost while extending the life of our mines.
Financially, Yamana has successfully and repeatedly raised money in public markets while generating the cash flow tofinance operations and pursue accretiveacquisitions.
Our growth has been both internal andexternal, through increases in productionand, with the recent acquisition of RNCGold Inc. and the pending acquisition ofDesert Sun Mining Corp., by adding minesand exploration properties whose value we can leverage with our expertise. Ourstrategy involves optimizing operations,completing construction of projects, investing in promising exploration areasand through the acquisition of accretiveproperties and projects.
In all the dimensions that matter inmining, Yamana shareholders can see value today and in the future.
HOW YAMANA IS DIFFERENTBeyond Geology
D
GROWTHVALUE
16
A n n u a l R e p o r t 2 0 0 5
41894_txt_p16 3/19/06 4:37 PM Page 16

Production and
Cash Cost Profile(1) Does not include the acquisition of Desert Sun Mining Corp. nor any
production from development stage projects that may advance to production.(2) Copper production is treated on a by-product basis for calculation of
cash costs per ounce beginning in 2007.
(1)(2)
2005 2006E 2007E 2008E
600
500
400
300
200
100
$300
$200
$100
Production(000 oz)
Cash Costs($/oz)
Brazil
Central America
Cash Costs
YAMANAVISION
17
Y A M A N A G O L D I N C.
he acquisition of RNC Gold Inc. in early 2006 strengthens the Company as a fast growing,
intermediate-size gold producer. It’s a steptowards accomplishing its strategic goal of producing 750,000 ounces by 2008. On a financially prudent scale, we are making our first major foray into an adjacent region; leveraging skills, politicalrelationships, and cash flow we have successfully cultivated in Brazil.
The return on our immediate investmentshould be excellent. In RNC, we haveacquired more than 100,000 ounces ofannual gold production at a very low price.The $20 million in cash invested will bepaid back in under two years through operating cash flow from the mines (thedeal also required the issue of $30 millionin shares). By all measures - asset value, cash flow, earnings, reserve and resourceounces in the ground - the acquisition isaccretive to Yamana.
The greater opportunity is to lift these properties onto the next plateau of profitability. With our experience in heap leach systems and hauling saproliticand lateritic material, we believe we cansignificantly improve the cash cost perounce at the existing mines. We also intendto increase exploration, which had beenunderfunded, to open new deposits.
Of the two mines acquired, La Libertadhas deep potential that we may be able totap into given our considerable experience
in underground mining. The San Andrésmine in Honduras produces more than65,000 ounces of annual production. Our initial review indicates that reservescould potentially be doubled.
With the acquisitions of these mines,the Company solidifies an intermediategold producer production profile at theupper end of the intermediate peer group.
The RNC acquisition will immediatelylift us up to approximately 550,000 ouncesby 2007, a rapid and cost-effective upwardmove in a shorter-than-anticipated timeframe, with tremendous upside potential.
The Company will firmly establish itsplace as an intermediate gold producer on the way to becoming a major gold producer, with production of more than 750,000 ounces per year.
LEVERAGING EXPERTISESolidifying our Production Profile
T
41894_txt_p17 3/19/06 4:37 PM Page 17

Brazil
41894_txt_p18 3/19/06 4:38 PM Page 18

ining in any country means making that country your partner. Brazil, for Yamana,
is an excellent partner. Brazil’s geological potential is abundant
yet relatively under-explored. It has one of the world’s ten largest economies and a large industrial base. Infrastructure iswell-developed, including abundant hydro-electric power and efficient transportationnetworks. Quality mining equipment ismade locally. The government permittingprocess is efficient and expedient. Brazil also maintains a strong fiscal and monetary policy, which has inspired theconfidence of international financial markets, business leaders and labourers.
Brazil provides the economic benefits of a developed nation but still has the coststructure of a developing nation.
Mining is culturally embedded in Brazil.Workers are skilled and willing to betrained, labour costs are reasonable, andmanagement potential is high. Of the morethan 1,500 employees who will eventuallywork at Yamana’s new Chapada mine, allbut two will be local, including the mine’smost senior managers.
YAMANAVISION
19
Y A M A N A G O L D I N C.
M
BRAZIL:Made for Mining
Chapada FazendaBrasileiro
Fazenda Nova
São Vicente
São Francisco
BRAZILC1 Santa Luz
41894_txt_r1_p19 3/23/06 4:23 PM Page 19

41894_txt_p20 3/19/06 4:38 PM Page 20

Low-Cost Productionat Fazenda Nova
azenda Nova, the first mine developed by Yamana in Brazil, has been a successful proving ground.
Built in less than 9 months, after a difficultconstruction and early production stage in2004 due to heavy rains and mud, todaythe mine is our lowest-cost operation, providing the highest margins, producinggold at cash costs targeted below $200 perounce. Cash costs for Q4 2005 were wellbelow $200 at $177 per ounce resulting incash costs of $208 per ounce for the periodfrom May 1, 2005 to December 31, 2005.
A portion of that attractive margin isdue to the rethinking of our original estimates. When production began in 2004,it was clear that contractors were profitingmore than anticipated. To reduce costs, we successfully renegotiated supply contracts in 2005, including energy prices.Manpower was also reduced as operatorsgained experience and a smaller workforceproved to be equally productive.
Conveniently, many of the trained construction people were transferred toSão Francisco giving us a head start there.
Fazenda Nova is a short-life mine withapproximately three years of remainingprobable reserves. Given the efficiency of our operations and processing, we anticipate profitably extracting residualgold with a grade as low as approximately0.3 grams per ton.
YAMANAVISION
21
Y A M A N A G O L D I N C.
OPERATIONS AND ACTIVITIESOur Mines and Projects
F
“FAZENDA NOVA, THE FIRST MINE developed by Yamana in Brazil, has been a successful
proving ground.”
Fazenda
Nova
was constructed in less than 9months, at a cost of $6.5 million
41894_txt_p21 3/19/06 4:38 PM Page 21

41894_txt_p22 3/19/06 4:38 PM Page 22

YAMANAVISION
23
Y A M A N A G O L D I N C.
Fazenda
Nova
has life of mine cashcosts of $175 perounce.
FAZENDA NOVA MINE
Location: Located in the State of Goias, it is 10 km west of the town of Fazenda Nova and approximately 225 km west of the state capital of Goiania, offering excellent infrastructure.
Type of deposit: shallow open pit / heap leach mine.
Proven and probable reserves: 92,300 contained gold ounces.
Life expectancy of mine: approximately 3 years.
Life of mine cash costs: $175 per ounce (lower than the $186 per ounce originally contemplated in the feasibility study; assuming current and intermediate term cement costs are sustainable).
Other pertinent facts:• Constructed in less than 9 months, at a cost of $6.5 million from existing cash resources. Construction was
completed and commercial production began in May 2005.• Achieved cash costs of $208 for fiscal 2005.
Fazenda Nova
41894_txt_p23 3/19/06 4:38 PM Page 23

Construction costs for São Francisco at December 31, 2005 were Reais 150.7million and fully financed from existingcash resources.
The most exciting aspect of the projectis not its current numbers but how thosenumbers are likely to be exceeded basedon converting existing resources intoreserves and the coarse gold effect.
The majority of the resources over andabove reserves are along the strike to thenorth and south of the São Francisco openpit mine. An infill drilling program largelyalong strike from the São Francisco Minebegan in 2005.
São FranciscoComing on Stream
When São Francisco achieves commercialproduction in 2006, it will be Yamana’slargest mine. Annual production from São Francisco will add 120,000 to 126,000ounces of gold to Yamana’s forecast 2006production profile, accounting for approximately 35% of total forecast production for this year (forecast includesproduction from the mines acquired from RNC).
Construction of São Francisco began in November 2004 and the mine is onschedule to begin commercial productionduring 2006. By December 2005, a total of 572,000 tonnes of ore had been stackedon the heap leach pads. Commissioning of the crushing and gravity plant began inFebruary 2006. Heap leaching processingcommenced in March 2006. The gravityplant is expected to be operating at 80-100% capacity by the end of March 2006.
GROWTHVALUE
24
A n n u a l R e p o r t 2 0 0 5
41894_txt_p24 3/19/06 4:38 PM Page 24

Proven and probable reserves increasedby 324,000 ounces to 1.4 million contained gold ounces over the last year at São Francisco. Such increase in reservesextends the mine life of São Francisco toapproximately 10 years, representing a twoand a half year increase over the initialmine life at estimated production ratescontemplated in the feasibility study andmine plan. Current resource estimatesinclude 1.7 million ounces of measured and indicated resources plus an addition of 0.9 million ounces of inferred resources.
The coarse gold effect involves goldnuggets of 1 mm or greater and requiressampling in large quantities to better assessthe grade. We performed bulk sampling
YAMANAVISION
25
Y A M A N A G O L D I N C.
“THE GRAVITY PLANT IS EXPECTEDto be operating at 80-100% capacity by the end
of March 2006.”
São Francisco
is on schedule to begincommercial productionduring 2006.
of large tonnages of ore at the project.This usually provides a more accurate representation of reserves than conventionalcore sampling. During 2005, bulk samplesat São Francisco indicated a potentialgrade of ore that is anywhere from 20% to 500% higher than originally anticipated.We have reason to believe the same coarsegold effect exists on other Yamana claimson the Santa Elina Gold Belt. A modestincrease in grade of 20% would significantlyincrease production levels at São Francisco.Furthermore, it could improve cash costs.
41894_txt_p25 3/19/06 4:39 PM Page 25

41894_txt_p26 3/19/06 4:39 PM Page 26

YAMANAVISION
27
Y A M A N A G O L D I N C.
“A MODEST INCREASE IN GRADE of 20% would significantly increase production
levels at São Francisco.”
São Francisco
has an estimated payback of two tothree years.
SÃO FRANCISCO MINE
Location: In the State of Mato Grosso in West Central Brazil, near the Brazilian border with Bolivia. Approximately, 560 km west of the State capital of Cuiaba. It is part of the Santa Elina Gold Belt region where Yamanaholds approximately 450,000 hectares of mineral concessions.
Type of deposit: open pit, gravity/heap leach project.
Proven and probable reserves: Main ore - 1.1 million contained gold ounces; Run-of-mine ore - 283,200 contained gold ounces.
Estimated payback: 2 - 3 years.
Life expectancy of mine: 10 years.
Life of mine operating costs: $3.58 per tonne of ore.
Total expected gold production during life of mine: 1.1 million ounces of recoverable gold, or an average of 109,000 ounces per year.
Approximate average cash cost per ounce of gold life of mine: $210.
Total capital expenditures: $64 million to December 31, 2005.
Other pertinent facts:• Upside potential - significant potential for increased production and/or lower costs due to higher than
mine plan head grades due to coarse gold effect.• Upside potential - upgrading existing resources and finding new resources outside the proposed pit through
infill and along strike extension drilling programs.• Financing - construction was funded by existing resources.• On schedule - Construction began in November 2004 and was completed by the end of fiscal 2005 with
commercial production expected for the second quarter of fiscal 2006. • The crushing circuit is operational and cyanidation commenced in March 2006.
São Francisco
São Francisco is now in production. We will now look forward to productionupside from both the coarse gold effectdemonstrating that the actual grade is higher than the reserve grade and additionally conversion of resources into reserves.
41894_txt_p27 3/19/06 4:39 PM Page 27

41894_txt_p28 3/19/06 4:39 PM Page 28

Smarter Mining at Chapada
Chapada, which will surpass São Franciscoto become Yamana’s largest mine andBrazil’s fourth largest when ready for production in the fourth quarter of 2006,has been exceptionally well planned toyield the best possible cash cost per ounce. The mine is targeted for completion in Q4 of 2006 with a full year of commercialproduction in 2007.
Early in the project, consultants werehired to study and optimize mine efficiency.Road locations were plotted to minimizehaul distances from the mine to the concentrator. To avoid import duties and contain costs, a high percentage
of equipment, parts, and materials weresourced in Brazil.
Of special note is Chapada’s fleet ofBrazilian-made Randon 35-ton ore-haulingtrucks. A dramatically more efficient alternative to the 150-ton trucks traditionally sourced offshore, Randons are one-tenth the cost and haul a set volume of ore using half the fuel comparedto larger trucks. Furthermore, the manufacturer has contracted to buy backthe used trucks after approximately fiveyears enabling Yamana to update the entire Chapada fleet on an ongoing basis.By 2007, there will be 55 Randon truckscontinually in service at the mine.
YAMANAVISION
29
Y A M A N A G O L D I N C.
“CHAPADA WILL SURPASS São Francisco to become Yamana’s largest mine
and Brazil’s fourth largest when ready for
production in the fourth quarter of 2006.”
Chapada
has been exceptionallywell planned to yieldthe best possible cashcost per ounce.
41894_txt_r2 3/27/06 3:13 PM Page 29

Chapada is surrounded by exceptionalinfrastructure and the quality of people we have been able to hire has been outstanding. As production nears, we haveone of the finest management teams inBrazil and a crew of operators that isextremely well trained. Eventually, morethan 1,500 people will be employed atChapada.
By almost all measures, we are outpacing our plan at Chapada. It is aheadof schedule, and ore is being stockpiled.
Our intention is to have an inventory of 27 million tonnes ready when the concentrator starts operating in the fourth quarter of 2006.
Gold production from Chapada isexpected to be approximately 1.3 millionounces of gold over its mine life, of which700,000 ounces of gold is expected in thefirst five years with 365,000 ounces in the first two years alone. Total copper production over the 19 year mine life at Chapada is expected to be 2 billion pounds of copper. Co-mining gold and copper will allow copper production to generate cash flow to finance further gold production and exploration.
GROWTHVALUE
30
A n n u a l R e p o r t 2 0 0 5
“OUR INTENTION IS TO HAVE an inventory of 27 million tonnes ready when the
concentrator starts operating in the fourth quarter
of 2006.”
Chapada
is expected to produce2 billion pounds of copper over its 19 year mine life.
41894_txt_p30 3/19/06 4:39 PM Page 30

CHAPADA PROJECT
Location: In the northern part of the state of Goias, approximately 320 km northof the state capital of Goiania and 270 km northwest of the national capital of Brasilia.
Type of deposit: flat-lying, open pit.
Proven and probable reserves: 2.5 million contained ounces of gold and 2.3 billion contained pounds of copper.
Estimated payback: 2 years (after-tax basis).
Life expectancy of mine: 19 years.
Average amount of copper/gold concentrate per year for first 5 years:225,000 tonnes.
Total expected gold production during life of mine: 1.3 million ounces.
Total expected copper production during life of mine: 2 billion pounds.
Total capital requirements: Reais 533 million before working capital requirements.
Approximate average cash costs (co-product basis):Gold: $140 per ounce for first 5 years and $185 per ounce life of mine.Copper: $0.57 per pound for first 5 years and $0.68 per pound life of mine.
Other pertinent facts:• High-grade starter - The high grade starter pit, with a head grade of 0.459% copper and 0.428 g/t gold, is
expected to produce approximately 225,000 tonnes of concentrate averaging 28% copper and 20 g/t gold annually. This translates into approximately more than 130 million pounds of copper and 134,000 ounces of gold annually over the first five years.
• Financing - Initial working capital is expected to be $11.0 million during the first year of production and is expected to be funded from operating cash flow. During 2004, Yamana obtained a $100 million loan facility for the project. Draw down on the facility occurred in 2005. The financing is in the form of a six-year secured credit facility with a one-time payment on maturity. Additional capital required for the development of Chapada will be funded from Yamana’s treasury.
• On time and budget in local currency terms - Construction at Chapada began in November 2004 and procurementcontracts for the development are on schedule. Delivery of the fleet of mining trucks, mine excavators and blast-holedrill rigs was completed. Contracts for the delivery of a high power transmission line, installation of the mechanicaland electrical equipment and fabrication and delivery of structural steel have been awarded. Construction of the tailings dam, drainage system and primary crusher is complete and civil construction is near completion. Started the erection of the structural steel for the concentrate storage building. In addition, detailed engineering at the project is advancing and negotiations for the SAG and ball mills are in advanced stages.
YAMANAVISION
31
Y A M A N A G O L D I N C.
Chapada
41894_txt_p31 3/19/06 4:40 PM Page 31

n 2005, we invested more than $15 million in three areas with excellent potential: the Santa Elina Gold Belt,
Rio Itapicuru Greenstone Belt, andFazenda Brasileiro Near Mine. The emphasis is on brownfield development in regions where we are already on theground and have a strong understanding of the geology.
Santa Elina Gold Belt - Regional Exploration
We continue to see tremendous potentialalong the entire Santa Elina Gold Belt, a crustal shear zone extending over 600 kilometres. Along the most promising200 kilometres explored to date - whichyielded 2.25 million ounces in the 1800s - there are 38 known gold deposits. Coarse free gold, well suited to mining andprocessing, remains in the rocks. Yamanacontrols approximately 450,000 hectares of mineral concessions in the area, whichhas good access and infrastructure.
São Francisco
São Francisco, our newest mine sits on the Santa Elina Gold Belt with significantupside in potential grade increases, potential north and south pit extensions,and the conversion of resources to reservesat depth. Bulk samples taken in 2004 and2005 in nine trenches and one shaft haveshown meaningful gold grade increases of20% to 500% above drilled grades. (A 20%increase in assumed grade could increase the project’s net present value (NPV) byapproximately 75%). Drilling at depth hasshown that many significant high-gradeintercepts occur at depths below theplanned pit bottom. Resources below thecurrent level of the pit are approximately435,000 ounces of gold, including 119,000
GROWTHVALUE
32
A n n u a l R e p o r t 2 0 0 5
EXPLORATION Upside from increases in reserves and resources
I
0 10 20
km
Proterozoic AguapeiGroup - meta-arenites
Greenstone belt
Archean basementgranites-volcanics-sediments
Santa Elina exploration and mining claims -7,482 sq km
São Vicente Mine
São Francisco Project
Lavrinha-Ernesto
Vila bela
Pontes e Lacerda
Jauru
GP-3GP-4
Santa
Barb
ara
Rid
ge
São Vicente R
idge
BRAZILBOLIVIA
BR-174
BR-174
N
Santa Elina Gold Belt
BRAZIL
Sao Paulo
Santa ElinaGold BeltBolivia
Paraguay
41894_txt_p32 3/19/06 4:40 PM Page 32

SE NW
ErnestoProject
São FranciscoDeposit
São VicenteDeposit
São VicenteRidge
0 5 10
km
Pontes e Lacerda
uppermineralizationlower
mineralizationPapagaioGarimpo
SarareRiver
possible lowermineralization
uppermineralizationSarare
Garimpo
Aquapei group
Granite intrusion
Basement rocks
Gold mineralization
Plunge of folds
Santa Elina Gold Belt - Longitudinal Section
ounces at high-grade. Gold occurs as freegold even at depth. Given the topography,this represents a potential undergroundmining opportunity.
Longa Vida target, a one km long breccia-quartz vein system near SãoFrancisco deposit, yielded bulk sampleresults from 0.32 g/t Au up to 3.03 g/t Auin six trenches. A follow-up drilling program of 1,682 metres in 15 inclinedholes returned low grade results probablydue to the coarse gold effect in drill coresampling, which must be confirmed byunderground bulk sampling.
• Geology: epigenetic, hydrothermal
vein-type mineralization in
Proterozoic sediments, coarse
gold
• 104 holes/10,231 metres infill drilling
to upgrade 324,000 contained
ounces of gold resources into
reserves in 2005, increasing the
M&I resources to 1.65 million
contained ounces
• bulk sampling and 1,682 metres
of drilling at Longa Vida, a near
mine drill target
YAMANAVISION
33
Y A M A N A G O L D I N C.
“THE EMPHASIS IS ON BROWNFIELD DEVELOPMENT in regions where we are already on the ground and have a strong
understanding of the geology.”
41894_txt_p33 3/19/06 5:45 PM Page 33

SW NESão
VicenteDome Longa
Vida
São Francisco Esperança
Silica breccias
Green sericite - fluid flow pathway
Gold mineralization
Metapelite
Metaconglomerate
Basement rocks
São Vicente Ridge - Cross Section
São Vicente
São Vicente is also yielding unexpectedlyincreased reserves and resources. One of the original assets acquired by Yamana in 2003, it appeared then to be a fairlymodest open-pit operation. Since then, wehave discovered increases in the potentialof the Deep South deposit and of open-pitresources with new mineralization discovered below the northern pit.
From the Deep South drift, 86 bulksamples weighing an average of 21 tonneswere processed in a pilot plant, returning an average grade of 2.74 g/t Au, comprisingof a 200 metre long interval averaging 4.00 g/t Au and a 350 metre interval at 2.18 g/t Au.
A program of surface drilling, drift excavation and bulk sampling and underground drilling from drill stationsestablished from the drift and extendinginto the orebody began earlier in 2005 todetermine the merits of larger potential at São Vicente. Based on geological modeling and resource estimation, we have growing confidence that São Vicentewill become a stand-alone project.
São Vicente has a significant coarse gold effect similar to São Francisco.Evidence from bulk samples to date suggest grades that will exceed drill indicated reserve grades.
With exploration, São Vicente’s potential continues to grow.
GROWTHVALUE
34
A n n u a l R e p o r t 2 0 0 5
São Vicente
added 309,000 contained ounces of gold to open pitreserves in 2005.
41894_txt_p34 3/19/06 4:40 PM Page 34

• Geology: epignetic, hydrothermal
vein-type mineralization in
Proterozoic sediments
• 28 holes/3,318 metres underground
drilling in 2005
• 931 metre drift/bulk sampling
in 2005
• 36 holes/9,165 metres to investigate
high-grade mineralization in the
basement
• 309,000 contained ounces of gold
added to open pit reserves in 2005,
increasing the M&I basis to 660,000
contained ounces
-Development plan: feasibility
study including new reserve
estimate in April 2006 and
construction late Summer 2007
(assuming a positive feasibility
study)
YAMANAVISION
35
Y A M A N A G O L D I N C.
“WE HAVE DISCOVERED INCREASES in the potential of the Deep South deposit and of
open-pit resources with new mineralization discovered
below the northern pit.”
41894_txt_p35 3/19/06 4:40 PM Page 35

00400 mm
300 m
200 m
100 m
L-70 L-210 L-350 L-490 L-630 L-910 L-1120
FE 26
FE 40 FE
38 ER 07 ER
11 ER 10 ER
03 ER 12 ER
19ER 09 ER
13 ER 18
0 70 140
m
300 m
200 m
100 m
1.7 @ 3.08 g/t
Metarenite
Metaconglomerate
Tonalite
Lower trap
Quartz vein/reef
Gold intersection (m/g/t)6.8 @ 12.57 g/t
4.9 @ 14.76 g/t
10 @ 6.72 g/t 5 @
3.03 g/t
6 @6.38 g/t
1 @0.86 g/t
5 @4.15 g/t
6.58 @12.57 g/t 3 @
6.75 g/t 1 @ 0.39 g/t 2 @
0.13 g/t
3 @ 0.05 g/t
Ernesto - Longitudinal Drilling Section
Ernesto
The Ernesto property is located in thesouthern portion of the Gold Belt, and thegold mineralization is associated with lowangle shear zones at the base of the pile of metasediments in the contact with thevolcano-sedimentary basement.
Resource estimates at Ernesto demonstrate measured and indicatedresources of 842,000 tonnes at 5.24 g/t Auwith 141,800 ounces of gold and aninferred resource of 483,000 tonnes at 4.6 g/t Au with 71,400 ounces of gold. These resources suggest Ernesto has the potential to be a high-grade very shallowunderground mine. Advantageously,Ernesto is close to existing infrastructureand is approximately 60 kilometres South of São Francisco.
While current mine plans contemplate a stand-alone mine and plant for each ofSão Francisco, São Vicente and Ernesto,certain administrative, accounting, supplychain and personnel functions would becarried out at Pontes e Lacerda, a nearbytown of 45,000 people, thereby reducingG&A costs for all these operations.
• Geology: epigenetic, hi-grade
mineralization, low-angle regional
detachment fault zone
• 64 holes/11,128 metres drilling
in 2005
• 141,800 contained ounces of
gold grading 5.24 g/t Au as M&I
resources, and additional 483,000
tonnes grading 4.60 g/t Au as
inferred resources
• Development plan - pre-feasibility
study late 2006; Construction
early 2008 (assuming a positive
feasibility study)
GROWTHVALUE
36
A n n u a l R e p o r t 2 0 0 5
41894_txt_r1_p36 3/23/06 4:23 PM Page 36

YAMANAVISION
37
Y A M A N A G O L D I N C.
Rio ItapicuruGreenstone Belt
Rio Itapicuru is a major 8,000 square-kilometre greenstone belt with numerouswidespread gold occurrences. Yamanaalready mines the one major deposit foundto date: Fazenda Brasileiro, with historicalproduction of 2 million ounces. In addition,we control 197,000 hectares of explorationand mining rights. In 2005, using sophisticated exploration technologies such as deep-structures analysis, spectral analysis, and stratigraphy, our explorationprogram resulted in significant intersections being identified.
C1-Santa Luz
C1 Santa Luz is a breccia-hosted golddeposit structurally controlled by a majorreverse listric-detachment fault that formsa continuous mineralized layer that dipsdownward at 35-55 degrees. Located nearMaria Preta which was a series of open pitheap leach operations before the Companyacquired the area and began exploration, it is one of eight priority targets on theItapicuru Greenstone Belt at 60 kilometresnorth of Fazenda Brasileiro.
Based on the results of a scoping studycompleted in December 2005, we continueto believe this deposit will support a stand-alone mine. Resource estimation andmetallurgical testwork is now underway.
“YAMANA ALREADY MINES THE ONE major deposit found to date, Fazenda Brasileiro,
with historical production of 2 million ounces.”
Rio Itapicuru
is a major 8,000square-kilometregreenstone belt withnumerous widespreadgold occurrences.
41894_txt_p37 3/19/06 4:40 PM Page 37

GROWTHVALUE
38
A n n u a l R e p o r t 2 0 0 5
The conceptual mine plan contemplates a stand-alone mine and plant although certain administrative, accounting and personnel functions would be carried out at Fazenda Brasileiro thereby reducingoperating costs at C1 Santa Luz.
C1-Santa Luz
Plan view of indicated resources
and drilling executed in 2005
IndicatedResource
Area
0 200
metres
20m @ 3.85 g/t(433m deep)
• Geology: breccia-hosted gold deposit
• 50 holes/8,800 metres drilling
in 2005
• 982,400 contained ounces of gold
as M&I resources, and additional
2 million tonnes grading 3.09 g/t Au
as inferred resources
• Development Plan: Feasibility
study mid 2006 and construction
summer of 2007 (assuming a
positive feasibility study)
“WE CONTINUE TO BELIEVE C1-Santa Luz will support a stand-alone mine.
Resource estimation and metallurgical testwork
is now underway.”
41894_txt_p38 3/19/06 4:41 PM Page 38

YAMANAVISION
39
Y A M A N A G O L D I N C.
FAZENDA BRASILEIRO MINE
Location: Located 220 km northwest of the Bahia State capital of Salvador.
Type of deposit: underground mine.
Proven and probable reserves: 187,400 contained gold ounces; open pit - 19,300 contained gold ounces.
Life expectancy of mine: 4 - 6 years at production levels of 80,000 ounces per year.
Other pertinent facts:• Upside potential - potential for increased mine life from increases in reserves.• Currently mining through lower grade material to ramp down access to higher grade orebodies and areas
beneath the existing mine workings for further drilling and exploration.• Mining of the C-Quartz orebody commenced late in the fourth quarter of 2005 and is expected to account for
approximately 20% of ore production in 2006 at grades that exceed current grade levels.• Strong operations team with more than 14 years of operating experience.
Fazenda Brasileiro Near Mine
Yamana’s Fazenda Brasileiro mine (withinthe Rio Itapicuru Greenstone Belt) hasproven and probable reserves of 2.32 million tonnes of ore containing 206,000ounces of gold and measured and indicatedresources of 444,200 contained ounces.Inferred resources in two extendeddeposits - C-quartz and E-deep - couldtotal 780,000 tonnes at an even highergrade.
At Fazenda Brasileiro, an older mineacquired by Yamana in 2003, we have compensated for gradually declining production by extending reserves throughexploration. Fazenda Brasileiro ended 2005with measured and indicated resources(including reserves) of 444,200 containedounces plus inferred resources of 107,000contained ounces.
The future of the mine is a promisingextension called “E Deep.” Original estimates from core samples showed
2.5-3.0 grams per ton. We are now seeingsignificantly better grades and believe E-Deep could offer more than the 150,000-200,000 ounces we anticipated,thus potentially extending the four yearmine life currently projected.
The next exploration frontier, a quartzvein structure we have named “C-Quartz,”could add even more years to FazendaBrasileiro. Large pockets of gold-bearingmaterial are present, although less predictable. With intensive drilling and geological modeling we intend to findthem. Conservatively, C-Quartz could contribute up to 2,000 ounces per month.
• Geology: lode gold deposit
• Replacement of mined reserves in
2005, increasing the M&I resources
basis to 444,000 contained ounces
of gold, and additional 780,000
tonnes grading 4.28 g/t Au as
inferred resources
FazendaBrasileiro
41894_txt_r1_p39 3/23/06 4:23 PM Page 39

41984_txt_p40 3/25/06 11:27 AM Page 40

YAMANAVISION
41
Y A M A N A G O L D I N C.
These are the Yamana
environmental, health
and safety principles:
1. To reduce pollution and environmental, health and safety risks and obey all applicable environmental, health, and safety laws wherever we operate.
2. To develop efficient, safer, and pollution-minimizing technology, and to maximize environmental protection with technologies that improve our processes, products, and the services of our suppliers and contractors.
3. To train, educate, and motivate employees and contractors to work safelyand in an environmentally responsible manner.
4. To create a healthy and safe working environment and make it the responsibility of all employees and consultants to maintain it.
5. To establish environmental, health and safety objectives and goals, and ensure they are periodically reviewed and improved.
6. To actively encourage our suppliers and contractors to have environmental, healthand safety policies, and to consider the expectations of clients, employees, shareholders, and the community.
7. To build and operate facilities according to international standards for environmental compliance.
All Yamana personnel are trained to gobeyond compliance to prevent accidents.Training begins when an employee is hired.All employees are reviewed periodically bypeers. To ensure that standards are met andprotocols improved, we do regular health andsafety compliance reviews and simulations of various health and safety related events.
We believe in continuous learning. In2005, our general manager at FazendaBrasileiro travelled to Chile to study theequipment, maintenance, and training procedures at several open-pit operations.
To emulate best practices, we intend tobegin the certification program for ISO18000 as it relates to health and safety. While this is not required by law in the areasin which we operate, voluntary compliance is the right thing to do.
These were the highlights of our health,safety, and environmental performance in2005:
• ISO 14001 certification achieved at Fazenda Brasileiro
• ISO 14001 compliance at São Francisco
• Working toward ISO 14001 certification at Chapada
• Budgeted for NOSA implementation at São Francisco in 2006
• Over 200 consecutive accident-free days at Fazenda Brasileiro
ENVIRONMENTAL, HEALTH AND SAFETYBeyond Compliance
41894_txt_p41 3/19/06 4:41 PM Page 41

RESERVES &
RESERVES AND RESOURCES December 31, 2005
Mineral Reserves (Proven and Probable)
Proven Reserves Probable Reserves
Tonnes Grade Contained Tonnes Grade Contained(000’s) (g/t) oz. (000’s) (000’s) (g/t) oz. (000’s)
GoldFazenda Brasileiro - U/G 1,100 3.100 109.9 969 2.490 77.5 Fazenda Brasileiro - O/P 249 2.420 19.3 – – –
Total Fazenda Brasileiro 1,349 2.979 129.2 969 2.487 77.5 C1-Santa Luz – – – 9,200 1.880 556.0 Fazenda Nova – – – 3,330 0.862 92.3 São Francisco - Main Ore 7,830 1.21 303.6 19,661 1.23 775.6 São Francisco - ROM Ore 12,291 0.23 92.5 24,224 0.25 190.8
Total São Francisco 20,121 0.61 396.1 43,885 0.68 966.4 São Vicente - Main Ore 6,101 1.23 241.8 3,356 1.11 119.5 São Vicente - ROM Ore 9,106 0.23 68.3 5,322 0.24 40.3
Total São Vicente 15,207 0.63 310.2 8,678 0.57 159.8 Chapada 18,379 0.33 194.4 292,135 0.25 2,353.1
Total Gold Reserves 55,056 0.58 1,029.8 358,197 0.37 4,205.1
Tonnes Grade Contained Tonnes Grade Contained(000’s) (%) lbs (mm) (000’s) (%) lbs (mm)
CopperChapada 18,379 0.42% 169.6 292,135 0.34% 2,180.1
Mineral Resources (Measured, Indicated and Inferred) (Measured and Indicated include Reserves as outlined above)
Measured Resources Indicated Resources
Tonnes Grade Contained Tonnes Grade Contained (000’s) (g/t) oz. (000’s) (000’s) (g/t) oz. (000’s)
GoldFazenda Brasileiro - U/G 1,158 3.14 116.9 2,722 2.99 261.2 Fazenda Brasileiro - O/P 249 2.42 19.3 937 1.55 46.8
Total Fazenda Brasileiro 1,407 3.01 136.2 3,658 2.62 308.0 C1-Santa Luz – – – 18,400 1.66 982.4 Fazenda Nova – – – 4,226 0.84 114.2 São Francisco - Main Ore 9,142 1.22 358.2 23,360 1.24 929.1 São Francisco - ROM Ore 15,255 0.23 113.0 32,213 0.24 250.2
Total São Francisco 24,398 0.60 471.2 55,574 0.66 1,179.3 São Vicente - Main Ore 7,669 1.19 292.2 5,424 1.12 194.5 São Vicente - ROM Ore 13,117 0.23 95.4 10,804 0.23 78.4
Total São Vicente 20,786 0.58 387.6 16,228 0.52 272.9 Ernesto 160 5.26 27.1 682 5.23 114.7 Chapada 25,200 0.30 243.1 396,200 0.22 2,802.4
Total Gold Resources 71,951 0.55 1,265.2 494,969 0.36 5,773.8
Tonnes Grade Contained Tonnes Grade Contained(000’s) (%) lbs (mm) (000’s) (%) lbs (mm)
CopperChapada 25,200 0.34% 188.9 396,200 0.30% 2,620.4
Mineral Reserves Mineral Resources Date Report
Fazenda Brasileiro Geoexplore Consultoria e Serviços Ltd. Geoexplore Consultoria e Serviços Ltd. Jan-06 Mineral Reserves and Resources UpdateC1-Santa Luz NCL Chile, NCL Brasil Ltda., Moreno&Associados Nov-05 Preliminary Assessment Study
Rezende Engenharia Feb-06 Resource Estimate UpdateChapada Independent Mining Consultants Inc. Independent Mining Consultants Feb-06 Chapada Reserve Update
Feb-04 Feasibility Study (mineral resource)São Francisco NCL Brasil Ltda. Geosystems International Feb-06 Mineral Reserve Update and Resource
Model UpdateSão Vicente NCL Brasil Ltda. Geosystems International Feb-06 Mineral Reserve Update and Resource
Model UpdateErnesto – NCL Brasil Ltda. Feb-06 Mineral Resource EstimateFazenda Nova NCL Brasil Ltda. Moreno&Associados Feb-06 Reserve Estimate Update
GROWTHVALUE
42
A n n u a l R e p o r t 2 0 0 5
41894_txt_r1_p42 3/23/06 4:23 PM Page 42

RESOURCES
Total - Proven and Probable
Tonnes Grade Contained(000’s) (g/t) oz. (000’s)
2,069 2.817 187.4 249 2.412 19.3
2,318 2.773 206.7 9,200 1.880 556.0 3,330 0.862 92.3
27,491 1.22 1,079.2 36,515 0.24 283.2
64,006 0.66 1,362.4 9,457 1.19 361.3
14,428 0.23 108.7
23,885 0.61 470.0 310,514 0.26 2,547.5
413,253 0.39 5,234.9
Tonnes Grade Contained(000’s) (%) lbs (mm)
310,514 0.34% 2,349.7
Total - Measured and Indicated Inferred Resources
Tonnes Grade Contained Tonnes Grade Contained(000’s) (g/t) oz. (000’s) (000’s) (g/t) oz. (000’s)
3,880 3.03 378.1 780 4.28 107.4 1,185 1.73 66.1 – – –
5,065 2.73 444.2 780 4.28 107.4 18,400 1.66 982.4 2,013 3.09 199.7
4,226 0.84 114.2 95 0.50 1.5 32,503 1.23 1,288.3 11,891 1.43 546.7 47,469 0.24 363.2 48,604 0.21 332.4
79,971 0.64 1,651.5 60,495 0.45 879.1 13,093 1.16 486.6 1,887 1.40 84.9 23,921 0.23 173.9 3,771 0.22 26.1
37,015 0.56 660.5 5,658 0.61 111.0 842 5.24 141.8 483 4.60 71.4
421,400 0.22 3,045.5 250,870 0.15 1,226.0
566,920 0.39 7,040.0 320,395 0.25 2,596.1
Tonnes Grade Contained Tonnes Grade Contained(000’s) (%) lbs (mm) (000’s) (%) lbs (mm)
421,400 0.30% 2,809.3 250,870 0.25% 1,393.7
YAMANAVISION
43
Y A M A N A G O L D I N C.
Mineral Reserves and ResourcesChapada’s inferred resources were taken from a MiconInternational Limited NI 43-101 compliant technicalreport dated July 2003. Independent Mining Consultantsestimated Chapada’s inferred resources in their reportdated February 2004 at 68 million tonnes grading 0.14 g/t gold and 0.2% copper. Mineral reserve andresource estimates presented were prepared by or underthe supervision of external consultants as indicated in the table below in accordance with NI 43-101. In estimating the mineral reserves and mineral resources,such persons made assumptions, and used parametersand methods appropriate for each property, and verifiedthe data disclosed, including sampling, analytical and test data underlying such estimates. These externalreserve reports have been reviewed by Evandro Cintra,Vice-President Exploration as “qualified person”, as that term is defined in NI 43-101.
These figures are estimates, however, and no assurance can be given that the indicated amounts of quantities of gold will be produced. Gold price fluctuations may render mineral reserves containing relatively lower grades of gold mineralization uneconomic. Moreover, short-term operating factorsrelating to the mineral reserves could affect theCompany’s profitability in any particular accounting period. The corporation is not aware of any environmental, permitting, legal, title, taxation, socio-political, marketing or other relevant issues whichmay materially affect the Corporation’s mineral reserveand resource estimates, other than factors discussedabove and in “Risks and Uncertainties” in theManagement’s Discussion and Analysis section of the annual report.
Mineral Reserve Mineral ResourcesMine Cut-off Grade Gold Copper Cut-off Grade
(g/t gold; % copper) Price Price (g/t gold; % copper)
Fazenda Brasileiro 1.5 US$425 n/a 1.5C1-Santa Luz 0.5 US$425 n/a 0.5 and 1.5 (1)
Chapada $2.20 (2) US$425 US$1.00 0.15% (3)
São Francisco 0.40 and 0.13 US$425 n/a 0.40 and 0.13São Vicente 0.44 and 0.11 US$425 n/a 0.44 and 0.11Ernesto – US$425 n/a 1.5Fazenda Nova 0.24 US$500 n/a 0.24
(1) 0.5 g/t cutoff for indicated resource and 1.5 g/t cutoff for inferred resource (underground mine potential)(2) Internal NSR cutoff vs grade cutoff used.(3) copper equivalent = [copper (%) + 0.56 x gold (g/t)]
41894_txt_r1_p43 3/23/06 4:24 PM Page 43

41894_txt_p44 3/20/06 2:50 PM Page 44

YAMANAVISION
45
Y A M A N A G O L D I N C.
MANAGEMENT’S DISCUSSIONAND ANALYSIS OF OPERATIONSAND FINANCIAL CONDITION
YAMANAMD&A
Table of Contents
1. Core Business 462. Change in Year End 463. Highlights 464. Subsequent events - Acquisitions 475. Overview of Financial Results 486. Mine Operations 537. Liquidity and Capital Resources 598. Capitalization 629. General and Administrative Expenses 64
10. Foreign Exchange 6411. Investment Income and Currency Hedging 6512. Income Taxes 6513. Closure and Reclamation Costs 6614. Contractual Commitments 6715. Related Party Transactions 6716. Contingency 6717. Fourth Quarter Analysis 6718. Critical Accounting Policies and Estimates 7119. Construction Project 7220. Off-take Agreements 7321. Hedging Program 7422. Off-Balance Sheet Arrangements 7523. Reserve Estimates 7524. Exploration and Development 7725. Sale of Argentine Assets 7926. Outlook and Strategy 7927. Depletion and Impairment of Mineral Properties 8128. Risks and Uncertainties 8129. Disclosure Controls and Procedures 82
Cautionary Note Regarding Forward-Looking Statements 83
Non-GAAP Measures 84
A cautionary note regarding forward-looking statements and non-GAAP measures follows this Management’s Discussion and Analysis of Operations and Financial Condition.
(US dollars, in accordance with Canadian GAAP)
41894_fin_p45 3/22/06 1:56 PM Page 45

1. Core Business
Yamana Gold Inc. is engaged in the acquisition, exploration and development, and operation ofmineral properties. Revenue and cash flow from operations is currently generated from the saleof gold bullion. Future revenues and cash flows will include the sale of copper concentrate fromits Chapada copper-gold mine which is currently under construction. To date, the Company’sactivities have been concentrated in Latin America.
2. Change in Year End
In May 2004, the year end of the Company was changed from February 28/29 to December 31.As such, the current fiscal year is for the twelve month period ended December 31, 2005 withcomparative figures for the ten month period ended December 31, 2004.
3. Highlights
Significant achievements during the year include:
• Cash balance of $151.6 million as at December 31, 2005. • Cash flow from operations of $6.4 million before changes in non-cash working capital
items and cash flow from operations of $3.4 million after a reduction in non-cash working capital items of $3 million.
• Achieved average cash costs of $289 per ounce from its Fazenda Nova and FazendaBrasileiro mines.
• Commenced commercial production at its Fazenda Nova mine. • Commenced the start-up of mine operations at its São Francisco mine.• Ahead of schedule with the construction of its Chapada copper-gold project. • Raised gross proceeds of $49.6 million from the early exercise of its publicly traded
warrants that otherwise would not have been available to the Company until July 2008.• Raised $105.3 million in net proceeds from the public issue of 26 million common shares.• Drew down on debt financing in the amount of $100 million for the construction of the
Chapada copper-gold project. • Entered into smelter off-take agreements for 150,000 tonnes of copper concentrate
from its Chapada copper-gold project currently under construction.• Initiated a copper hedging program that is intended to help secure a less than two year
payback at its Chapada copper-gold project.• Pursued the purchase of RNC Gold Inc. whereby the Company acquired two additional
mines: San Andrés and La Libertad bringing total forecast gold production up to morethan 500,000 ounces by 2007. The transaction was approved by RNC Gold Inc.shareholders on February 17, 2006, received court approval on February 22, 2006 and closed February 28, 2006.
• Advanced three projects through exploration to the point where they now each have the potential to become our next new mine.
• Increased proven and probable reserves by 1.2 million ounces.• Continued drilling and the development of E-Deep at the Fazenda Brasileiro mine
to further define and expand the size of the orebody.
GROWTHVALUE
46
A n n u a l R e p o r t 2 0 0 5
41894_fin_p46 3/22/06 1:56 PM Page 46

4. Subsequent events - Acquisitions
RNC Gold Inc.
On December 4, 2005, the Company announced transactions which provided for theacquisition of RNC Gold Inc. (“RNC”) and 100% of the San Andrés gold mine in Honduras. The total purchase price for these transactions was approximately $52 million, comprised of approximately 5.7 million Yamana common shares (0.12 of a common share for each RNC share) and other transaction costs and adjustments. Additionally, the Company paid $18.9 million in cash for the purchase of the San Andrés Mine.
The addition of San Andrés in Honduras and La Libertad in Nicaragua to the Company’sexisting operations will increase gold production by 120,000 per year bringing total forecast goldproduction to approximately 500,000 to 550,000 ounces by 2007 and up to 650,000 ounces by2008. The Company also acquired development stage properties including Cerro Quema inPanama. The Company recorded the RNC transaction in accordance with the purchase methodof accounting for acquisitions under Canadian generally accepted accounting principles. As such,assets acquired and liabilities assumed under the transaction will be recorded by the Company at their fair market values as of the date of acquisition, February 28, 2006.
Subsequent to the year end, on February 17, 2006 the shareholders of RNC Gold Inc.approved the transaction and all necessary regulatory and court approvals were obtained. The transaction closed on February 28, 2006.
Desert Sun Mining
On February 22, 2006, the Company entered into an arrangement agreement with Desert Sun Mining Corp. which owns the Jacobina gold mine in the Bahia state of Brazil nearthe Company’s Fazenda Brasileiro mine and its C1 Santa Luz pre-feasibility project.
The acquisition will be completed by way of a court approved Plan of Arrangementwhereby each Desert Sun Mining common share will be exchanged for 0.6 of a Yamana commonshare. All Desert Sun Mining options and warrants will become exercisable for common sharesof the Company based on the exchange ratio. As a result of the proposed transaction, thecombined company would be held approximately 76% by existing Yamana shareholders and 24%by existing Desert Sun Mining shareholders. The total number of Yamana common sharesoutstanding would be approximately 262.1 million, calculated on a pro-forma basis after givingeffect to the Company’s acquisition of RNC Gold Inc.
Cash costs of the combined company are projected at $270 per ounce of gold in 2006,with $125 and $115 per ounce of gold projected for 2007 and 2008, respectively. Projected cash costs assume copper will be treated as a by-product credit.
The Company’s total measured and indicated resources based on information known at the time of announcement comprised of approximately 11.6 million ounces of measured andindicated resources including 7.6 million of proven and probable reserve gold ounces. Provenand probable copper reserves would be approximately 2.3 billion pounds. Inferred gold resources total 6.1 million ounces.
Taking into consideration the Company’s updated reserves and resources as at December 31,2005, following the Desert Sun acquisition, the Company would have measured and indicatedresources of approximately 12.1 million ounces of which 8.1 million ounces would be proven andprobable. Inferred resources would total 6.4 ounces and copper reserves would be 2.35 billionpounds.
In addition to the upside in the production profile of the Company, the transaction wouldfacilitate operational and administrative synergies, and broaden shareholder base and increasesto share liquidity.
YAMANAVISION
47
Y A M A N A G O L D I N C.
41894_fin_p47 3/22/06 1:57 PM Page 47

The transaction is subject to all requisite regulatory and court approvals, Desert Sunshareholder approval, third party consents and other conditions customary in transactions of this nature. The combination must be approved by at least two-thirds of the votes cast byshareholders of Desert Sun. The transaction is expected to close during the second quarter of2006. If the combination does not occur under certain circumstances, Desert Sun has agreed to pay the Company a break-fee of C$21.5 million.
5. Overview of Financial Results
The table below presents selected financial data for the Company’s three most recentlycompleted fiscal years:
December 31, December 31, February 29,2005 2004 2004
(ten months)
Financial Results(in thousands of dollars)
Revenues 1 $ 46,038 $ 32,298 $ 19,811 Mine operating earnings 4 $ 8,569 $ 10,377 $ 6,754 Net earnings (loss) 2 $ (4,111) $ 2,783 $ 1,008 Adjusted net earnings 3 $ 1,991 $ 2,696 $ 1,788Cash flow from operations $ 3,410 $ 8,536 $ 5,491
(before changes in non-cash working capital items)Cash flow from operations 3 $ 6,445 $ 9,293 $ 4,953
(after changes in non-cash working capital items)
Per share financial resultsBasic (loss) earnings per share 2 $ (0.03) $ 0.03 $ 0.02 Diluted (loss) earnings per share 2 $ (0.03) $ 0.02 $ 0.02Adjusted earnings per share 3 $ 0.01 $ 0.03 $ 0.04
Financial position(in thousands of dollars)
Total assets $465,697 $ 177,106 $ 93,948Total long-term liabilities $119,281 $ 9,572 $ 7,657
GROWTHVALUE
48
A n n u a l R e p o r t 2 0 0 5
41894_fin_p48 3/22/06 1:57 PM Page 48

December 31, December 31, February 29,2005 2004 2004
(ten months)
Gold Production (ounces)Pre-CommercialFazenda Nova 7,379 2,849 – São Francisco pilot plant 4,843 3,214 283
12,222 6,063 283
CommercialFazenda Brasileiro 74,570 78,168 56,794Fazenda Nova 28,780 – –
103,350 78,168 56,794
115,572 84,231 57,077
Gold Sales (ounces)CommercialFazenda Nova 4,694 1,704 – São Francisco pilot plant 4,050 2,883 –
8,744 4,587 –
CommercialFazenda Brasileiro 72,074 79,822 49,989Fazenda Nova 31,698 – –
103,772 79,822 49,989
112,516 84,409 49,989
Non-GAAP Measures 3
Per ounce data:Cash costs per ounce produced 4
Fazenda Brasileiro $ 320 $ 205 $ 208Fazenda Nova $ 208 $ – $ –
$ 289 $ 205 $ 208
Average gold price realized $ 448 $ 409 $ 396Average gold spot price $ 445 $ 409 $ 372
Operating statisticsGold ore grade (g/t)Fazenda Brasileiro 2.44 3.13 3.42Fazenda Nova 0.87 – –
Gold recovery rate (%)Fazenda Brasileiro 89.3 91.9 95.5Fazenda Nova 81.0 – –
(1) Revenues consist of sales net of sales taxes. Revenue per ounce data is calculated based on gross sales.(2) Net (loss) earnings, basic (loss) earnings per share and diluted earnings per share for the year ended December 31, 2005
include an unrealized non-cash loss on commodity contracts of $8.6 million. (3) Non-GAAP measure – see reconciliation table below. A cautionary note of non-GAAP measures follows this Management’s
Discussion and Analysis of Operations and Financial Condition.(4) Certain mine general and administrative expenses have been reclassified from cost of sales to general and administrative
expenses to conform with current year’s presentation.
YAMANAVISION
49
Y A M A N A G O L D I N C.
41894_fin_p49 3/22/06 1:57 PM Page 49

Net loss for the year included non-cash charges in respect of stock option expense, foreignexchange losses, unrealized losses on commodity contracts and a future income tax recovery.Net earnings for the year, adjusted for these non-cash items (a non-GAAP measure), was $2 million compared to $2.6 million for the comparative ten month period ended December 31,2004. The following chart summarizes net earnings adjusted for these non-cash items:
December 31, December 31, February 29,A Non-GAAP Measure 2005 2004 2004
(ten months)
Net earnings (loss) per consolidated financial statements $ (4,111) $ 2,783 $ 1,008
Adjustments:Stock-based compensation 2,303 2,191 612Foreign exchange gain (369) (1,848) (157)Unrealized losses on commodity contracts 8,615 – –Future income tax (recovery) expense (4,447) (430) 324
Adjusted net earnings $ 1,991 $ 2,696 $ 1,787
Adjusted earnings per share $ 0.01 $ 0.03 $ 0.04
An unrealized non-cash loss of $8.6 million was recognized on the mark-to-market ofcopper hedging instruments entered into during the year. The Company has effectively soldforward 50 million pounds of 2007 copper production at a net price of $1.27 per pound. Thisrepresents approximately 50% of the Company’s projected copper production for 2007. Thefinancial instruments entered into were structured to hedge against the risk of declining copperprices on future copper concentrate sales, while permitting the Company to participate inmarket price increases at prices exceeding the $1.67 strike price of the call options involved inthe transactions, thereby maximizing the total exposure at $15 million. By putting this copperhedge in place, the Company is helping to ensure a less than two year pay back for its Chapadacopper-gold mine. The original pay back outlined in the Chapada feasibility study based on a copper price of $1.00 per pound was approximately two years.
The formal requirements under generally accepted accounting standards permit hedgeaccounting so long as cash flows come solely from the sale of copper. Since Chapada produces a concentrate of copper and gold which is sold in concentrate form, under accounting rules,hedge accounting is disallowed. Accordingly, changes in the fair value of the financialinstruments will be reflected in current earnings from period to period. This will result influctuations in net earnings from period to period until which time the contracts are closed in2007. The unrealized mark-to-market loss represents the value on cancellation of these contractsbased on market values as at December 31, 2005 and does not represent an economic obligation for the Company nor does it represent an estimate of future gains or losses.
The Company is currently considering entering into additional contracts to further lock-inthe copper price for a portion of its 2008 forecast production. Details to the commodity contactsare further discussed in Section “Hedging Program”.
The basic loss per share, including the impact of the mark-to-market loss on the economiccopper hedge for the fiscal year ended December 31, 2005 was $0.03. This compares to basicearnings per share of $0.03 per share and diluted earnings of $0.02 per share for the comparativeten month period ended December 31, 2004 and basic and diluted earnings of $0.02 per sharefor the year ended February 29, 2004.
Earnings per share adjusted for non-cash items was $0.01 for the year. This compares toadjusted earnings per share of $0.03 for the comparative ten month period ended December 31,2004 and $0.04 for the year ended February 29, 2004.
Revenue for the fiscal year was $46 million, an increase of 43% over the preceding ten
GROWTHVALUE
50
A n n u a l R e p o r t 2 0 0 5
41894_fin_p50 3/25/06 10:39 AM Page 50

month period. Revenues for the year consisted of 72,074 ounces of gold sold from the FazendaBrasileiro Mine and 31,698 ounces of gold sold from the Fazenda Nova Mine as of May 1, 2005(commencement of commercial production). All gold sales were transacted in the spot market.In addition, a total of 8,744 ounces were sold during the year from pre-commercial activities atthe Fazenda Nova Mine and the Francisco pilot plant. Hence, a total of 112,516 ounces of goldwere sold in 2005. Sale proceeds prior to commercial production from the Fazenda Nova Mineand from the São Francisco pilot plant were credited against mine development costs. A total
of 79,822 and 49,989 ounces were sold during the comparative ten month period endedDecember 31, 2004 and during the twelve monthperiod ended February 29, 2004, respectively.Additionally, 4,587 ounces of gold were soldduring the comparative ten month period endedDecember 31, 2004 from pre-commercialactivities from the Fazenda Nova Mine and the São Francisco pilot plant.
The Company’s average realized gold price during the year was $448 per ounce, anincrease of 10% from an average realized price$409 per ounce during the comparative ten monthperiod ended December 31, 2004. This alsocompares to an average spot price of $445 perounce for the year ended December 31, 2005.
The spot price itself increased 9% relative to the comparative ten month period ended December 31, 2004.
A higher gold price positively affected the Company’s revenues. The impact of a higheraverage gold price on mine operating earnings was partially offset by a strengthened BrazilianReal relative to the US dollar and higher operating costs. Higher local operating costs were a result of increases in maintenance costs, the price of fuel, the price of power, and otherconsumables.
Mine operating earnings for the year were $8.6 million and consist of operations from theFazenda Brasileiro Mine and the Fazenda Nova Mine as of May 1, 2005. This compares tooperating earnings from the Fazenda Brasileiro Mine of $10.4 million for the comparative tenmonth period ended December 31, 2004 and $6.8 million for the year ended February 29, 2004.There were no earnings from the Fazenda Nova Mine for the comparative periods.
A total 115,572 ounces of gold were produced during the year of which 103,350 ounceswere produced from commercial production activities and 12,222 ounces were produced frompre-commercial activities. This compares to 84,231 ounces produced during the comparative ten month period ended December 31, 2004 and 57,077 ounces produced during the year endedFebruary 29, 2004. Comparing fiscal 2005 versus fiscal 2004, Fazenda Nova commercialproduction increased by 28,780 ounces and Fazenda Brasileiro production declined by 3,598 ounces.
Average cash costs for the year were $289 per ounce compared to $205 per ounce for theten month comparative period ended December 31, 2004 and $208 per ounce for thecomparative year ended February 29, 2004.
Inventory as at December 31, 2005 was $11.4 million compared to $5.9 million as atDecember 31, 2004. Inventory increased as a result of production at the Fazenda Nova Mine,ore being stacked on the heap leach pads at the São Francisco Mine and ore stockpiled at theChapada Mine which is currently under construction.
Proven and probable reserves were 5.2 million ounces of contained gold and 2.3 billionpounds of contained copper as of December 31, 2005 based on a gold price of $425 per ounce
YAMANAVISION
51
Y A M A N A G O L D I N C.
US$ per
ounce
Average gold price realized
Average gold spot price
Feb. 292004
Dec. 312004
(ten months)
Dec. 312005
$460
$440
$420
$400
$380
$360
$340
Gold Price per Ounce(US$)
41894_fin_p51 3/22/06 1:58 PM Page 51

(except for Fazenda Nova which is calculated assuming $500 gold price) and a copper price of $1.00 per pound. This represents an increase of 1.2 million ounces, a 31% increase aftermining of 115,000 ounces during the year.
Summary of increase in proven and probable gold reserves by mine/project:
Increase (Decrease)Mine in Contained Ounces
(000’s)
Fazenda Brasileiro (26)Fazenda Nova (54)C-1 Santa Luz 556São Francisco 324São Vicente 309Chapada 54
Total Increase 1,163
Cash as at December 31, 2005 was $151.6 million compared to $87.1 million as atDecember 31, 2004. Significant cash transactions during the year included the full draw downon a $100 million loan facility, $48.1 million in net proceeds received on the early exercise of the Company’s publicly traded warrants and $105.3 million received from an equity financingheld in October and expenditures relating to construction of the São Francisco and Chapadamines of $55.3 million and $76.7 million, respectively.
Cash flow from operations before changes in non-cash working capital items was $6.4 million for the year compared to $9.3 million for the comparative ten month period endedDecember 31, 2004 and $5 million for the year ended February 29, 2004. The decrease in cash from operations is primarily due to previously mentioned increases in local operating costs, a strengthening Real and the processing of lower grades at Fazenda Brasileiro.
Working capital as at December 31, 2005 was $139 million compared to $88.9 million as at December 31, 2004 and $35.7 million as at February 29, 2004.
The balance sheet as at December 31, 2005 reflects $13.2 million of Brazilian tax creditreceivables recognized in advances and deposits ($4.4 million) and other assets ($8.9 million). A provision in the amount of approximately 15% ($372,900 of which $40,200 was charged toassets under construction) was recorded during the period against certain Brazilian tax credits.Other Brazilian tax credits may be applied against future income taxes payable and taxespayable on eligible local sales. It is expected that a portion of copper concentrate from theChapada Mine will be sold locally in Brazil which will take advantage of some of these eligibletax credits. An increase in tax credits arose as operating expenditures and capital expendituresrelating to construction and operations increased significantly during the year.
Assets under construction of $154.3 million reflect construction of the São Francisco andChapada mines. Construction costs include cash expenditures, capitalized interest, capitalizedamortization of deferred financing charges and capitalized pre-operating net earnings.
Construction of the Chapada mine is being financed by a $100 million debt facility. As at December 31, 2005, the Company owed $100 million in principal plus accrued interest of $6.8 million.
General and administrative expenses were $10.4 million for the year compared to $6.2million for the comparative ten month period ended December 31, 2004 and $4.6 million for theyear ended February 29, 2004. The increase in general and administrative expenses is reflectiveof the Company’s growing infrastructure related to its production growth plans and acquisitions.
Investment income was $4 million for the fiscal year, compared to $0.8 million for thecomparative ten month period ended December 31, 2004 and $0.5 million for the year endedFebruary 29, 2004. Investment income for the year mainly represents interest income earned
GROWTHVALUE
52
A n n u a l R e p o r t 2 0 0 5
41894_fin_p52 3/25/06 10:39 AM Page 52

in Brazil at an average rate of 19% as the Company held higher cash balances denominated inBrazilian reais than the previous year in order to help offset the impact of the strengthening Real.
6. Mine Operations
The following chart summarizes commercial production and cash costs per ounce for the yearand quarter ended December 31, 2005 with comparative figures for the ten month period andquarter ended December 31, 2004:
Quarter ended Quarter endedDecember 31, 2005 December 31, 2004
Production Cash costs Production Cash costs(oz.) per oz. (oz.) per oz.
(a non-GAAP (a non-GAAPmeasure) measure)
Fazenda Nova 12,740 $ 177 – $ –Fazenda Brasileiro 17,810 $ 357 20,854 $ 234
Total Commercial Production 30,550 $ 282 20,854 $ 234
Fazenda Nova Pre-operating – $ – 2,745 $ –
São Francisco Pilot Plant 1,212 $ – 846 $ –
Total Production 31,762 $ – 24,445 $ –
For the twelve months For the ten monthsended December 31, 2005 ended December 31, 2004
Cash costs Cash costsper oz. per oz.
Production (a non-GAAP Production (a non-GAAP (oz.) measure) (oz.) measure)
Fazenda Nova 28,780 $ 208 – $ –Fazenda Brasileiro 74,570 $ 320 78,168 $ 218
Total Commercial Production 103,350 $ 289 78,168 $ 218
Fazenda Nova Pre-operating 7,379 $ – 2,849 $ –São Francisco Pilot Plant 4,843 $ – 3,214 $ –
Total Production 115,572 $ – 84,231 $ –
Mine operating earnings for the year ended December 31, 2005 were $8.6 million, a decrease of 17% from mine operating earnings of $10.4 million for the comparative ten monthperiod ended December 31, 2004. Mine operating earnings for the year ended February 29,2004 were $6.8 million. Mine operating earnings decreased relative to the prior fiscal yearmainly due to the strengthening of the Real vis-à-vis the US dollar, an increase in Realdenominated costs at the Fazenda Brasileiro Mine and lower head grades and recovery rates at the Fazenda Brasileiro Mine.
Mine operating earnings for fiscal 2005 consisted of earnings from the Fazenda Nova andFazenda Brasileiro mines. The Fazenda Nova Mine began commercial production as of May 1,2005, thus mine operating earnings for the comparative periods reflect earnings solely from theFazenda Brasileiro Mine.
YAMANAVISION
53
Y A M A N A G O L D I N C.
41894_fin_p53 3/25/06 10:39 AM Page 53

A total of 115,572 ounces of gold wereproduced during the year, including commercialproduction of 103,350 ounces at combined cashcosts of $289 per ounce. This compares to 84,231ounces of gold produced during the comparativeten month period ended December 31, 2004,including commercial production from theFazenda Brasileiro Mine of 78,168 ounces at anaverage cash cost of $205 per ounce produced. A total of 57,077 ounces were produced duringthe year ended February 29, 2004 of which56,794 ounces were commercially produced at an average cash cost of $208 per ounce at theFazenda Brasileiro Mine.
December 31, 2005 December 31, 2004 February 29, 2004(ten months)
Production Cash Costs(1) Production Cash Costs(1) Production Cash Costs(1)
% % % % % % (oz.) change (oz.) change (oz.) change (oz.) change (oz.) change (oz.) change
Pre-Commercial Production:Fazenda Nova 7,379 59% – – 2,849 – – – – – – –São Francisco 4,843 51% – – 3,214 1036% – – 283 – – –
12,222 102% – – 6,063 2042% – – 283 – – –
Commercial Production:Fazenda Nova 28,780 – $ 208 – – – – – – – –Fazenda Brasileiro 74,570 (5%) $ 320 56% 78,168 38% $ 205 (1%) 56,794 – $ 208 –
103,350 32% $ 289 41% 78,168 38% $ 205 (1%) 56,794 – $ 208 –
115,572 37% $ 289 41% 84,231 48% $ 205 (1%) 57,077 – $ 208 –
(1) Non-GAAP measure - A cautionary note of Non-GAAP measures follows this Management’s Discussion and Analysis of Operations and Financial Condition.
Of the 103,350 commercially produced gold ounces during the year, 28,780 ounces werefrom the Fazenda Nova Mine at an average cash cost of $208 per ounce and 74,570 ounceswere from the Fazenda Brasileiro Mine at an average cash cost of $320 per ounce. These costlevels compare favourably for the Fazenda Nova Mine from the previous quarter and representsan increase for the Fazenda Brasileiro Mine.
Combined cash costs for the fourth quarter were $282 per ounce, a decrease of 3.1% fromcash costs of $291 per ounce for the quarter ended September 30, 2005.
GROWTHVALUE
54
A n n u a l R e p o r t 2 0 0 5
Production ProfileCommercial Production
Mine Operating Earnings
Fazenda Nova
Fazenda Brasileiro
Dec. 312005
$289/oz
Dec. 312004
$205/oz(ten months)
Feb. 292004
$208/oz
Ouncesproduced
120,000
100,000
80,000
60,000
40,000
20,000
Production ProfileTotal Production
Fazenda Nova
Fazenda Brasileiro
Dec. 312005
Dec. 312004
(ten months)
Feb. 292004
Ouncesproduced
140,000
120,000
100,000
80,000
60,000
40,000
20,000
São Franciscopilot plant
Fazenda Nova
Fazenda Brasileiro
Dec. 312005
Dec. 312004
(ten months)
Feb. 292004
thousandsof US$
10,000
8,000
6,000
4,000
2,000
54%
46%
100%
100%
41894_fin_p54 3/25/06 10:40 AM Page 54

Revenue for the year ended December 31, 2005 was $46 million from the sale of 103,772ounces of gold compared to revenue of $32.3 million from the sale of 79,822 ounces of gold forthe comparative ten month period ended December 31, 2004 and $19.8 million from the sale of 49,989 ounces of gold during the year ended February 29, 2004. Revenue for the yearconsisted of gold ounces sold from the Fazenda Nova and Fazenda Brasileiro mines. Revenuefor the comparative periods consisted only of ounces sold from the Fazenda Brasileiro Mine.
Inventory as at December 31, 2005 was $11.4 million compared to $5.9 million as atDecember 31, 2004. Inventory increased during the year with the start-up of commercial productionat the Fazenda Nova Mine, ore being stacked on the heap leach pads at the São Francisco Mineand ore being stockpiled at the Chapada Mine which is currently under construction.
Of the total inventory on hand as at December 31, 2005, $2.5 million consisted of supplies and materials, $8.3 million of in-circuit and gold in-process inventory and $0.5 millionof finished product. Inventory as at December 31, 2005 consisted of approximately 6,700ounces of gold at the Fazenda Brasileiro Mine, 9,600 ounces of contained gold at the FazendaNova Mine, 7,300 ounces of gold at the São Francisco Mine and 3.65 million pounds of copperinventories at the Chapada Mine. The contained gold inventory is primarily metal in theprocessing circuit or production in process. Inventory at the São Francisco Mine consisted of ore on the heap leach pads and inventory at Chapada consisted of ore stockpiled.
Fazenda Nova Mine
Fazenda Nova is an open pit heap leach mine constructed in fiscal year ended December2004 at a cost of approximately $6.5 million before the capitalization of pre-operating costs.Commercial production at the Fazenda Nova Mine was declared May 1, 2005. The FazendaNova Mine has operated above expectations with mine operating earnings of $4.7 million forfiscal 2005 (for the period May 1 - December 31, 2005). Operating earnings for 2006 willinclude a full year of production. Mine operating earnings from the Fazenda Nova Minerepresent approximately 54% of total mine operating earnings for 2005. Mine operating earnings for the fourth quarter were $3.7 million.
Construction of the Fazenda Nova Mine was completed during the rainy season of fiscalDecember 2004. Since then, the Company has undertaken measures to accommodate a heavierthan normal rainfall, implemented operational modifications to improve efficiency and reduce costs.
A total of 36,159 ounces of gold were produced during the year at the Fazenda Nova Mineat an average recovery rate of 81% of which 28,780 ounces were commercially produced and theremaining 7,379 ounces were produced prior to achieving commercial production. An aggregateof 2,849 ounces of gold were produced during the comparative ten month period endedDecember 31, 2004 during pre-commercial activities. There was no production at the FazendaNova Mine for the year ended February 29, 2004.
An aggregate of 1.6 million tonnes of ore was stacked on the heap leach pads during theyear. During the fourth quarter a total of 506,400 tonnes were stacked, an increase of 5.6% fromthe previous quarter.
Mining costs at an average of $1.56 per tonne steadily decreased throughout the year.Total mining costs for the quarter were $1.40 per tonne, a decrease of 12.5% from $1.60 pertonne for the September quarter.
With the initiatives that the Company undertook to improve efficiency, US dollar cashcosts per ounce steadily declined during fiscal 2005. This occurred despite the strengthening ofthe Real vis-à-vis the US dollar with an average exchange rate for 2005 of 2.4348 compared toan average exchange rate for 2004 of 2.9319, an increase of 17%. Additionally, cash costs duringthe fourth quarter of $177 per ounce were 5% lower than that contemplated in the feasibilitystudy of $186 (life of mine). Cash costs for the year at the Fazenda Nova Mine were $208 per ounce. During the month of January 2006, they averaged $196 per ounce. Historically,
YAMANAVISION
55
Y A M A N A G O L D I N C.
41894_fin_p55 3/25/06 10:40 AM Page 55

the rainy season extends from December to the end of March, during which period, in normalcourse, cash costs are expected to be higher.
The following chart summarizes ore stacked, production and cash costs per ounce for the Fazenda Nova Mine by quarter for fiscal 2005:
Cash Ore costs/oz.
Stacked Production (A non-GAAP(tonnes) (oz.) Measure)
Pre-commercial 306,900 7,379 –
Commercial Production:Second Quarter (as of May 1, 2005) 272,800 5,676 $ 265Third Quarter 479,600 10,364 $ 215Fourth Quarter 506,400 12,740 $ 177
Commercial Production: 1,258,800 28,780 $ 208
Total Production 1,565,700 36,159 –
The target production for 2006 is 30,000 to 33,000 ounces.
The following table summarizes the major components of total average cash costs perounce for the Fazenda Nova Mine for the current period:
December 31, 2005
Cash Costs/ oz. Percentage
(A non-GAAP of cashMeasure) costs / oz.
Mining $ 69 33%Crushing, agglomeration and stacking 63 30%Leaching and solution neutralization 19 9%Recovery plant 12 6%General and administrative 22 11%Other (i) 23 11%
Total $ 208 100%
(i) Includes by-product revenues
One of the operating efficiency measures implemented during the year at the Fazenda NovaMine is a coarser grind whereby volume throughput is increased and unit costs decreased. This isintended to maintain the level of total recovered gold ounces at lower unit costs notwithstandinglower recovery rates than in the feasibility study and an increase in the leaching period.
The average ore grade for the year from the Fazenda Nova Mine was 0.87 g/t which isconsistent with feasibility study grade expectations.
Inventory at the Fazenda Nova Mine as at December 31, 2005 of $2.1 million consistedof gold in circuit and gold in process in the amount of approximately 9,600 ounces andmaterials and supplies. Quantities of recoverable gold placed on the heap leach pads arereconciled by comparing the grades of ore placed on the heap leach pads to the quantities ofgold actually recovered, however, the nature of the leaching process inherently limits the abilityto precisely monitor inventory levels. As such, engineering estimates are refined based on actual results over time.
GROWTHVALUE
56
A n n u a l R e p o r t 2 0 0 5
41894_fin_p56 3/25/06 10:40 AM Page 56

A total of 31,698 ounces of gold were sold during the year from the Fazenda Nova Mine at an average sale price of $458 per ounce for gross sales of $14.5 million. Additionally, 4,694ounces of gold were sold from pre-commercial production. Sales during the comparative ten month period ended December 31, 2004 from Fazenda Nova production consisted of 1,704 ounces of gold for total gross revenue of $747,100 which was capitalized as part of pre-production activities.
Fazenda Brasileiro Mine
Fazenda Brasileiro was originally acquired in August 2003 with 2.5 years of remainingreserve life. The objective for the Fazenda Brasileiro Mine is to add resources and convertexisting resources into reserves thereby increasing the life of the mine. Current resourceestimates support an additional 4 to 6 years of mine life at production levels of 80,000 ouncesper year.
Operations during the year at the Fazenda Brasileiro Mine were significantly affected bythe impact of a strengthened Real vis-à-vis the US dollar, mining of lower grade material, lowerrecovery rates, and higher prices for consumables.
A total of 74,570 ounces of gold were produced from the Fazenda Brasileiro Mine duringthe year at an average cash cost of $320 per ounce. This compares to 78,168 ounces of goldproduced during the comparative ten month period ended December 31, 2004 at an averagecash cost of $205 per ounce, representing a decrease of 4.6% in production and an increase of 56% in cash cost per ounce as reported in US dollars. Average cash costs per ounce in reaisincreased by 21% from the prior ten month period. A total of 56,794 ounces were producedduring the year ended February 29, 2004 at an average cash cost of $208 per ounce.
The Company anticipated processing lower grade ore at the Fazenda Brasileiro Mine priorto gaining access to higher grade orebodies and areas beneath the existing mine workings forfurther drilling and exploration. Mining of lower grade material will continue throughout 2006 as development work continues in higher grade lower areas at E-Deep.
Mining of the C-Quartz orebody commenced late in the fourth quarter of 2005 and isexpected to account for approximately 20% of ore production in 2006 at grades that exceedcurrent levels. The benefits of higher grades are expected after the first quarter of 2006.
The average ore grade at the Fazenda Brasileiro Mine for the year was 2.44 g/t compared to3.13 g/t during the comparative ten month period ended December 31, 2004, a decrease of 22%.
Cash costs for the year were affected by a 17% increase in the average annual BrazilianReal/US dollar exchange rate during the year. Additionally, Real denominated cash costs perounce increased by approximately 21% relative to the comparative ten month period endedDecember 31, 2004. Cash costs were affected by higher prices for consumables and an increasein maintenance costs. Unit costs were further impacted by lower head grade and recovery rates.
Cash costs for the quarter increased by 7.7% from the prior quarter, in US dollar terms.Increases in Real denominated costs for the quarter were most significant in maintenance related expenditures.
In September 2005, the Company implemented cost cutting measures at the FazendaBrasileiro Mine. Such measures included manpower reductions, a move to Company drillingrather than contract drilling, increasing the proportion of parts purchased in Brazil and anincreased focus on cost effective purchasing. The impact of such cost cutting measures wasoffset by an increase in maintenance costs and higher priced consumables such as fuel andenergy during the fourth quarter. The cost cutting measures will continue into 2006.
Target production for 2006 is 80,000 ounces. Fazenda Brasileiro will be operated at a comparatively lower production rate to allow for cost reductions pending development of E-Deep. Moreover, as E-Deep is developed, further reductions are expected to occur, inmaintenance costs in particular as equipment and trucking fleet are upgraded.
YAMANAVISION
57
Y A M A N A G O L D I N C.
41894_fin_p57 3/22/06 2:00 PM Page 57

The following table summarizes the major components of total average cash costs perounce for the Fazenda Brasileiro Mine:
December 31, 2005 December 31, 2004(12 months) (10 months)
Cash Cash costscosts / oz. Percentage / oz.(A non-GAAP of cash (A non-GAAP Percentage of
Measure) costs /oz. Measure) cash costs / oz.
Mining $ 170 53% $ 107 49%Milling 97 30% 63 29%General and administration 41 13% 37 17%Other (i) 12 4% 11 5%
Total $ 320 100% $ 218 100%
(i) Includes by-product revenues
Mine operating earnings from the Fazenda Brasileiro Mine were $4 million for the yearcompared with $10.4 million for the ten month period ended December 31, 2004. Mineoperating earnings for the fourth quarter were $1.1 million.
The average plant recovery rate during the period was 89.3% compared to an average plantrecovery rate of 91.9% during the comparative ten month period ended December 31, 2004 and95.5% during the year ended February 29, 2004.
Plant recovery rates continued to be affected by mill feed from carbonaceous ore fromopen pit material during the year. A total of 191,400 tonnes of open pit ore were mined duringthe year. Mining of carbonaceous open pit material is expected to be concluded in the firstquarter 2006. An aggregate of 35,500 tonnes of carbonaceous open pit material was minedduring the fourth quarter.
An aggregate of 1.1 million tonnes were milled through the CIP circuit during the year incomparison to 826,400 tonnes milled during the comparative ten month period ended December 31,2004. An aggregate of 650,000 tonnes were milled during the year ended February 29, 2004.
Inventory as at December 31, 2005 at the Fazenda Brasileiro Mine consisted ofapproximately 6,800 ounces of gold of which 1,100 ounces were finished product and theremaining 5,700 ounces were in-circuit inventory and gold in process. Inventory and gold inprocess is not included in production for Fazenda Brasileiro and if accounted for would increaseproduction from Fazenda Brasileiro to 80,270 ounces and total production to 121,272 ounces.
A total of 72,074 ounces of gold were sold from the Fazenda Brasileiro Mine at an averagesale price of $444 per ounce for total gross revenue of $32 million compared to 79,822 ouncesduring the comparative ten month period ended December 31, 2004 at an average sale price of$409 per ounce for total gross proceeds of $32.6 million. Sales for the year ended February 29,2004 consisted of 49,989 ounces of gold at an average sale price of $396 per ounce from theFazenda Brasileiro Mine that was acquired on August 15, 2003.
São Francisco Mine
São Francisco is in the normal start up phase of a mine. As at December 31, 2005, ore was being loaded onto the heap leach pads and the crushing circuit was operational. The gravityplant started operating in January of 2006. The Company is on track to exceed capacity and willbe approaching full capacity at the gravity plant. Heap leaching of ore commenced in March of 2006.
GROWTHVALUE
58
A n n u a l R e p o r t 2 0 0 5
41894_fin_p58 3/25/06 10:41 AM Page 58

Commercial production from the São Francisco Mine is expected to commence during thesecond quarter of 2006. An aggregate of 572,300 tonnes were stacked on the heap leach pads as of December 31, 2005. This had risen to approximately 800,000 tonnes as of the end ofFebruary 2006, consistent with the mine plan.
Total construction expenditures as at December 31, 2005 were $64 million or R$150.7million (including amounts in payables). Construction expenditures were funded by existing cash resources and cash flow from operations. A total of $60.4 million of costs were incurredduring 2005 of which $13.7 million were incurred during the fourth quarter.
Almost all of the capital costs for the construction of São Francisco have been committedto date. Real denominated construction expenditures are forecast to be 14% over budget. Thisincrease of 14% was largely due to higher steel prices, an extension of the power line and anincrease in materials related to the intermediate stockpile for the crusher plant which was notcontemplated in the feasibility study.
Assets under construction as at December 31, 2005 in respect to the São Francisco Minewere $63 million and include capitalized pre-commercial production operations and thereallocation of inventory.
Average annual production from São Francisco is targeted at 108,000 ounces with aninitial mine life of approximately 7.5 years.
7. Liquidity and Capital Resources
Cash and cash equivalents as at December 31, 2005 were $151.6 million compared to $87.1million as at December 31, 2004, an increase of 74%. Factors that could impact on theCompany’s liquidity are monitored regularly and include the market price of gold, productionlevels, operating cash costs, capital expenditure requirements and obligations under the longterm debt facility. The Company currently has adequate funding in place or available to fund its development projects. In addition to its ability to generate cash flow from operations, theCompany has also demonstrated its ability to enter into the capital markets and it’s ability to obtain debt financing.
Cash on hand as at December 31, 2005 increased from the prior year mainly due to thefollowing corporate activities:
• draw down of the previously announced $100 million loan facility for the construction and development of the Chapada copper-gold project,
• $48.1 million net proceeds received on the early conversion program of its publicly traded warrants which closed in August 2005, and
• $105.3 million in net proceeds from a public share equity issue that closed in October 2005.
Working capital increased to $139 million compared to $88.9 million as at December 31, 2004 and $35.7 million as at February 29, 2004.
Operating Cash Flow
Cash flow generated from operations before changes in non-cash working capital items forthe year was $6.4 million compared to $9.3 million for the comparative ten month period endedDecember 31, 2005 and $5 million for fiscal February 29, 2004. Changes in non-cash workingcapital items for the year consisted of a reduction of $3 million. Cash flow from operations for2005 consists of operating results from the Fazenda Brasileiro Mine and the Fazenda NovaMine as of May 1, 2005. Cash flow from operations for the comparative periods consists solelyof operating cash flow from the Fazenda Brasileiro Mine. A total of $4 million was incurred as capital costs at Fazenda Brasileiro relating to the development of E-Deep.
YAMANAVISION
59
Y A M A N A G O L D I N C.
41894_fin_p59 3/22/06 2:01 PM Page 59

Financing Activities
Cash inflows from financing activities for the year ended December 31, 2005 were $250.5 million and included the following:
• $48.1 million of net proceeds received on the issue of common shares related to the warrant early conversion program introduced in June 2005,
• $105.3 net proceeds received from an equity financing that closed in October 2005,• $1.6 million received on the exercise of options and warrants, and • $100 million advanced under a loan facility for the construction and development
of the Chapada copper-gold project.
In addition, an outflow of $4.6 million was incurred during the year in respect of expendituresrelating to the loan facility (which have been deferred and amortized over the term of the loan).
Cash inflows from financing activities for the fourth quarter consisted mainly of theOctober 2005 equity financing and were $105.3 million.
Financing activities for the comparative ten month period ended December 31, 2004included net cash inflows of $68.9 million. These cash inflows included an equity financing of26.4 million common shares for gross proceeds of $76.1 million.
Cash inflows from financing activities for the comparative year ended February 29, 2004were $56.3 million.
Equity Financing
In August 2005, the majority of the Company’s publicly traded warrants were exercised inconnection with a Company proposal made to warrant holders in June 2005 to exercise theirwarrants early as described below under the warrant heading.
In October 2005, the Company successfully raised aggregate gross proceeds of $110.9million (C$130 million) through a share equity issue of 26 million common shares at a price of C$5.00 per share. Issue costs (including underwriter’s fees) incurred on the transactiontotaled $5.6 million.
Debt Financing
On April 29, 2005, the Company drew down on a $100 million debt facility for thedevelopment of the Chapada copper-gold project from a private investment fund and the lenderadvanced the funds. Upon drawdown, the funds were deposited in escrow pending perfectionand registration of security interests, and receipt of certain authorizations, approvals andopinions relating to the perfection and registration of such security interests. The period forperfection and registration of security interests varied depending on the collateral class andregistration process. To accommodate the applicable registration process, the Company and thelender under the facility provided for a two-staged release from escrow. The first $70 million(Series 1 Note Payable) was released on August 8, 2005 and transferred to Brazil and convertedinto Brazilian reais at an average rate of R$2.35:US$1.00. The remaining $30 million (Series 2 Note Payable) was released on October 7, 2005 and transferred to Brazil and converted intoBrazilian reais at an average rate of R$2.2335:US$1.00.
The secured notes are for a term of six years bearing interest at a rate of 10.95% perannum. Principal is repayable upon maturity of the notes. The Company has elected to deferinterest payments for the first two years at a rate of 12.45% per annum, compounded semi-annually. An aggregate of $6.8 million of interest expense was accrued during the deferral period.
The Company may also elect to defer interest payments for the third year at a rate of13.95% per annum.
GROWTHVALUE
60
A n n u a l R e p o r t 2 0 0 5
41894_fin_p60 3/22/06 2:01 PM Page 60

Interest on the Series 2 note was payable at a reduced rate of LIBOR plus 1.5% prior to release from escrow. A total of $677,700 of interest expense was paid in this regard.
Interest expense is capitalized as part of the Chapada Mine construction costs. As atDecember 31, 2005, a total of $7.5 million had been capitalized. Upon achieving commercialproduction at Chapada, interest from this point in time will be expensed.
Loan proceeds held in escrow during the period earned interest income of $0.9 million.Interest income earned during the period was netted against Chapada construction costs.Approximately $583,100 of interest income earned on escrow funds were still held in escrow as at December 31, 2005 and subsequently released in January 2006.
In addition to commitment fees and 2.5 million warrants issued during the period endedDecember 31, 2004, the Company issued an additional 2.5 million warrants to the lender uponfunding. These warrants have an exercise price of C$4.70 and expire five years from the date of issue. Deferred financing charges in the amount of $1.4 million have been recorded inconnection with the 2.5 million warrants. The warrants were recorded at fair value as calculated using the Black-Scholes pricing model.
In addition to the issuance of 2.5 million warrants, $4.6 million of expenditures wereincurred in connection with the debt financing during the year. This includes legal fees, advisoryfees and $2.5 million paid to the lender upon funding and release of the $30 million fromescrow. These expenditures were recorded as deferred financing charges and are being amortizedover the life of the loan.
A total of $1.1 million of amortization has been charged to Chapada construction costsduring the year in respect to amortization taken on deferred financing charges.
Investing Activities
Cash flow from investing activities includes expenditures on fixed assets and construction. A cash outflow from investing activities of $192.6 million for the year consisted of constructionrelated expenditures of $132 million, expenditures on mineral properties of $23.2 million, andproperty, plant and equipment acquisitions of $5.8 million. Additionally, investing cash outflowsinclude $18.9 million advanced to RNC Gold Inc. and $12.6 million expended on other assets.This compares to an outflow of $27.1 million for the comparative ten month period endedDecember 31, 2004 and $28.1 million for the comparative year ended February 29, 2004 whichincluded the acquisition of the Fazenda Brasileiro Mine for $22.1 million. Capital expenditureswere as follows:
December 31, December 31, February 29,2005 2004 2004
(in millions of US$) (10 months)
Construction of Chapada (i) $ 76.7 $ 3.2 $ –Construction of São Francisco (i) 55.3 1.9 –Construction of Fazenda Nova (i) – 6.5 0.1Acquisition of Fazenda Brasileiro – – 22.1Exploration 15.4 4.8 2.5Capital expenditures at Fazenda Brasileiro 8.3 8.2 1.7Capital expenditures at Fazenda Nova 2.6 –Feasibility studies 1.1 1.5 0.3Mineral rights 0.9 –Other 0.7 0.4 1.4
$ 161.0 $ 26.5 28.1
(i) Net of accounts payable and accrued liabilities
YAMANAVISION
61
Y A M A N A G O L D I N C.
41894_fin_p61 3/22/06 2:01 PM Page 61

Capital expenditures at the Fazenda Brasileiro Mine included $4 million of minedevelopment costs which includes the development of the underground ramp to provide accessto E-Deep orebody. The remaining expenditures at the Fazenda Brasileiro Mine are primarilyexpenditures on equipment. Capital expenditures at the Fazenda Nova Mine primarily includeexpenditures for the construction and development of the heap leach pad lifts.
The Company has allocated $148.2 million in the fiscal 2006 budget for capitalexpenditures.
The 2006 capital budget of $148.2 million does not include capital requirements for theconstruction of São Vicente, Ernesto and C1 Santa Luz as these projects are subject tocompletion of either feasibility studies or favourable construction decisions. It also excludescapital expenditures relating to RNC and the potential Desert Sun acquisition.
Exploration is budgeted at $9.5 million which includes $1.1 million for near-mine andregional exploration at the Fazenda Brasileiro Mine, $3 million on the Itapicuru Green StoneBelt and $3.4 million on the Santa Elina Gold Belt and São Vicente region.
8. Capitalization
Shareholders’ equity as at December 31, 2005 was $315 million compared to $160.3 million as at the fiscal year ended December 31, 2004.
Share Capital
As at December 31, 2005, the Company had 191.3 million (December 31, 2004 - 122.3million; February 2004 - 95.1 million) common shares outstanding. The weighted average sharesoutstanding for the fiscal year end December 31, 2005 was 144.9 million common shares.
The Company issued a total of 69.1 million common shares during the year. Of this total, 41.8 common shares were issued in connection with the early exercise of the Company’s publiclytraded warrants, 26 million common shares were issued in respect to an equity financing and 1.3 million common shares were issued on the exercise of employee stock options and shareappreciation rights.
The Company issued a total of 41.3 million common shares for net proceeds of $48.1million pursuant to the early exercise of its publicly traded warrants. An additional 476,198common shares were issued pursuant to the automatic exchange of warrants that were notexercised during the early exercise period without payment of the exercise price or anyadditional consideration.
The Company completed an equity financing in October 2005 resulting in the issuance of 26 million common shares at a price of C$5.00 per share for total gross proceeds of $110.9million (C$130 million). The Company plans to use the net proceeds of this financing for theadvancement of its mineral properties, potential acquisitions and for general corporate purposes.
Warrants
As at December 31, 2005, the Company had a total of 5.3 million (December 31, 2004 -43.4 million; February 2004 - 41.4 million) share purchase warrants outstanding with an averageexercise price of C$4.43 per share. Expiry dates on share purchase warrants range fromFebruary 2006 to April 2010, and exercise prices range from C$2.09 to C$5.57. All outstandingwarrants were exercisable at an average weighted exercise price of C$4.43 per share (December 31,2004 - C$1.78 per share; February 29, 2004 - C$1.59 per share). The weighted averageremaining life of warrants outstanding was 3.9 years (December 31, 2004 - 3.7 years; February 29, 2004 - 4.4 years).
GROWTHVALUE
62
A n n u a l R e p o r t 2 0 0 5
41894_fin_p62 3/22/06 2:02 PM Page 62

As of July 29, 2005, the Company effected an amendment of the terms of its 40,567,656listed common share purchase warrants in order to encourage the early exercise of the warrants,each of which was exercisable to purchase one common share of the Company at a price ofC$1.50 until July 31, 2008. An aggregate of 39,866,635 warrants were exercised during a 30 dayvoluntary early exercise period expiring on August 29, 2005 at a rate of 1.0356 common sharesfor each warrant exercised at the exercise price of Cdn.$1.50. This represented approximately98.3% of the total listed warrants outstanding. An aggregate of 41,285,875 common shares wereissued pursuant to the early exercise of the warrants. Upon the expiry of the voluntary earlyexercise period, the remaining 701,021 warrants were automatically exchanged, without paymentof the exercise price or any additional consideration, at a rate of 0.6793 of a common share foreach warrant exchanged, which in effect provided a premium to the in-the-money value of thewarrant. An aggregate of 476,198 common shares were issued pursuant to the automaticexchange of warrants.
This transaction provided total proceeds net of issue costs of approximately $48.1 millionthat otherwise would not have been available to the Company until July 2008. Proceeds from theearly exercise of the warrants are being used for the advancement of the Company’s mineralproperties and for general corporate purposes.
The Company also issued 2.5 million warrants during the period in connection with its loan facility.
A nominal 11,234 of non-publicly traded warrants were exercised during the period forcash proceeds of $55,400. Additionally, 47,200 warrants expired during the period.
Stock Options and Share Incentive Plan
A significant contributing factor to the Company’s future success is its ability to attractand maintain qualified and competent people. To accomplish this, the Company has adopted a Share Incentive Plan designed to advance the interests of the Company by encouragingemployees, officers and directors, and consultants to have equity participation in the Companythrough the acquisition of common shares. The Company granted 2.8 million options toemployees, officers and directors during the current fiscal year. A total of 1.3 million stockoptions were granted during the comparative ten month period ended December 31, 2004 and 5.3 million stock options were granted during the year ended February 29, 2004.
A total of $2.3 million was charged to operations as stock-based compensation in 2005with an off-setting credit to contributed surplus in respect to the options issued under the Share Incentive Plan during the year.
A total of 1.5 million (December 31, 2004 - 41,000) stock options under the ShareIncentive Plan were exercised during 2005.
A total of 7.95 million (December 31, 2004 - 6.66 million; February 29, 2004 - 5.5 million)stock options were outstanding as at December 31, 2005 of which all were exercisable(December 31, 2004 - 6.5 million; February 29, 2004 - 5.3 million). Stock options outstandingas at December 31, 2005 had a weighted average exercise price of C$2.67 per share (December 31, 2004 - C$2.04 per share; February 29, 2004 - $1.73 per share) and a weightedaverage life of 8.16 years (December 31, 2004 - 8.28 years; February 29, 2004 - 9.05 years).
YAMANAVISION
63
Y A M A N A G O L D I N C.
41894_fin_p63 3/22/06 2:02 PM Page 63

9. General and Administrative Expenses
General and administrative expenses were $10.4 million for the year ended December 31, 2005.This compares to $6.2 million for the comparative ten month period ended December 31, 2004and $4.6 million for fiscal year ended February 29, 2004. General and administrative expensesfor the fourth quarter were $4.1 million.
General and administrative expenses have increased as a result of growing operations. The Company continues to build its infrastructure and personnel reflecting the construction ofthe São Francisco and Chapada mines. This includes an increase in personnel head count andassociated facilities and costs. General and administrative expenses are expected to stabilize at approximately $12.4 million for fiscal 2006. This forecast expense level does not assume theconstruction of our late stage development projects in 2006, the acquisition of RNC Gold Inc. or the potential Desert Sun acquisition. The acquisition of RNC Gold Inc. is expected to add$300,000 - $400,000 in additional general and administrative costs per annum. The acquisitionof Desert Sun would add additional general and administrative expenses annually.
Approximately $65,200 of general and administrative costs were incurred in respect to compliance with the SOX 404 during the year. Expenditures relating to compliance areexpected to increase significantly in 2006.
The Company has reclassified mine general and administrative expenses from mineoperating earnings to general and administrative expenses for the comparative period to conformwith the decision to centralize various functions and share services among various properties.
10. Foreign Exchange
A foreign exchange gain of $0.4 million and loss of $3.1 million was recognized during the yearended December 31, 2005 and during the fourth quarter, respectively. This compares to anexchange gain of $1.8 million recognized for the comparative ten month period ended December 31, 2004 and $0.2 million recognized during the year ended February 29, 2004.
The exchange gain of $0.4 million recognized during the year was comprised of anexchange gain in Canada of $1.8 million and an exchange loss in Brazil of $1.4 million.
The Company translates non US dollar monetary items at period end rates and recognizesthe gain or loss on translation in the period. As such, an unrealized foreign exchange gain isrecognized during periods when the Canadian dollar and/or the Real appreciate vis-à-vis the US dollar on a net monetary asset position and an unrealized foreign exchange loss is recognizedwhen the Canadian dollar and/or Real appreciate vis-à-vis the US dollar on a net monetaryliability position.
The Cdn-US dollar exchange rate as at December 31, 2005 was 1.163 compared to anexchange rate of 1.202 as at December 31, 2004 and 1.1627 as at September 30, 2005. Thisrepresents an increase of 3% during the year and 0.02% during the quarter.
The Real-US dollar exchange rate as at December 31, 2005 was 2.3407 compared to 2.6544as at December 31, 2004 and 2.222 as at the end of the third quarter ended September 30, 2005.This represents an increase of 11.8% for the year and a decrease of 5.3% for the quarter.
GROWTHVALUE
64
A n n u a l R e p o r t 2 0 0 5
41894_fin_p64 3/22/06 2:03 PM Page 64

The Company’s revenues are denominatedin US dollars. However, the Company’s expensesare incurred predominantly in Brazilian reais andto a lesser extent in Canadian and US dollars.Accordingly, fluctuations in the exchange ratescould significantly impact the results of operation.For as long as this environment of a strong Realcontinues, the Company plans to hold the majorityof its excess cash in Canadian dollars andBrazilian reais.
As at year end, the Company held US$1.2 million, C$110.4 million and R$131.4million. During the year, the Company convertedexcess cash into reais. Monies converted into
reais were subsequently used for capital expenditures in Brazil at a higher Real exchange rate at the time of the expenditure than at the time of the original conversion. This has resulted in a foreign exchange loss and the recognition of capital expenditures at higher Reais historicalexchange rates.
The Company may consider looking into entering into derivative contracts designed tomanage its exposure to movements in the Real against the US dollar, thus protect costs against the appreciation in the Real.
11. Investment Income and Currency Hedging
The appreciation of the Real to the US dollar continued to be largely dependent on high interestrates in Brazil which attracted significant inflows of foreign capital. The Company transferredsurplus cash balances into Brazil to take advantage of these high local rates as an offset to theimpact of the strengthening Real on Real denominated costs. The Company earned interestincome at an average rate of 19.1% on surplus cash as of the third quarter. An aggregate of $4 million of investment income was earned during the year of which $3.1 million was earned in Brazil. Cash held in Brazil as at December 31, 2005 was $56.1 million.
12. Income Taxes
The income tax provision recorded on the consolidated financial statements for the year endedDecember 31, 2005 reflects mainly a Canadian future income tax recovery of $4.3 million. Thisrecovery was booked mainly on the recognition of tax losses available to be used against futureincome taxes payable. This compares to a tax expense of $1.8 million recognized for thecomparative ten month period ended December 31, 2004 and an expense of $0.8 million for the year ended February 29, 2004.
The consolidated balance sheet reflects recoverable tax installments in the amount of $1.3 million in Brazil. Additionally, the balance sheet reflects a future income tax liability of $2.9 million in Brazil and a future income tax asset of $6.6 million recognized in Canada.
The effective tax rate on Brazilian operating results was 6%. This was mainly due to avaluation allowance taken on Brazilian income tax losses available for carry-forward in Brazil of $1.9 million. This was off-set by the tax effect on the increase in the value of the Real relativeto the US dollar on US dollar denominated inter-corporate debt.
YAMANAVISION
65
Y A M A N A G O L D I N C.
Average Monthly Brazilian Real
and Canadian Dollar
vis-à-vis the US DollarJanuary 2005 to Feb 17, 2006
Real : US$
Cdn$ : US$
Exchangerates
1.28
1.24
1.20
1.16
1.12
1.08
2.80
2.70
2.60
2.50
2.40
2.30
2.20
2.10
2.00Jan’05
Feb’05
Mar’05
Apr’05
May’05
Jun’05
Jul’05
Aug’05
Sep’05
Oct’05
Nov’05
Dec’05
Jan’06
Feb’06
41894_fin_p65 3/22/06 2:03 PM Page 65

As the Real strengthened throughout the year vis-à-vis the US dollar, a future income tax expense of approximately $2.8 million arose in Brazil on the revaluation of US dollardenominated inter-corporate debt. This debt is eliminated on consolidation. Inter-corporate debtsubstantially increased during the year as funds received from the debt facility were sent toBrazil, thus increasing the US dollar inter-corporate debt and cash on hand in reais. Additionally,the Real increased in value vis-à-vis the US dollar by 12% from a rate of 2.6544 as at December 31,2004 to 2.3407 as at December 31, 2005. If the Real were to weaken against the US dollar, theCompany would recognize a future income tax benefit on its consolidated financial statementson the revaluation of the US dollar denominated inter-corporate debt. The income tax expensewill be reported from period to period and will vary period to period depending on the foreigncurrency exchange rate then in effect. However, the income tax is payable only if the inter-corporate debt is repaid and as such, as that debt may never be repaid, the income tax expensemay never be paid. The amount of the tax liability will depend on the foreign exchange rate in effect at the time that the inter-corporate debt is repaid.
Approximately, a total of R$11.8 million of tax losses are available for carry-forward inBrazil. These losses will be used against future taxable income from the São Francisco andChapada mine. Additionally, approximately C$28.7 million of tax losses are available for carry-forward in Canada. The Company expects to use these losses against future income taxes payable that will arise from inter-corporate interest income. A net valuation allowance of $9 million has been provided against Canadian, US and Brazilian income tax losses and credit carry-forwards.
The Company’s combined federal and provincial statutory tax rate was 36.12% (December 31,2004 - 36.12%, February 29, 2004 - 38%). There are a number of factors that will affect theCompany’s effective tax rate including the non-recognition of tax assets, foreign currency gainsand losses. As a result, the Company’s effective tax rate may fluctuate from period to period. A reconciliation of the Company’s statutory rate to the actual provision is provided in Note 17 to the consolidated financial statements.
13. Closure and Reclamation Costs
The Company accrues reclamation and closure costs at their fair value. Fair value is determinedas the discounted future cash expenditures. Significant management judgments and estimatesare made when estimating reclamation and closure costs. Reclamation and closure costs areestimated based on the Company’s interpretation of current regulatory requirements.
The initial fair value of the estimated reclamation and closure expenses for FazendaBrasileiro and São Vicente were recorded as a liability on acquisition in fiscal February 29, 2004. The initial fair value of estimated reclamation and closure expenses for the Fazenda NovaMine were recorded as a liability in fiscal December 31, 2004. The fair value of estimatedreclamation and closure expenses of $3.2 million for the São Francisco Mine and that of theChapada project (based on construction incurred to date) have been recorded in 2005 with a corresponding amount capitalized to mine development costs. These costs will be amortized over the life of each mine on a unit-of-production basis.
During the year, the Company made expenditures in the amount of $309,000 with respect to the Fazenda Brasileiro Mine. Accretion charged to 2005 earnings was $358,000.
Furthermore, based on new information the Company reduced its original estimate forreclamation and closure costs for Fazenda Brasileiro by $999,000. An increase in the liability in the amount of $211,100 was also recorded during the year in respect to Fazenda Nova and Sao Vicente.
The balance as at December 31, 2005 of $8 million also includes the impact of foreignexchange in the amount of $559,000.
GROWTHVALUE
66
A n n u a l R e p o r t 2 0 0 5
41894_fin_p66 3/22/06 2:03 PM Page 66

14. Contractual Commitments
Year 2006 2007 2008 2009 2010 and (in thousands) thereafter
Office leases $ 375 $ 402 $ 274 $ 274 $ 274Fazenda Brasileiro
mine operating and service contracts 4,301 399 – – –Fazenda Nova
mine operating and service contracts 3,105 718 – – –Chapada
construction service contracts 49,417 1,320 289 – –São Francisco
construction service contracts 2,936 – – – –Notes payable (principal and interest) – 33,526 10,980 10,250 114,520
$ 60,134 $ 36,365 $ 11,543 $ 11,224 $114,794
15. Related Party Transactions
The Company paid or accrued directors’ fees of $243,300 during the year and $82,100 during the fourth quarter. These transactions were measured and recorded at the amount ofconsideration established and agreed to by the related parties based on their estimate of fairmarket value. Total related party transactions for the comparative ten month period were$179,200 and for the year ended February 29, 2004 were $922,000.
16. Contingency
During the year, a sales tax audit was completed by Brazilian state tax authorities which couldresult in a liability or a potential loss of recoverable Brazilian sales tax credits that have beenrecorded as receivables as at December 31, 2005 of approximately $1.7 million includingpenalties. The Company has not recorded an accrual at December 31, 2005 as it is theCompany’s view that the total amount of sales tax credits is recoverable. The Company iscurrently undergoing an appeal process and while it is not possible to determine the ultimateoutcome of such process at this time, the Company believes that the ultimate resolution will not have a material effect on the Company’s financial condition or results of operation.
17. Fourth Quarter Analysis
Consolidated net loss for the quarter ended December 31, 2005 was $74,000 compared to netearnings of $0.8 million for the comparative quarter ended December 31, 2004 and net earningsof $0.6 million for the comparative quarter ended February 29, 2004.
Net loss for the quarter included the following non-cash expenses: (i) foreign exchange loss of $3 million, (ii) loss on commodity contracts of $8.6 million and (iii) future income tax recovery of $8.3 million. Adjusted earnings (a non-GAAP measure) for the quarter were $3.3 million. This compares to an adjusted loss for the comparative quarter ended December 31,2004 of $1.3 million. The following table presents adjusted net earnings for the fourth quarterand the comparative quarter ended December 31, 2004:
YAMANAVISION
67
Y A M A N A G O L D I N C.
41894_fin_p67 3/22/06 2:04 PM Page 67

December 31, December 31,2005 2004
A Non-GAAP Measure Quarter Quarter
Net earnings (loss) per consolidated financial statements $ (73) $ 804
Adjustments:Foreign exchange loss (gain) 3,057 (519)Unrealized losses on commodity contracts 8,615 –Future income tax expense (recovery) (8,288) (1,548)
Adjusted net earnings (loss) $ 3,311 $ (1,263)
Adjusted earnings per share $ 0.02 $ (0.01)
Loss per share for the quarter was $0.00. This compares to earnings of $0.01 per share for the comparative quarter ended December 31, 2004 and $0.01 per share for the comparativequarter ended February 29, 2004. Earnings per share adjusted for the above mentioned non-cash items was $0.02 per share.
Revenues for the fourth quarter were $16.7 million from the sale of 19,257 ounces of gold from the Fazenda Brasileiro Mine and 15,463 ounces from the Fazenda Nova Mine.Additionally 1,543 ounces of gold were sold from the São Francisco pilot plant, which have been credited to mineral property development costs. This compares to $10.3 million for thecomparative quarter ended December 31, 2004 and $10.5 million for the comparative quarterended February 29, 2004. These comparative quarters reflect revenues solely from the FazendaBrasileiro Mine. A total of 23,982 ounces of gold were sold during the comparative quarterended December 31, 2004 and 26,617 ounces of gold were sold during the quarter endedFebruary 29, 2004. An additional 1,704 ounces from the Fazenda Nova Mine and 739 ounces from the São Francisco pilot plant were sold during the comparative quarter endedDecember 31, 2004. The average gold price realized during the fourth quarter was $485 perounce. This compares to an average spot price of $469 per ounce of gold for the same period.
Mine operating earnings for the quarter were $4.8 million, an increase of 227% from thethird quarter ended September 30, 2005 and an increase of 64% from the comparative quarterended December 31, 2004. Mine operating earnings do not reflect inventory of 5,200 ounces at Fazenda Brasileiro which included gold in circuit. Mine operating earnings for the quartermainly reflected increased earnings from the Fazenda Nova Mine.
Gold production for the fourth quarter totaled 31,762 ounces of gold of which 17,810ounces were produced at the Fazenda Brasileiro Mine, 12,740 ounces were produced at theFazenda Nova Mine and 1,212 ounces were produced from the São Francisco pilot plant.During the comparative quarter ended December 31, 2004, an aggregate of 24,445 ouncesof gold were produced of which 20,854 ounces were produced from the Fazenda BrasileiroMine, 2,745 ounces from the Fazenda Nova Mine and 846 ounces from the São Francisco pilotplant. Commercial production for the fourth quarter increased by 2% relative to that of the thirdquarter ended September 30, 2005. This overall increase is comprised of an increase of 23% in production from the Fazenda Nova Mine. Production for the fourth quarter at the FazendaBrasileiro Mine decreased as grade decreased from an average of 2.47 g/t during the thirdquarter to and average of 2.31 g/t for the fourth quarter; a decrease of 6.5%.
Average cash costs for the quarter at the Fazenda Brasileiro Mine increased relative to the third quarter as a result of the decrease in ore grade for the quarter. Real denominated cashcosts per ounce increased by 5.6% relative to the third quarter. In US dollar terms, cash costsper ounce at the Fazenda Brasileiro Mine increased by 8% relative to the third quarter.
GROWTHVALUE
68
A n n u a l R e p o r t 2 0 0 5
41894_fin_p68 3/22/06 2:04 PM Page 68

Cash costs per ounce for the quarter at the Fazenda Nova Mine decreased relative to thethird quarter by 18%. Overall average cash costs per ounce decreased by 3% for the fourthquarter at $282 per ounce. These were comprised of cash costs from the Fazenda Nova Mine of $177 per ounce and cash costs from the Fazenda Brasileiro Mine of $357 per ounce. Thiscompares to cash costs for the previous quarter of $291 per ounce, comprised of cash costs fromthe Fazenda Nova Mine of $215 per ounce and cash costs from the Fazenda Brasileiro Mine of $332 per ounce.
Inventory increased during the fourth quarter as stacking of ore onto the heap leach pads began at the São Francisco Mine and stockpiling of ore commenced at Chapada.
Cash flows from financing activities for the quarter included gross proceeds of $110.9million on an equity issue for 26 million shares at a price of C$5.00 per share. Additionally, the Company received $30.2 million in proceeds from debt funding held in escrow.
Capital expenditures on fixed assets, mineral properties and construction for the fourthquarter were $61.6 million.
The table below presents selected quarterly financial and operating data:
December 31, September 30, June 30, March 31,2005 2005 2005 2005
Financial results (in thousands of dollars)Revenue (i) $ 16,655 $ 10,749 $ 10,785 $ 7,850Net earnings (loss) for the period $ (73) $ 3,246 $ (7,576) $ 292
Per share financial resultsBasic and diluted earnings (loss) per share $ (0.00) $ 0.02 $ (0.06) $ 0.00
Financial Position (in thousands of dollars)Total assets $ 465,697 $ 345,206 $ 289,433 $ 177,902Total long-term liabilities $ 119,281 $ 118,557 $ 113,586 $ 8,924
Gold sales (ounces): (iii)
Fazenda Brasileiro 19,257 16,137 18,131 18,549Fazenda Nova 15,463 8,809 7,426 –
34,720 24,946 25,557 18,549
Gold production (ounces):Commercial production:
Fazenda Brasileiro 17,810 19,558 18,143 19,059Fazenda Nova 12,740 10,364 5,676 –
30,550 29,922 23,819 19,059
Pre-operating production:Fazenda Nova – – 2,150 5,229São Francisco Pilot Plant 1,212 1,033 1,376 1,222
1,212 1,033 3,526 6,451
Total production 31,762 30,955 27,345 25,510 YAMANAVISION
69
Y A M A N A G O L D I N C.
41894_fin_p69 3/22/06 2:04 PM Page 69

December 31, September 30, June 30, March 31,2005 2005 2005 2005
Non-GAAP Measures (iv)
Per ounce data:Cash costs per ounce produced: (ii),(iii)
Fazenda Brasileiro $ 357 $ 332 $ 330 $ 263Fazenda Nova $ 177 $ 215 $ 265 $ –
$ 282 $ 291 $ 314 $ 263
Average gold price realized: (i),(iii)
Fazenda Brasileiro $ 483 $ 436 $ 426 $ 427Fazenda Nova $ 487 $ 433 $ 427 $ –
$ 485 $ 435 $ 426 $ 427
Operating statistics (iii)
Gold ore grade (g/t):Fazenda Brasileiro 2.31 2.47 2.33 2.66Fazenda Nova 0.87 0.86 0.90 –
Gold recovery rate (%):Fazenda Brasileiro 88.3 89.6 89.6 90.4Fazenda Nova 90.0 78.0 83.0 –
December 31, September 30, June 30, February 29,2004 2004 2004 2004
Financial results (in thousands of dollars)Revenue (i) $ 10,305 $ 8,827 $ 13,166 $ 10,453Net earnings (loss) for the period $ 804 $ 6 $ 1,973 $ 639
Per share financial resultsBasic and diluted earnings (loss) per share $ 0.01 $ 0.00 $ 0.02 $ 0.01
Financial Position (in thousands of dollars)Total assets $ 177,106 $ 101,196 $ 96,363 $ 93,948Total long-term liabilities $ 9,572 $ 8,145 $ 7,240 $ 7,657
Gold sales (ounces): (iii)
Fazenda Brasileiro 23,982 22,246 33,594 26,617
Gold production (ounces):Commercial production:
Fazenda Brasileiro 20,854 23,214 34,099 25,944Pre-operating production:
Fazenda Nova 2,745 104 – –São Francisco pilot plant 846 1,157 1,211 283
3,591 1,261 1,211 283
Total Production 24,445 24,475 35,310 26,227GROWTHVALUE
70
A n n u a l R e p o r t 2 0 0 5
41894_fin_p70 3/25/06 10:41 AM Page 70

December 31, September 30, June 30, February 29,2004 2004 2004 2004
Non-GAAP Measures (iv)
Per ounce data:Cash costs per ounce produced: (ii),(iii)
Fazenda Brasileiro $ 224 $ 215 $ 188 $ 204
Average gold price realized: (i), (iii)
Fazenda Brasileiro $ 434 $ 401 $ 396 $ 407
Operating statistics (iii)
Gold ore grade (g/t):Fazenda Brasileiro 2.82 3.07 3.44 3.50
Gold recovery rate (%):Fazenda Brasileiro 92.5 92.4 95.5 95.3
(i) Revenues consist of sales net of sales taxes. Revenue per ounce data is calculated based on gross sales.(ii) Certain mine general and administrative costs have been reclassified from mine operating earnings and cash costs to
general and administrative expenses. (iii) During commercial production.(iv) A cautionary note regarding non-GAAP measures follows this Management’s Discussion and Analysis of Operations
and Financial Condition.(v) Net (loss) earnings, basic (loss) earnings per share and diluted earnings per share for the quarter ended
December 31, 2005 include an unrealized non-cash loss on commodity contracts of $8.6 million.
18. Critical Accounting Policies and Estimates
In preparing financial statements in accordance with Canadian GAAP, management is required to make estimates and assumptions that affect the reported amounts of assets, liabilities, revenuesand expenses for the period end. Critical accounting estimates represent estimates that areuncertain and for which changes in those estimates could materially impact on the Company’sfinancial statements. Management reviews its estimates and assumptions on an ongoing basisusing the most current information available. The following accounting estimates are critical:
• Closure and reclamation costsClosure and reclamation costs are accrued at their fair value and are estimated based on the Company’s interpretation of current regulatory requirements.
• Depletion and impairment of mineral propertiesDepletion and impairment of mineral properties is impacted by estimates of reserves andresources. There are numerous uncertainties inherent in estimating mineral reserves andmineral resources. Differences between management’s assumptions and market conditionscould have a material effect in the future on the Company’s financial position and results of operation.
• Reserve estimates The figures for reserves and resources are determined in accordance with NationalInstrument 43-101, “Standards of Disclosure for Mineral Projects”, issued by the CanadianSecurities Administrators. There are numerous uncertainties inherent in estimating mineralreserves and mineral resources, including many factors beyond the Company’s control.Such estimation is a subjective process, and the accuracy of any reserve or resourceestimate is a function of the quantity and quality of available data and of the assumptionsmade and judgments used in engineering and geological interpretation. Differences
YAMANAVISION
71
Y A M A N A G O L D I N C.
41894_fin_p71 3/25/06 10:41 AM Page 71

between management’s assumptions including economic assumptions such as metal pricesand market conditions could have a material effect in the future on the Company’sfinancial position and results of operation.
There were no changes in the Company’s accounting policies during the fiscal year endedDecember 31, 2005.
19. Construction Project
Chapada Copper-Gold Project
A formal construction decision on the Chapada copper-gold project was made inDecember 2004 and construction of Chapada commenced in 2005. Mining and commencementof mining operations is expected to start in the fourth quarter of 2006 as compared to the firstquarter of 2007 as contemplated in the original construction schedule. The revised scheduleassumes construction progress continues in line with current progress.
The feasibility study for Chapada estimates capital requirements of $178 million beforeworking capital of which $100 million is being financed through a loan facility and the remainingcosts will be funded by the Company’s own resources.
The mine plan for Chapada contemplates average annual production of approximately 130 million pounds payable copper and 134,000 ounces payable gold per year in concentrate for each of the first five years of operations for a total (life of mine) of 2 billion pounds ofrecoverable copper and 1.3 million ounces of recoverable gold. Production is expected tocommence in the fourth quarter of 2006 and commercial production is expected before the end of the first quarter of 2007.
Construction costs incurred during the year ended December 31, 2005 and during the fourthquarter were $80.3 million and $42.2 million respectively, including amounts in payables. Totalconstruction costs as at December 31, 2005 were $91.3 including capitalized items. Approximately61% of total budget costs were committed as at December 31, 2005. Additional commitments andexpenditures of R$210 million and R$330 million respectively, are expected to completion of theproject. Total construction expenditures as at December 31, 2005 were $86 million or R$202million. Capitalized items charged to assets under construction include capitalized interest on theloan facility and amortization of deferred financing costs. A total of $6.7 million of net interest was capitalized to construction costs and a total of $1.1 million of amortization of deferredfinancing costs were charged to construction costs during the year.
Total construction costs in reais are expected to be on budget at R$534 million but overbudget in US dollar terms due to the strengthening of the Real to the US dollar.
Vendor accounts payable relating to the construction and development of the Chapadaproject were $4.1 million. Approximately 94% of total payables were under 60 days as atDecember 31, 2005.
Construction of Chapada is on schedule. An aggregate of 3.7 million tonnes were minedand stockpiled as at December 31, 2005. These were reflected in inventory as at the period end.
GROWTHVALUE
72
A n n u a l R e p o r t 2 0 0 5
41894_fin_p72 3/22/06 2:05 PM Page 72
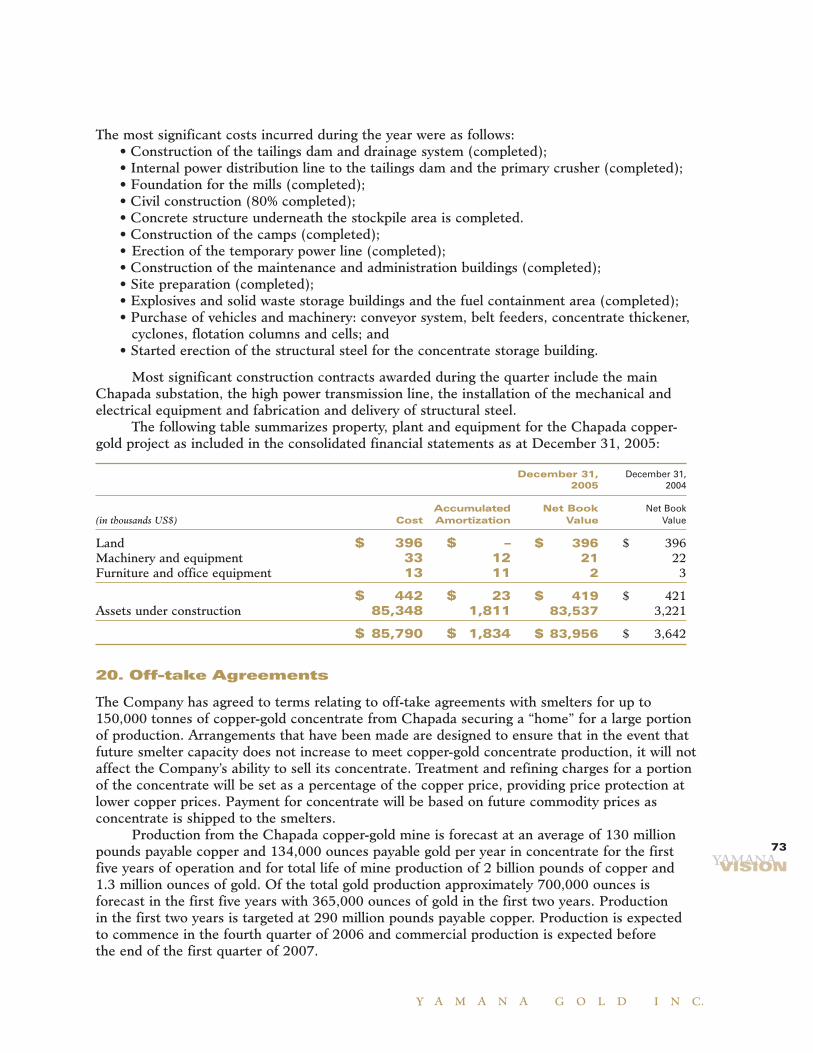
The most significant costs incurred during the year were as follows: • Construction of the tailings dam and drainage system (completed); • Internal power distribution line to the tailings dam and the primary crusher (completed); • Foundation for the mills (completed); • Civil construction (80% completed);• Concrete structure underneath the stockpile area is completed.• Construction of the camps (completed);• Erection of the temporary power line (completed);• Construction of the maintenance and administration buildings (completed);• Site preparation (completed);• Explosives and solid waste storage buildings and the fuel containment area (completed);• Purchase of vehicles and machinery: conveyor system, belt feeders, concentrate thickener,
cyclones, flotation columns and cells; and • Started erection of the structural steel for the concentrate storage building.
Most significant construction contracts awarded during the quarter include the mainChapada substation, the high power transmission line, the installation of the mechanical andelectrical equipment and fabrication and delivery of structural steel.
The following table summarizes property, plant and equipment for the Chapada copper-gold project as included in the consolidated financial statements as at December 31, 2005:
December 31, December 31,2005 2004
Accumulated Net Book Net Book (in thousands US$) Cost Amortization Value Value
Land $ 396 $ – $ 396 $ 396Machinery and equipment 33 12 21 22Furniture and office equipment 13 11 2 3
$ 442 $ 23 $ 419 $ 421Assets under construction 85,348 1,811 83,537 3,221
$ 85,790 $ 1,834 $ 83,956 $ 3,642
20. Off-take Agreements
The Company has agreed to terms relating to off-take agreements with smelters for up to150,000 tonnes of copper-gold concentrate from Chapada securing a “home” for a large portionof production. Arrangements that have been made are designed to ensure that in the event thatfuture smelter capacity does not increase to meet copper-gold concentrate production, it will notaffect the Company’s ability to sell its concentrate. Treatment and refining charges for a portionof the concentrate will be set as a percentage of the copper price, providing price protection atlower copper prices. Payment for concentrate will be based on future commodity prices asconcentrate is shipped to the smelters.
Production from the Chapada copper-gold mine is forecast at an average of 130 millionpounds payable copper and 134,000 ounces payable gold per year in concentrate for the first five years of operation and for total life of mine production of 2 billion pounds of copper and 1.3 million ounces of gold. Of the total gold production approximately 700,000 ounces isforecast in the first five years with 365,000 ounces of gold in the first two years. Production in the first two years is targeted at 290 million pounds payable copper. Production is expected to commence in the fourth quarter of 2006 and commercial production is expected before the end of the first quarter of 2007.
YAMANAVISION
73
Y A M A N A G O L D I N C.
41894_fin_p73 3/22/06 2:06 PM Page 73

21. Hedging Program
The Company implemented an economic copper hedging program that is intended to help securea less than two year payback at its Chapada copper-gold project and manage the Company’sexposure to copper prices, thus protect future earnings and cash flows from a decline in themarket price of copper. The program provides an average forward price of $1.37 per pound ofcopper for a total of 50.2 million pounds of copper in 2007, representing about one half ofplanned copper production for that year. This program includes long call options at an averagestrike price of approximately $1.67 per pound of copper thereby providing further upside in theevent that copper prices exceed that threshold level. This synthetic put was designed to limit theCompany’s exposure to $15 million which will occur if copper prices at the date of the contractmaturity exceed $1.67 per pound. The Company has unlimited upside on the copper pricegreater than $1.67 level. No cash has been paid for the call options as the price has beendeducted from the hedge price, providing a net hedge price of $1.27 per pound. The programrequires no cash margin, collateral or other security from the Company. Moreover, the remaining55 million pounds of copper production forecast for 2007 and all gold production remainunhedged.
This program increases operating cash flow from Chapada above feasibility study levelswithout removing the upside from significantly higher copper prices. As such, it also mitigatesagainst certain cost increases primarily resulting from the appreciation of the Brazilian currencyto the United States dollar as it increases forecast revenue. It ensures that revenue from copperat the Chapada mine will be at much higher levels than assumed in the feasibility study and mineplan for the Chapada mine. To the extent that the copper is produced in quantities equal to orgreater than the hedged pounds under the forward contracts, then at the closing of the forwardcontract, any obligation under the contracts is economically offset against the additional revenue derived from the physical production.
Benefits of the hedging program include:• Providing support for the payback of Chapada which at $1.00 per pound of copper price
and $400 per ounce of gold price has a two year payback;• Increasing the value of Chapada and thereby the net asset value per share of the Company;• Ensuring that the Company participates in higher copper prices especially for the balance
of its copper production;• Ensuring that the Company fully participates in any increase in gold prices from its
significant gold production at Chapada as no gold is being hedged;• Better positioning the Company and Chapada as a significant gold producer as copper is
monetized into cash; and• As copper is monetized, that cash flow will be available for development and acquisition
of other gold projects.
These economic hedges do not meet the requirements for hedge accounting under currentgenerally accepted accounting principles, however, the Company has concluded that the abovementioned financial instruments provide an effective means for the Company to manage metalprice risk and enable business planning with greater certainty. As accounting rules preclude theCompany from reflecting the economic substance of these transactions, mark-to-market valueson these financial instruments will be recognized period to period. As such, the recognition ofunrealized gains and losses on the fair value of these financial instruments will cause net earningsto fluctuate period to period. The Company has recorded an unrealized loss of $8.6 million incurrent earnings in this regard and the balance sheet reflects a liability of the same amount.
GROWTHVALUE
74
A n n u a l R e p o r t 2 0 0 5
41894_fin_p74 3/22/06 2:06 PM Page 74

This unrealized loss represents the loss the Company would have realized had it closed out its contracts on December 31, 2005 under metal price assumptions prevailing at that time. It does not represent an estimate of future losses or gains nor does it represent an economicobligation for the Company. It should be noted that the forward copper price used to value thehedge program at the year end was $1.62. If copper prices are at this level in 2007, then theunhedged portion of planned production for that year would generate additional gross revenue of $34 million as compared to the price assumption used in the feasibility study for the Chapadaproject.
The Company continues to evaluate the benefit of further hedging a portion of 2008 forecastproduction.
22. Off-Balance Sheet Arrangements
The Company does not have any off-balance sheet arrangements.
23. Reserve Estimates
The figures for reserves and resources are determined in accordance with National Instrument43-101, issued by the Canadian Securities Administrators. This standard lays out the standardsof disclosure for mineral projects including rules relating to the determination of mineralreserves and resources. This includes a requirement that a “qualified person” (as defined underthe NI 43-101) supervise the preparation of the reserve reports. The Company’s reserve reports areprepared and reviewed by Evandro Cintra, Vice-President Exploration, who is a “qualified person”.
As at December 31, 2005, the Company had proven and probable reserves of 5.2 millioncontained ounces of gold, an increase of 1.2 million contained ounces from the previous year enddespite a depletion through production during the year of 116,000 gold ounces. The primarychanges in proven and probable reserves were:
Increase in Contained Ounces
(000’s)
C-1 Santa Luz 556São Francisco 324São Vicente 309
Successful exploration efforts and the impact of a higher gold price assumption used in2004 resulted in an increase in reserves. Reserves as at December 31, 2005 were estimatedusing a gold price of $425 per ounce compared to $325-$350 used to calculate reserve estimatesas at December 31, 2004.
Gold price per oz./price per lb.
Mine / Project 2005 2004
Fazenda Brasileiro $ 425 $ 350Chapada $ 425/$ 1.00 $ 325/$ 0.85São Francisco $ 425 $ 350São Vicente $ 425 $ 325Fazenda Nova $ 500 $ 345C1 Santa Luz $ 425 $ –Ernesto $ 425 $ –
YAMANAVISION
75
Y A M A N A G O L D I N C.
41894_fin_p75 3/25/06 10:42 AM Page 75

Proven and probable reserves for the São Francisco Mine of 1.4 million contained ounceshave increased by 324,000 ounces over the last year. This increase is a result of the explorationactivities during the year. Such increase in reserves extends the mine life of São Francisco toapproximately 10 years, representing a 2.5 year increase over the initial mine life at estimatedproduction rates contemplated in the feasibility study and mine plan. Current resource estimatesinclude 1.7 million ounces of measured and indicated resources plus an addition of 0.9 millionounces of inferred resources. This compares to 1.4 million ounces of measured and indicatedresources plus an addition of 0.8 million ounces of inferred resources as at December 31, 2004.Furthermore, bulk samples at São Francisco suggest actual grades may exceed drill indicatedgrades due to the coarse gold effect.
The year end proven and probable reserves at the Fazenda Brasileiro Mine as at December 31,2005 were 206,700 ounces of gold (December 31, 2004 - 233,000 ounces; February 29, 2004 -257,000 ounces). Reserves have decreased by 26,300 contained ounces despite having produced75,000 ounces during the year. Total measured and indicated resources at year end were 444,000 contained ounces, representing a net increase of 34,000 ounces for 2005. The Companyplans to continue an exploration program to expand the resources and reserves and increase the mine life.
As at December 31, 2005, Fazenda Nova had proven and probable reserves of 92,300ounces compared to 146,600 ounces as at December 31, 2004. The Fazenda Nova Minecontinues to have a three year mine life based on probable reserves.
Proven and probable reserves as at December 31, 2005 for São Vicente are 470,000ounces of contained gold, an increase of approximately 300,000 contained ounces from the prioryear. Total measured and indicated resources are 660,000 contained ounces as at December 31,2005. In May 2005, the Company completed a positive feasibility study in respect to São Vicente.The results of the feasibility study confirmed an increase in mineral reserves at São Vicente, with an increase in forecast production. The initial plan for São Vicente contemplated treatingSão Vicente and São Francisco on a combined basis, however, based on positive explorationresults to date, the Company later concluded that São Vicente could be constructed as a stand-alone mine. In addition, São Vicente has significant coarse gold effect similar to São Francisco. As such, the Company decided to defer a formal construction decision pending a feasibility study by April 2006 as further discussed under the Exploration and Developmentsection of this Management’s Discussion and Analysis.
Proven and probable reserves at Chapada are 2.55 million ounces of contained gold and2.35 billion pounds of contained copper, comparable to last year. The current mine plan forChapada contemplates a 19-year mine life. Resource estimates for Chapada include 3.05 milliongold ounces of measured and indicated resources and 2.81 billion pounds of copper measuredand indicated resources.
The current reserve estimate includes the addition of the C1 Santa Luz Project. Anaggregate of 556,000 contained ounces of proven and probable reserves were added from the C1 Santa Luz Project. It is the Company’s view that these reserve estimates could support astand-alone mine. Additionally, C1 Santa Luz resource estimates (including reserves) include982,400 ounces of measured and indicated resources plus 199,700 ounces of inferred resources.Our new project Ernesto added 141,800 ounces of measured and indicated resources and71,400 ounces of inferred resources to current year resource estimates. The development planfor these target areas are further discussed in the Exploration and Development section of this report.
GROWTHVALUE
76
A n n u a l R e p o r t 2 0 0 5
41894_fin_p76 3/22/06 2:07 PM Page 76

It should be noted that reserves and resources are estimates only. There are numerousuncertainties inherent in estimating mineral reserves and mineral resources, including manyfactors beyond the Company’s control. Such estimation is a subjective process, and the accuracyof any reserve or resource estimate is a function of the quantity and quality of available data and of the assumptions made and judgments used in engineering and geological interpretation.
Fluctuations in gold prices, results of drilling, metallurgical testing and production and theevaluation of mine plans subsequent to the date of any estimate may require revision of suchestimate. The volume and grade of reserves mined and processed and recovery rates may not bethe same as currently anticipated. Any material reductions in estimates of mineral reserves andmineral resources, or of the Company’s ability to extract these mineral reserves, could have a material adverse effect on the Company’s results of operations and financial condition.Depreciation and amortization using the units of production would be impacted by a change in reserves/resources.
Complete information relating to reserves and resources indicating tonnage and grade for the various mines and projects is contained in a complete resource and reserve tableaccompanying this annual report.
24. Exploration and Development
The Corporation’s exploration efforts in Brazil included: (i) further drilling at Ernesto; (ii) further drilling and bulk sampling at São Vicente Deep South; and (iii) at C-1 Santa Luz. The Company has allocated approximately $9.5 million in 2006 for exploration focusing on theseareas. The Company is also preparing an exploration program for the properties acquired fromRNC Gold Inc. which includes the Hemco concessions.
The Company spent $4.8 million and $15.4 million during the fourth quarter and the yearended December 31, 2005, respectively. This compares to $6.8 spent during the comparative ten month period ended December 31, 2004 on exploration.
São Vicente
At São Vicente, the 2005 exploration program included (i) a program of surface drilling; (ii) drift excavation and bulk sampling; and (iii) underground drilling from drill stationsestablished from the drift and extending into the orebody. São Vicente has a significant coarsegold effect similar to São Francisco and as such bulk sampling and underground drilling wereundertaken to better understand the true grade. Evidence from bulk samples to date suggestsgrades that will exceed drill indicated and reserve grades. In addition, drilling and bulk samplingresults continue to support the view of a larger open pit operation than contemplated in theoriginal feasibility study completed in May 2005. There is also the possibility for a newconcurrent underground operation. The initial plan for São Vicente contemplated treating São Vicente and São Francisco on a combined basis; however, the results of the feasibility studysupport the Company’s later conclusion that São Vicente can be constructed as a stand-aloneproject. Based on positive results to date from continuing exploration at São Vicente, theCorporation has decided to defer a formal construction decision pending further explorationresults and further feasibility evaluation to optimize the project. The development plan for São Vicente contemplates a feasibility study (including a new reserve estimate) in 2006 and(assuming a positive feasibility study) the potential commencement of construction in early to mid 2007.
YAMANAVISION
77
Y A M A N A G O L D I N C.
41894_fin_p77 3/22/06 2:07 PM Page 77

C-1 Santa Luz
C-1 Santa Luz is one of eight (and the most advanced) of the priority targets on theCorporation’s 197,000 hectares of mineral claims on the Rio Itapicuru Greenstone Belt north of the Fazenda Brasileiro Mine.
In December 2005, the Company announced the results of a Phase 1 scoping study for C1 Santa Luz. The purpose of the study was to provide an initial economic assessment of theproject and assess the merits of undertaking a formal feasibility study. The results were positiveand the Company is continuing to assess the development of the project as a stand alone mine.Measured and indicated resources were 18.4 million tonnes grading 1.66 g/t for 982,400 ouncesand inferred resources were 2.0 million tonnes grading 3.09 g/t for 199,700 ounces. TheCompany is continuing to drill and believes that it can add to the current resource base and ultimately prove the feasibility of an open pit and underground operation.
The development plan for C1 Santa Luz contemplates a feasibility study in 2006 and(assuming a positive feasibility study) potential commencement of construction in 2007.
Ernesto
Ernesto is a priority target on the Company’s 450,000 hectares of mineral claims on theSanta Elina Gold Belt. A current drilling program supports the potential for Ernesto to become a stand-alone mine. Ernesto is located approximately 65 kilometres south of the São Franciscoproject. The Company believes Ernesto has the potential to be a high grade, very shallowunderground mine. The development plan for Ernesto contemplates a pre-feasibility study in late 2006 and, assuming a positive result, a feasibility study will be placed in 2006 to 2007 and potential commencement of construction in 2007 or 2008.
São Vicente, Ernesto and C1 Santa Luz are subject to completion of either feasibilitystudies or favourable construction decisions. Development of these projects is anticipated to be sequential, however, whether or not they are developed, or are developed in sequence, willdepend on results from continuing exploration efforts and scoping and feasibility studies.
Current internal estimates and completed scoping studies suggest that these projects could contribute in excess of an additional 225,000 ounces of gold production beginning in2008. However, there is no assurance that all or any of them will be developed nor that they will be developed within the periods contemplated herein.
Fazenda Brasileiro
Current reserves and resources at Fazenda Brasileiro are expected to support a mine lifefor an additional four years. However, ongoing exploration initiatives are aimed at increasing the mine life of Fazenda Brasileiro to a minimum of seven years. The Company has doubled itsmineral concessions and mining rights on the Rio Itapicuru Greenstone Belt north of FazendaBrasileiro to 180,000 hectares and the exploration budget this year for this area is approximately$4.1 million. Six high-priority targets will be followed up this year including: Vereda Grande,Mansinha, Riacho do Miguel, Cubango, Mari and C1 Santa Luz extension.
GROWTHVALUE
78
A n n u a l R e p o r t 2 0 0 5
41894_fin_p78 3/22/06 2:07 PM Page 78

The Company has allocated $9.5 million in the 2006 budget for exploration as follows:
2006 Budget
Itapicaru Greenstone Belt/Fazenda Brasileiro 43%Santa Elina Gold Belt 51%Fazenda Nova 2%Chapada 3%Generative 1%
100%
25. Sale of Argentine Assets
Subsequent to the year end, the Company closed the sale of its Argentine assets. Considerationwas comprised of a combination of cash proceeds and an equity interest in the capital of the purchaser. Upon closing of the transaction, the purchaser paid $350,000 and delivered 8 million common shares of the purchaser and 4 million common share purchase warrants of the purchaser. The purchaser will provide additional consideration in late 2006. Deferredconsideration will consist of either of the following at the option of the purchaser: (i) $1.6 million, (ii) 10 million common shares and 5 million share purchase warrants of thepurchaser or (iii) $800,000 plus 5 million common shares and 2.5 million share purchasewarrants of the purchaser. Consideration also includes a royalty of any and all ounces mined,produced or otherwise recovered from the properties, limited to an aggregate of $2 million. As at December 31, 2005, the Argentine assets were reflected as assets held for sale on thebalance sheet. The Company did not recognize a significant gain or a loss on the transaction.
26. Outlook and Strategy
The Company is committed to increasing shareholder value through increases in reserves andproduction thereby increasing earnings per share and cash flow from operations. The Company’sstrategy involves optimizing operations, completing construction of projects currently underdevelopment, investing in high target exploration areas and growing through acquisitions of high quality accretive properties and projects. The Company’s financial strategy involvesensuring there are sufficient resources available to bring the Company’s development projectsinto production and fund an exploration program focused on high priory targets.
The focus for 2006 and 2007 will continue to include the following: • Advance exploration and development projects;• Complete construction of the Chapada copper-gold mine;• Pursue acquisition targets; and• Continue an extensive exploration program in Brazil and Central America.
With the acquisition of RNC Gold Inc., the Company acquired an additional two operatingmines. The additional two operating mines are La Libertad in Nicaragua and San Andrés inHonduras. The Company will have five mines in operation with Chapada operations beginninglate 2006. Yamana also has four advanced exploration and development stage projects along withan extensive Brazilian and Central American exploration portfolio. Yamana’s objective remains to achieve a sustainable annual gold production rate of at least 750,000 ounces of gold per yearbeginning in 2008. In addition, the Company will have significant copper production by 2007.Subsequent to the year end, the Company also announced the potential acquisition of Desert Sun Mining Corp.
YAMANAVISION
79
Y A M A N A G O L D I N C.
41894_fin_p79 3/25/06 10:42 AM Page 79

Production
During the year ended December 31, 2006, it is estimated that the Company will producegold in the range of 340,000 to 373,000 ounces at average cash costs of $260-$275 per ounce.The completion of the acquisition of Desert Sun Mining Corp. will increase these levels.
Estimated gold production from the Company’s properties is as follows:
Gold Production Estimates 2006E
Fazenda Brasileiro 80-85,000Fazenda Nova 30-33,000São Francisco 120-126,000Chapada 15-19,000San Andrés 50-60,000La Libertad 45-50,000
Total 340-373,000
Average Projected Total Cash Costs per Ounce $ 260-275
Information relating to production ounces includes ounces produced before a mine isconsidered to be in commercial production. Commercial production is a convention fordetermining the point at which a mine is producing at a sustainable commercial level, afterwhich costs are no longer capitalized and are treated as operating costs. Commercial productionwill vary from mine to mine and differs amongst various companies. Cash costs shown abovereflect operating costs after declaration of commercial production.
Production estimates stated above do not include the potential gold production fromadvanced projects including São Vicente, Ernesto, C1 Santa Luz or from RNC’s Cerro Quemaproperty. These projects are subject to completion of feasibility studies or favourableconstruction decisions. However, current internal estimates and completed scoping studiessuggest that these properties could contribute in excess of an additional 225,000 ounces of gold production beginning 2008.
Production in 2006 includes the first year of operations for São Francisco and assumescommercial production during the second quarter of 2006. There are considerable ordinarycourse start-up adjustments of a heap leach mine operation such as São Francisco which mayaffect production levels in 2006. Actual production for 2006 may also be affected by rainfallswhich could delay the start-up of operations.
Gold production in 2006 at Chapada will mainly depend on whether or not mineconstruction is completed in September 2006. Commercial production is assumed during thefirst quarter of 2007. Copper production from the Chapada Mine is expected to be 15 millionpounds and 128 million pounds for 2006 and 2007, respectively. Gold production from theChapada Mine is expected to be 15,000 to 19,000 ounces for 2006.
Production estimates for Fazenda Brasileiro incorporate only limited production in 2006and 2007 resulting from access to the higher grade C Quartz and E-Deep areas. Mining of lowergrade material at Fazenda Brasileiro will continue throughout 2006 and part of 2007 to permitaccess to higher grade lower areas at E-Deep.
Gold production information for San Andrés and La Libertad has been provided by RNCand adjusted to reflect Yamana’s current view of the respective mine plans. The Companycontinues to evaluate these mines as part of its transition plan relating to the integration of these operations.
GROWTHVALUE
80
A n n u a l R e p o r t 2 0 0 5
41894_fin_p80 3/25/06 10:42 AM Page 80

RNC gold production is shown effective as of the acquisition date of March 2006.Forecast information is based on the opinions and estimates of management under current
circumstances and are subject to a variety of risks and uncertainties and other factors that couldcause actual events or results to differ from projections. Forecast cash costs assume a Real to US dollar exchange rate of 2.43 to 1.0 in 2006 and 2.6 to 1.0 in 2007 and 2008. These exchangerate assumptions are more favourable than the current rate, but in line with Brazilian consensusestimates for these years.
27. Depletion and Impairment of Mineral Properties
Depletion on mineral properties is calculated based on a unit-of-production basis which is highlyimpacted by estimates of reserves and resources. There are numerous uncertainties inherent inestimating mineral reserves and mineral resources as discussed under reserve estimates.
Management has reviewed the undiscounted future cash flows of its mining projects, basedon a long-term gold price of $425 per ounce. Other estimates included in the determination of future cash flows include estimates on the amount of reserves, recoverable ounces andproduction levels. Based on this review, management has concluded that there is no impairmentin mineral properties as at the current fiscal year end. Assumptions underlying future cash flowestimates are subject to risks and uncertainties.
Differences between management’s assumptions and market conditions could have amaterial effect in the future.
28. Risks and Uncertainties
Exploration, development and mining of metals involve numerous inherent risks. As such, theCompany is subject to various financial, operational and political risks that could have asignificant impact on its profitability and levels of operating cash flows. Although the Companyassesses and minimizes these risks by applying high operating standards, including carefulmanagement and planning of its facilities, hiring qualified personnel and developing their skillsthrough training and development programs these risks cannot be eliminated. Such risks includechanges in local laws governing the mining industry, a decline in the price of gold or copper andthe activity in the mining sector, uncertainties inherent in estimating mineral reserves andmineral resources and fluctuations in local currency against the US dollar. The Company doesnot currently hedge foreign currency exposures.
The Company holds mining properties mainly in Brazil and as such is exposed to the lawsgoverning the mining industry in that country. The Brazilian government is currently supportiveof the mining industry but changes in government regulations including taxation, the repatriationof profits, restrictions on production, export controls, environmental compliance, expropriationof property and shifts in the political stability of the country and labour unrest could adverselyaffect the Company and its exploration and production initiatives in that country.
The Company will require an operating license from the Brasilian Departmento Nacionalda Produçaõ Mineral (the “DNPM”) to operate a mine in Brazil. An operating license will onlybe issued by the DNPM to the Company after construction of each mine is completed. In somecases, the DNPM will grant a temporary operating license during the period in which anapplication for an operating license is pending. However, there is no assurance that permanentoperating licenses will be issued to the Company in connection with the São Francisco gold mineor the Chapada copper-gold mine.
YAMANAVISION
81
Y A M A N A G O L D I N C.
41894_fin_p81 3/25/06 10:43 AM Page 81

To mitigate land title risks, the Company makes no commitments and does not undertakeexploration without first determining that necessary property rights are in good standing.However, despite the Company’s best efforts, land title may still be affected by undetecteddefects.
Conducting exploration and production in Latin America also exposes the Company to the risk of currency fluctuations. A significant portion of the Company’s expenditures aredenominated in Brazilian reais and Canadian dollars and revenues are earned in US dollars. A strengthened local currency could adversely affect the Company’s costs denominated in US dollars. Historically, the Real has been highly volatile relative to other currencies and canfluctuate significantly against the US dollar over short-term periods.
The mining industry is intensely competitive and is highly dependent on commodity prices.A decline in the price of gold or copper could negatively impact the Company’s operations.
Mineral reserves and resources are estimates which may differ significantly from actualmining results.
Readers are encouraged to read and consider the risk factors more particularly described in the Company’s Annual Information Form for the year ended December 31, 2005. Such riskfactors could materially affect the future operating results of the Company and could causeactual events to differ materially from those described in forward-looking statements relating tothe Company.
29. Disclosure Controls and Procedures
The Company’s Chief Executive Officer and Chief Financial Officer have each evaluated theeffectiveness of the Company’s disclosure controls and procedures as of December 31, 2005 and have concluded that these controls and procedures are effective in providing reasonableassurance that material information relating to the Company is made known to them by otherswithin the Company.
This report provides a discussion and analysis of the financial condition and results of operations (“Management’s Discussion and Analysis”) to enable a reader to assess materialchanges in financial condition between December 31, 2005 and December 31, 2004 andresults of operations for the period ended December 31, 2005, for the ten month period endedDecember 31, 2004 and for the period ended February 29, 2004. This Management’sDiscussion and Analysis has been prepared as of March 20, 2006. The audited consolidatedfinancial statements prepared in accordance with Canadian Generally Accepted AccountingPrinciples (“Canadian GAAP”) follow this Management’s Discussion and Analysis. ThisManagement’s Discussion and Analysis is intended to supplement and complement the auditedconsolidated financial statements and notes thereto for the period ended December 31, 2005(collectively the “Financial Statements”). You are encouraged to review the FinancialStatements in conjunction with your review of this Management’s Discussion and Analysis.This Management’s Discussion and Analysis should be read in conjunction with both theannual audited consolidated financial statements for the period ended December 31, 2005 and the most recent Annual Information Form for the period ended December 31, 2005 on filewith the Securities Commissions of all of the provinces in Canada and the Annual Report onForm 40-F on file with the United States Securities and Exchange Commission. Certain notesto the Financial Statements are specifically referred to in this Management’s Discussion andAnalysis and such notes are incorporated by reference herein. All Dollar amounts in theManagement’s Discussion and Analysis are in US dollars, unless otherwise specified.
GROWTHVALUE
82
A n n u a l R e p o r t 2 0 0 5
41894_fin_p82 3/22/06 2:09 PM Page 82

Cautionary Note Regarding Forward-Looking Statements
This document contains “forward-looking statements” that involve a number of risks anduncertainties. Forward-looking statements include, but are not limited to, statements with respect to the future price of gold, the estimation of mineral reserves and resources, the realization of mineralestimates, the timing and amount of estimated future production, costs of production, capitalexpenditures, costs and timing of the development of new deposits, success of exploration activities,permitting time lines, currency fluctuations, requirements for additional capital, government regulationof mining operations, environmental risks, unanticipated reclamation expenses, title disputes or claims,limitations on insurance coverage and timing and possible outcome of pending litigation. Often, but not always, forward-looking statements can be identified by the use of words such as “plans”,“expects”, or “does not expect”, “is expected”, “budget”, “scheduled”, “estimates”, “forecasts”, “intends”,“anticipates”, or “does not anticipate”, or “believes”, or variations of such words and phrases or statethat certain actions, events or results “may”, “could”, “would”, “might” or “will” be taken, occur or beachieved. Forward-looking statements are based on the opinions and estimates of management as of the date such statements are made, and they involve known and unknown risks, uncertainties and other factors which may cause the actual results, performance or achievements of the Company to bematerially different from any other future results, performance or achievements expressed or implied by the forward-looking statements. Such factors include, among others: the business of Yamana and itsstrategic acquisitions not being integrated or such integration providing more difficult, time consumingor costlier than expected; unexpected events during construction, expansion and start-up; the actualresults of current exploration activities; actual results of current reclamation activities; conclusions of economic evaluations; changes in project parameters as plans to continue to be refined; future pricesof gold; possible variations in ore grade, tonnes mined, crushed or milled or recovery rates; failure ofplant, equipment or processes to operate as anticipated; accidents, labour disputes and other risks of the mining industry; delays in obtaining governmental approvals or financing or in the completionof development or construction activities, fluctuations in metal prices, as well as those risk factorsdiscussed or referred to in the Company’s annual Management’s Discussion and Analysis and AnnualInformation Form filed with the securities regulatory authorities in all provinces of Canada andavailable at www.sedar.com, and the Company’s Annual Report on Form 40-F filed with the UnitedStates Securities and Exchange Commission. Although the Company has attempted to identifyimportant factors that could cause actual actions, events or results to differ materially from thosedescribed in forward-looking statements, there may be other factors that cause actions, events or results not to be anticipated, estimated or intended. There can be no assurance that forward-lookingstatements will prove to be accurate, as actual results and future events could differ materially fromthose anticipated in such statements. The Company undertakes no obligation to update forward-looking statements if circumstances or management’s estimates or opinions should change. Accordingly,readers are cautioned not to place undue reliance on forward-looking statements. YAMANAVISION
83
Y A M A N A G O L D I N C.
41894_fin_p83 3/22/06 2:09 PM Page 83

Non-GAAP Measures
The Company has included certain non-GAAP Measures including cost per ounce data,adjusted net earnings (loss) and adjusted net earnings (loss) per share to supplement its financialstatements, which are presented in accordance with Canadian GAAP. Non-GAAP measures do nothave any standardized meaning prescribed under Canadian GAAP, and therefore they may not becomparable to similar measures employed by other companies. The data is intended to provideadditional information and should not be considered in isolation or as a substitute for measures of performance prepared in accordance with Canadian GAAP.
The Company has included cost per ounce information data because it understands that certaininvestors use this information to determine the Company’s ability to generate earnings and cash flowfor use in investing and other activities. The Company believes that conventional measures ofperformance prepared in accordance with Canadian GAAP do not fully illustrate the ability of itsoperating mine to generate cash flow. The measures are not necessarily indicative of operating profit or cash flow from operations as determined under Canadian GAAP. Where cost per ounce data iscomputed by dividing GAAP operating cost components by ounces sold, the Company has notprovided formal reconciliations of these statistics. Cash costs are determined in accordance with the Gold Institute’s Production Cost Standard.
The Company uses the financial measures “adjusted net income (loss)” and “adjusted earnings(loss) per share” to supplement its consolidated financial statements. The presentation of adjustedmeasures are not meant to be a substitute for net earnings (loss) or net earnings (loss) per sharepresented in accordance with GAAP, but rather should be evaluated in conjunction with such GAAPmeasures. Adjusted net earnings (loss) and adjusted net earnings (loss) per share are calculated as netearnings excluding (a) options expense, (b) foreign exchange loss, (c) future income tax expense and(d) unrealized gains (losses) on commodity contracts. The terms “adjusted net earnings (loss)” and“adjusted net earnings (loss) per share” do not have a standardized meaning prescribed by CanadianGAAP, and therefore the Company’s definitions are unlikely to be comparable to similar measurespresented by other companies. The Company’s management believes that the presentation of adjustednet earnings (loss) and adjusted net earnings (loss) per share provide useful information to investorsbecause they exclude non-cash charges and are a better indication of the Company’s profitability fromoperations. The items excluded from the computation of adjusted net earnings (loss) and adjusted netearnings (loss) per share, which are otherwise included in the determination of net earnings (loss) and net earnings (loss) per share prepared in accordance with Canadian GAAP, are items that theCompany does not consider to be meaningful in evaluating the Company’s past financial performanceor the future prospects and may hinder a comparison of its period to period profitability.
GROWTHVALUE
84
A n n u a l R e p o r t 2 0 0 5
41894_fin_p84 3/22/06 2:10 PM Page 84

YAMANAVISION
85
Y A M A N A G O L D I N C.
The accompanying consolidated financialstatements of Yamana Gold Inc. and all theinformation in this annual report are theresponsibility of management and have been approved by the Board of Directors.
The consolidated financial statementshave been prepared by management in accordance with accounting principles generally accepted in Canada. When alternative accounting methods exist, management has chosen those it deems mostappropriate in the circumstances. Financialstatements are not precise since they includecertain amounts based on estimates and judgments. Management has determined such amounts on a reasonable basis in orderto ensure that the financial statements arepresented fairly, in all material respects.Management has prepared the financial information presented elsewhere in the annual report and has ensured that it is consistent with that in the financial statements.
Yamana Gold Inc. maintains systems of internal accounting and administrativecontrols in order to provide, on a reasonablebasis, assurance that the financial informationis relevant, reliable and accurate and that the Company’s assets are appropriatelyaccounted for and adequately safeguarded.
The Board of Directors is responsible for ensuring that management fulfills itsresponsibilities for financial reporting and isultimately responsible for reviewing andapproving the financial statements. TheBoard carries out this responsibility principally through its Audit Committee.
The Audit Committee is appointed by the Board, and all of its members are outsidedirectors. The Committee meets at least fourtimes a year with management, as well as theexternal auditors, to discuss internal controlsover the financial reporting process, auditingmatters and financial reporting issues, to satisfy itself that each party is properly discharging its responsibilities, and to review the quarterly and the annual reports,the financial statements and the externalauditors’ report. The Committee reports its findings to the Board for consideration when approving the financial statements forissuance to the shareholders. The Committeealso considers, for review by the Board andapproval by the shareholders, the engagementor reappointment of the external auditors.The consolidated financial statements havebeen audited by Deloitte & Touche LLP, the external auditors, in accordance withCanadian generally accepted auditing standards on behalf of the shareholders.Deloitte & Touche LLP has full and freeaccess to the Audit Committee.
Peter MarronePresident and Chief Executive Officer
Charles B. MainChief Financial Officer
March 20, 2006
MANAGEMENT’S RESPONSIBILITY FOR FINANCIAL REPORTING
41894_fin_p85 3/22/06 2:10 PM Page 85

To the Shareholders of Yamana Gold Inc.
We have audited the consolidated balancesheets of Yamana Gold Inc. as at December 31,2005 and 2004 and the consolidatedstatements of operations, deficit and cashflows for the year ended December 31, 2005,the ten month period ended December 31,2004 and the year ended February 29, 2004.These consolidated financial statements arethe responsibility of the Company’smanagement. Our responsibility is to expressan opinion on these consolidated financialstatements based on our audits.
We conducted our audits in accordancewith Canadian generally accepted auditingstandards. Those standards require that we plan and perform an audit to obtainreasonable assurance whether the financialstatements are free of material misstatement.An audit includes examining, on a test basis,evidence supporting the amounts anddisclosures in the financial statements. Anaudit also includes assessing the accountingprinciples used and significant estimatesmade by management, as well as evaluatingthe overall financial statement presentation.
In our opinion, these consolidatedfinancial statements present fairly, in allmaterial respects, the financial position ofYamana Gold Inc. as at December 31, 2005and 2004 and the results of its operationsand its cash flows for the year endedDecember 31, 2005, the ten month periodended December 31, 2004 and the yearended February 29, 2004 in accordance withCanadian generally accepted accountingprinciples.
The Company is not required to have, nor were we engaged to perform, an audit of its internal control over financial reporting.Our audits included consideration of internalcontrol over financial reporting as a basis for designing audit procedures that areappropriate in the circumstances, but not forthe purpose of expressing an opinion on theeffectiveness of the Company’s internalcontrol over financial reporting. Accordingly,we express no such opinion.
Independent Registered Chartered Accountants
March 20, 2006
Vancouver, British Columbia, Canada
GROWTHVALUE
86
A n n u a l R e p o r t 2 0 0 5
REPORT OF INDEPENDENT REGISTEREDCHARTERED ACCOUNTANTS
41894_fin_p86 3/22/06 2:10 PM Page 86

YAMANAVISION
87
Y A M A N A G O L D I N C.
December 31, December 31,2005 2004
AssetsCurrentCash and cash equivalents $ 151,633 $ 87,054 Receivables, advances and deposits 6,160 3,245Inventory (Note 5) 11,353 5,862 Income taxes recoverable 1,261 –
170,407 96,161
CapitalProperty, plant and equipment (Note 6) 24,992 17,938 Assets under construction (Note 7) 154,345 12,085 Mineral properties (Note 8) 61,506 38,256 Assets held for sale (Note 4) 5,667 5,413
246,510 73,692
OtherInvestments (Note 9) 2,259 – Loan receivable (Note 10) 18,986 – Other assets (Note 11) 20,974 5,797 Future income tax assets (Note 17) 6,561 1,456
$ 465,697 $ 177,106
LiabilitiesCurrentAccounts payable and accrued liabilities $ 22,827 $ 7,225 Derivative related liabilities (Note 22i) 8,615 –
31,442 7,225
Long termNotes payable (Note 12) 106,847 – Asset retirement obligations (Note 13) 8,012 4,972 Future income tax liabilities (Note 17ii) 2,922 3,100 Liabilities associated with assets held for sale (Note 4) 1,500 1,500
150,723 16,797
Shareholders’ EquityCapital StockAuthorizedUnlimited number of first preference shares without par value issuable in seriesUnlimited number of common shares without par valueIssued and outstanding191,341,932 common shares (December 31, 2004 - 122,286,716 shares) (Note 14i) 310,409 147,407
Share purchase warrants (Note 15) 3,737 10,864 Contributed surplus (Note 14ii) 4,676 1,775
(Deficit) retained earnings (3,848) 263
314,974 160,309
$ 465,697 $ 177,106
Contingencies and Commitments (Notes 21, 24)The accompanying notes are an integral part of the financial statements.
Approved by the Board
Peter Marrone Victor H. Bradley,Director Director
Yamana Gold Inc.
CONSOLIDATED BALANCE SHEETSAs at the Periods Ended
(In thousands of US Dollars)
41894_fin_p87 3/22/06 2:11 PM Page 87

December 31, December 31, February 29,2005 2004 2004
(10 months)
Sales $ 46,038 $ 32,298 $ 19,811 Cost of sales (30,371) (17,016) (10,465)Depreciation, amortization
and depletion (6,740) (4,541) (2,430)Accretion of asset retirement
obligations (Note 13) (358) (364) (162)
Mine operating earnings 8,569 10,377 6,754
ExpensesGeneral and administrative (10,415) (6,226) (4,599)Foreign exchange gain 369 1,848 75 Stock-based compensation (Note 16) (2,298) (2,191) (612)
Operating (loss) earnings (3,775) 3,808 1,618 Investment and other business income 4,049 792 483 Interest and financing expense (94) – (255)Unrealized loss on commodity contracts (Note 22i) (8,615) – –
(Loss) earnings before income taxes (8,435) 4,600 1,846
Income tax recovery (expense) (Note 17i) 4,324 (1,817) (838)
Net (loss) earnings (4,111) 2,783 1,008
Retained earnings (deficit), beginning of period 263 (2,520) (3,491)
Interest on convertible notes – – (37)
(Deficit) retained earnings, end of period $ (3,848) $ 263 $ (2,520)
(Loss) basic earnings per share $ (0.03) $ 0.03 $ 0.02
Diluted earnings per share (Note 14iii) $ (0.03) $ 0.02 $ 0.02
Weighted average number of shares outstanding(in thousands) 144,888 100,036 43,674
The accompanying notes are an integral part of the financial statements.
GROWTHVALUE
88
A n n u a l R e p o r t 2 0 0 5
Yamana Gold Inc.
CONSOLIDATED STATEMENTS OF OPERATIONS AND DEFICITFor the Periods Ended
(In thousands of US Dollars)
41894_fin_p88 3/25/06 10:43 AM Page 88

YAMANAVISION
89
Y A M A N A G O L D I N C.
December 31, December 31, February 29,2005 2004 2004
(10 months)
Operating ActivitiesNet earnings (loss) for the year $ (4,111) $ 2,783 $ 1,008 Asset retirement obligations realized (Note 13) (309) (237) – Items not involving cash
Depreciation, amortization and depletion 6,740 4,541 2,430 Stock-based compensation (Note 16) 2,298 2,191 612 Future income taxes (Note 17) (4,447) 430 (324)Accretion of asset retirement obligations (Note 13) 358 364 162 Unrealized foreign exchange (3,252) (1,792) (100)Unrealized loss on commodity contracts (Note 22i) 8,615 – – Other 553 1,013 1,165
Net change in non-cash working capital (Note 18) (3,035) (757) 538
3,410 8,536 5,491
Financing ActivitiesIssue of common shares and warrants for cash
(net of issue costs) 155,099 71,931 56,349 Deferred financing charges (Note 11) (4,630) (3,049) – Loan proceeds 100,000 – –
250,469 68,882 56,349
Investing ActivitiesBusiness acquisition of Fazenda Brasileiro – – (22,098)Expenditures on mineral properties (23,199) (11,512) (4,191)Acquisition of property, plant and equipment (5,752) (3,079) (1,770)Expenditures on assets under construction (132,031) (11,965) – Purchase of investment (2,258) – – Loan receivable (18,986) – – Other Assets (10,326) (531) –
(192,552) (27,087) (28,059)
Increase in cash and cash equivalents 61,327 50,331 33,781
Effect of foreign exchange on non-US dollar denominated cash and cash equivalents 3,252 2,120 100
Cash and cash equivalents, beginning of period 87,054 34,603 722
Cash and cash equivalents, end of period $ 151,633 $ 87,054 $ 34,603
Cash and cash equivalents are comprised of the following:Cash at bank $ 20,576 $ 11,903 $ 6,977 Bank term deposits 131,057 75,151 $ 27,626
$ 151,633 $ 87,054 $ 34,603
Supplementary cash flow information (Note 18)
The accompanying notes are an integral part of the financial statements.
Yamana Gold Inc.
CONSOLIDATED STATEMENTS OF CASH FLOWSFor the Periods Ended
(In thousands of US Dollars)
41894_fin_p89 3/25/06 10:43 AM Page 89

1. Basis of presentation/The Company
The accompanying consolidated financial statements have been prepared in accordance with Canadiangenerally accepted accounting principles (“Canadian GAAP”) and include the assets, liabilities andoperations of the Company and its wholly-owned subsidiaries. These policies conform in all materialrespects with generally accepted accounting principles in United States of America (“US GAAP”)except as described in Note 26.
The Company is engaged in the acquisition, exploration and development and operation of mineralproperties in Latin America. The Company has gold production, a copper-gold construction stageproperty, exploration properties and land positions in Brazil. Since August 2003, the Company hasfocused on creating production efficiencies at the Fazenda Brasileiro Mine, constructing the FazendaNova, São Francisco and Chapada Mines, discovering high priority exploration targets and acquisitionof other high quality properties in Latin America.
The Company’s sales result from operations in Brazil. Gold mining requires the use of specializedfacilities and technology. The Company relies heavily on such facilities and technology to maintain its production levels. Cash flow and profitability of operations is also affected by the gold price andexchange rates which can fluctuate widely and other numerous factors beyond the Company’s control.
2. Change in year end
The Company changed its year end from February 28/29 to December 31. As such, the comparativeperiod is for the ten month period ending December 31, 2004.
3. Significant accounting policies
Cash and cash equivalentsCash and cash equivalents consist of cash on hand, cash on deposit with banks and highly liquid short-term investments. Short-term investments are recorded at the lower of cost and net realizablevalue.
InventoryInventory consisting of metal-in-circuit ore, gold in process and bullion is valued at the lower of theweighted average cost of production and net realizable value. Net realizable value is calculated as thedifference between the estimated future metal price based on prevailing and long-term metal pricesand estimated costs to complete production into a saleable form. Inventories of material and suppliesexpected to be used in production are valued at the lower of cost and net replacement value.
Write-downs of inventory resulting from net realizable and/or net replacement impairments arereported as a component of current period costs.
Metal in circuit is comprised of ore in stockpiles and ore on heap leach pads. Ore in stockpiles iscomprised of ore extracted from the mine and is available for further processing. Costs are added toore in stockpiles at the current mining cost per tonne and removed at the accumulated average costper tonne. Costs are added to ore on the heap leach pads based on current mining costs and removedfrom the heap leach pad as ounces are recovered in process at the plant based on the average cost per recoverable ounce of on the heap leach pad.
Although the quantities of recoverable gold placed on the heap leach pads are reconciled by comparing the grades of ore placed on the heap leach pads to the quantities of gold actuallyrecovered, the nature of the leaching process inherently limits the ability to precisely monitorinventory levels. As such, engineering estimates are refined based on actual results over time.
GROWTHVALUE
90
A n n u a l R e p o r t 2 0 0 5
Yamana Gold Inc.
NOTES TO THE CONSOLIDATED FINANCIAL STATEMENTSFor the Year ended December 31, 2005, the Ten Month Period Ended December 31, 2004 and the Year Ended February 29, 2004
(Tabular amounts in thousands of US dollars unless otherwise noted)
41894_fin_p90 3/22/06 2:12 PM Page 90

YAMANAVISION
91
Y A M A N A G O L D I N C.
Variances between actual and estimated quantities resulting from changes in assumptions andestimates that do not result in write-downs to net realizable value are accounted for on a prospectivebasis. The ultimate recovery of gold from each heap leach pad will not be known until the leachingprocess is concluded.
Gold in process represents materials that are currently in the process of being converted to a saleable product.
InvestmentsInvestments in shares in which the Company’s ownership is less than 20% and over which theCompany does not exercise significant influence, are accounted for using the cost method. TheCompany periodically reviews the carrying value of its investments. When a decline in the value of an investment is other than temporary, the investment is written down accordingly. A write-down in investments is reported as a component of current period costs.
The financial statements of entities which are controlled by the Company through voting equityinterests, referred to as subsidiaries, are consolidated. Entities which are jointly controlled, referred toas joint ventures, are proportionately consolidated. Variable Interest Entities (“VIEs”),which include,but are not limited to, special purpose entities, trusts, partnerships, and other legal structure, asdefined by the Accounting Standards Board in Accounting Guideline (“AcG”) 15, “Consolidation ofVariable Interest Entities” (“AcG 15”), are entities in which equity investors do not have thecharacteristics of a “controlling financial interest” or there is not sufficient equity at risk for the entityto finance its activities without additional subordinated financial support. VIEs are subject toconsolidation by the primary beneficiary who will absorb the majority of the entities’ expected lossesand/or expected residual returns. All intercompany balances and transactions are eliminated uponconsolidation. The Company did not hold any Variable Interest Entities as at December 31, 2005.
Financing Costs and deferred financing chargesFinancing costs including interest are capitalized to assets under construction for which projects areactively being prepared for production. Deferred financing charges consist of expenses related to debtfinancing transactions and are amortized over the life of such debt facilities. Amortization of deferredfinancing charges is capitalized to assets under construction when the debt financing arrangementrelates to a project actively being prepared for production. Capitalization is discontinued aftercommencement of commercial production.
Property, plant and equipmentProperty, plant and equipment are initially recorded at cost and amortization is provided on a straight-line basis over the estimated useful life of the asset. Useful lives of property, plant andequipment currently range from three to nineteen years, but do not exceed the related estimated mine life based on proven, probable reserves and the portion of resources that management expectsto become reserves in the future.
Expenditures that extend the useful lives of existing facilities or equipment are capitalized andamortized over the remaining useful life of the asset. Repairs and maintenance expenditures areexpensed as incurred.
Yamana reviews the carrying value of its property, plant and equipment on a regular basis andwhere the carrying value is estimated to exceed the estimated undiscounted future net cash flows, a provision is made against income in the year that such impairment is determined by management.
41894_fin_p91 3/22/06 2:12 PM Page 91

Assets under constructionAssets under construction consist of expenditures on the construction of future mines and includepreproduction revenues and expenses prior to achieving commercial production. Commercialproduction is a convention for determining the point at which time a mine is producing at asustainable commercial level, after which costs are no longer capitalized and are reported as operating costs.
Mineral propertiesAcquisition costs of mineral properties and direct exploration and development expenditures and pre-stripping costs are capitalized. Costs incurred for general explorations that are not project specificor do not result in the acquisition of mineral properties are charged to operations. Costs relating toproperties abandoned are written off when such a decision is made.
Depletion of mining properties and amortization of preproduction and development costs arecalculated and recorded on the unit-of-production basis over the proven, probable reserves of the mineand the portion of mineralization expected to be classified as reserves.
The Company reviews the carrying value of each property on an ongoing basis. This reviewgenerally is made by reference to the timing of exploration and/or development work, work programsproposed and the exploration results achieved. Any excess of carrying value over the estimatedundiscounted future net cash flows is charged to operations in the period in which such impairment is determined by management. Estimated undiscounted future net cash flows are calculated usingestimated metal prices, operating costs, capital costs and reclamation and closure costs.
Asset retirement obligationReclamation and closure costs have been estimated based on the Company’s interpretation of currentregulatory requirements and measured at fair value. Fair value is determined based on the net presentvalue of future cash expenditures upon reclamation and closure. Reclamation and closure costs arecapitalized as mine development costs and amortized over the life of the mine on a unit-of-productionbasis.
Income taxesThe Company follows the liability method of accounting for income taxes whereby future income taxassets and liabilities are determined based on the temporary differences between financial reportingand tax bases of assets and liabilities, as well as for the benefit of losses available to be carried forwardto future years for tax purposes. Future income tax assets and liabilities are measured usingsubstantively enacted tax rates and laws that will be in effect when the differences are expected toreverse. Future income tax assets are recorded on the financial statements if realization is consideredmore likely than not.
Revenue recognition Revenue from the sale of gold or other metals is recognized when title is transferred and the risks andrewards of ownership pass to the purchaser including delivery of the product, fixed or determinableselling price and collectability is reasonably assured. Settlement adjustments, if any, are reflected inrevenue when the amounts are determinable.
(Loss) earnings per shareThe loss per share is calculated based on the weighted average number of common shares outstandingof the Company that were outstanding each year. The diluted loss per share reflects the potentialdilution of common share equivalents, such as outstanding stock options and warrants, in the weightedaverage number of common shares outstanding during the year, if dilutive. For this purpose, the“treasury stock method” is used for the assumed proceeds upon the exercise of outstanding stockoptions and warrants that are used to purchase common shares at the average market price during the year.
Share issue costsCosts incurred in connection with the issuance of capital stock are netted against the proceedsreceived.
GROWTHVALUE
92
A n n u a l R e p o r t 2 0 0 5
41894_fin_p92 3/22/06 2:12 PM Page 92

Stock-based compensationThe Company has a stock option plan that is described in Note 16.
The Company accounts for all stock-based payments to employees and non-employees using thefair value based method of accounting and recognizes compensation expense over the stock optionvesting period. The Company stock option plan includes a stock appreciation feature. No adjustmentfor subsequent changes in the price of the Company’s shares is recorded. If and when the stockoptions are ultimately exercised, the applicable amount of additional paid-in capital in contributedsurplus will be transferred to share capital.
Use of estimatesThe preparation of financial statements in accordance with Canadian GAAP and notes thereofrequires management to make estimates and assumptions. These estimates and assumptions affect thereported amounts of assets and liabilities and disclosure of contingencies at the date of the financialstatements and the reported amounts of revenue and expenses during the year. Actual results coulddiffer from those estimates.
Derivatives The Company may enter into commodity contracts including forward contracts and derivatives tomanage exposure to fluctuations in metal prices. In the case of forwards, these contracts are intendedto reduce the risk of declining prices on future sales. Purchased options are intended to allow theCompany to benefit from higher market metal prices. In instances where the call option purchasesoffsets the committed ounces of the corresponding forward, derivative liabilities are presented net of amounts due to/from counterparties.
The Company recognizes the fair value of the financial instruments on the balance sheet andrecords changes in the fair value in current period earnings.
The Company has entered into non-hedge derivatives that include forward and option contractsintended to manage the risk of declining copper prices. The Company currently does not hedge any of its gold sales.
Foreign currency translationThe Company considers its foreign operations to be integrated operations. As such monetary assetsand liabilities of the Company’s operations denominated in a currency other than the US dollar aretranslated into US dollars at the exchange rate prevailing as at the balance sheet date. Non-monetaryassets and liabilities are translated at historical exchange rates prevailing at each transaction date.Revenue and expenses are translated at the average exchange rates prevailing during the year, with theexception of amortization which is translated at historical exchange rates. Exchange gains and losseson translation are included in earnings.
4. Assets held for sale
The Company received an offer from Hidefield plc to purchase the Argentine properties forconsideration comprised of a combination of cash proceeds and an equity interest in the capital of the purchaser. Upon closing of the transaction, the purchaser paid Yamana $350,000 and delivered 8.0 million common shares and 4.0 million common share purchase warrants of Hidefield plc.Additional consideration in late 2006 will also be provided. Deferred consideration will consist of eitherof the following at the option of the purchaser: (i) $1.6 million (ii) 10 million common shares and 5 million share purchase warrants of Hidefield plc or (iii) $800,000 plus 5 million common shares and2.5 million share purchase warrants of Hidefield plc. Consideration also includes a royalty of any and all ounces mined, produced or otherwise recovered from the properties, limited to an aggregate of $2 million. The Company did not record a significant gain or loss upon conclusion of this transaction.Subsequent to the period end, the Company closed the sale. There were no material operations relatedto the Argentine assets held for sale for the periods ended December 31, 2005, December 31, 2004 and February 29, 2004.
YAMANAVISION
93
Y A M A N A G O L D I N C.
41894_fin_p93 3/22/06 2:13 PM Page 93

The following table presents summarized financial information of the assets held for sale:
Dec. 31, Dec. 31,2005 2004
AssetsProperty, plant and equipment $ 350 $ 377Mineral properties 5,317 5,036
Total assets held for sale 5,667 5,413
LiabilitiesFuture income tax liability (1,500) (1,500)
Net assets held for sale $ 4,167 $ 3,913
5. Inventory
Dec. 31, Dec. 31,2005 2004
Metal in circuit and gold in process $ 8,343 $ 2,729Product inventories 461 996Materials and supplies 2,549 2,137
$ 11,353 $ 5,862
6. Property, plant and equipment
Dec. 31, Dec. 31,2005 2004
Accumulated Net Book Accumulated Net Book Cost Amortization Value Cost Amortization Value
Land $ 1,116 $ – $ 1,116 $ 1,020 $ – $ 1,020Buildings 12,141 3,024 9,117 8,106 2,006 6,100Machinery
and Equipment 14,286 3,383 10,903 9,196 1,890 7,306Vehicles 2,632 728 1,904 2,654 526 2,128Furniture and
office equipment 1,817 418 1,399 1,262 304 958Computer equipment
and software 750 197 553 516 90 426
$ 32,742 $ 7,750 $ 24,992 $ 22,754 $ 4,816 $ 17,938
GROWTHVALUE
94
A n n u a l R e p o r t 2 0 0 5
41894_fin_p94 3/22/06 2:13 PM Page 94

7. Assets under construction
Dec. 31, Dec. 31,2005 2004
Fazenda Nova (i) $ – $ 6,949São Francisco 63,018 1,915Chapada (ii) 91,327 3,221
$ 154,345 $ 12,085
Construction and preproduction revenues will be transferred to property, plant and equipment and mineral properties for each property upon commencement of commercial production.
(i) The Fazenda Nova Mine commenced commercial production effective May 1, 2005.(ii) Net interest capitalized during the period was $6.7 million (December 31, 2004 - $Nil).
Amortization of deferred financing fees capitalized during the period was $1.1 million (December 31, 2004 - $Nil).
8. Mineral properties
Dec. 31, Dec. 31,2005 2004
Accumulated Net Book Accumulated Net Book Cost Amortization Value Cost Amortization Value
Fazenda Brasileiro $ 30,711 $ 5,843 $ 24,868 $ 17,787 $ 3,704 $ 14,083 Santa Elina
Properties 26,407 2,116 24,291 14,471 671 13,800Chapada 11,747 – 11,747 10,118 – 10,118Other 600 – 600 255 – 255
$ 69,465 $ 7,959 $ 61,506 $ 42,631 $ 4,375 $ 38,256
9. Investments
Investments consist of a portfolio investment recorded at cost. Market value as at December 31, 2005was approximately $2.2 million (December 31, 2004 - $Nil).
10. Loan receivable
In connection with the acquisition of RNC Gold Inc. and the purchase of 100% of the San AndrésMine in Honduras, the Company entered into a credit agreement whereby the Company made asenior secured loan to a wholly owned subsidiary of RNC Gold Inc. in the amount of $18.9 million.The loan was used primarily to fund the purchase of 75% of the outstanding capital of Minerales deOccidente S.A., 100% owner of the San Andrés Mine. Under the credit agreement the loan is securedby a pledge of all of the shares of the wholly owned subsidiary of RNC Gold Inc. and Minerales deOccidente S.A. and secured by an interest in all of the assets comprising the San Andrés mine.
The loan bears interest at a rate of 10% per annum and is due March 7, 2006. Subsequent to the year end, the transaction was approved by the shareholders of RNC Gold Inc., all regulatoryapprovals were obtained and the transaction closed.
YAMANAVISION
95
Y A M A N A G O L D I N C.
41894_fin_p95 3/22/06 2:14 PM Page 95

11. Other assets
Dec. 31, Dec. 31,2005 2004
Deferred financing charges (i) $ 10,138 $ 5,191Long-term tax credits (ii) 8,864 –Deferred acquisition costs 940 –Restricted cash (iii) 583 –Other 449 606
$ 20,974 $ 5,797
(i) Deferred financing charges relate to a $100 million debt facility for the development of the Chapada copper-gold project. Financing charges are amortized over the life of the loan as of the funding date of April 29, 2005. Amortization is capitalized to property development costs. The balance includes 2.5 million warrants issued in respect to the debt facility which were valued at fair value of $1.4 million as calculated using the Black-Scholes pricing model. Balance is net of accumulated amortization of $1.1 million (December 31, 2004 - $Nil).
(ii) Long-term tax credits consist of Brazilian sales taxes which are recoverable against other taxespayable.
(iii) Restricted cash consists of interest income earned on funds previously held in escrow. Funds heldin escrow consisted of funds advanced under the loan facility for the development and constructionof the Chapada copper-gold project. Upon funding, loan proceeds were held in an escrow account pending perfection and registration of security and were subsequently released during the period. As at December 31, 2005, $583,000 of interest income was held in escrow. These funds were released from escrow subsequent to the period end.
12. Notes payable
Notes payable consist of a $100 million debt facility for the development and construction of theChapada copper-gold project plus accrued interest of $6.9 million of which $1.5 million has beencapitalized to the loan balance. The Company drew down the full $100 million under the loan facilityon April 29, 2005. The notes are secured by all the assets of the Company and are for a term of sixyears and bear interest at an annual rate of 10.95%, compounded semi-annually. The Company haselected to defer interest payments for the first two years at a rate of 12.45% per year. The Companymay elect to defer interest for an additional year at the rate of 13.95% per year. Principal is repayableupon maturity of the notes.
13. Asset retirement obligations
The asset retirement obligation relates to reclamation and closure costs relating to the Company’smine operations and projects under development. The asset retirement obligation is calculated as thenet present value of estimated future cash flows which total $10.5 million and are required to satisfythe obligation discounted using a credit adjusted risk free rate of 7%. The settlement of the obligationwill commence in 2006 and continue through to 2024. Reclamation and closure costs of the mines andprojects are incurred in Brazilian Reais and are thus subject to translation gains and losses from onereporting period to the next in accordance with the Company’s accounting policy for foreign currencytranslation of monetary items.
GROWTHVALUE
96
A n n u a l R e p o r t 2 0 0 5
41894_fin_p96 3/22/06 2:14 PM Page 96

The following is an analysis of the asset retirement obligation:
Dec. 31, Dec. 31,2005 2004
(10 Months)
Opening balance $ 4,972 $ 4,943Accretion incurred in the current period 358 364Additions to site reclamation during the current period 3,422 491Reduction of estimated liabilities (999) (920)Foreign exchange loss 568 331Expenditures during the current period (309) (237)
$ 8,012 $ 4,972
14. Capital stock
(i) Common shares issued and outstanding
Number ofCommon
Shares Amount(000’s) (000’s)
Balance as at February 28, 2003 2,911 $ 3,515Private placements, net of warrants and issue costs 29 35Issued on conversion of subscription receipts 46,250 29,181Public offering, net of issue costs 8,665 19,734Payment of accounts payable 842 875Exercise of options and share appreciation rights 25 31Issued on purchase of First Preference Shares 388 1,277Issued on conversion of convertible notes
Principal 1,027 1,480Interest 38 49
Issued on acquisition of Santa Elina assets 34,886 18,250
Balance as at February 29, 2004 95,061 $ 74,427Exercise of options and share appreciation rights 41 101Public offering, net of issue costs 26,377 71,858Issue of common shares 808 1,021
Balance as at December 31, 2004 122,287 $ 147,407Exercise of options and share appreciation rights (1) 1,282 1,973Shares issued pursuant to an early exercise of publicly traded warrants,
net of costs (2) 41,286 55,554Shares issued pursuant to an exchange of publicly traded warrants (2) 476 131Public offering, net of issue costs (3) 26,000 105,289Exercise of warrants 11 55
Balance as at December 31, 2005 191,342 $ 310,409
(1) The Company issued 1.3 million shares to optionees on the exercise of 1.1 million share options and 0.3 million options exercised under share appreciation rights. Previously recognized compensation expense in the amount of $0.3 million on options exercised during the year was charged to share capital with a corresponding decrease to contributed surplus.
(2) As of July 29, 2005, the Company effected an amendment of the terms of its 40,567,656 publicly traded warrants, each of which were exercisable at C$1.50 per common share and expiring July 31, 2008, that entitled warrant holders to receive an additional 0.0356 of a common share upon the exercise of their warrants during a 30-day voluntary early exercise period that expired August 29, 2005. An aggregate of 41,285,875 common shares were issued for net proceeds of $48.1 million pursuant to the early exercise of the warrants. An additional $7.4 million was charged to share capitalin respect to the book value of the warrants. An additional 476,198 common shares were issued
YAMANAVISION
97
Y A M A N A G O L D I N C.
41894_fin_p97 3/25/06 10:44 AM Page 97

pursuant to the automatic exchange of the remaining 701,021 warrants subsequent to closing of the early exercise period, without payment of the exercise price or any additional consideration.
(3) On October 5, 2005, the Company completed a public offering for 26 million common shares at a price of Cdn$5.00 per share for aggregate gross proceeds of $110.9 million (Cdn$130 million) less issue costs of $5.6 million.
(ii) Contributed surplus
Dec. 31, Dec. 31,2005 2004
(10 Months)
Balance as at beginning of period $ 1,775 $ 633Transfer of stock-based compensation on the exercise of stock option
and share appreciation rights (324) (25)Expired warrants 927 –Stock-based compensation on options granted 2,298 1,167
Balance as at end of period $ 4,676 $ 1,775
(iii) Weighted average number of common shares and dilutive common share equivalents
Dec. 31, Dec. 31, Feb. 29,2005 2004 2004
Weighted average number of common shares 144,888 100,036 43,674Weighted average number of dilutive warrants 17,531 22,347 18,808Weighted average number of dilutive stock options 3,620 2,622 2,864
166,039 125,005 65,346
15. Share purchase warrants
A summary of issued share purchase warrants as at the period end and the changes thereof during the period are as follows:
Dec. 31, Dec. 31, Feb. 29,2005 2004 2004
(10 Months)
Weighted Weighted WeightedNumber Average Number Average Number Average
of Exercise of Exercise of ExerciseWarrants Price Warrants Price Warrants Price
(000’s) (Cdn$) (000’s) (Cdn$) (000’s) (Cdn$)
Outstanding, beginning of period 43,434 $ 1.78 41,431 $ 1.59 903 $ 6.04
Issued 2,500 4.70 2,500 4.05 40,600 1.50Expired and
exercised (40,626) 1.51 (497) 5.88 (72) 8.36
Outstanding and exercisable, end of period 5,308 $ 4.43 43,434 $ 1.78 41,431 $ 1.59
The fair value of the issued warrants was $1.4 million, calculated using the Black-Scholes pricing model.
GROWTHVALUE
98
A n n u a l R e p o r t 2 0 0 5
41894_fin_p98 3/25/06 10:44 AM Page 98

The Company had the following share purchase warrants outstanding as at December 31, 2005:
Weighted Number Average
of Remaining Warrants Contractual
Exercise Price Outstanding Life(Cdn$) (000’s) (years)
$ 5.57 284 0.16$ 5.29 1 0.16$ 4.70 2,500 4.31$ 4.05 2,500 3.88$ 2.09 23 1.52
5,308 3.87
As of July 29, 2005, the Company effected an amendment of the terms of its 40,567,656 publiclytraded warrants, as described in note 14. A total of 39,866,635 warrants were exercised during theexercise period. Upon the expiry of the voluntary exercise period, the remaining 701,021 warrantswere exchanged, without payment of the exercise price or any additional consideration, for 476,198common shares. An aggregate of 11,234 of non-publicly traded warrants were exercised and anaggregate of 47,242 warrants expired during the year.
16. Stock options
Yamana’s Share Incentive Plan is designed to advance the interests of the Company by encouragingemployees, officers, directors and consultants to have equity participation in the Company through the acquisition of common shares. The Share Incentive Plan is comprised of a share option componentand a share bonus component. The aggregate maximum number of common shares that may bereserved for issuance under the Share Incentive Plan is 8.2 million (December 31, 2004 - 9.5 million;February 29, 2004 - 6.9 million). Pursuant to the share bonus component of the Share Incentive Plan, common shares may be issued as a discretionary bonus to employees, officers, directors andconsultants of the Company. Options granted under the share option component of the ShareIncentive Plan have an exercise price of not less than the closing price of the common shares on the TSX on the trading day immediately preceding the date on which the options are granted and are exercisable for a period not to exceed ten years.
The Share Incentive Plan also provides for the granting of share appreciation rights to optionees.An optionee is entitled to elect to terminate his or her option, in whole or part, and, in lieu ofreceiving the common shares to which their terminated option relates, to receive that number ofcommon shares, disregarding fractions which, when multiplied by the fair value of the common sharesto which their terminated option relates, has a total value equal to the product of the number of such common shares times the difference between the fair value and the option price per share of such common shares, less any amount required to be withheld on account of income taxes.
The Company has expensed the value of the share purchase options granted during the year ascompensation expense in the amount of $2.3 million with a corresponding increase in contributedsurplus. Yamana accounts for all stock-based payments granted since March 1, 2002 to employees and non-employees using the fair value based method of accounting which is estimated at the time of grant using the Black-Scholes option pricing model with the following weighted averageassumptions:
Dec. 31, Dec. 31, Feb. 29,2005 2004 2004
(10 Months)
Dividend yield 0% 0% 0%Expected volatility 34% 50.5% 37.5%Risk-free interest rate 3.4% 3.5% 3%Expected life 3 years 3 years 3 yearsForfeitures Nil Nil Nil
YAMANAVISION
99
Y A M A N A G O L D I N C.
41894_fin_p99 3/25/06 10:44 AM Page 99

A summary of the issued stock options to acquire common shares under the Company’s ShareIncentive Plan as at the period end and the changes thereof during the period are as follows:
Dec. 31, Dec. 31, Feb. 29,2005 2004 2004
(10 Months)
Weighted Weighted WeightedNumber Average Number Average Number Average
of Exercise of Exercise of ExerciseOptions Price Options Price Options Price
(000’s) (Cdn$) (000’s) (Cdn$) (000’s) (Cdn$)
Outstanding, beginning of period 6,660 $ 2.04 5,453 $ 1.73 298 $ 2.93
Issued 2,785 3.78 1,250 3.38 5,325 1.72Exercised (1,485) 1.97 (41) 2.25 (14) 2.93Expired and Cancelled (6) 2.93 (2) 2.93 (156) 3.07
Outstanding, end of period 7,954 $ 2.67 6,660 $ 2.04 5,453 $ 1.73
Exercisable, end of period 7,954 $ 2.67 6,535 $ 2.03 5,288 $ 1.72
Stock options outstanding and exercisable as at December 31, 2005 are as follows:
OutstandingWeighted
Average Remaining
ContractualExercise Price Quantity Life(Cdn$) (000’s) (years)
$ 4.63 150 9.60$ 4.45 150 9.50$ 3.69 2,485 9.37$ 3.62 11 1.75$ 3.44 1,015 8.07$ 3.34 7 1.58$ 2.93 21 4.68$ 2.85 125 3.40$ 2.25 60 2.86$ 1.67 3,930 7.59
7,954 8.16
GROWTHVALUE
100
A n n u a l R e p o r t 2 0 0 5
41894_fin_p100 3/25/06 10:45 AM Page 100

17. Income taxes
(i) Income tax expenseThe following table reconciles income taxes calculated at statutory rates with the income tax expense in these financial statements:
Dec. 31, Dec. 31, Feb. 29,2005 2004 2004
(10 months)
Earnings (loss) before income taxes $ (8,435) $ 4,600 $ 1,846Statutory rate 36.12% 36.12% 38.00%
Expected income tax expense (recovery) $ (3,047) $ 1,662 $ 701Effect of lower tax rates in foreign jurisdictions (883) (154) (503)Unrecognized tax benefits 1,935 19 1,364Non-taxable items (550) 106 (724)Change in valuation allowance (4,297) 184 –Foreign exchange on inter-corporate debt 2,518 – –
Income tax (recovery) expense $ (4,324) $ 1,817 $ 838
Current income tax (expense) recovery (123) (1,387) (1,162)
Future income tax (recovery) expense $ (4,447) $ 430 $ (324)
(ii) Future income taxes The temporary differences that give rise to future income tax assets relating to Canada, United States and Brazil are presented below:
Dec. 31, Dec. 31,2005 2004
Amounts related to tax loss and credit carry-forwards in Canada and United States $ 11,971 $ 7,175
Financing costs 3,979 3,126Other temporary differences (424) –
Net future tax asset 15,526 10,301Valuation allowance (8,965) (8,845)
Future income tax assets $ 6,561 $ 1,456
The temporary differences that give rise to future income tax liabilities relating to Brazil arepresented below:
Dec. 31, Dec. 31,2005 2004
Mineral properties and property, plant and equipment $ (2,431) $ (2,492)Asset retirement obligation 733 621Unrealized foreign exchange gains on inter-company loans (2,816) (1,317)Amounts related to tax loss and credit carry-forwards 1,592 –Other – 88
Future income tax liabilities $ (2,922) $ (3,100)
YAMANAVISION
101
Y A M A N A G O L D I N C.
41894_fin_p101 3/25/06 10:45 AM Page 101

(iii) Non-capital lossesThe Company has non-capital losses of approximately $31 million available to apply against future taxable income as follows:
Local US Dollarcurrency Equivalent Expiry Date
Canada Cdn $ 28,700 $ 24,700 2006 to 2015United States US $ 1,100 $ 1,100 2013 to 2025Brazil R $ 11,841 $ 5,100 Unlimited subject to 30%
of taxable income foreach subsequent year
18. Supplementary cash flow information
(i) Supplementary information regarding other non-cash transactions:
Dec. 31, Dec. 31, Feb. 29,2005 2004 2004
(10 months)
Transfer of contributed surplus upon issue of common shares on exercise of options $ 324 $ 28 $ –
Increase in contributed surplus on the expiry of warrants $ 927 $ – $ –
Deferred financing charges on the issue of warrants $ 1,374 $ 2,142 $ –
Issue of common shares for interest and principal dueon convertible notes $ – $ – $ 1,529
Issue of common shares for Santa Elina assets $ – $ – $ 18,496
Amortization of deferred financing fees $ 1,058 $ – $ –
Accrued interest capitalized to assets under construction $ 6,847 $ – $ –
(ii) Net change in non-cash working capital:
Dec. 31, Dec. 31, Feb. 29,2005 2004 2004
(10 months)
Net decrease (increase) inAccounts receivable $ 876 $ 311 $ (1,154)Advances and deposits (3,792) (1,249) (972)Inventory (5,491) (2,014) (1,611)Income tax recoverable (1,261) – –
Net increase (decrease) in Accrued liabilities and accounts payable (net of accounts payable relating to assets under construction) 6,633 2,195 4,275
$ (3,035) $ (757) $ 538
GROWTHVALUE
102
A n n u a l R e p o r t 2 0 0 5
41894_fin_p102 3/22/06 2:16 PM Page 102

19. Segmented information
The Company considers its business to consist of three geographical segments primarily in Brazil,Argentina and corporate head office in Canada.
(i) Capital assets referred to below consist of land, buildings and equipment and mineral properties.
Dec. 31, Dec. 31,2005 2004
Brazil $ 240,644 $ 68,163Argentina 5,667 5,413Corporate 200 116
$ 246,511 $ 73,692Less: Assets held for sale (5,667) (5,413)
$ 240,844 $ 68,279
(ii)
Dec. 31, Dec. 31, Feb. 29,2005 2004 2004
(10 months)
Mine RevenuesBrazil $ 46,038 $ 32,298 $ 19,811
20. Related party transactions
The Company had the following transactions with related parties:
Dec. 31, Dec. 31, Feb. 29,2005 2004 2004
(10 months)
Pursuant to the reimbursement of third party costs relating to the Company’s financing and property acquisitions incurred on behalf of the company $ – $ – $ 438
Legal fees paid to a law firm that had partners who are either a former director or a former officer of the Company $ – $ – $ 295
Directors fees and consulting fees to associates thereof $ 243 $ 179 $ 117Consulting fees paid to an officer prior to becoming an officer $ – $ – $ 72
These transactions occurred in the normal course of business and are measured at the exchangeamount, which is the amount of consideration established and agreed to by the related parties basedon their estimate of fair market value.
21. Contractual commitments
Year 2006 2007 2008 2009 2010
Office leases $ 375 $ 402 $ 274 $ 274 $ 274Fazenda Brasileiro mine
operating and service contracts 4,301 399 – – –Fazenda Nova mine operating
and service contracts 3,105 718 – – –Chapada construction
service contracts 49,417 1,320 289 – –São Francisco construction
service contracts 2,936 – – – –
$ 60,134 $ 2,839 $ 563 $ 274 $ 274
YAMANAVISION
103
Y A M A N A G O L D I N C.
41894_fin_p103 3/22/06 2:16 PM Page 103

22. Financial instruments
(i) Fair value of financial instrumentsThe carrying value of receivables, advances and deposits and accounts payable approximate their fair values due to the relatively short-term maturities of these instruments. There were no material differences between the book value and fair value of long-term debt.
Non-hedging derivative instruments are recorded at fair value. Fair value of derivative instruments are based on quoted market prices for similar instruments and on market closing prices at period end. The Company recorded a mark-to-market loss of $8.6 million (December 31, 2004 - $Nil; February 29, 2004 - $Nil) for the period. The maximum obligation over the life of the derivatives is $15 million.
The following table summarizes derivative gains (losses):
Dec. 31, Dec. 31, Feb. 29,2005 2004 2004
(10 months)
Forward contracts $ (13,355) $ – $ –Long-call option contracts 9,097 – –Option premium (4,357) – –
$ (8,615) $ – $ –Future income tax - 36.12% 3,112 – –
$ (5,503) $ – $ –
(ii) Currency riskCompany sales are predominately denominated in US dollars. The Company is primarily exposed to currency fluctuations relative to the US dollar as a significant portion of the Company’s operating costs and capital expenditures are denominated in foreign currencies. Monetary assets denominated in foreign currencies are also exposed to foreign currency fluctuations. These potential currency fluctuations could have a significant impact on production costs and thereby the profitability of the Company. The Company does not currently hedge its foreign currency exposure.
(iii) Commodity price riskThe profitability of the Company is directly related to the market price of gold. With the construction of the Company’s Chapada copper - gold mine which is expected to commence production in 2007, the Company will also be exposed to fluctuations in the price of copper. As of December 31, 2005, the Company had not hedged its exposure to the gold price. During the period, the Company entered into a combination of forward and call option contracts to economically hedge against the risk of declining copper prices for a portion of its forecast copper concentrate sales. This copper economic hedging program provides a forward price of $1.37 per pound of copper for a total of 50.2 million pounds of copper in 2007. The program includes long call options at an average strike price of approximately $1.67 per pound of copper thereby permitting the Company to participate in price increases in the event that copper prices exceed the strike price of the options. No cash has been paid for the call options as the price has been deducted from the hedge price, providing a net hedge price of $1.27 per pound. The program requires no cash margin, collateral or other security from the Company.
GROWTHVALUE
104
A n n u a l R e p o r t 2 0 0 5
41894_fin_p104 3/25/06 10:45 AM Page 104

23. Subsequent Events
(i) Subsequent to the year end, the Company acquired 100% of RNC Gold Inc. The Companyexchanged 0.12 Yamana Gold Inc. common shares for one RNC Gold Inc. common share. Thepurchase price of this transaction totaled approximately $52 million, comprised of approximately5.7 million Yamana Gold Inc. common shares and other transaction costs and adjustments.Additionally, the Company paid $18.9 million in the form of a purchase loan for the San AndrésMine (refer to Note 10). The value of Yamana Gold Inc. common shares was C$5.66 per share based on the five day weighted average market price over the five day period endingDecember 4, 2005, being the date Yamana Gold Inc. and RNC Gold Inc. entered into thearrangement agreement.
The acquisition will be accounted for using the purchase method of accounting pursuant towhich identifiable assets acquired and liabilities assumed will be recorded at their fair marketvalues as of the date of acquisition. The estimated fair value of property, plant and equipment andmineral interests will be based on replacement costs as determined through independent appraisalsperformed by an independent third party. Estimated future cash flows used in the valuation will bebased on estimated quantities of gold to be produced at each site, the estimated costs, timing andcapital expenditures associated with such production, valuation of the exploration propertysurrounding operating assets, independent forecast of gold prices, inflation and foreign currencyexchange rates at the date of acquisition and a discount rate of a similar market participant.
On December 16, 2005, RNC Gold Inc. acquired from Terra Mining Inc. (“Terra”), a privateBelize company, 75% of the outstanding shares in the capital of Minosa. Total consideration paid forthis transaction was cash proceeds of $12 million and the granting of a net smelter return royalty onthe production from the San Andrés mine, calculated as 1% on the first $20 million of annual revenueand 0.5% on all annual revenue in excess of $20 million subject to a cumulative aggregate maximumpayment of $1.5 million. On February 28, 2006, RNC Gold Inc. exercised an option to acquire all of the outstanding shares of RNC (Honduras) Limited, a Belize corporation, which is the indirectowner of the remaining 25% interest in the San Andrés mine. The optioned shares acquired wereowned by certain senior executives of RNC. The parties have agreed that the purchase price for theoptioned shares will be $4 million, being the pro-rata share of the cash portion of the purchase priceto be received by Terra. The optionees further have agreed to accept 872,073 common shares ofYamana in satisfaction of the purchase price. RNC will also acquire a 0.667% net smelter royalty on the Minosa production for consideration of $250,000.
The purchase price was calculated as follows:
Purchase of RNC shares (4,868,283 common shares) $ 25,217,703Purchase of Minosa 18,903,000Purchase of RNC (Honduras) Limited 4,517,400Estimated transaction costs 1,500,000Fair value of options and warrants acquired 1,126,080RNC management severance 760,000
$ 52,024,183
The purchase price was allocated as follows:
Net working capital acquired $ (773,088)Property, plant and equipment, net (28,359,691)Mineral properties and other assets (20,357,727)Long-term liabilities 7,055,872
$ 42,434,634
$ 9,589,549Future income tax credit - 25% 3,196,517
Excess of purchase price over carrying value of assets acquired $ 12,786,066
YAMANAVISION
105
Y A M A N A G O L D I N C.
41894_fin_p105 3/25/06 10:46 AM Page 105

The fair value of RNC warrants which will continue with Yamana have been valued using the Black-Scholes pricing model at $826,032. The fair value of the RNC outstanding stock options has been valued using the Black-Scholes pricing model at $300,048.
The entire excess of purchase price over carrying value of the assets acquired was allocated to Mineral Properties. This purchase price allocation is preliminary and subject to adjustments upon final examination.
(ii) Subsequent to the year end, on February 22, 2006, the Company entered into an arrangementagreement with Desert Sun Mining which owns the Jacobina gold mine in the Bahia state of Brazilnear the Company’s Fazenda Brasileiro mine. The transaction will increase the Company’sproduction profile and facilitate operational and administrative synergies.
The acquisition will be completed by way of a court approved Plan of Arrangement pursuant to which each Desert Sun Mining common share will be exchanged for 0.6 of a Yamana common share. All Desert Sun Mining options and warrants will become exercisable for common shares of the Company based on the exchange ratio. As a result of the proposed transaction, the combined company would be held by approximately 76% of existing Yamana shareholders and 24% by existing Desert Sun Mining shareholders. The total number of Yamana common shares outstanding would be approximately 262.1 million, calculated on a pro-forma basis after giving effect to the Company’s acquisition of RNC Gold Inc.
The transaction is subject to all requisite regulatory and court approvals, third party consents and other conditions customary in transactions of this nature. The combination must be approved by at least two-thirds of the votes cast by shareholders of Desert Sun Mining. The transaction is expected to close during the second quarter of 2006. If the combination does not occur under certain circumstances, Desert Sun Mining has agreed to pay the Company a break-fee of C$21.5 million.
24. Contingency
During the period, a sales tax audit was completed by Brazilian state tax authorities which could resultin a liability or a potential loss of recoverable Brazilian sales tax credits that have been recorded asreceivables as at December 31, 2005 of approximately $1.7 million including penalties. The Companyhas not recorded an accrual at December 31, 2005 as it is the Company’s view that the total amountof sales tax credits is recoverable. The Company is currently undergoing an appeal process and while itis not possible to determine the ultimate outcome of such process at this time, the Company believesthat the ultimate resolution will not have a material effect on the Company’s financial condition orresults of operation.
25. Comparative figures
Certain of prior years’ figures have been reclassified to conform with current period’s presentation.The Company has presented mine general and administrative expenses as part of general and
administrative expenses in the statement of operations and reclassified prior period’s presentationaccordingly. Previously, mine general and administrative expenses were presented in cost of sales aspart of mine operating earnings. This change in presentation was adopted during the quarter endedJune 30, 2005 to conform with the decision to centralize various functions and share services amongvarious properties. The effect of the change was to decrease cost of sales and increase general andadministrative expenses for the year by $1.47 million for the year ended December 31, 2005(December 31, 2004 (ten months) - $739,000; February 29, 2004 - $451,000).GROWTHVALUE
106
A n n u a l R e p o r t 2 0 0 5
41894_fin_p106 3/22/06 2:17 PM Page 106

YAMANAVISION
107
Y A M A N A G O L D I N C.
26. Summary of principal differences between Canadian GAAP and United States generally accepted accounting principles (“US GAAP”)
These consolidated financial statements have been prepared in accordance with Canadian generallyaccepted accounting principles (Canadian GAAP). Material variations in the accounting principles,practices and methods used in preparing these consolidated financial statements from principles,practices and methods accepted by United States of America generally accepted accounting principles(US GAAP) are described and quantified below.
The impact of US GAAP on the consolidated income statements are as follows:
Dec. 31, Dec. 31, Feb. 29,2005 2004 2004
(10 months)
Net (loss) earnings per Canadian GAAP $ (4,111) $ 2,783 $ 1,008Adjustment for depreciation, amortization and depletion (1,420) (1,091) (937)Write-off of deferred mineral property costs (11,583) (2,434) (723)Interest on convertible notes – – (37)Stock compensation expense – (630) –Pre-operating costs (331) (439) –
(17,445) (1,811) (689)
Tax effect of reconciling items 4,534 1,175 318
Net loss attributable to common shareholders under US GAAP $ (12,911) $ (636) $ (371)
Basic and diluted loss per share under US GAAP $ (0.09) $ (0.01) $ (0.01)
Weighted average number of shares outstanding under US GAAP (in thousands) 144,888 100,036 43,674
The impact of US GAAP on the consolidated balance sheets are as follows:
Dec. 31, Dec. 31, Feb. 29,2005 2004 2004
Total assets under Canadian GAAP $ 465,697 $ 177,106 $ 93,948Write-off deferred mineral property costs (19,939) (8,356) (5,922)Adjustment to mineral properties (4,352) (2,524) (1,100)Adjustment to inventory 134 57 163Future income tax asset 4,606 – –
Total assets under US GAAP $ 446,146 $ 166,283 $ 87,089
Total liabilities under Canadian GAAP $ 150,723 $ 16,797 $ 12,687Future income tax liability (2,922) (2,994) (1,819)
Total liabilities under US GAAP 147,801 13,803 10,868
Shareholders’ equity under Canadian GAAP 314,974 160,309 81,261Write-off of deferred mineral property costs (19,939) (8,356) (5,922)Adjustment for depreciation, amortization and depletion (3,448) (2,028) (937)Write-off of pre-operating costs (770) (439) –Future income taxes 7,528 2,994 1,819
Shareholders’ equity under US GAAP 298,345 152,480 76,221
Total liabilities and shareholders’ equity under US GAAP $ 446,146 $ 166,283 $ 87,089
41894_fin_p107 3/22/06 2:18 PM Page 107

The components of Shareholders’ equity under US GAAP would be as follows:
Dec. 31, Dec. 31, Feb. 29,2005 2004 2004
Shareholders’ equityCommon shares $ 310,263 $ 147,261 $ 74,281Additional paid-in capital 9,410 13,636 9,721Deficit (21,328) (8,417) (7,781)
Total Shareholders’ equity $ 298,345 $ 152,480 $ 76,221
The impact of US GAAP on the consolidated cash flows are as follows:
Dec. 31, Dec. 31, Feb. 29,2005 2004 2004
(10 months)
Cash flows from operating activities per Canadian GAAP $ 3,410 $ 8,536 $ 5,491Write-off of deferred mineral property costs (11,914) (2,873) (723)
Cash flows from operating activities per US GAAP $ (8,504) $ 5,663 $ 4,768
Cash flows from financing activities per US GAAP $ 250,469 $ 68,882 $ 56,349
Cash flows from investing activities per Canadian GAAP $ (192,552) $ (27,087) $ (28,059)
Write-off of deferred mineral property costs 11,914 2,873 723
Cash flows from investing activities per US GAAP $ (180,638) $ (24,214) $ (27,336)
(i) Mineral propertiesUnder Canadian GAAP, resource property acquisition costs and exploration costs may be deferred and amortized to the extent they meet certain criteria. Capitalized costs under Canadian GAAP are amortized on a unit-of-production basis based on proven, probable and possible reserves. Under US GAAP, acquisition costs and exploration costs must be expensed as incurred unless the resource properties have proven and probable reserves at which time costs incurred to bring the mine into production are capitalized as development costs. Capitalized costs are then amortized on a unit-of-production basis based on proven and probable reserves. An additional depletion and exploration expense is required to be recognized under US GAAP. For the purposes of the consolidated statements of cash flows, these costs are classified as cash used in investing activities under Canadian GAAP and cash used in operations under US GAAP.
(ii) Pre-operating costsUS GAAP requires pre-operating costs to be expensed as incurred. Canadian GAAP allows pre-operating costs to be capitalized until commercial production is established.
(iii) Income taxesUnder Canadian GAAP, future income taxes are calculated based on enacted or substantively enacted tax rates applicable to future years. Under US GAAP, only enacted rates are used in the calculation of future income taxes. This difference in GAAP did not result in a difference in the financial position, results of operations or cash flows of the Company for the periods ended December 31, 2005, December 31, 2004 (ten months) and February 29, 2004.
GROWTHVALUE
108
A n n u a l R e p o r t 2 0 0 5
41894_fin_p108 3/22/06 2:18 PM Page 108

YAMANAVISION
109
(iv) Stock-based compensationThe Company has adopted the fair value method to account for stock-based transactions with employees and non-employees with effect from March 1, 2002 in accordance with the provisions of SFAS No. 148 and Canadian Institute of Chartered Accountants Handbook Section 3870.
Under FIN No. 44 the measurement of the stock-based compensation recognized in the periodended December 31, 2004 relating to the 808,000 shares issued would be measured at the date of final approval by the shareholders, with the result of increasing stock compensation expense by $630,000 for fiscal year ended December 31, 2004.
(v) Comprehensive LossIn May 1993, the FASB issued SFAS No. 115, Accounting for Certain Investments in Debt and Equity Securities (“SFAS No. 115”). Under SFAS No. 115, management determines the appropriateclassification of investments in debt and equity securities at the time of purchase and re-evaluates such designation as of each balance sheet date. Under SFAS No. 115, equity securities and long-term investments are classified as available-for-sale securities and accordingly, the Company is required to include the net unrealized holding gain on these securities in other comprehensive income. SFAS No. 130, Reporting Comprehensive Income, establishes standards for the reporting and display of comprehensive income and its components (revenue, expenses, gains and losses) in a full set of general purpose financial statements. Details would be disclosed as follows:
Dec. 31, Dec. 31, Feb. 29,2005 2004 2004
(10 months)
Net loss attributable to common shareholders under US GAAP $ (12,911) $ (636) $ (371)
Other comprehensive income (loss)Adjustment to unrealized loss on available
for sale securities $ (106) $ – $ –
Comprehensive loss under US GAAP $ (13,017) $ (636) $ (371)
(vi) Impact of Recent United States Accounting PronouncementsRecently issued United States accounting pronouncements have been outlined below. The Company believes the new standards issued by the U.S. Financial Accounting Standards Board (FASB) will not affect the Company.
In March 2004, the Emerging Issues Task Force (“EITF”) issued EITF 04-3, Mining Assets: Impairment and Business Combinations. EITF 04-3 requires mining companies to consider cash flows related to the economic value of mining assets (including mineral properties and rights) beyond those assets proven and probable reserves, as well as anticipated market price fluctuations,when assigning value in a business combination in accordance with SFAS 141 and when testing the mining assets for impairment in accordance with SFAS 144. The consensus is effective for fiscal periods beginning after March 31, 2004. The adoption of EITF 04-3 did not have a material impact on the Company’s financial position, results of operations or cash flows.
On December 16, 2004, the Financial Accounting Standards Board (“FASB”) issued FASB Statement No. 123 (revised 2004), Share-Based Payment (SFAS 123(R)), which is a revision of FASB Statement No. 123, Accounting for Stock-Based Compensation. SFAS 123(R) supersedes APB Opinion No. 24, Accounting for Stock Issued to Employees, and amends FASB Statement No. 95, Statement of Cash Flows. Generally, the approach in SFAS 123(R) requires all share-based payments to employees, including grants of employee stock options, to be recognized in the income statement based on their fair values. Pro forma disclosure is no longer an alternative. This statement will be effective for fiscal periods beginning after June 15, 2005, on a modified prospective basis.
Y A M A N A G O L D I N C.
41894_fin_p109 3/22/06 2:19 PM Page 109

On April 15, 2005, the U.S. Securities and Exchange Commission (“SEC”) announced that it would provide for a phased-in implementation process for FASB Statement No. 123(R), Share-Based Payment (“SFAS 123(R)”). The SEC would require that registrants adopt SFAS 123(R)’s fair value method of accounting for share-based payments to employees no later than the beginning of the first fiscal year beginning after June 15, 2005. The Company currently uses the fair value method to account for stock options granted to consultants, employees and directors.
In October 2005, the FASB issued FASB Staff Position FAS 123 (R)-2, Practical Accommodation to the Application of Grant Date as Defined in FAS 123 (R) (“FSP 123 (R)-2”). FSP 123 (R)-2 provides guidance on the application of grant date as defined in SFAS No. 123 (R).In accordance with this standard a grant date of an award exists if (i) the award is a unilateral grant and (ii) the key terms and conditions of the award are expected to be communicated to an individual recipient within a relatively short time period from the date of approval. The Company will adopt this standard when it adopts SFAS No. 123 (R), and does not anticipate that the implementation of this statement will have a significant impact on its results of operations.
In November 2005, the FASB issued FASB Staff Position FAS 123 (R)-3, Transition Election Related to Accounting for the Tax Effects of Share-Based Payment Awards (“FSP 123 (R)-3”). FSP 123 (R)-3 provides an elective alternative method that establishes a computational component to arrive at the beginning balance of the accumulated paid-in capital pool related to employee compensation and a simplified method to determine the subsequent impact on the accumulated paid-in capital pool of employee awards that are fully vested and outstanding upon the adoption of SFAS No. 123 (R). The Company will adopt this standard when it adopts SFAS No. 123 (R), and does not anticipate that the implementation of this statement will have a significant impact on its results of operations.
In November 2005, the FASB issued FASB Staff Position (FSP) FAS 115-1 and FAS 124-1 - The Meaning of Other-Than-Temporary Impairment and Its Application to Certain Investments. This FSP addresses the determination as to when an investment is considered impaired, whether that impairment is other than temporary, and the measurement of an impairment loss. This FSP also includes accounting considerations subsequent to the recognition of an other-than-temporary impairment and requires certain disclosures about unrealized losses that have not been recognized as other-than-temporary impairments. The guidance in this FSP FAS 115-1 and FAS 124-1 is applicable to reporting periods beginning after December 15, 2005. Management does not expect the adoption of this FSP to have a material effect on the Company’s consolidated financial position and results of operations.
In December 2004, the FASB issued SFAS 153, Exchanges of Non-Monetary Assets - An Amendment of APB Opinion No. 29. The guidance in APB No. 29, Accounting for Non-Monetary Transactions, is based on the principle that exchanges of non-monetary assets should be measured based on the fair value of the assets exchanged. The guidance in that Opinion, however, included certain exceptions to that principle. This Statement amends APB No. 29 to eliminate the exception for exchanges of similar productive assets and replaces it with a general exception for exchanges ofnon-monetary assets that do not have commercial substance. A non-monetary exchange has commercial substance if the future cash flows of the entity are expected to change significantly as a result of the exchange. This Statement will be effective for fiscal periods beginning after June 15, 2005. Earlier application is permitted for non-monetary asset exchanges incurred during fiscal years beginning after the date this Statement is issued. The Company believes this Statement will have no impact on the financial statements of the Company once adopted.
GROWTHVALUE
110
A n n u a l R e p o r t 2 0 0 5
41894_fin_p110 3/22/06 2:19 PM Page 110

YAMANAVISION
111
Y A M A N A G O L D I N C.
On March 30, 2005, the FASB ratified the consensus of the Emerging Issues Task Force (“EITF”) of the FASB Issue 04-6 that stripping costs incurred during the production phase of a mine are variable production costs that should be included in the costs of the inventory produced during the period that the stripping costs are incurred. This consensus is effective for the first reporting period in fiscal years beginning after December 15, 2005, with early adoption permitted. The consensus can be adopted either prospectively through a cumulative-effect adjustment or retrospectively by restating prior period financial statements. The Company will apply this consensus on its results of operations, financial position and cash flows if and when commercial production commences.
In March, 2005, the FASB issued FIN 47, Accounting for Conditional Asset Retirement Obligation - an interpretation of FASB 143. FIN 47 provides guidance that an entity must record a liability even if the obligation is conditional upon the occurrence of a future event (e.g. plant shutdown), unless it is not possible to make a reasonable estimate of the obligation. It also provides criteria for determining when an asset retirement obligation may be estimated reasonably. The interpretation is effective no later than the end of fiscal years ending after December 15, 2005. Retroactive application for interim financial information is permitted but not required. The Company will adopt this standard and does not anticipate that the implementation of this statement will have a significant impact on its results of operations.
On July 14, 2005, the FASB issued an exposure draft of a proposed Interpretation, Accounting for Uncertain Tax Positions - an Interpretation of FASB Statement No. 109. The proposed interpretation would require companies to recognize the best estimate of an uncertain tax position only if it is probable of being sustained on audit by the taxation authorities. Subsequently, the tax benefit would be derecognized (by either recording a tax liability or decreasing a tax asset) when the probable threshold is no longer met and it is more likely than not that the tax position will not be sustained. The proposed Interpretation would be effective for years ending after December 15, 2005 and treated as a change in accounting policy. It would require companies to assess all uncertain tax positions and only those meeting the probable threshold at the transition date would continue to be recognized. The difference between the amount previously recognized and the amount recognized after applying the proposed Interpretation would be recorded as the cumulative-effect adjustment in the 2005 statement of earnings (restatement is not permitted). The comment period ends September 12, 2005. The Company does not expect the proposed Interpretation to have a material impact on its results.
41894_fin_p111 3/22/06 2:19 PM Page 111

GROWTHVALUE
112
A n n u a l R e p o r t 2 0 0 5
Directors
Victor BradleyMining ExecutiveNon-Executive Chairman
Juvenal Mesquita FilhoPresident, Mineraçao Santa Elina S/A
C. Nigel LeesMining Executive
Peter MarronePresident and CEO,Yamana Gold Inc.
Patrick MarsMining Executive
Antenor SilvaChief Operating Officer,Yamana Gold Inc.
Dino TitaroMining Executive
Proposed (dependent on completion of Desert Sun acquisition):
Stan BhartiMining Executive
Bruce HumphriesMining Executive
Management
Peter MarronePresident and Chief Executive Officer
Antenor SilvaChief Operating Officer
Charles MainVice President, Finance and Chief Financial Officer
Greg McKnightVice President, Business Development
Evandro CintraVice President, Exploration
Daniel KivariVice President, Operations
Betty SoaresCorporate Controller
Jacqueline JonesGeneral Counsel
Mark BennettCorporate Secretary
CORPORATE INFORMATION
41894_fin_p112 3/25/06 10:46 AM Page 112

YAMANAVISION
113
Y A M A N A G O L D I N C.
Executive Offices
150 York Street, Suite 1102Toronto, Ontario, Canada M5H 3S5
Tel: (416) 815-0220Fax: (416) 815-0021
Rua Funchal411 - 5˚ andar - conjunto 92CEP 04551-060 - São PauloSP - Brazil
Tel: +55 11 2163 8300Fax: +55 11 2163 8324
Annual General and Special Meeting
Yamana Gold Inc. will hold its Annual General and Special Meeting on Tuesday, May 2, 2006 at 10:00 am at the TSX GalleryThe Exchange Tower, 130 King Street West,Toronto, Ontario, Canada.
Transfer Agent
CIBC Mellon Trust Company320 Bay Street, Box 1, Toronto, Ontario, CanadaM5H 4A6
Auditors
Deloitte & Touche LLP
Vancouver, British Columbia, Canada
Legal Counsel
Cassels Brock & Blackwell LLP
Toronto, Ontario, Canada
Dorsey & Whitney LLP
Toronto, Ontario, Canada
Capitalization
191,341,932 common sharesissued as of December 31, 2005
Share Listings
Toronto Stock Exchange Symbol: YRIAmerican Stock Exchange Symbol: AUYLondon Stock Exchange (AIM) Symbol: YAU
Website
www.yamana.com
Information Contact
41894_fin_p113 3/25/06 10:46 AM Page 113

GROWTHVALUE
114
A n n u a l R e p o r t 2 0 0 5
Printed in Canada on recycled paperusing vegetable based inks.
Production: Walter J. Mishko & Co. Inc.
Design: Goodhoofd Inc.
Editorial services: Tony Leighton
Photography: João Musa, Peter Christopher, Brian Pieters
41894_fin_p114 3/25/06 10:47 AM Page 114

YAMANAAT A GLANCEY A M A N A G O L D I N C.
2005 Estimated Proven & Probable Measured & Indicated
2005 Cash 2006 Reserves(3)(4) Resources(3) 2006 Beyond(as of February 28, 2006) Production Costs(3) Production Contained gold oz/copper lbs Contained gold oz/copper lbs Objectives 2006
Fazenda Nova Mine (Brazil) • constructed at a total capital cost 36,159 oz $208 30,000 - 33,000 oz 92,300 oz 114,200 oz • targeted cash costs • deep resourceGold of approximately US$6.5 million /oz gold at less than US$200 potentialShallow, open pit, heap leach operation • began commercial production Commercial /ounce
May 1, 2005 production28,780 oz
Fazenda Brasileiro Mine (Brazil) • more than 14 years of operating 72,074 oz $320 80,000 - 85,000 oz 206,700 oz 444,200 oz • add resources and • current resources Gold experience /oz gold convert existing support 4-6 yearProducing underground operation • E-Deep definition drilling and mine resources into mine life at average
development ongoing reserves 80,000 oz per year• increase mine life • mining from higher• cost reductions grades from C-Quartz
and E-Deep areas
São Francisco Mine (Brazil) • begins commercial operation in early 2006 4,050 oz – 100,000 - 126,000 oz Main ore: 1.1 M oz 1.65 M oz • attain commercial • production for moreGold • production upside from conversion of (pilot plant) gold ROM(5): 0.3 M oz production than 10 years at lessAdvanced open pit, gravity/heap leach project resources to reserves and grade upside 1.4 M oz than $210/oz
due to coarse gold effect
Chapada Project (Brazil) • construction on schedule – – 15,000 - 19,000 oz 2.5 M oz Measured and • completion of • 19 year mine lifeCopper, Gold • targeted production by fourth quarter 2006 gold 2.3 B lbs Indicated 3.0 M oz construction and • Total production of Shallow open pit mining project with initial 5 year high-grade starter pit Measured and commence 2 B lbs of copper
• less than 2 year pay-back Indicated 2.8 B lbs production and 1.3 M oz of gold• Most of gold production
in first five years
San Andrés Mine(1) (Honduras) • production of 402,700 oz over the last 61,236 oz – 50,000 - 60,000 oz n/a n/a • increase production • Potential reserve Gold 5 years at an average cash cost of $237/oz gold • lower costs increaseProducing underground operation • exploration potential to extend 5-year • significant
mine plan exploration
La Libertad Mine(1) (Nicaragua) • 18,300 hectares of mining and exploration 33,860 oz – 45,000 - 50,000 oz n/a n/a • improve recovery • Underground miningGold concessions gold rates potentialOpen pit heap leach operation • contract mining • recapitalize
• historical under capitalization to be corrected • improve efficiencyonce process plan improvements are initiated
São Vicente (Brazil) • feasibility stage project with potential – – – Main ore: 361,300 oz 660,500 oz • feasibility study • constructionGold for a stand-alone open pit mine ROM(5): 108,700 oz including a new (assuming a positiveDevelopment Project • bulk samples suggest grades may exceed 470,000 oz reserve estimate feasibility study)
drill indicated grades and reserve grades • continue resource expansion throughexploration
C1 Santa Luz (Brazil) • located on the Rio Itapicuru Greenstone – – – 556,000 oz 982,400 oz • feasibility study • construction Gold Belt north of Fazenda Brasileiro Mine (assuming a positiveDevelopment Project • potential for stand-alone open pit and u/g mine feasibility study)
• significant resources - reserves are increasing
Ernesto (Brazil) • located on the Santa Elina Gold Belt – – – – 141,800 oz • feasibility study • construction Gold south of São Francisco (assuming a positiveDevelopment Project • potential for stand-alone mine feasibility study)
(1) Acquired through the amalgamation with RNC Gold Inc. effective February 28, 2006. (3) Gold price assumption $425/oz (4) Subset of Measured(2) Average cash costs for 2005 - $289 per ounce excluding mines acquired from RNC Gold Inc. Copper price assumption $1.00/lb and Indicated Resources
(5) ROM - Run-of-mine
GROWTHVALUE
A n n u a l R e p o r t 2 0 0 5
YAMANA - AT A GLANCE

Annual Report
2005
YAMANAVISION
Ya
ma
na
Go
ld In
c.
2005 A
nn
ua
l Re
po
rt
Chapada
FazendaBrasileiro
Fazenda Nova
São Vicente
São Francisco
La Libertad
San Andrés
Y A M A N A G O L D I N C.
YAMANA GOLD INC. is a Canadian
gold mining company with a
diversified portfolio of gold
mining operations, development
properties, and exploration-stage
properties in Brazil and Central
America.Yamana is listed on the
Toronto Stock Exchange (YRI), the
American Stock Exchange (AUY)
and the London Stock Exchange
Alternative Investment Market (YAU).
• Latin America focused gold producer.• Five(1) operating mines.• One fully-financed project under construction
- forecast to be completed fourth quarter 2006.• Forecast gold production to exceed 340,000
ounces in 2006, increasing to more than 500,000 ounces in 2007; target production of 750,000 ounces for 2008 (not including proposed acquisition of Desert Sun Mining Corp.).
• Significant land position in Brazil with close to 650,000 hectares of exploration concessions.
• Strong South America presence.• Commitment to exploration.(1) Including mines acquired through the amalgamation with RNC Gold Inc.
effective February 28, 2006.
A cautionary note regarding forward-looking statements and non-GAAP measures follows the Management’s Discussion and Analysis of Operations and Financial Condition.
All figures are in US dollars unless otherwise indicated.
Contents
Corporate Profile
Yamana - At a Glance
6 Why Invest in Yamana?
7 Our 2005 Achievements
9 Message to Shareholders
12 Delivering Results
13 Our Strategic Vision
15 Near-term Goals
16 How Yamana is Different
17 Leveraging Expertise
18 Brazil
21 Operations and Activities
32 Exploration
41 Environmental, Health and Safety
42 Reserves and Resources
45 Management’s Discussion and Analysis
85 Management’s Responsibility
86 Auditors’ Report
87 Consolidated Financial Statements
90 Notes to the Consolidated Financial
Statements
112 Corporate Information
C1 SantaLuz
.COMYAMANA