41. trace-element geochemistry of sediments and sulfur isotope
TRANSCRIPT

Pisciotto, K. A., Ingle, J. C, Jr., von Breymann, M. T., Barron, J., et al., 1992Proceedings of the Ocean Drilling Program, Scientific Results, Vol. 127/128, Pt. 1
41. TRACE-ELEMENT GEOCHEMISTRY OF SEDIMENTS AND SULFUR ISOTOPEGEOCHEMISTRY OF FRAMBOIDAL PYRITE FROM SITE 795, LEG 127, JAPAN SEA1
Toshiyuki Masuzawa,2 Jitsuya Takada,3 and Rokuji Matsushita3
ABSTRACT
Sixty sediment samples collected every 10 m from Holes 795A and 795B in the northern Japan Sea were analyzed for 27major and trace elements using instrumental neutron activation analysis, and for total organic carbon (TOC), total nitrogen, andtotal sulfur (TS). Sulfur isotope ratio (δ 3 4SC D T) was measured on sedimentary framboidal pyrite isolated from sediments with ahigh sulfur content. The changes in redox condition of the bottom water of the sea are estimated from vertical variations of redoxsensitive elements (TOC, TS, Mn, Sb, U, and As) and from TOC-TS and TS-δ 3 4SC D T relationships. These data were comparedto those from a piston core (KH77-3-L4') collected near Site 795. The estimated changes in the redox condition are: a variationbetween less oxic and less euxinic in Units 5,4B, 4A, and 3 (ca. 13-15 to 6-7 Ma); oxic but less so than that of the present JapanSea with diagenetic sulfate reduction under very high biological productivity in Unit 2 (ca. 6-7 to 2.4 Ma); and a drastic variationbetween oxic, similar to the present bottom water, and euxinic, similar to that during the last glacial period in the sea, in UnitsIB (ca. 2.4-1.2 Ma) and 1A (ca. 1.2 Ma to the present).
INTRODUCTION
The Japan Sea is a marginal sea behind the Japanese island arcwith an abyssal plain about 3,500 m deep. Deep and bottom watersof the sea are isolated from the open ocean by shallow sills withmaximum depths of 10-135 m. The deep and bottom waters are,however, almost uniform in salinity (34.06 o/oo-34.08 o/oo), tempera-ture (0.0°-0.4°C), and dissolved oxygen concentration (5.0-5.8 ml/L;Nitani, 1972). Thus, the present Japan Sea is highly oxic. A drasticenvironmental change through the last glacial period has been sug-gested by paleontological (e.g., Arai et al., 1981;Obaetal., 1991)andgeochemical (Masuzawa and Kitano, 1983b, 1984; Masuzawa andKusakabe, unpubl. data; Masuzawa et al., in press) studies of pistoncore samples. The drastic change has been thought to be due tochanges in the hydrology of the sea related to those in climate and insea level through the last glacial period. Appearance of H2S-bearingbottom waters during the last glacial period has been indicated byvertical profiles of total sulfur content (Masuzawa and Kitano, 1984)and sulfur isotope ratio of isolated framboidal pyrite (Masuzawa andKusakabe, unpubl. data) in a piston core (KH77-3-L4') from thenorthern Japan Basin. Masuzawa et al. (in press) recognized a changebetween oxic and euxinic bottom waters from vertical profiles ofredox-sensitive elements such as Mn, Ce, Sb, U, As, S, and C of thesame piston core through the last glacial period.
The Black Sea and the Cariaco Basin are typical euxinic basins atthe present time. Oxygen-deficient environments have been reportedin the South Atlantic Ocean after its opening (e.g., Brumsack, 1980)and in the eastern Mediterranean Sea in the Pleistocene and Quater-nary as evidenced by the deposition of sapropel layers (e.g., Cita andGrignani, 1982). Such drastic change in redox conditions of thebottom water could be expected from the geologic history of the JapanSea. The aim of the present paper is to survey the general trend of thechange in redox conditions of the bottom water of the sea since itsbirth. The authors have analyzed 60 sediment samples collected every10 m from Site 795, which is near piston core KH77-3-L4', in thenorthern Japan Basin. We report major and trace-element contentsmeasured by neutron activation analysis, as well as sulfur isotope
Pisciotto, K. A., Ingle, J. C, Jr., von Breymann, M. T., Barron, J., et al., 1992. Proc.ODP, Sci. Results, 127/128, Pt. 1: College Station, TX (Ocean Drilling Program).
2 Water Research Institute, Nagoya University, Nagoya 464-01, Japan.3 Research Reactor Institute, Kyoto University, Kumatori, Osaka 590-04, Japan.
ratios of sedimentary pyrite isolated from these sediment samples.The changes in redox conditions of the bottom water of the sea sinceits birth are discussed based on the distributions of redox-sensitiveelements and sulfur isotope ratios of sedimentary pyrite with refer-ence to those data from the piston core.
MATERIALS AND METHODS
Sixty sediment samples were taken from split cores on board theJOIDES Resolution according to a routine sample spacing of ca. 10 mfrom Holes 795A and 795B (43.987°N, 138.967°E, 3,300 m waterdepth). The samples were sealed in polyethylene bags, stored in arefrigerator, and brought to the shore-based laboratory. Apart of eachsample was vacuum-dried at 60°C and powdered in an agate mortarfor chemical analysis.
Total organic carbon (TOC) and total nitrogen (TN) were determinedusing a Yanaco MTS-2 CHN analyzer after removal of carbonate carbonwith dilute hydrochloric acid and vacuum-drying at 60°C. Total sulfur(TS) was determined with a DIONEX QIC ion chromatograph afterpressurized microwave digestion with hydrogen peroxide and leachingwith 0.1M Na2CO3 solution (Takamatsu and Kawashima, 1988; Kojimaet al, 1988). TS content was corrected by subtracting the amount ofpore-water sulfate contained in the dried sample, which was estimatedfrom pore-water composition (Tamaki, Pisciotto, Allan, et al., 1990) andCl content.
Instrumental neutron activation analysis (INAA; Koyama et al.,1987; Masuzawa et al., 1989; Masuzawa and Koyama, 1989) wasperformed using the KUR reactor of Kyoto University for the deter-mination of 27 major and trace elements.
Stable sulfur isotope ratio of sedimentary pyrite was measured by themethod of Masuzawa and Kusakabe (unpubl. data): A portion of wetsediment sample (6-8 g) with a TS content of ca. >0.5% was suspendedin 0.0025M Na4P2O7 solution and the supernatant solution was discardedafter a few hours. This process was repeated several times to remove mostof the clay particles. The residue was treated with concentrated hydroflu-oric acid and with 6M hydrochloric acid on a hot plate. It was thentransferred to a glass vial and suspended in tetrabromoethane (d = 2.98g/cm3); the suspension was then centrifuged. Sedimentary pyrite wasobtained in the fraction heavier than tetrabromoethane. About 10 mg ofdried pyrite was decomposed with aqua regia and dissolved in 0.1Mhydrochloric acid. Then it was passed through a cation exchange columnto remove iron, and sulfur was precipitated as barium sulfate. Sulfurisotope ratio was measured using the thermal decomposition method of
705

T. MASUZAWA, J. TAKADA, R. MATSUSHITA
barium sulfate (Yanagisawa and Sakai, 1983) with a SIRA-10 massspectrometer, and expressed in the δ notation as per mil (o/oo) deviationfrom that of troilite in Canyon Diablo meteorite (CDT).
Isolated pyrite grains were examined with an optical microscopeand a Hitachi X-560 scanning electron microscope (SEM) in conjunc-tion with an EDAX FV-9900 energy dispersive X-ray fluorescenceanalysis system (EDS).
The lithology of Site 795 described by Tada and Iijima (thisvolume) is as follows: Unit 1A, distinctly banded dark and light clayand silty clay (0-64.6 mbsf); Unit IB, faintly banded dark and lightclay and silty clay (64.6-142.2 mbsf); Unit 2, homogeneous diatomooze and diatom clay (142.2-395 mbsf); Unit 3, rhythmical alterna-tions of dark and light diatom silty clay or siliceous silty claystonewith burrow cycles (395-525 mbsf); Unit 4A, rhythmical alternationsof dark chert and light siliceous claystone (525-587 mbsf); Unit 4B,siliceous claystone with horizontal burrows (587-645 mbsf); Unit 5,claystone with faint lamination and horizontal burrows (645-684mbsf); and basaltic sill and lava (684-762 mbsf). Opal-A/opal-CTand opal-CT/quartz boundaries were found at 325 and 471 mbsf,respectively, and the top of the base rock has an estimated age of13.0-15.0 Ma (Tamaki, Pisciotto, Allan, et al., 1990).
RESULTS AND DISCUSSION
Analytical results of TOC, TN, C/N, TS, and 27 major and traceelements of 60 sediment samples from Site 795 are listed in Table 1.This table also includes δ 3 4 S C D T data of sedimentary pyrite. Verticalprofiles of Al, Fe, and Cr (Fig. 1), Th, Hf, and Cs (Fig. 2), Se, La, andCe (Fig. 3), Ba, Zn, and Co (Fig. 4), TOC, TS, and Mn (Fig. 5), andSb, U, and As (Fig. 6) are shown in Figures 1-6 with the lithologydescribed by Tada and Iijima (this volume). The shipboard results of
TOC and TS (Tamaki, Pisciotto, Allan, et al., 1990) are included inFigure 5.
Al and Refractory Elements
Al contents (Fig. 1) are relatively low in Unit 2 and very low atseveral layers. The low Al contents of Unit 2 and several layers aredue to the high diatom contents of these layers (Tamaki, Pisciotto,Allan, et al, 1990). Vertical profiles of Th, Hf, Cs, Se, La, and Ce(Figs. 2 and 3) are very similar to that of Al. These elements show arefractory nature, and are thought to be contained in aluminosilicateparticles behaving similarly to Al (Masuzawa et al., 1989).
TOC and TS
TOC content varies remarkably in Units 1A and IB (0.15%^.31 %),shows a relatively low value in Unit 2, and a slightly higher value in Units3,4A, 4B, and 5 (Fig. 5). The TS content is also highly variable in Units1A and IB (0.04%-9.34%), shows a moderate value in Unit 2, and aslightly higher value in Units 3, 4A, 4B, and 5 (Fig. 5).
Sudden increases in the sulfur content of up to 5.0%, mostly asframboidal pyrite, were found in a piston core near Site 795 in thenorthern Japan Basin (KH77-3-L4'; 43°00.3'N, 138°28.1'E; 3,540 mwater depth; 528 cm long). This observation indicates the appearanceof H2S-bearing (euxinic) bottom waters in the Japan Sea during thelast glacial period (Masuzawa and Kitano, 1984). Core KH77-3-L4'is the only one without diagenetic sulfate reduction among 14 pistoncores collected from the Japan Sea (Masuzawa and Kitano, 1983a;Masuzawa, 1987). The accumulation of sulfur as framboidal pyrite inareas without any hydrothermal activity is the result of microbialhydrogen sulfide via two possible ways: diagenetic sulfate reduction
A l (%)
795 0 2 A 6 8 10 0
Fe (%) Cr (ppm)8 0 20 A0 60 80 100
0 -
100-
200-
300-
.c~ A00-α.Q
500-
600-
[3D
D a
• u
; d: D
Qπ
• G
D
u
et
π
D
D
D DD
C
c
3[
D D
α
D
r>rfq
α
1
D
%
3
]
n- . .
DJ
<>
O
c
.Joo
o
0 °<x>o
Xo
o
o
o
o
oc>
o<>o
>
~ <o
oo
<>Λ
o
0
y
s
>o
o o
>
t>
t>
t>
>t>
>
c
t?
> t
I
D> >
t>
>
>
>• t>
>
> D
>
>>
D
t>
>
>
>
t>C
t>
>> >
>
>
*>
t
>
>>
>
>
>
>
700-
Figure 1. Vertical profiles of Al (left), Fe (middle), and Cr (right) at Site 795. The left-side column shows the lithology described by Tada and Iijima (this volume):
Unit 1A (0-64.6 mbsf), Unit IB (64.6-142.2 mbsf), Unit 2 (142.2-395 mbsf), Unit 3 (395-525 mbsf), Unit 4A (525-587 mbsf), Unit 4B (587-645 mbsf), Unit 5
(645-684 mbsf), and basaltic sill and lava (684-762 mbsf).
706

SEDIMENT AND PYRITE GEOCHEMISTRY
Th (ppm) Hf (ppm) Cs (ppm)795 8 1 2 1 6 0 1 2 3 4 5 6 0 2 A 6 β 1 0 1 2
o-
100-
200-
300-
*- 400-α
Q
500H
600-
700-
D
D
D :
D c
: αcα p
α D
tli1
D
uπ
D
t
1
]
D
of
°ffa
ππ
i fi
D
] D
1
π
? °
D
i [
o
D
:
no
<>
c>
o
o
o<
/o
o o
0 o
oo
o
>
o
o
o°
•̂ o
°o0
0
o 0 •
o
o
o
%
o
0o
D
>
>
>
t>
fi
>
c
rt>
>
rs
>
C5
I>
>
c
c
>
>
t o
>
o
>
>>t>
t>
>t>
>
>
t>
> c
> r
>
t>
Figure 2. Vertical profiles of Th (left), Hf (middle), and Cs (right) at Site 795 (lithology as in Fig. 1).
Se (ppm)795 0 10 20 0
La (ppm)10 20 30
Ce (ppm)40 0 20 40 60 80 100
(mb
sf)
ep
t h
Q
o-
100-
200-
300-
400-
500-
600-
700-
VΛΛΛ
JAAΛ
ii ™
>
>
>
>>
>l>
r>i>
>
> (
t>
>
>
>
t>
>
>
>
t>1
T>
t>
>
>
t>
>
>
>
D
D D
CD
π D
D
^ CD
π
D D
D Q •
cD
DD
. . . n . . .
B
I ^
D
D
i
0
<
>
>
o
<
°o00
oo
o
>
t oo
o<r>
o .
<o
o
°o
>
o
co
o>o
oo
<
o <
o<
ov
o
o
Figure 3. Vertical profiles of Se (left), La (middle), and Ce (right) at Site 795 (lithology as in Fig. 1).
707

T. MASUZAWA, J. TAKADA, R. MATSUSHITA
Table 1. Sediment Chemistry at Site 795.
HoleCore, sectioninterval (cm)
Depth(mbsf)
TOC TN TS Al Fe Na ClC/N (%) (‰) (%)
Mn(ppm)
Br(ppm)
As(ppm)
Sb(ppm)
Zn(ppm)
795A
795B
01H-0402H-0503H-0504H-0305H-0206H-0307H-0408H-0409H-0410H-0111H-0312H-0313H-O514H-0615H-0616H-0418H-0619H-0621X-0422X-0425X-0526X-0527X-0529X-0330X-0131X-0334X-03
01R-0202R-0203R-0104R-0105R-0106R-0107R-0108R-0109R-0110R-0411R-0312R-0313R-0314R-0315R-0116R-0217R-0218R-0219R-0220R-0522R-0222R-0323R-0123R-0324R-0425R-0626R-0627R-0228R-0229R-0330R-0331R-0432R-03
84-8653-5539-41
114-11683-8516-1839-4159-6160-6259-6159-6189-9183-8584-8683-8517-1985-8784-8654-5653-5554-5654-5654-5617-1955-5756-5858-60
81-8374-7621-2388-9079-8181-8356-5992-94
120-12236-3626-2827-2927-2924-26
148-15062-6467-6967-6966-6831-3360-6290-92
125-127101-103
9-11100-102114-11683-8576-7863-6545^1747^1913-15
5.3415.8325.1932.4440.1350.4661.6971.3980.9085.8998.39
108.19120.63131.64141.13146.97161.25170.74186.64196.23225.85236.64246.44262.67269.85282.66311.48
367.51377.24384.91395.28404.89414.61423.66433.72443.60456.84464.96474.67484.27493.94501.48511.82521.57531.27540.86554.71569.80571.04578.65581.41590.53605.20615.04618.33627.96638.93648.35659.47667.33
0.550.520.331.000.373.142.330.510.260.280.290.400.690.300.300.650.610.570.720.690.430.630.650.580.630.630.72
0.410.660.960.580.510.981.341.030.501.030.610.540.500.630.560.910.641.200.750.550.680.540.260.520.170.400.510.340.370.400.430.410.70
0.0870.0700.0580.1170.0640.2540.1900.0970.0570.0720.0680.0770.0950.0810.0730.0970.1040.1020.0960.0900.0790.0910.1080.1000.0980.0910.102
0.0660.0820.0770.0570.0670.1120.1480.0920.0550.1280.1000.0960.0740.0970.0800.1170.0790.1140.0770.0670.0690.0630.0300.0580.0380.0510.0690.0630.0650.0520.0470.0530.059
6.47.45.68.65.8
12.412.35.24.63.84.35.27.23.74.16.65.95.77.67.75.56.96.15.86.46.97.1
6.18.1
12.410.27.78.79.0
11.29.08.16.05.76.76.67.07.88.1
10.59.88.29.98.58.78.94.67.97.45.45.77.89.27.7
11.8
0.070.060.053.130.073.846.330.060.040.050.610.100.140.520.270.841.141.030.910.810.760.980.970.941.091.170.74
0.541.000.970.970.822.111.190.900.301.541.871.070.522.270.601.242.101.230.561.701.730.962.790.766.151.490.832.331.880.481.140.990.61
-40.7
-41.8-48.3
-38.3-41.5
-32.71.6
-12.1-13.1-27.2-23.7-32.1
-8.0-37.6-35.1-35.7-38.6
-23.8-44.4
-41.3
-39.0-41.4-41.7-25.1-37.514.2
-34.9-9.4
-32.4-31.5-28.8-33.1-20.8-37.3-25.8-20.0-34.8
-0.7-39.211.5
-30.6-44.4-21.9-27.0-37.7-39.1-41.3-45.3
5.617.456.817.327.453.222.037.157.217.387.347.246.055.817.055.546.306.705.284.086.165.065.564.954.945.695.17
5.785.523.904.224.475.556.593.802.167.006.266.555.446.687.036.745.295.746.945.394.574.868.126.887.603.604.496.396.476.505.946.346.67
4.064.754.385.034.303.835.337.725.104.164.353.402.942.963.613.414.183.483.172.613.462.843.343.123.343.732.92
3.052.852.252.602.293.924.342.451.054.063.643.432.723.973.464.033.252.882.243.082.632.415.252.905.062.212.174.144.103.122.893.432.67
2.502.032.922.122.262.512.522.372.683.002.202.542.442.442.642.392.492.592.632.622.622.562.442.382.242.332.54
1.471.371.141.181.161.331.500.970.711.341.511.361.031.131.121.090.921.010.920.940.860.891.090.950.920.720.760.940.980.950.790.850.85
2.061.462.941.561.793.113.282.072.522.701.792.432.132.442.482.052.272.352.542.672.442.401.712.141.751.681.88
0.680.590.580.540.540.620.460.530.420.361.050.570.340.500.520.400.430.610.460.480.500.510.440.360.400.440.350.250.400.320.300.310.38
89027403250760
1650900590
1800780410930460970
18701080940520670590520760680710530400540370
35041033031034050062029010041041044033029027027046024012024018017090
14060
100150230230210190250
8053
1056362
1561718092
105587679958682798199
11787958487736685
2736363433443534332743332434253627393224312724252826232222202019
7.09.53.2
88.61.9
56.985.196.44.62.5
11.5l>4.97.04.28.8
10.06.0l>5.8l>2.94.12.16.83.1
10.4
4.88.16.07.23.28.52.24.62.04.53.02.81.8
10.41.98.33.19.42.74.69.42.98.6l>
12.2l>l>l>5.3l>l>l>8.7
2.64.21.6
11.22.3
10.011.88.41.61.51.41.13.95.51.33.22.92.23.43.12.02.72.62.41.92.62.2
1.43.02.32.61.85.53.42.5i.23.62.54.72.43.62.42.94.02.61.82.52.61.93.51.34.42.36.02.72.52.01.41.61.7
17717113918115143
100171175147130175212
3615717317916371
133685753375542
355248404572844024
320180114100122
842431881401831325947
197
5252
22762
16434
18974
(diagenetic sulfide deposition) and euxinic bottom water (syngeneticsulfide deposition). TS contents resulting from diagenetic sulfatereduction hardly exceed 2.0% and are generally less than 1.5%,because the supply of seawater sulfate by diffusion is limited withincreasing depth (Goldhaber and Kaplan, 1980; Masuzawa and Ki-tano, 1983b). A very high TS content indicates syngenetic formationof iron sulfide under an euxinic bottom water.
A method has been proposed to distinguish euxinic (H2S-containing)from normal marine (dissolved-oxygen-containing) environments byplots of TS vs. TOC of sediments (Leventhal, 1983; Raiswell and Berner,1985). A TS vs. TOC plot shows a positive correlation with nearly zeroTS intercept in normal marine environments, whereas a positive TS
intercept between 1% and 2% is observed in an euxinic basin (theBlack Sea). The positive TS intercept is due to syngenetic formationof iron sulfide under euxinic bottom water.
Figure 7 is a plot of TS vs. TOC of sediments from Site 795 withidealized relationships between TOC and TS in normal marine envi-ronments (NM) and in the Black Sea (BS) after Leventhal (1983). TheTOC-TS plot for Units 1A and IB (Fig. 7A) is quite different fromthose for Units 2 to 5 (Figs. 7B-7D). Both TOC and TS contents arehighly variable in Units 1A and IB with many layers of very low TOCand TS contents (Fig. 7A).
In Units 1A and IB many of the TS contents are much higher thanthe idealized relationship for normal marine sediments (NM) and higher
708

SEDIMENT AND PYRITE GEOCHEMISTRY
Table 1 (continued).
Co(ppm)
21.835.9
23.2
40.6
31.2
49.4
7.9
12.6
20.1
17.5
25.3
12.4
16.4
22.6
29.7
24.4
26.1
18.9
18.5
17.6
19.215.7
20.6
14.7
14.815.3
14.2
12.217.715.012.311.7
23.7
24.3
16.4
9.1
36.8
22.1
29.5
18.3
28.8
16.4
20.7
32.6
16.4
9.812.89.3
12.122.5
8.28.68.68.3
20.1
15.2
10.8
9.815.2
23.7
Cr(ppm)
74
8061
75
8339
29
62
75
64
67
60
52
56
64
65
70
73
62
53
67
6167
57
65
8168
62
66
43
51
42
62
77
44
2875
70
67
54
66
589850
53
52
61
49
50
47
II3843
50
60
6352
60
69
V(ppm)
134
142
152
129
144
178
141
147
116
111
141
124
151160
92
110134
149
136
114
138
106
170
140
124
126
152
125
139
83109
100
184
193
100
67
201
146
163
136
130
166
137
138
132
108
107
848211891
33
828591
134
131
87121
151
Ba(ppm)
820
750
9309801000
2300
6901080
1680
1180
9109801480
990
1210
1710
1520
1070
1100
9701030
880950
780
850
790
810
650
1080
660
670
510
8001920720
350
670
710
940
690
690
790
620
640
540
630
530
660
540
230
510
440
400
470
900
1060700810
1180
Rb(ppm)
174
140
153
135
145
78
114
120
132
129
100
78109
127
91
97
108
70
51
94
42
75
92
89
73
8066
59
52
116
9848
153
130
134
105
154
131
132
103
118
121
124
63
117
57
95
62
8069
126
118
69
177
106
Cs(ppm)
10.110.09.9
9.2
9.84.5
2.0
7.86.9
8.08.67.0
6.0
6.3
6.4
5.86.7
7.2
5.7
4.3
6.9
5.7
5.7
4.9
5.0
7.1
5.8
6.7
5.84.2
5.7
6.0
7.4
8.15.2
3.3
9.2
7.87.7
7.5
8.79.2
10.8
7.1
7.4
8.57.2
6.5
6.82.85.5
1.85.0
6.2
6.1
8.69.2
7.2
9.0
8.2
Th(ppm)
11.511.810.8
10.5
11.25.0
3.0
10.3
8.812.19.4
7.9
7.46.3
7.86.2
7.2
7.9
6.3
5.0
6.3
5.5
5.6
4.94.96.0
5.3
6.0
6.0
4.45.6
5.2
7.1
9.2
5.0
2.5
9.0
8.07.9
7.0
9.0
9.3
10.4
6.9
7.6
7.4
7.2
5.7
6.5
7.3
7.3
9.2
4.6
5.5
10.1
8.18.57.4
7.6
6.1
Hf(ppm)
4.85.2
5.4
5.4
4.9
2.11.44.2
4.1
5.2
4.2
4.3
3.2
3.5
3.6
4.0
3.7
3.9
3.3
2.4
2.9
2.6
3.0
2.5
3.0
3.5
2.7
3.0
2.81.82.7
2.3
2.83.7
1.7
1.3
4.2
3.7
3.6
2.83.0
3.1
3.2
2.92.82.62.3
2.2
2.85.1
4.3
5.6
2.1
2.5
4.5
3.3
3.4
2.4
3.1
2.7
Ta(ppm)
0.95
1.11
0.79
1.11
1.02
0.45
0.79
1.50
0.76
0.61
0.54
0.60
0.57
0.57
0.56
0.67
0.45
0.74
0.50
0.53
0.44
0.75
0.42
0.56
0.40
0.46
0.35
0.56
0.60
0.54
0.59
0.63
0.67
0.57
0.82
0.99
0.56
0.53
0.75
0.41
0.52
0.67
0.60
0.40
0.49
0.65
0.59
0.68
0.68
0.43
U(ppm)
4.83.9
4.86.7
3.4
8.55.0
3.3
3.3
4.0
2.2
2.1
4.5
3.5
2.9
3.7
3.5
2.4
3.4
1.5
2.0
3.6
2.3
4.1
3.1
3.6
3.3
5.84.15.7
4.86.6
8.43.6
1.7
4.7
5.1
2.5
3.7
5.9
5.5
6.0
3.6
6.1
7.3
3.1
1.83.5
4.6
4.82.3
2.5
2.6
2.9
3.9
2.6
3.4
4.1
3.8
Se(ppm)
14.113.514.8
13.6
13.8
7.2
4.0
13.4
13.8
14.1
12.7
13.1
10.7
10.1
11.8
10.9
13.9
13.5
10.7
8.511.7
10.611.2
10.4
10.5
11.7
10.2
10.6
10.7
7.6
9.1
8.411.7
15.0
7.84.114.5
11.6
12.0
9.9
11.2
12.1
13.4
9.810.1
9.0
9.2
7.9
8.817.310.2
6.2
6.5
8.210.1
11.0
11.1
9.6
10.8
13.0
La(ppm)
37.8
34.3
32.3
30.6
31.7
15.9
11.227.3
24.5
31.5
25.6
24.1
22.4
19.4
22.5
18.2
21.2
21.5
18.1
14.0
19.2
15.0
17.4
14.5
15.417.1
16.3
17.2
16.4
12.4
15.6
14.3
20.1
28.9
13.1
7.0
27.1
21.9
23.4
19.2
24.5
25.4
25.6
20.0
19.8
19.6
18.1
15.9
19.2
25.7
23.2
21.5
11.4
13.6
27.1
21.4
20.9
19.3
21.1
16.2
Ce(ppm)
73
72
63
57
63
31
21
55
5866
50
4849
42
44
36
4846
39
30
47
39
4233
36
39
38
37
4532
41
39
5876
3821
70
51
59
5459
74
70
59
65
55
52
44
50
71
66
53
2835
74
59
61
50
57
44
Sm(PPM)
?.66.6
6.86.0
6.1
3.9
2.6
5.4
5.3
6.4
5.2
4.84.6
4.0
4.9
3.9
4.7
4.7
4.1
3.1
4.0
3.3
3.7
3.1
3.1
3.4
3.4
3.5
3.82.7
3.3
3.2
4.5
6.1
2.9
1.6
5.7
4.4
4.84.0
4.85.1
5.2
4.4
4.5
4.2
3.83.4
4.0
6.2
5.5
4.4
2.3
2.9
5.3
4.1
4.2
3.84.2
3.3
Eu(PPM)
1.24
1.13
1.211.04
1.06
0.720.39
1.151.18
1.120.861.030.96
0.88
0.92
0.901.05
0.87
0.72
0.60
0.80
0.65
0.84
0.65
0.62
0.74
0.59
0.81
0.65
0.450.590.58
0.78
1.10
0.600.38
1.11
0.82
0.97
0.75
0.74
0.85
1.15
0.89
0.880.680.68
0.63
0.69
1.36
1.12
0.73
0.47
0.60
0.89
0.79
0.75
0.79
0.76
0.68
Tb(ppm)
0.75
0.67
0.55
0.69
0.84
1.15
1.02
0.53
0.75
0.55
0.59
0.59
0.67
0.560.43
0.57
0.56
0.47
0.65
0.500.68
0.500.70
0.72
0.84
0.64
0.65
0.65
0.51
0.61
1.23
1.04
0.79
0.45
0.89
0.940.60
Yb(ppm)
3.83.1
3.4
3.9
2.9
1.9
2.0
3.13.4
2.9
2.6
3.0
2.3
2.92.0
3.3
2.82.81.7
2.2
2.2
2.5
2.1
1.9
1.7
1.9
1.82.7
1.81.81.9
1.82.7
1.4
0.9
2.5
2.6
2.3
2.3
2.4
2.3
2.7
2.1
2.2
2.1
1.7
2.0
2.2
2.6
3.12.2
1.5
1.7
2.4
2.1
2.5
1.9
1.7
1.9
Lu(ppm)
0.560.61
0.60
0.57
0.53
0.48
0.29
0.52
0.35
0.63
0.34
0.65
0.61
0.47
0.42
0.47
0.44
0.43
0.53
0.38
0.44
0.31
0.52
0.37
0.33
0.39
0.43
0.48
0.39
0.400.33
0.33
0.54
0.67
0.34
0.200.53
0.46
0.40
0.39
0.410.47
0.54
0.37
0.53
0.43
0.440.30
0.31
0.30
0.43
0.36
0.26
0.34
0.47
0.33
0.42
0.47
0.41
0.32
than that for Black Sea sediments (BS). This suggests a drastic variationbetween oxic (low TOC and low TS contents) and euxinic (high TOC andvery high TS contents) bottom waters in these sequences.
On the other hand, TOC (0.15%-0.96%) and TS (0.15%-1.42%)contents in Unit 2 are low and show a positive correlation except fora sample (TS = 4.24%) (Fig. 7B). This suggests diagenetic sulfatereduction under oxic bottom waters in Unit 2. In Unit 3 (Fig. 7C),there are samples showing a positive correlation between TOC andTS with TS contents of <l .6% and samples with moderate TS contents(ca. 2%). The former suggests diagenetic sulfate reduction, and thelatter euxinic bottom waters.
The TOC and TS plot in Units 4A, 4B, and 5 (Fig. 7D) may bedivided into three groups: low TOC and TS (<l .4%) contents showinga positive correlation between them, moderate TS contents of 1.4%-2.4%, and very high TS contents (>2.5%) with a very low TOCcontent (<0.5%). The former two suggest diagenetic sulfate reductionand euxinic bottom waters, respectively, similarly to those in Unit 3.Several samples with very high TS and very low TOC (<0.6%)contents in Unit 2 (Fig. 7B) and Units 4A, 4B, and 5 (Fig. 7D) suggestdifferent mechanisms of sulfur accumulation with no support of TOC.Some of these layers are those that contain angular pyrite grains witha very high δ 3 4SC D T value and will be discussed later.
709

T. MASUZAWA, J. TAKADA, R. MATSUSHITA
795 0Ba (ppm)
1000 2000
Zn (ppm) Co (ppm)100 200 300 0 10 20 30 40 50
o-
100-
200-
300-
~> 400Ha.Of
Q500H
600-
: D
D^•
r
• c
: D
: π
• α
D i D
D
• α D
hD
D
0
π
D
D
α
π
]
D3
α
D o
0
o
0
• • • - o
c
o
<
<y
0
o
?
<<>
o
3o
o
o
. o> Λ
o
o
>
o
o
o
o
<>
oc
oo
o
o
o
>
>
>
>
>
t>
>
I>
>>
[
t>
[>
>
>
>
t>
t>t>
>
>
>
>
t>
I>
>
700
Figure 4. Vertical profiles of Ba (left), Zn (middle), and Co (right) at Site 795 (lithology as in Fig. 1).
0 -
TOC (%) TS (7 ) Mn (%)795 0 1 2 3 4 5 0 1 2 3 4 5 6 7 0 0-1 0-2 0 3 04
CA
100-
200-
300-
JO~ 400-
α
500-
600-
700-
j i i
* +
+*
+ 1
*t>
•+• +
. +
<t*
-+÷ +
oo<>
Figure 5. Vertical profiles of total organic carbon (TOC; left), total sulfur (TS; middle), and Mn (right) at Site 795 (lithology as in Fig. 1). Crosses for TOC andTS are from shipboard results (Tamaki, Pisciotto, Allan, et al., 1990).
710
100-
200-
600-
700-
Sb (ppm)795 0
>: >
>
:>> 1 > t > >
12 16 0
SEDIMENT AND PYRITE GEOCHEMISTRY
U (ppm) As (ppm)A 6 8 10 0 20 40 60 80 100
i i i i i i i
h
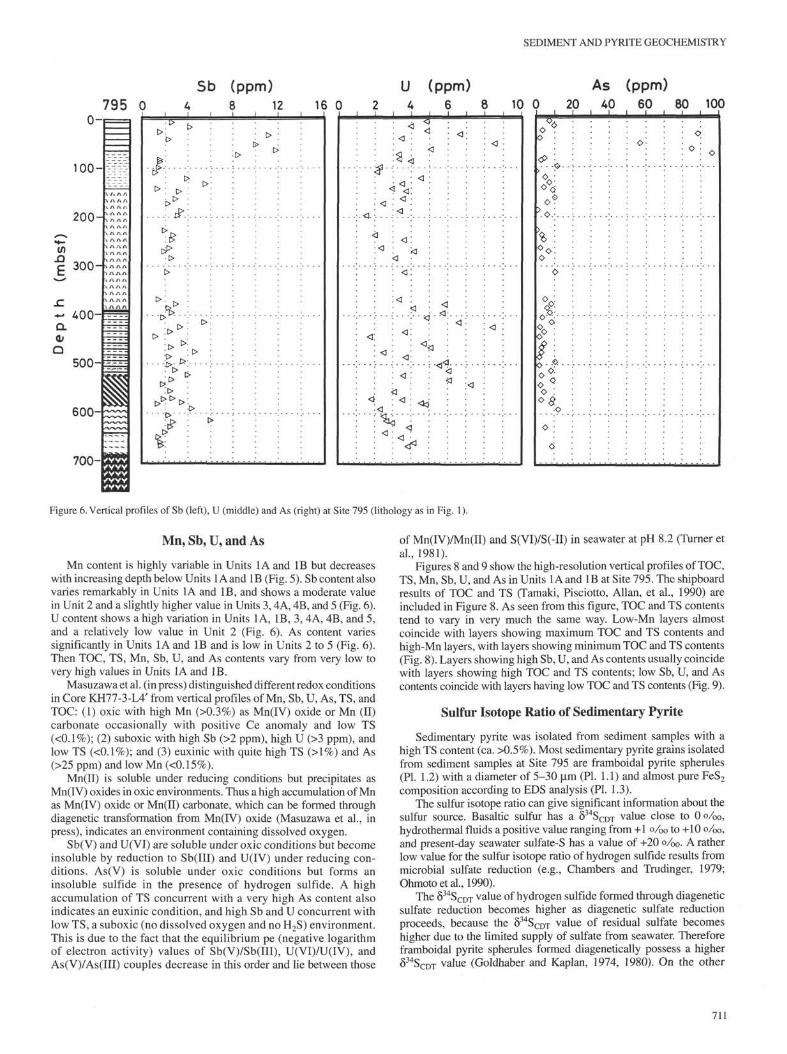
Figure 6. Vertical profiles of Sb (left), U (middle) and As (right) at Site 795 (lithology as in Fig. 1).
Mn, Sb, U, and As
Mn content is highly variable in Units 1A and IB but decreaseswith increasing depth below Units 1A and IB (Fig. 5). Sb content alsovaries remarkably in Units 1A and IB, and shows a moderate valuein Unit 2 and a slightly higher value in Units 3,4A, 4B, and 5 (Fig. 6).U content shows a high variation in Units 1A, IB, 3, 4A, 4B, and 5,and a relatively low value in Unit 2 (Fig. 6). As content variessignificantly in Units 1A and IB and is low in Units 2 to 5 (Fig. 6).Then TOC, TS, Mn, Sb, U, and As contents vary from very low tovery high values in Units 1A and IB.
Masuzawa et al. (in press) distinguished different redox conditionsin Core KH77-3-L4' from vertical profiles of Mn, Sb, U, As, TS, andTOC: (1) oxic with high Mn (>0.3%) as Mn(IV) oxide or Mn (II)carbonate occasionally with positive Ce anomaly and low TS(<0.1%); (2) suboxic with high Sb (>2 ppm), high U (>3 ppm), andlow TS (<0.1%); and (3) euxinic with quite high TS (>1%) and As(>25 ppm) and low Mn (<0.15%).
Mn(II) is soluble under reducing conditions but precipitates asMn(IV) oxides in oxic environments. Thus a high accumulation of Mnas Mn(IV) oxide or Mn(II) carbonate, which can be formed throughdiagenetic transformation from Mn(IV) oxide (Masuzawa et al., inpress), indicates an environment containing dissolved oxygen.
Sb(V) and U(VI) are soluble under oxic conditions but becomeinsoluble by reduction to Sb(III) and U(IV) under reducing con-ditions. As(V) is soluble under oxic conditions but forms aninsoluble sulfide in the presence of hydrogen sulfide. A highaccumulation of TS concurrent with a very high As content alsoindicates an euxinic condition, and high Sb and U concurrent withlow TS, a suboxic (no dissolved oxygen and no H2S) environment.This is due to the fact that the equilibrium pe (negative logarithmof electron activity) values of Sb(V)/Sb(III), U(VI)/U(IV), andAs(V)/As(III) couples decrease in this order and lie between those
of Mn(IV)/Mn(II) and S(VI)/S(-II) in seawater at pH 8.2 (Turner etal., 1981).
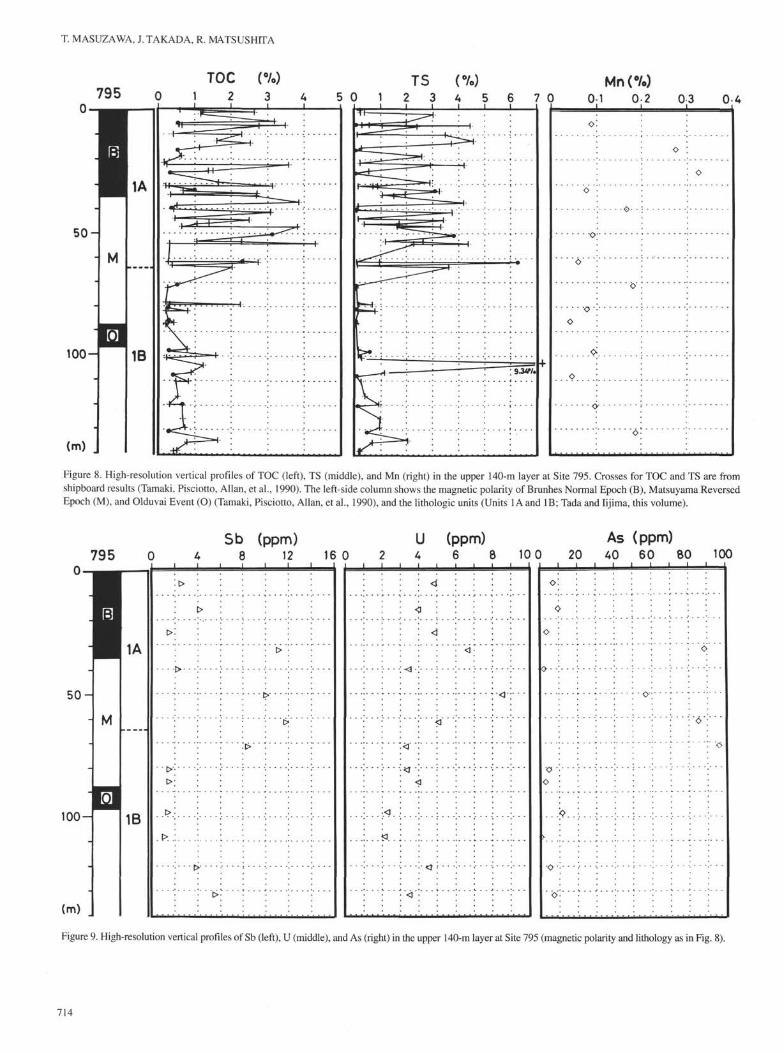
Figures 8 and 9 show the high-resolution vertical profiles of TOC,TS, Mn, Sb, U, and As in Units 1A and IB at Site 795. The shipboardresults of TOC and TS (Tamaki, Pisciotto, Allan, et al., 1990) areincluded in Figure 8. As seen from this figure, TOC and TS contentstend to vary in very much the same way. Low-Mn layers almostcoincide with layers showing maximum TOC and TS contents andhigh-Mn layers, with layers showing minimum TOC and TS contents(Fig. 8). Layers showing high Sb, U, and As contents usually coincidewith layers showing high TOC and TS contents; low Sb, U, and Ascontents coincide with layers having low TOC and TS contents (Fig. 9).
Sulfur Isotope Ratio of Sedimentary Pyrite
Sedimentary pyrite was isolated from sediment samples with ahigh TS content (ca. >0.5%). Most sedimentary pyrite grains isolatedfrom sediment samples at Site 795 are framboidal pyrite spherules(PL 1.2) with a diameter of 5-30 µm (PL 1.1) and almost pure FeS2
composition according to EDS analysis (PL 1.3).The sulfur isotope ratio can give significant information about the
sulfur source. Basaltic sulfur has a δ 3 4SC D T value close to 0 o/̂ o,hydrothermal fluids a positive value ranging from +1 o/00 to +10 o/00,and present-day seawater sulfate-S has a value of +20 o/oo. A ratherlow value for the sulfur isotope ratio of hydrogen sulfide results frommicrobial sulfate reduction (e.g., Chambers and Trudinger, 1979;Ohmoto et al., 1990).
The δ 3 4SC D T value of hydrogen sulfide formed through diageneticsulfate reduction becomes higher as diagenetic sulfate reductionproceeds, because the δ 3 4SC D T value of residual sulfate becomeshigher due to the limited supply of sulfate from seawater. Thereforeframboidal pyrite spherules formed diagenetically possess a higherδ 3 4 S C D T value (Goldhaber and Kaplan, 1974, 1980). On the other
711

T. MASUZAWA, J. TAKADA, R. MATSUSHITA
2 3 4
TOC (β/ )2 3 4
TOC (•/.)
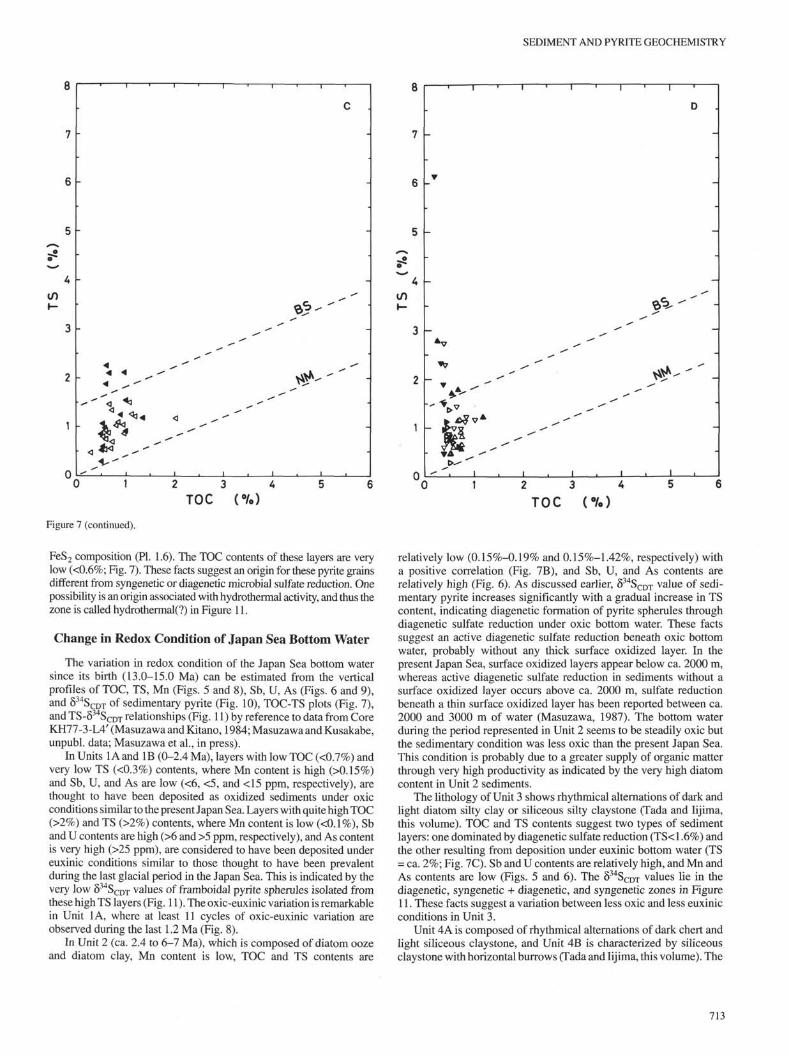
Figure 7. Plots of TS vs. TOC of sediments from Site 795. A. Units 1A ( , O) and IB ( •. D ). B. Unit 2 ( 4 , O ). C. Unit 3 ( < , < ). D. Units 4A ( • ,Δ ), 4B ( T, V) and 5 ( ^ , 0 ) . Open marks are those from shipboard results (Tamaki, Pisciotto, Allan, et al., 1990). Broken lines show idealized relationshipsfor normal marine (NM) and Black Sea (BS) sediments after Leventhal (1983).
hand, the δ 3 4 S C D T value of sulfate in euxinic bottom waters main-tains the seawater sulfate value, and δ 3 4 S C D T value of microbiallyformed hydrogen sulfide is very low, because the supply of seawatersulfate is not limited as observed in the Black Sea where it reachesvalues as low as -38.7 o/00 to -40.9 o/oo (Sweeney and Kaplan, 1980).Framboidal pyrite spherules formed under euxinic bottom watershave a quite low δ 3 4SC D T value. This is consistent with observationof Masuzawa and Kusakabe (unpubl. data), who reported that fram-boidal pyrite spherules in Core KH77-3-L4é formed under euxinicbottom waters during the last glacial period have very low δ 3 4 S C D T
values of -50 o/00 to -35 o/óo, whereas diagenetically formed fram-boidal pyrite spherules in a piston core from the central Japan Basin(KH77-3-M5) show higher values ranging from -25 o/0O to -10 o/oo.
Figure 10 illustrates the vertical profile of δ 3 4SC D T values of isolatedsedimentary pyrite at Site 795. These values range from -48.3 o/oo to+14.2 o/Oo. Figure 11 shows the relationship between TS content ofsediments and δ 3 4SC D T value of pyrite in the seven lithologic units of Site795. TS content is quite high (>2 o/oo) and δ 3 4SC D T is quite low (<-35o/oo) in Unit 1 A, indicating syngenetic formation of pyrite under euxinicbottom waters (syngenetic zone in Fig. 11). This was also reported insamples from Core KH77-3-L4' corresponding to the last glacial periodin the Japan Sea (Masuzawa and Kusakabe, unpubl. data). δ 3 4SC D T is alsovery low, with relatively low TS content (<1%) in Unit IB. In Unit 2 theδ3 4SC D T value increases significantly up to +1.6 o/oo, concurrent with agradual increase in TS content, which is less than 1.2%. This trend andthe TOC-TS correlation (Fig. 7B) are consistent with diagenetic forma-tion of pyrite through diagenetic sulfate reduction (diagenetic zone in Fig.11), where TS content has an upper limit due to the limited supply of
seawater sulfate through diffusion in pore water (Goldhaber andKaplan, 1980; Masuzawa and Kitano, 1983b). Unit 3 values aredistributed in both syngenetic and diagenetic zones. Many values ofUnits 4A and 4B and also some of Unit 3 are plotted in a regionexisting between syngenetic and diagenetic zones. This may suggestdiagenetic as well as syngenetic formation of framboidal pyrite(syngenetic + diagenetic zone in Fig. 11).
Crosses in Figure 11 illustrate data from pelagic surface sedimentsfrom the Black Sea after Vinogradov et al. (1962). δ 3 4SC D T values of thesepyrite samples range from -26 o/oo to -34 o/ (Vinogradov et al., 1962)and are higher than those of hydrogen sulfide in the overlying bottomwater of the Black Sea (-38 o/oo to-41 o/oo); Sweeney and Kaplan, 1980).These crosses are found in the syngenetic + diagenetic zone near thediagenetic zone in Figure 11. Active sulfate reduction takes place withinthe surface sediment layer of the Black Sea, and pore-water sulfate showsa higher δ 3 4SC D T value than that of the overlying bottom water (Vinogra-dov et al., 1962). Therefore pyrite-S in the Black Sea surface sedimentsis likely to be formed from both hydrogen sulfide in the overlying bottomwater (syngenetic) and through diagenetic sulfate reduction within thesurface sediments. The fact that the samples from Black Sea sediments(crosses) lie in the syngenetic + diagenetic zone supports the zoning inFigure 11 described for Site 795.
Three samples from 464.96,578.65, and 590.53 mbsf show the veryhigh δ 3 4SC D T values of+14.2 o/oo, -0.7 o/oo, and +11.5 o/oo, respectively,which are similar to those of hydrothermal sulfides; TS contents of thesesamples are also very high. Pyrite grains isolated from these sedimentsare mainly composed of large angular grains with a diameter of 30-60mm (PL 1.4) without framboidal texture (PL 1.5) and show almost pure
712
SEDIMENT AND PYRITE GEOCHEMISTRY
Figure 7 (continued).
FeS2 composition (PL 1.6). The TOC contents of these layers are verylow (<0.6%; Fig. 7). These facts suggest an origin for these pyrite grainsdifferent from syngenetic or diagenetic microbial sulfate reduction. Onepossibility is an origin associated with hydrothermal activity, and thus thezone is called hydrothermal(?) in Figure 11.
Change in Redox Condition of Japan Sea Bottom Water
The variation in redox condition of the Japan Sea bottom watersince its birth (13.0-15.0 Ma) can be estimated from the verticalprofiles of TOC, TS, Mn (Figs. 5 and 8), Sb, U, As (Figs. 6 and 9),and δ 3 4SC D T of sedimentary pyrite (Fig. 10), TOC-TS plots (Fig. 7),and TS-δ34SCDT relationships (Fig. 11) by reference to data from CoreKH77-3-L4' (Masuzawa and Kitano, 1984; Masuzawa and Kusakabe,unpubl. data; Masuzawa et al., in press).
In Units 1A and IB (0-2.4 Ma), layers with low TOC (<0.7%) andvery low TS (<0.3%) contents, where Mn content is high (>0.15%)and Sb, U, and As are low (<6, <5, and <15 ppm, respectively), arethought to have been deposited as oxidized sediments under oxicconditions similar to the present Japan Sea. Layers with quite high TOC(>2%) and TS (>2%) contents, where Mn content is low (<0.1%), Sband U contents are high (>6 and >5 ppm, respectively), and As contentis very high (>25 ppm), are considered to have been deposited undereuxinic conditions similar to those thought to have been prevalentduring the last glacial period in the Japan Sea. This is indicated by thevery low δ 3 4 S C D T values of framboidal pyrite spherules isolated fromthese high TS layers (Fig. 11). The oxic-euxinic variation is remarkablein Unit 1A, where at least 11 cycles of oxic-euxinic variation areobserved during the last 1.2 Ma (Fig. 8).
In Unit 2 (ca. 2.4 to 6-7 Ma), which is composed of diatom oozeand diatom clay, Mn content is low, TOC and TS contents are
relatively low (0.15%-0.19% and 0.15%-1.42%, respectively) witha positive correlation (Fig. 7B), and Sb, U, and As contents arerelatively high (Fig. 6). As discussed earlier, δ 3 4 S C D T value of sedi-mentary pyrite increases significantly with a gradual increase in TScontent, indicating diagenetic formation of pyrite spherules throughdiagenetic sulfate reduction under oxic bottom water. These factssuggest an active diagenetic sulfate reduction beneath oxic bottomwater, probably without any thick surface oxidized layer. In thepresent Japan Sea, surface oxidized layers appear below ca. 2000 m,whereas active diagenetic sulfate reduction in sediments without asurface oxidized layer occurs above ca. 2000 m, sulfate reductionbeneath a thin surface oxidized layer has been reported between ca.2000 and 3000 m of water (Masuzawa, 1987). The bottom waterduring the period represented in Unit 2 seems to be steadily oxic butthe sedimentary condition was less oxic than the present Japan Sea.This condition is probably due to a greater supply of organic matterthrough very high productivity as indicated by the very high diatomcontent in Unit 2 sediments.
The lithology of Unit 3 shows rhythmical alternations of dark andlight diatom silty clay or siliceous silty claystone (Tada and Iijima,this volume). TOC and TS contents suggest two types of sedimentlayers: one dominated by diagenetic sulfate reduction (TS<l .6%) andthe other resulting from deposition under euxinic bottom water (TS= ca. 2%; Fig. 7C). Sb and U contents are relatively high, and Mn andAs contents are low (Figs. 5 and 6). The δ 3 4SC D T values lie in thediagenetic, syngenetic + diagenetic, and syngenetic zones in Figure11. These facts suggest a variation between less oxic and less euxinicconditions in Unit 3.
Unit 4A is composed of rhythmical alternations of dark chert andlight siliceous claystone, and Unit 4B is characterized by siliceousclaystone with horizontal burrows (Tada and Iijima, this volume). The
713
T. MASUZAWA, J. TAKADA, R. MATSUSHITA
795TOC (•/.) TS (%) Mn (7 )
5 0 1 2 3 A 5 6 7 0 01 0-2 03 0 4
Figure 8. High-resolution vertical profiles of TOC (left), TS (middle), and Mn (right) in the upper 140-m layer at Site 795. Crosses for TOC and TS are fromshipboard results (Tamaki, Pisciotto, Allan, et al., 1990). The left-side column shows the magnetic polarity of Brunhes Normal Epoch (B), Matsuyama ReversedEpoch (M), and Olduvai Event (O) (Tamaki, Pisciotto, Allan, et al., 1990), and the lithologic units (Units 1A and IB; Tada and Iijima, this volume).
Sb (ppm) U (ppm) As (ppm)795 0 A 8 12 16 0 2 A 6 8 10 0 20 A0 60 80 100
U —
5 0 -
-
-
100-
-
-
(m) .
M
π
1A>
>t>
>
. f>
t>
> - •
• • fc
>
t>
•••t
>
t>
>• - - •
t>
<
i
•<3 •
<
<r •
<
<d
<J
<
<
•<j
o : : : : : : : :
o• o
> - • : - - • : - - • : - - • : • - : • • • • : • • : - • - : • • - . - - •
o
• -.- .-• <> •
• • • • • — • ' • • • • • < >
o • • • • • • • • • • • " •• • • • • • • " • " ' " • '
o
o
. o . . . . . . . . . . . . . . . . . . . . . . . . • . . . • . •. • - . - •
o
Figure 9. High-resolution vertical profiles of Sb (left), U (middle), and As (right) in the upper 140-m layer at Site 795 (magnetic polarity and lithology as in Fig. 8).
714

SEDIMENT AND PYRITE GEOCHEMISTRY
83%DJ (‰)795 -50 -40 -30 -20 -10 0 *10 *20
l/)
0 -
100-
200-
300-
.c- 400-Q.
Q500H
600-
<
<
<. . . <
<
<<
<<
<
<<<
<
<
<<
<<
<
<
<
<
<<
<<
J • • • •
< <
o<
3
<
<
<
<
<
700-
Figure 10. Vertical profile of δ 3 4 S C D T of sedimentary pyrite iso-lated from sediments at Site 795 (lithology as in Fig. 1).
variations of TOC, TS, Mn, Sb, U, and As contents in Units 4A and4B are similar to those in Unit 3 except for a few layers with very highTS (>2.5%) and very low TOC (<0.5%) contents (Figs. 5, 6, and 7).Layers showing very high TOC, TS, and As contents and with lowMn content, or layers having very low TOC, TS, and As contents andwith high Mn content were not observed among the samples analyzedhere. Many δ 3 4 S C D T values of pyrite in Units 4A and 4B are distributedin the syngenetic + diagenetic zone in Figure 11 with relatively lowTS content. These facts suggest that redox conditions in Units 4A and4B were similar to those in Unit 3, i.e., a variation between less oxicand less euxinic conditions.
Unit 5 is described as claystone with faint laminations and hori-zontal burrows (Tada and Iljima, this volume). The variations of TOC,TS, Mn, Sb, U, and As contents and that of δ 3 4 S C D T value of pyriteare also similar to those in Units 3, 4A, and 4B (Figs. 5, 6, 7, 10, and11). These facts also suggest that the redox conditions in Unit 5 weresimilar to those of Units 3, 4A, and 4B.
Layers of relatively high TS and very low TOC contents werefound in Units 2, 3,4A, and 4B. Some of them contain large, angularpyrite grains without framboidal texture and a very high δ 3 4 S C D T
value. These facts may suggest a hydrothermal origin. More detailedstudies, however, will be needed to confirm possible hydrothermalactivity in these layers.
SUMMARY
The changes in the redox conditions of the bottom water in theJapan Sea since its birth were estimated from vertical variations ofredox-sensitive elements (TOC, TS, Mn, Sb, U, and As) and the sulfurisotope ratio of isolated sedimentary pyrite of 60 sediment samples
*30r
»10-
o -
-10
II
-20
-30h
-40
-50
-60,
IIII1
o,
a> O ,σ> I
- 1-o \ *
Λ 1
1
Hydrothermal ?
A
k
k Syngenetic* Diagenetic
" #Syngenetic
T
•
1 i
TS (%)
Figure 11. Relationship between TS of sediments and δ 3 4 S C D T of sedimentary
pyrite in seven lithologic units at Site 795: Units 1A ( ) and IB (• ), Unit
2 ( O ), Unit 3 ( < ), Units 4A (A) and 4B ( T ), and Unit 5 (>•). Crosses are
data from pelagic surface sediments of the Black Sea (Vinogradov et al., 1962).
collected every 10 m from Site 795. The estimated changes in theredox conditions of the Japan Sea bottom water are as follows: avariation between less oxic and less euxinic in Units 5, 4B, 4A, and3 (ca. 13-15 to 6-7 Ma); oxic but less so than that of the present JapanSea with diagenetic sulfate reduction under high biological produc-tivity in Unit 2 (ca. 7-6 to 2.4 Ma); and a drastic variation betweenoxic, similar to the present Japan Sea bottom water, and euxinic,similar to that during the last glacial period, in Units IB (ca. 2.4-1.2Ma) and 1A (ca. 1.2 Ma to the present), especially in Unit 1A. Thegradual increase in Mn content with time suggests the accumulationof manganese in deep-sea sediments of the Japan Sea throughout itsgeologic history.
The results reported here are thought to represent a general pictureof the environmental changes taking place in the Japan Sea since itsbirth, although the results are based on only 60 sediment samplescollected every 10 m. The environmental changes of the sea have beenvery rapid and drastic as observed in Units 1A and IB (e.g., Fig. 8)and in Core KH77-3-L4'. Further studies on high-resolution samplesfrom Site 795 are needed to determine in more detail the environ-mental changes throughout the geologic history of the Japan Sea.
ACKNOWLEDGMENTS
We thank H. Chiba and T. Nogi of Okayama University for theirassistance with the sulfur isotope measurement. We are indebted toProf. Y. Kitano of Sugiyama Jogakuen University for his criticalreview of the manuscript. We have benefited from helpful reviewsand comments by M. Goldhaber, an anonymous reviewer, and theeditor. We are grateful to M. Kusakabe of Okayama University for hisencouragement and suggestions throughout the course of this work.Parts of this work were performed using the facilities of ResearchReactor Institute, Kyoto University (INNA) and Institute for Study ofEarth's Interior, Okayama University (sulfur isotope measurement).
715

T. MASUZAWA, J.TAKADA, R. MATSUSHITA
REFERENCES
Arai, F., Oba, T, Kitazato, H., Horibe, Y., and Machida, H., 1981. LateQuaternary tephrochronology and paleo-oceanography of the sedimentsof the Japan Sea. Quat. Res. (Tokyo), 20:209-230.
Brumsack, H.-J., 1980. Geochemistry of Cretaceous black shales fromthe Atlantic Ocean (DSDP Legs 11, 14, 36 and 41). Chem. GeoL,31:1-25.
Chambers, L. A., and Trudinger, P. A., 1979. Microbiological fractionationof stable sulfur isotopes: a review and critique. Geomicrobiol. J.,1:249-293.
Cita, M. B., and Grignani, D., 1982. Nature and origin of Late NeogeneMediterranean sapropels. In Schlanger, S. O., and Cita, M. B. (Eds.),Nature and Origin of Cretaceous Carbon-rich Fades: London (AcademicPress), 165-196.
Goldhaber, M. B., and Kaplan, I. R., 1974. The sulfur cycle. In Goldberg,E. D. (Ed.), The Sea (Vol. 5): New York (Wiley), 569-655.
, 1980. Mechanisms of sulfur incorporation and isotope fractiona-tion during early diagenesis in sediments of the Gulf of California. Mar.Chem., 9:95-143.
Kojima, I., Uchida, T., and Iida, C, 1988. Pressurized microwave digestion ofbiological samples for metal determination. Anal. Sci., 4:211-214.
Koyama, M., Matsushita, R., and Takada, J., 1987. Reactor neutron activationanalysis by using multi-elemental comparators: problems of nuclear con-stants of l281,175Yb and several other nuclides. /. Radioanal. Nucl. Chem.,Articles, 113:199-207.
Leventhal, J. S., 1983. An interpretation of carbon and sulfur relationships in2Black Sea sediments as indicators of environments of deposition. Geo-chim. Cosmochim. Acta, 47:133-137.
Masuzawa, T, 1987. Early diagenesis in deep-sea sediments of the Japan Sea:type, controlling factor, and diffusive flux. /. Earth Sci., Nagoya Univ.,35:249-267.
Masuzawa, T., and Kitano, Y., 1983a. Interstitial water chemistry in deep-seasediments from the Japan Sea. J. Oceanogr. Soc. Jpn., 39:171-184.
, 1983b. Sulfate reduction and sulfide deposition in deep-sea sedi-ments from the southwestern Japan Sea. J. Oceanogr. Soc. Jpn., 39:251-258.
-, 1984. Appearance of H2S-bearing bottom waters during the lastglacial period in the Japan Sea. Geochem. J., 18:167-172.
Masuzawa, T, and Koyama, M., 1989. Settling particles with positive Ceanomalies from the Japan Sea. Geophys. Res. Lett.. 16:503-506.
Masuzawa, T, Noriki, S., Kurosaki, T, Tsunogai, S., and Koyama, M., 1989.Compositional change of settling particles with water depth in the JapanSea. Mar. Chem., 27:61-78.
Masuzawa, T., Takamatsu, T, Kawashima, M., and Koyama, M., in press.Environmental change through the last glacial period in the Japan Sea andtrace element composition of sediment cores. Tech. Rep. Res. React. Inst.,Kyoto Univ.
Nitani, H., 1972. On the deep and bottom waters in the Japan Sea. In Researchin Hydrography and Oceanography: Tokyo (Hydrographic Dept, of Ja-pan), 151-201.
Oba, T., Kato, M., Kitazato, H., Koizumi, I., Omura, A., Sakai, T., andTakayama, T., 1991. Paleoenvironmental changes in the Japan Sea duringthe last 85,000 years. Paleoceanogr., 6:499-518.
Ohmoto, H., Kaiser, C. J., and Geer, K. A., 1990. Systematics of sulphurisotopes in recent marine sediments and ancient sediment-hosted base-metal deposits. In Heebert, H. K., and Ho, S. E. (Eds.), Stable Isotopes andFluid Processes in Mineralization. Geol. Soc. Aust., Spec. Publ., 23:70-120.
Raiswell, R., and Berner, R. A., 1985. Pyrite formation in euxinic and semi-euxinic sediments. Am. J. Sci., 285:710-724.
Sweeney, R. E., and Kaplan, I. R., 1980. Stable isotope composition ofdissolved sulfate and hydrogen sulfide in the Black Sea. Mar. Chem.,9:145-152.
Takamatsu, T, and Kawashima, M., 1988. Chemical speciation of sulfur inlake sediments. Abstr. 49th Meeting Jpn. Soc. Anal. Chem., 507-508.
Tamaki, K., Pisciotto, K., Allan, J., et. al., 1990. Proc. ODP, Init. Repts., 127:College Station, TX (Ocean Drilling Program).
Turner, D. R., Whitfield, M., and Dickson, A. G., 1981. The equilibriumspeciation of dissolved components in freshwater and seawater at 25 °Cand 1 atmosphere. Geochim. Cosmochim. Acta, 45:855-881.
Vinogradov, A. P., Grinenko, V. A., and Ustinov, V. I., 1962. Isotopic compo-sition of sulfur compounds in the Black Sea. Geochemistry, 10:973-997.
Yanagisawa, F., and Sakai, H., 1983. Thermal decomposition of bariumsulfate-vanadium pentoxide-süica glass mixtures for preparation of sulfurdioxide in sulfur isotope ratio measurements. Anal. Chem., 55:985-987.
Date of initial receipt: 3 April 1991Date of acceptance: 28 November 1991Ms 127/128B-179
716

SEDIMENT AND PYRITE GEOCHEMISTRY
2 9 — APR — 90 1 1 =48:09 EDftX READYRATE- 2CPS TIME-FS- 3288CNT PRST— 100CSECA —ODP 79B-07 Pyrite
29—APR—90 11=53 5 26RATE— 1 CRSFS— 22B6CNTA — O D P 7 9 S - 52 P y •~ i t
EDAX READYTIME— 90LSECPRST— 100CSEC
8.0(3
!0eV/ch A E D A X A- 1 C N T
4.00 6.0G5 . 0 0KEU
8.00
!0eV/ch A
Plate 1. Photomicrographs (scale bar = 50 µm), SEM images, and EDS spectra of framboidal pyrite spherules isolated from a layer at 61.69 mbsf (1-3; δ 3 4 S C D T
= -48.3 o/oo) and angular pyrite grains isolated from a layer at 590.53 mbsf (4-6; δ 3 4 S C D T = +11.5 o/< ) of Site 795.
717