401(k) plans in living colork) plans in living color a study of 401(k) savings disparities across...
TRANSCRIPT

401(k) Plans in Living ColorA Study of 401(k) Savings Disparities Across Racial and Ethnic Groups
The Ariel/Aon Hewitt Study 2012
EDUCATION INITIATIVE

The Ariel/Aon hewiT T STudy
1 Source: u.S. Census Bureau, Statistical Abstract of the united States: 2012, Table 622 “unemployed
workers—Summary: 1990–2010. ” in comparison, white unemployment rates rose from 4.1% to 8.7%
over the same time period.
The Ariel/Aon hewiT T STudy
About This StudyIn 2009, 401(k) Plans in Living Color—the landmark study examining defined contribution plan use by race—found that retirement savings vary significantly by race and ethnicity, with African-Americans and Hispanics lagging in retirement savings, compared to whites and Asian-Americans. In 2012, we continue our investigation into disparities in defined contribution plan savings by race with the publication of the second wave of the study. This year we dig deeper into the “hows” and “whys” of the findings, analyzing millions of new pieces of data in addition to directly surveying more than 19,000 employees.
In the context of the economy of the last several years, this year’s findings are significant and timely. The first study examined data from year-end 2007. While the seeds of the financial downturn had already taken root, the recession had not begun, and the impact on millions of people’s lives had not yet been felt. This study examines data from the end of 2010. The three intervening years brought many economic challenges to the country, employers, and individuals. Over that time period, the S&P 500 Index tumbled to a net decline of 2.86% and the unemployment rate surged from 5.8% to 9.6%. People of color were hit particularly hard by job loss: the 2010 unemployment rate for African-Americans was 16% (up from 10.1% in 2007), and the rate for Hispanics rose to 12.5% (up from 7.6% in 2007).1
This economic climate has challenged retirement savings plans like never before. Defined contribution plans have become an important cornerstone of retirement income for millions of Americans. In comparison to other retirement funding vehicles, these plans have boomed. At their core, 401(k) plans are formulated by the government to be a partnership between employers and employees that, when implemented and executed properly, can pave the way for workers’ financial security in retirement.
Yet the economic demands placed on both businesses and individuals over the last several years has created a stress-test of sorts for defined contribution plans. What happens to this partnership when both parties hit a rough patch?
When taking stock of where the partnership can be strengthened, the focus is sharpened by looking through the lens of race. We know from our previous study, 401(k) Plans in Living Color, that there is a gap in account balances among racial and ethnic groups, with African-Americans and Hispanics having significantly lower balances than their white and Asian-American counterparts. The factors that account for this gap need to be better addressed to ensure all Americans have a secure retirement. The steps taken to reduce this gap will help retirement savings
1

plans get closer to realizing their promise for each and every working American.
This study was conducted by Ariel Education Initiative, the nonprofit affiliate of Ariel Investments, and Aon Hewitt, along with the Joint Center for Political and Economic Studies and The Raben Group. The findings are based on year-end 2010 information from 60 of the largest U.S. organizations across a variety of industries and sectors. The data, collected and analyzed by Aon Hewitt, represent 2.4 million employees and include race, ethnicity, gender, salary, age, job tenure, 401(k) and 403(b) balances, and other account information.
A companion study to this year’s report delves more broadly and deeply into the topic of defined contribution plans and race through an employee survey that collected demographic data and gathered opinions on retirement, savings behaviors and vehicles, financial literacy, and how employers could help in saving for retirement. Over 19,000 employees at three large organizations completed our questionnaire, and the findings offer more intelligence, which can be used to provide additional insight into the hard numbers at the core of this study. Full findings of the employee survey will be published later in 2012.
The ultimate goal of the key findings and recommendations outlined in this study is to enable all workers to adequately prepare for retirement. These recommendations solely represent the views of the project collaborators and do not reflect the views or opinions of the corporations that participated in this research by generously sharing their data.
Executive Summary This year’s study confirms that a racial and ethnic gap in retirement savings account usage persists, continuing to put large groups of employees at increased financial risk for their retirement years. Our findings also suggest two courses of action to address this gap head-on and immediately: implementing policies and practices to reduce the withdrawal of funds prior to retirement; and designing plans to magnify the positive impact of auto-enrollment on defined contribution plan use. Both of these courses of action will not only help close the retirement savings gap among racial and ethnic groups, but they will also help all Americans, no matter what their race or ethnicity, build a sounder financial footing for retirement.
The 2007 Ariel/Aon Hewitt Study found that in each of the four essential areas of building account balances—establishing an account, contributing funds, allocating money appropriately, and preserving account balances by refraining from borrowing or prematurely withdrawing—disparities exist by race and ethnicity. The cumulative effect of these disparities was that African-Americans and Hispanics have significantly lower average account balances in their 401(k)
The Ariel/Aon hewiT T STudy2
and 403(b) plans than do whites and Asian-Americans, and are thus less prepared for retirement.
This year’s study shows that in most of these key areas of saving for retirement, there are still significant gaps among those of different racial and ethnic backgrounds, even when comparing groups in similar income and age brackets.
The economic downturn has led many workers, particularly African-American and Hispanic employees, to use their retirement savings to help alleviate short-term financial stress. Loans from defined contribu-tion plans are up among all workers, but sharply among African-Amer-ican and Hispanic employees. Unemployment, more widespread among workers of color, is especially devastating to retirement accounts: incredibly, about 6 in 10 African-Americans and Hispanics who leave their jobs because of layoffs or other reasons cash out their retirement savings plans entirely, compared to under 4 in 10 of whites and Asian-Americans. While part of the attraction of these assets for many people is their relative liquidity, these plans were not meant to function as a life boat for large swaths of workers during periods of national economic hardship.
This phenomenon presents an opportunity for government to make modifications in 401(k) and 403(b) regulations that would help workers weather current storms without sacrificing their financial future. Our recommendations include specific ideas for policy adjustments that would do just this.
We have, however, seen a positive trend that has offset some of the challenges of the last several years: the widespread implementation of automatic enrollment. A growing number of large employers now require new employees to opt out of defined contribution plan participation rather than calling for them to enroll in the plan when they begin their new jobs. As a result, plan participation rates (enrollment rates) are significantly higher across the board among those who began employment at a company after its implementation of auto-enrollment.
The most dramatic increases in enrollment rates are among younger, lower-paid employees, and the racial gap in participation rates is nearly eliminated among employees subject to auto-enrollment. An opportunity exists to build upon this success and to expand the concept behind auto-enrollment into other areas of account balance building, such as higher initial default rates and contribution escalation over time. Because the findings show that auto-enrollment has had the unintended consequence of lowering the average rate at which em-ployees invest in their defined contribution plans, considering options for adjust-ing the initial enrollment default rate, at a minimum, is absolutely critical. Specific guidance for plan design are included in our recommendations section.
The Ariel/Aon hewiT T STudy3

Detailed Findings
A number of factors affect how much money employees have in their defined contribution plan accounts. First, have they even started saving? How much do they contribute every month? Are their contributions high enough to generate the full company match? How have they chosen to invest the money? Are they withdrawing it prior to retirement? These and many other variables all play off each other, with some decisions, for better or worse, magnifying others. At the end of the day, they all boil down to one crucial number: the amount of money in the account.
African-Americans and Hispanics, on average, have significantly less money in their retirement accounts than do whites and Asian-Americans2 (see Table 1). Within the salary bracket capturing the median income of Americans—$30,000 to $59,999—African-Americans had, at the end of 2010, accumulated about $24,500 in defined contribution plan savings. Hispanics in the same salary bracket had accumulated about $28,000. Both whites and Asian-Americans, however, were able to save substantially more: over $42,000.
table 1: average retirement account balance, by Salary
In this year’s findings, we are turning our focus to two of the many variables that make up retirement savings plan account balances. These are the two areas where we see the most immediate potential for narrowing the racial and ethnic
The Ariel/Aon hewiT T STudy4
2 An exception to this rule is in higher salary brackets, where Asian-Americans also appear to fall be-
hind. At these levels, however, African-Americans and hispanics have, on average, a four to six year
longer tenure than Asian-Americans, and thus a considerable head start. in lower income brackets,
all four groups have very similar average tenures.
salaryafrican- american
asian- american
hispanic white
2007 2010 2007 2010 2007 2010 2007 2010
$0– $29,999
$7,518 $7,557 $12,380 $16,186 $7,930 $8,949 $13,836 $14,563
$30,000–$59,999
$28,169 $24,505 $38,848 $42,062 $28,727 $27,823 $44,546 $42,720
$60,000–$89,999
$71,630 $68,343 $84,006 $85,528 $77,991 $76,031 $101,535 $98,290
$90,000–$119,999
$122,208 $132,222 $125,077 $131,973 $125,520 $138,274 $164,897 $182,061
$120,000+ $173,490 $201,585 $177,355 $181,846 $167,781 $206,007 $243,115 $285,341

gap, and increasing account balances across the board. The first area of focus is auto-enrollment: how this mechanism has already helped employees invest for their futures, where it has fallen short, and how it can be leveraged to strengthen the 401(k) value proposition to employees. The second area of focus is defined contribution account “leakage”—loans, hardship withdrawals, and cash-outs—and how to curtail these actions, which can easily undo years of effort in one fell swoop.
Making It Out of the Starting Gate
In order to examine the benefits (and unexpected pitfalls) of auto-enrollment, let’s first take a few steps back and look at the big picture of establishing a retirement savings account. This is the first step in building a secure retirement, but making it out of the starting gate is not necessarily easy. Voluntarily subtracting money from each paycheck naturally gives some employees pause, especially those at the beginning of their careers and at the lower end of the pay scale.
As with so many of the variables surrounding investing, we find that there is a racial gap from the get-go. African-Americans and Hispanics are less likely than whites and Asian-Americans to open a defined contribution account. In 2007, we found that only about two-thirds of all African-American and Hispanic employees participated in a retirement savings plan, compared to over three-quarters of white and Asian-American employees. Even when adjusting for factors such as salary, job tenure, and age, African-American and Hispanic employees were significantly less likely to have established a 401(k) or 403(b) plan.
The employee survey found that when asked directly about saving for retirement, 36% of African-American employees and 38% of Hispanic employees (compared to 24% of whites and 21% of Asian-Americans) agree that they “have other financial priorities and do not save for retirement.”
Our latest data show, however, that despite economic challenges, the period from 2007 to 2010 saw slight increases in participation rates across all groups (see Tables 2A and 2B on the next page).
The Ariel/Aon hewiT T STudy5
Still lagging behind
Across all income levels,
African-Americans and
hispanics have considerably
less retirement savings
accumulated as compared to
whites and Asian-Americans.
For example, for those
earning $30,000–$59,000,
Blacks have 43% less saved
than their white counterparts
(hispanics have 35% less).
salaryafrican- american
asian- american
hispanic white
2007 2010 2007 2010 2007 2010 2007 2010
$0– $29,999
$7,518 $7,557 $12,380 $16,186 $7,930 $8,949 $13,836 $14,563
$30,000–$59,999
$28,169 $24,505 $38,848 $42,062 $28,727 $27,823 $44,546 $42,720
$60,000–$89,999
$71,630 $68,343 $84,006 $85,528 $77,991 $76,031 $101,535 $98,290
$90,000–$119,999
$122,208 $132,222 $125,077 $131,973 $125,520 $138,274 $164,897 $182,061
$120,000+ $173,490 $201,585 $177,355 $181,846 $167,781 $206,007 $243,115 $285,341

The Ariel/Aon hewiT T STudy6
yearafrican- american
asian- american
hispanic white
2007 66% 76% 65% 77%
2010 68% 80% 66% 79%
salaryafrican- american
asian- american
hispanic white
<$30,000 55.6% 62.0% 51.4% 61.7%
$30,000–$59,999 75.1% 81.4% 74.5% 81.3%
$60,000–$89,999 85.1% 91.6% 85.2% 89.6%
$90,000–$119,999 88.7% 93.7% 89.7% 92.7%
$120,000+ 89.3% 93.5% 90.9% 93.3%
table 2a: Plan ParticiPation rateS, yearly comPariSon
table 2b: Plan ParticiPation rateS for 2010, by Salary
By digging deeper into the data we discovered that these increases in participation are due to the growing use of auto-enrollment by companies. The basic idea behind auto-enrollment is that within the employee/employer partnership, the employer can function as the catalyst that spurs the employee to engage in productive retirement savings behaviors. Auto-enrollment allows plan sponsors to jump-start the process by establishing a defined contribution account on behalf of each new worker and by starting their savings with the very first paycheck. Employees are able to opt out of participation at any time if they so choose.
In 2007, 58% of the employers included in our research had recently implemented auto-enrollment, and one of our recommendations at the conclusion of that study was for firms to establish auto-enrollment if they had not already. In our latest data set, 67% of employers utilize auto-enrollment, and almost a quarter (23%) of the 2.4 million employees included in the research were relatively new hires subject to auto-enrollment at these organizations.
The difference in defined contribution participation is dramatic when you compare those who are subject to auto-enrollment to those who are not (see Table 3). This strong positive impact is felt across all four racial and ethnic groups and within all salary brackets.

The Ariel/Aon hewiT T STudy7
table 3: auto enrollment Plan ParticiPation rateS
The most remarkable increases in rates of participation when employ-ees are subject to auto-enrollment are in lower salary brackets (see Table 4). These are employees who may be at the beginning of their careers and have most to gain by starting to save early.
table 4: auto enrollment Plan ParticiPation rateS, lower Salary bracket
Most employees are comfortable with the concept of auto-enrollment, which we can see both by their behavior as well as by their survey responses. When asked what they would do if their employer auto-enrolled them in a retirement plan (or increased a low contribution rate) with the option to opt out, between 15% and 20% of employees across the four racial and ethnic groups said they would opt out without trying it. When asked how they felt about the idea, only a fraction of employees expressed concern, with whites expressing somewhat higher concern than the other three groups (see Table 5).
table 5: feelingS about auto-enrollment/increaSed contribution rate
enrollment typeafrican- american
asian- american
hispanic white
SuBjeCT To AuTo-enrollmenT 82% 89% 83% 85%
noT SuBjeCT To AuTo-enrollmenT 64% 78% 59% 77%
enrollment typeafrican- american
asian- american
hispanic white
SuBjeCT To AuTo-enrollmenT 79% 83% 80% 80%
noT SuBjeCT To AuTo-enrollmenT 45% 56% 41% 50%
response typeafrican- american
asian- american
hispanic white
AppreCiATe eFForT/would noT CAre/don’T know 67% 77% 75% 61%
would noT like iT 33% 23% 25% 39%
The Ariel/Aon hewiT T STudy8
Auto-enrollment looks to be a winning proposition: it helps employees across the board jump-start the process of preparing for a comfortable retirement and it helps level the playing field between different racial and ethnic groups.
The success we see in auto-enrollment increasing employee retirement savings plan participation leads to two questions: First, can this idea of employer-as-catalyst be extended into other areas of building retirement account balances? And second, could auto-enrollment lead to any unintended negative consequences? The answers to these questions are “yes” and “yes.” We address them together in the following discussion of plan contributions.
Contributing to the Nest Egg
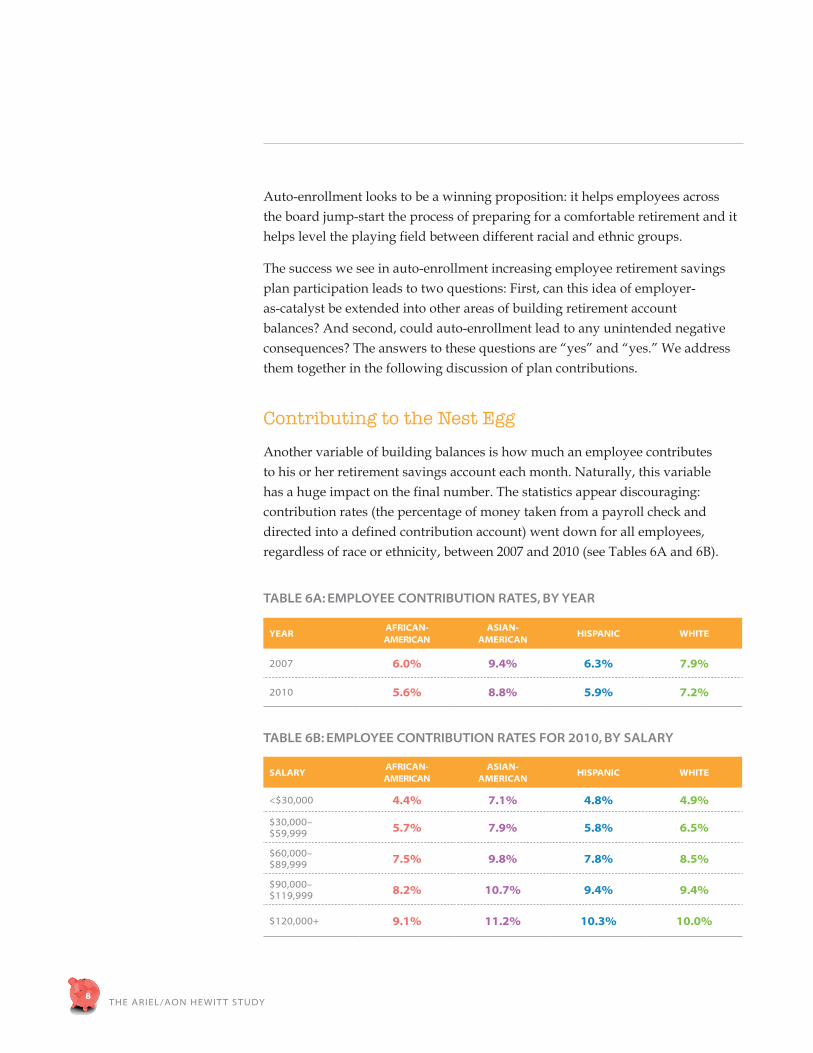
Another variable of building balances is how much an employee contributes to his or her retirement savings account each month. Naturally, this variable has a huge impact on the final number. The statistics appear discouraging: contribution rates (the percentage of money taken from a payroll check and directed into a defined contribution account) went down for all employees, regardless of race or ethnicity, between 2007 and 2010 (see Tables 6A and 6B).
table 6a: emPloyee contribution rateS, by year
table 6b: emPloyee contribution rateS for 2010, by Salary
yearafrican- american
asian- american
hispanic white
2007 6.0% 9.4% 6.3% 7.9%
2010 5.6% 8.8% 5.9% 7.2%
salaryafrican- american
asian- american
hispanic white
<$30,000 4.4% 7.1% 4.8% 4.9%
$30,000–$59,999 5.7% 7.9% 5.8% 6.5%
$60,000–$89,999 7.5% 9.8% 7.8% 8.5%
$90,000–$119,999 8.2% 10.7% 9.4% 9.4%
$120,000+ 9.1% 11.2% 10.3% 10.0%

The Ariel/Aon hewiT T STudy9
Of the employees surveyed, only 15% of African-Americans, 21% of Hispanics, 25% of whites, and 39% of Asian-Americans said they are saving as much or more than they need for retirement. Overall, about two-thirds of African-Americans and Hispanics, half of whites, and less than half of Asian-Americans say they simply do not have enough money to save adequately for retirement, with over 80% of all groups citing day-to-day expenses as the primary reason.
There is recognition among employees, then, that they are not doing what they should to prepare for retirement, yet they feel they are in a bind: because they are focused on day-to-day expenses, saving for retirement necessarily takes a back burner.
Digging deeper into the data, however, we see that the economic stress of the last several years is not necessarily the cause of the decline in contribution rates. Instead, the data shows that the influx of people who have been auto-en-rolled in defined contribution plans has driven the average down, due to their considerably lower contribution rates (See Table 7).
table 7: emPloyee contribution rateS, by enrollment tyPe
Here, then, is the unintended negative consequence of auto-enrollment: employees who were auto-enrolled have lower contribution rates than those who proactively signed up for a 401(k) or 403(b) plan. While auto-enrollment is very effective at reaching employees, particularly African-Americans and Hispanics, who are less proactive about saving for retirement, it is not enough in and of itself to ensure that these employees will be prepared for retire-ment. Auto-enrollment must be paired with higher contribution rates.
Employers tend to set a very low default contribution rate for their employees: half of the plans in our study with auto-enrollment default workers at contribution rates between 1% and 3% of pay. About a quarter more auto-enroll at 4% or 5%, and only the remaining 23% of employers default at contribution rates of 6% or more. Furthermore, only 42% of these employers auto-escalate savings over time, meaning that employee contribution rates remain at these low levels set at initial enrollment potentially forever, unless adjusted by the employee.
enrollment typeafrican- american
asian- american
hispanic white
pArTiCipAnTS SuBjeCT To AuTo-enrollmenT 4.3% 7.3% 4.4% 5.2%
pArTiCipAnTS noT SuBjeCT To AuTo-enrollmenT 6.3% 9.4% 6.6% 8.0%

10The Ariel/Aon hewiT T STudy
Whether due to insufficient information, passivity, or a natural result of the process of auto-enrollment, many participants fail to increase their default rate to the level that is seen among participants who actively signed up for a defined contribution account. As a result, although auto-enrollment is creating a whole new group of 401(k) and 403(b) participants, it is causing many participants—even some of those who would have enrolled on their own—to contribute at artificially low rates. Over time, these differences can impact account balances significantly: employees retiring after 35 years of contributing at 3% would likely see a nest egg only about a third as large as they would have had they been auto-escalated to 12% early on in their career.3
Some employers might rationalize establishing a low default contribution rate with the argument that if these rates were set any higher, more employees would opt out of the defined contribution account altogether. The data, however, do not bear this reasoning out: the nine plan sponsors in our study that auto-enrolled participants at contribution rates of 6% or more see participation levels hovering around 90% across all races and ethnicities.
Auto-enrollment effectively reframed the issue of establishing a defined contribution account by requiring employees to opt out instead of opt in to save for retirement. We believe it is feasible for employers to similarly reframe the issue of contribution rates by setting default rates higher at the outset, and by auto-escalating contribution rates over time. Employers can thus extend their role as a catalyst for positive retirement savings behaviors among their employees. By taking a more aggressive approach to contribution rates, employers will help rather than inadvertently hamper African-American, Hispanic, and any other groups of underprepared employees to build a secure retirement.
Keeping the Piggy Bank Intact
While auto-enrollment can be viewed, overall, as a step forward for the health of retirement savings, the financial crisis and resulting unemployment between year-end 2007 and 2010 caused many employees to take major steps backward in managing their own accounts.
There are three main ways participants can deplete their retirement savings accounts before retirement: taking hardship withdrawals; taking out loans; and cashing out accounts upon terminating a job. Historically, African-Americans,
the Power of automation
Automatic enrollment was
equally effective regardless
of the initial saving rate
default—participation rates
were robust when employees
were defaulted at 3% of
pay or 6% of pay, further
illustrating the power and
potential of automation.
3 This analysis is based on the following assumptions: a 7% rate of return; a match formula of $0.50 for
$1.00 up to 6% of pay; a beginning salary of $40,000; salary growth of 2.5% annually; and a begin-
ning balance of $2,500.
The Ariel/Aon hewiT T STudy11
and to a lesser extent Hispanics, have disproportionally eroded their account balances—or eliminated their accounts altogether—through all three of these methods. In the last several years, the problem has grown only worse. Let’s begin by looking at hardship withdrawals.
Hardship withdrawals
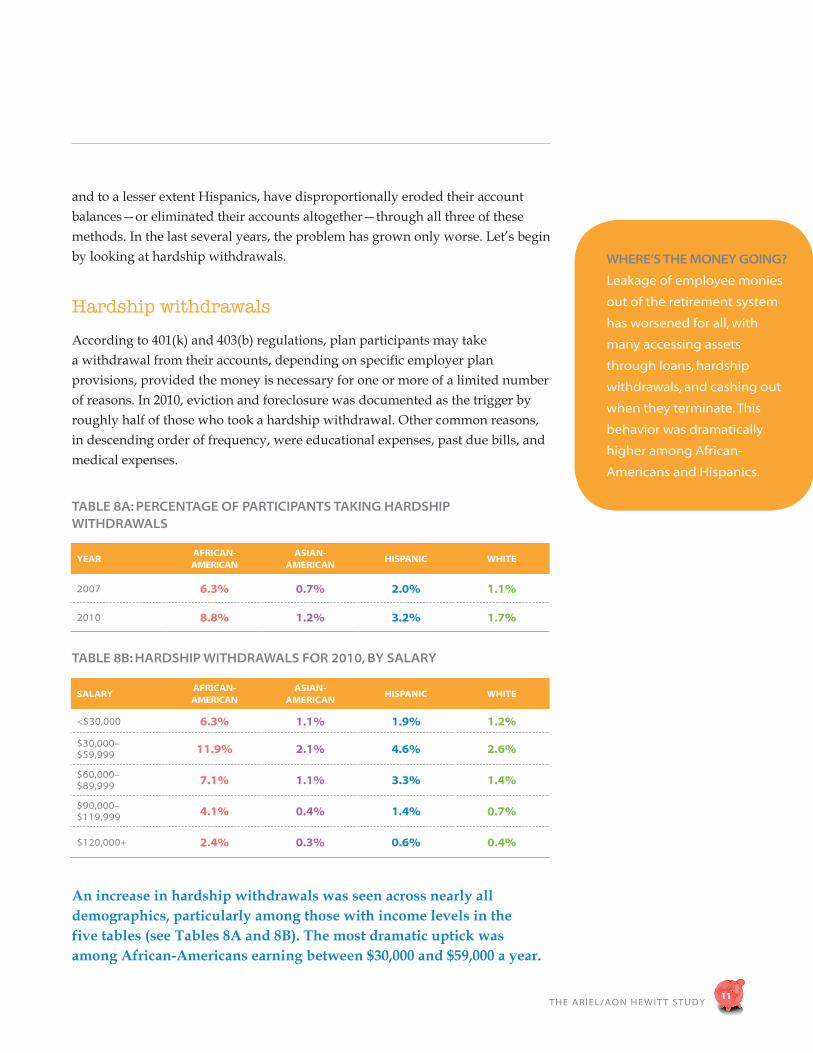
According to 401(k) and 403(b) regulations, plan participants may take a withdrawal from their accounts, depending on specific employer plan provisions, provided the money is necessary for one or more of a limited number of reasons. In 2010, eviction and foreclosure was documented as the trigger by roughly half of those who took a hardship withdrawal. Other common reasons, in descending order of frequency, were educational expenses, past due bills, and medical expenses.
table 8a: Percentage of ParticiPantS taking hardShiP withdrawalS
table 8b: hardShiP withdrawalS for 2010, by Salary
An increase in hardship withdrawals was seen across nearly all demographics, particularly among those with income levels in the five tables (see Tables 8A and 8B). The most dramatic uptick was among African-Americans earning between $30,000 and $59,000 a year.
where’S the money going?
leakage of employee monies
out of the retirement system
has worsened for all, with
many accessing assets
through loans, hardship
withdrawals, and cashing out
when they terminate. This
behavior was dramatically
higher among African-
Americans and hispanics.
yearafrican- american
asian- american
hispanic white
2007 6.3% 0.7% 2.0% 1.1%
2010 8.8% 1.2% 3.2% 1.7%
salaryafrican- american
asian- american
hispanic white
<$30,000 6.3% 1.1% 1.9% 1.2%
$30,000–$59,999 11.9% 2.1% 4.6% 2.6%
$60,000–$89,999 7.1% 1.1% 3.3% 1.4%
$90,000–$119,999 4.1% 0.4% 1.4% 0.7%
$120,000+ 2.4% 0.3% 0.6% 0.4%

The Ariel/Aon hewiT T STudy12
Examining the data by gender reveals that women are more likely to take a hardship withdrawal, with a staggering 14.3% of women in that category (compared to 8.8% of men) taking a hardship withdrawal.
While the reasons plan participants may request hardship withdrawals are similar across the board, the startling difference is in the sheer number of people in each racial and ethnic group making these withdrawals. African-Americans were more than four times as likely as whites to take a hardship withdrawal in 2010. Indeed, even when other contributing factors such as salary and age are held constant, African-Americans are 276% and Hispanics are 47% more likely to take hardship withdrawals than whites.4
Loans
A desirable feature of many defined contribution plans is the ability for participants to take a loan from their own accounts, repaid through additional payroll deductions, without penalty and typically at competitive interest rates. This feature especially puts employees of color at ease: 34% of African-Americans and 29% of Hispanics, compared to 17% of Asian-Americans and 13% of whites, say that the ability to take a loan from their plans if they need the money is a “strong influence” in their decision to invest in a defined contribution plan. It is not surprising that the number of people taking advantage of loans increased during the three years of the economic downturn (see Table 9A).
table 9a: Percentage of Plan ParticiPantS with outStanding loanS
4 These numbers are the result of a regression analysis, which allows us to see the effect one variable
(in this case, race) has on another variable (withdrawals) without being influenced by additional
other factors that may contribute (salary, age, tenure, and others.)
yearafrican- american
asian- american
hispanic white
2007 39% 16% 29% 21%
2010 49% 22% 40% 26%

The Ariel/Aon hewiT T STudy13
table 9b: Percentage of 2010 Plan ParticiPantS with outStanding loanS for 2010, by Salary
Again, the very stark differences among the racial and ethnic groups are notable. Almost 50 percent of all African-Americans and 40 percent of Hispan-ics, compared to about a quarter of whites and Asian-Americans, car-ried a loan balance in 2010. This gap is consistent across salary levels (see Table 9B). Taking the lowest and the highest earning employees out of the picture and looking at those making $30,000 to $89,999, nearly 60 percent of African-American employees have an outstanding loan—a staggering proportion that is up over ten percentage points since 2007.
Our employee survey found that among all plan participants, 29% of African-Americans and 24% of Hispanics (compared to 11% of whites and 6% of Asian-Americans) had accessed cash from their retirement accounts in the last 24 months for the following reasons: to deal with an emergency, to pay off debt, or to simply use for day-to-day expenses.5
These findings highlight the tendency for a sizeable portion of African-Americans and Hispanics to view retirement accounts as a convenient cash reserve rather than a long-term savings vehicle. The potential for loans to damage account balances is two-fold. Firstly, money out on loan needs to be paid back with interest, meaning any return comes from the participant’s own paycheck and often detracts from retirement savings. Secondly, while these loans are designed to be repaid, in many cases they are not. The vast majority of employees (80% of African-Americans, 76% of Hispanics, 71% of whites, and 67% of Asian-Americans) who have outstanding loans subsequently default on
salaryafrican- american
asian- american
hispanic white
<$30,000 36.8% 20.5% 32.9% 18.7%
$30,000–$59,999 56.7% 34.0% 48.7% 33.9%
$60,000–$89,999 58.5% 22.6% 46.7% 30.2%
$90,000–$119,999 44.7% 12.8% 27.8% 20.6%
$120,000+ 31.2% 8.1% 17.5% 13.0%
5 The data includes money accessed via loans, hardship withdrawals, or cashing out a previous
employer’s plan. A total of 36% of African-Americans, 36% of hispanics, 14% of whites, and 9% of
Asian-Americans took money out of their retirement savings for any reason.

The Ariel/Aon hewiT T STudy14
those loans if they leave the organization due to layoffs or other reasons. Because loans account for an average of 20% of participants’ account balances (across all groups), those individuals who default suffer a significant setback in preparing for retirement. For African-Americans in particular, the fifty-fifty likelihood of having a loan, coupled with a disproportionally high rate of unemployment, puts the good intentions of paying back loans at considerable risk.
Cashing out
Regardless of whether an employee has an outstanding loan or not, being laid off puts accumulated defined contribution balances at great risk for all, but especially for African-Americans and Hispanics. Well over half of those African-Americans and Hispanics who left their employer in 2010 chose to cash out their plan balances rather than leave them where they were or roll them over (see Table 10A).
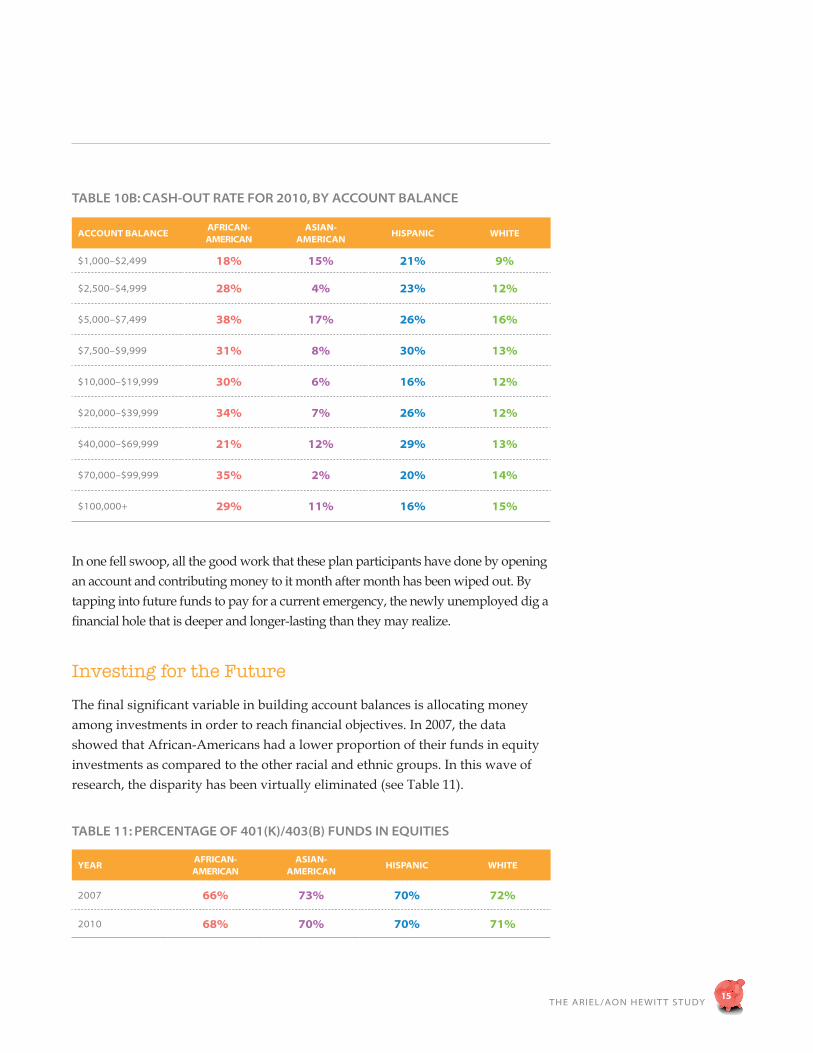
The research shows that balance size is sometimes linked to the propensity to cash out. Across nearly all account sizes, the tendency to cash out was markedly higher for Hispanics and especially for African-Americans. Nearly three in ten African-American employees with over $100,000 in account balances cashed out their plans upon termination and were subject to penalties (see Table 10B).
table 10a: emPloyee actionS taken uPon termination
actionafrican- american
asian- american
hispanic white
leAve BAlAnCeS in plAn 12% 34% 15% 27%
rollover To new plAn 25% 32% 28% 34%
CASh ouT wiTh penAlTy 63% 34% 57% 39%
The Ariel/Aon hewiT T STudy15
table 10b: caSh-out rate for 2010, by account balance
In one fell swoop, all the good work that these plan participants have done by opening an account and contributing money to it month after month has been wiped out. By tapping into future funds to pay for a current emergency, the newly unemployed dig a financial hole that is deeper and longer-lasting than they may realize.
Investing for the Future
The final significant variable in building account balances is allocating money among investments in order to reach financial objectives. In 2007, the data showed that African-Americans had a lower proportion of their funds in equity investments as compared to the other racial and ethnic groups. In this wave of research, the disparity has been virtually eliminated (see Table 11).
table 11: Percentage of 401(k)/403(b) fundS in equitieS
account Balanceafrican- american
asian- american
hispanic white
$1,000–$2,499 18% 15% 21% 9%
$2,500–$4,999 28% 4% 23% 12%
$5,000–$7,499 38% 17% 26% 16%
$7,500–$9,999 31% 8% 30% 13%
$10,000–$19,999 30% 6% 16% 12%
$20,000–$39,999 34% 7% 26% 12%
$40,000–$69,999 21% 12% 29% 13%
$70,000–$99,999 35% 2% 20% 14%
$100,000+ 29% 11% 16% 15%
yearafrican- american
asian- american
hispanic white
2007 66% 73% 70% 72%
2010 68% 70% 70% 71%
The Ariel/Aon hewiT T STudy16
This wave of research shows the variations in equity exposure among racial and ethnic groups of similar age are now considerably smaller, and that all groups now are generally more heavily invested in equities when they are younger, with reduced equity exposure as they age, as best practices dictate. A major reason for this shift is that a larger proportion of plan dollars is now invested in target date funds. When a new employee is auto-enrolled in a defined contribution plan, the employer often defaults the contributions into target date funds, which use a mixture of stocks and bonds appropriate for a participant’s investment time horizon.
Many employees do not actively make investment trades within their retirement accounts, with this tendency particularly pronounced among African-Americans and Hispanics. Only about 8% of both African-Americans and Hispanics made an investment trade in their retirement savings accounts in 2010, compared to twice that share (about 16%) of whites and Asian-Americans. As a result, a significant proportion of account balances are now parked in target date funds, which by design are appropriately weighted, adjusting over time, for their investors.
Recommendations
Armed with a better understanding of their employees, plan sponsors should design their plans to give all segments of their employee base the best opportunity to successfully save for a secure and comfortable retirement. For its part, government should recognize the stresses that employees face during times of national economic hardship and put into place policies that allow retirement plan participants to weather short-term economic hardship without compromising their financial future.
1. Know your employees. Understand your demographics beyond just the averages. Segment and assess participant behaviors by multiple perspectives, including race.
2. Use automation to its full potential. Continue to leverage automation, using automatic enrollment and quick enrollment methods. Consider using broader and more compelling defaults to spur better behavior.
n Expand auto-enrollment to all nonparticipants on a one-time or periodic basis.
n Consider using an initial default contribution rate for auto-enrolled participants of at least the match threshold, using higher rates of 4% to 6% of pay.
n Contribution rates should be auto-escalated by 1–2% a year for defaulted participants, ideally coinciding with the raise/review cycle so escalation takes effect as raises take effect.

The Ariel/Aon hewiT T STudy17
3. Ease loan repayment.
n The government should extend the time a terminating employee has to pay back a loan. Usually it is 60 days; extend it to twelve months.
n Allow a grace period for loan repayments while an individual is collecting unemployment benefits.
n After termination, allow loan repayments on their initial timetable, but from personal financial accounts rather than payroll deductions.
n Make loans portable to allay the hurdle of near-immediate repayment.
4. Deter early withdrawals. Increase penalties to 15% for nonhardship early withdrawals to deter withdrawing funds for noncritical needs.
5. Add an array of investment advisory services and support. Given the challenges in reaching employees and influencing investment behavior, consider adopting more services and tools to better meet employee needs. Increase the availability of investment advisory services in retirement plans, including target date funds, online investment advice, and managed accounts. An array is needed to meet individuals’ needs and preferences.
6. Remember communication opportunities. Defined contribution plans are complex and the reality is that participants have taken on huge responsibilities when they save and invest in their plans. While plan design is critical, we should not overlook helping participants better understand these complex topics.
n Educate employees on the topics, but do it in easy-to-grasp ways and consider small doses so they are more likely to absorb the concepts.
n Remind employees about the availability of new tools and services and take the opportunity to market these initiatives proactively to encourage usage.
n Find teachable moments like when they are hired or, perhaps, as they meet milestones along the way to reinforce the value of saving and investing for the long term.
n Use a variety of media to get messages across. Consider using a mix of print, web, mobile, and social media so that information is more available to the diverse population that exists in the workforce today.
The Ariel/Aon hewiT T STudy
ConclusionsThis study reminds us that individuals, employers, and government all have a great deal of work to do to ensure all Americans earn a comfortable and secure retirement. We must all work together to make this vision a reality, even when current demands on our resources seem to be crowding out our hopes and dreams for the future. We cannot wait until each of today’s problems is solved to turn our attention to tomorrow.
But this study also reminds us that there are concrete actions that, when taken, can make a large and lasting difference. It shows us that in a just a few years’ time, we can, for many people at the beginning of their careers, facilitate the first steps of what could be a lifetime of good saving and investing habits. And it reminds us to build on those actions, learn their lessons, and continue working to ensure that the finale of the American Dream—a secure retirement—is available to all Americans.
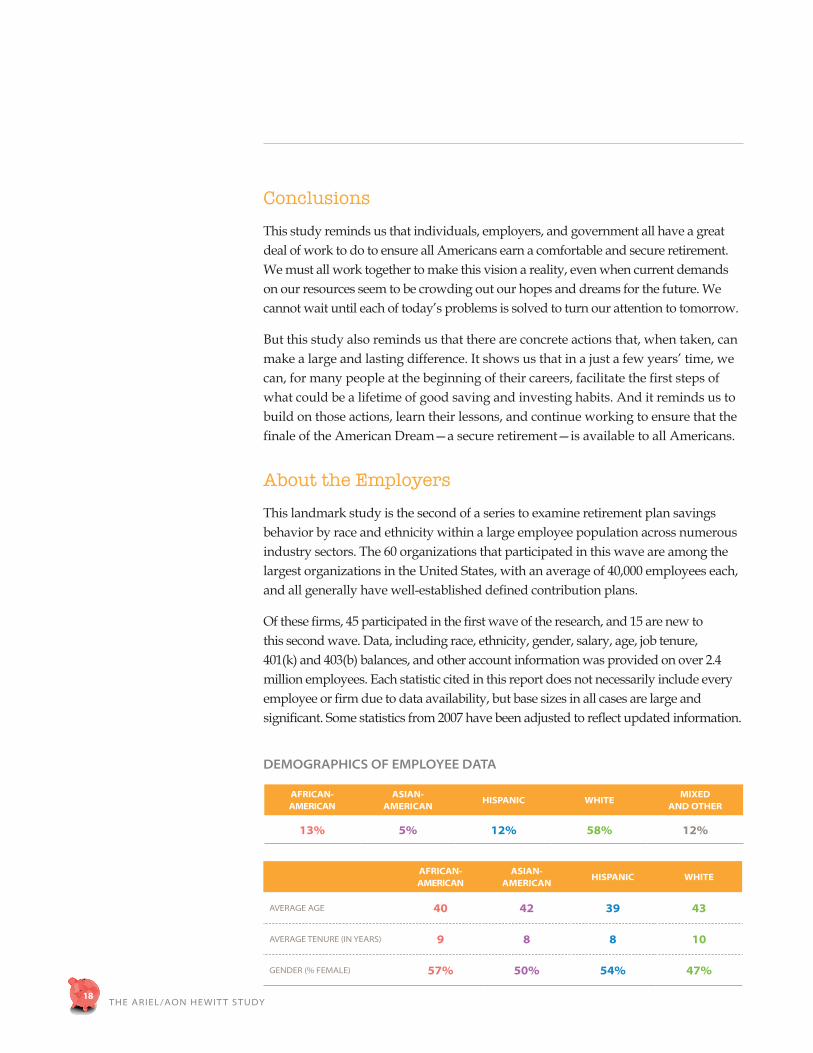
About the EmployersThis landmark study is the second of a series to examine retirement plan savings behavior by race and ethnicity within a large employee population across numerous industry sectors. The 60 organizations that participated in this wave are among the largest organizations in the United States, with an average of 40,000 employees each, and all generally have well-established defined contribution plans.
Of these firms, 45 participated in the first wave of the research, and 15 are new to this second wave. Data, including race, ethnicity, gender, salary, age, job tenure, 401(k) and 403(b) balances, and other account information was provided on over 2.4 million employees. Each statistic cited in this report does not necessarily include every employee or firm due to data availability, but base sizes in all cases are large and significant. Some statistics from 2007 have been adjusted to reflect updated information.
demograPhicS of emPloyee data
18
african- american
asian- american
hispanic whitemixed
and other
13% 5% 12% 58% 12%
african- american
asian- american
hispanic white
AverAge Age 40 42 39 43
AverAge Tenure (in yeArS) 9 8 8 10
gender (% FemAle) 57% 50% 54% 47%

The Ariel/Aon hewiT T STudy
At the time data was collected, the following was true about the retirement programs of the employer participants:
n The majority (76%) also offer a defined benefit pension plan, but only about one-third of the firms offered the pension plan to new employees.
n Within their defined contribution plan:
All 60 (100%) firms provided an employer match on employees’ contributions.
About 13% of the organizations made contributions to employee plans from profit-sharing, with a similar proportion (12%) offering an employee stock ownership plan.
The average number of investment fund offerings was 17, with a large majority (82%) of the firms also making target date or lifecycle funds available.
Automatic enrollment was used by 67% of employers. Among the firms whose plans offer this feature, two-thirds place automatically enrolled employees into a target date fund.
Contribution rates were defaulted at 3% or below for 50% of these plans, and 42% of employers included contribution escalation as well.
n The firms offered a variety of forms of investment education and advisory services during 2010.
Nearly 74% provided written materials and offered online modeling and guidance tools.
42% provided targeted communication or offered on-site seminars, workshops, or meetings.
44% offered seminars/workshops provided by outside advisory services, and 31% offered one-on-one financial counseling.
About the Employee Survey
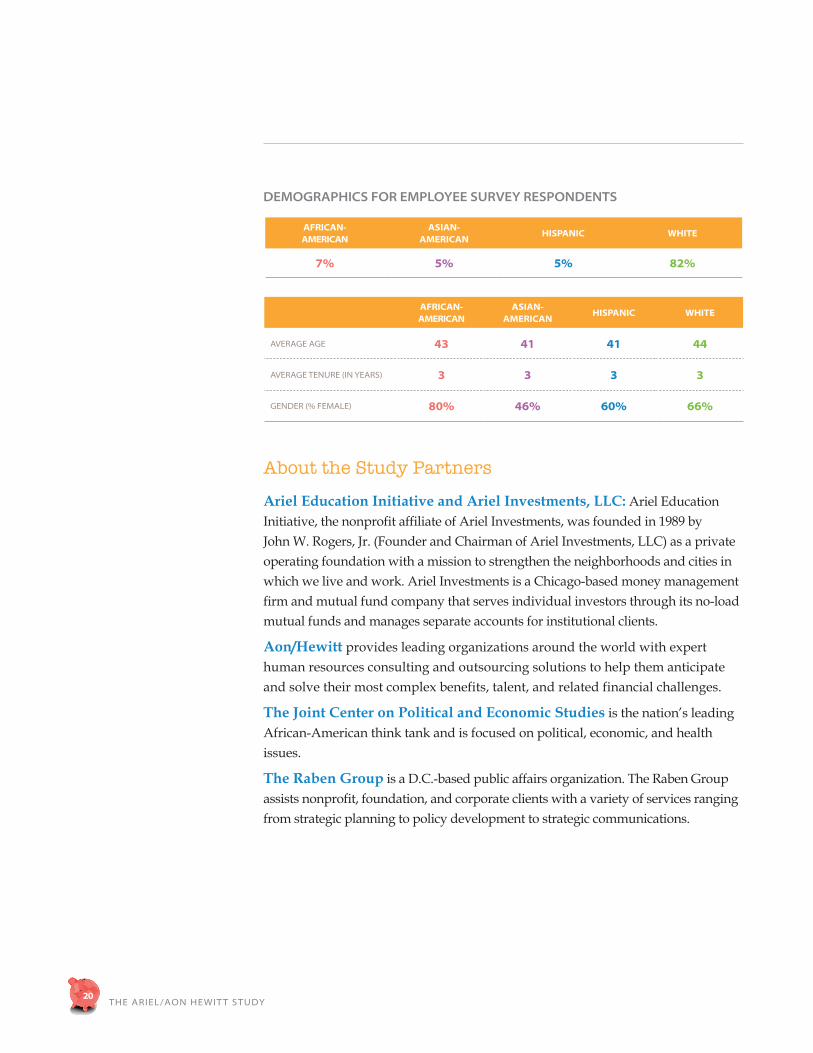
In order to enrich the data collected about employees’ retirement plans, three large employers representing financial services, consumer goods, and healthcare agreed to deploy a ten-minute online questionnaire to their U.S.-based employees.
The questionnaire collected demographic data and gathered opinions about financial literacy, retirement, savings behaviors and vehicles, and how employers could help in saving for retirement.
About 130,000 questionnaires were sent out to employees in the summer and fall of 2011, and nearly 19,000 were completed and returned.
19
The Ariel/Aon hewiT T STudy20
demograPhicS for emPloyee Survey reSPondentS
About the Study Partners
Ariel Education Initiative and Ariel Investments, LLC: Ariel Education Initiative, the nonprofit affiliate of Ariel Investments, was founded in 1989 by John W. Rogers, Jr. (Founder and Chairman of Ariel Investments, LLC) as a private operating foundation with a mission to strengthen the neighborhoods and cities in which we live and work. Ariel Investments is a Chicago-based money management firm and mutual fund company that serves individual investors through its no-load mutual funds and manages separate accounts for institutional clients.
Aon/Hewitt provides leading organizations around the world with expert human resources consulting and outsourcing solutions to help them anticipate and solve their most complex benefits, talent, and related financial challenges.
The Joint Center on Political and Economic Studies is the nation’s leading African-American think tank and is focused on political, economic, and health issues.
The Raben Group is a D.C.-based public affairs organization. The Raben Group assists nonprofit, foundation, and corporate clients with a variety of services ranging from strategic planning to policy development to strategic communications.
african- american
asian- american
hispanic white
7% 5% 5% 82%
african- american
asian- american
hispanic white
AverAge Age 43 41 41 44
AverAge Tenure (in yeArS) 3 3 3 3
gender (% FemAle) 80% 46% 60% 66%
We would like to thank all of the plan sponsors that participated in the study, including the following:
3M Company
Abbott Laboratories - NA
Aetna Inc.
Alcoa Inc.
Aon Hewitt
The American Red Cross
Aon Hewitt
AT&T Inc.
AXA Equitable
Cardinal Health
Caterpillar Inc.
Cintas Corporation
Comcast Corporation
Continental Airlines, Inc.
DreamWorks Animation SKG, Inc.
Exelon Corporation
First Horizon National Corporation
General Mills
Henry Ford Health System
HCA Inc.
Hilton Worldwide
Illinois Tool Works Inc.
John Hancock Financial Services
Kellogg Company
KeyCorp
Kimberly-Clark Corporation
Liberty Mutual Insurance
Lowe’s
Macy’s, Inc.
Marriott International, Inc.
McDonald’s Corporation
Morgan Stanley
Nalco Company
The Northern Trust Company
PepsiCo, Inc.
Prudential Financial, Inc.
SABIC
Sara Lee Corporation
Target Corporation
Telephone and Data Systems, Inc.
The Interpublic Group of Companies, Inc.
United Technologies Corporation
UPMC
United Parcel Service of America, Inc.
USG Corporation
Verizon Communications Inc.
Verizon Wireless
The Williams Companies, Inc.
Xerox Corporation
