4.0 results and discussion: unsteady igv surface and wake ... · igv trailing edge relative to the...
TRANSCRIPT

Results and Discussion: Unsteady 145
4.0 Results and Discussion:
Unsteady IGV Surface and Wake Measurements
This section is divided between the Phase I unsteady on-vane pressure measurements and
the Phase II unsteady total pressure measurements between the IGV and fan. The data
acquisition techniques, results and discussion for the on-vane and total pressure
measurements are presented in section 4.1 and 4.2, respectively. The unsteady total
pressure measurements are divided between the cases of subsonic and transonic relative
fan blade velocity.
4.1 High-Frequency On-Vane Pressure Measurements
The primary purpose of the on-vane measurements is to detect the unsteady pressure
fluctuations at the IGV trailing edge caused by the downstream fan, for the IGV placed at
a distance upstream of the fan that corresponds to typical component spacing. This first
phase of the unsteady experiments is used to determine whether upstream propagating
potential flow fields (PFF) and/or shock waves from the fan blades are present at the IGV
trailing edge. As discussed in section 1.2, hot-wire measurements taken upstream of the
F109 at the Air Force Academy found strong velocity fluctuations propagating directly
upstream of the fan, which were reported to be caused by the fan potential flow field
(Falk, et. al, 1998). The same study reported that these fluctuations decayed

Results and Discussion: Unsteady 146
exponentially as the probe was moved upstream from the fan. At the axial location of the
IGV trailing edge relative to the fan leading edge in the current study (0.43 CF), Falk
measured the unsteady velocity fluctuations to have a Peak-to-Peak amplitude of 7% and
15% the axial velocity in the axial and circumferential directions respectively. These
values correspond to maximum unsteady pressure fluctuations between 0.04% and 0.17%
of the inlet total pressure, respectively. If these results are accurate, the fan PFF would
have a minimal effect on the IGV wake development. However, calculations of the
relative fan velocity in the current study, discussed in section 4.1.2, show that the fan is
transonic for the higher speeds tested. A recent study by Sanders and Fleeter, 1999,
found that a transonic rotor produced strong unsteady pressure fluctuations on an
upstream IGV, at the same spacing as the current study, which produced unsteady
pressure fluctuations as high as 35% of the inlet total pressure, as discussed in section
1.2. Therefore, the amplitude of the unsteady pressure fluctuations at the IGV trailing
edge in the current study is unknown. If the IGV trailing edge transducer detects a weak
or absent unsteady pressure field, as the Falk study suggests, any unsteadiness measured
in the wake (in the next phase of the study) would be caused by interaction with the fan
PFF after the boundary layer separation (wake) leaves the vane. Conversely, if the IGV
trailing edge transducer detects a strong unsteady pressure field, as the Johnson and
Fleeter study suggests for a transonic rotor, the pressure field may alter the strength and
the shape of the wake by impinging on the IGV surface. Moreover, if the unsteady
pressure field at the IGV trailing edge is strong, it may interfere with the effectiveness of

Results and Discussion: Unsteady 147
the trailing edge jets. Therefore, the pressure fluctuations at the IGV trailing edge must
be determined before the second phase of the experiments begins.
The secondary purpose of the on-blade measurements is to determine if the stator row
downstream of the fan, the outlet guide vanes (OGV), cause any disturbances that are
detected at the IGV trailing edge, as discussed in section 2.3.3. In the next phase of the
unsteady experiments, the total pressure probe is fixed to the engine casing. The IGV
ring is indexed circumferentially in order to map the wakes in the pitchwise direction.
This results in the IGV trailing edge position varying in the circumferential direction
relative to the OGV. If the OGV PFF is detectable at the IGV trailing edge, then the
indexing of the IGV may compromise the wake measurements. Therefore, unsteady on-
blade pressure measurements are taken for the IGV directly upstream and between the
downstream OGV.
4.1.1 Data Reduction
The voltage signals from the on-blade Kulite transducer are divided into the DC and AC
components, as discussed in section 2.3.1. The DC component is used to determine the
time averaged absolute pressure from the transducer. The filtered AC component is used
to determine the unsteady gage pressure fluctuations and is acquired with the high speed
LeCroy Waveform DAQ system. The signal from the one-per-revolution fiber-optic
trigger is acquired simultaneously with the AC signal. The data are acquired at a
sampling frequency of 500 kHz, over a period of 0.262 seconds, which corresponds to

Results and Discussion: Unsteady 148
approximately 50 fan revolutions per acquisition. For each measuring location and fan
speed tested, four data sets were acquired for a total of 200 fan revolutions.
The fiber-optic trigger (FOT) initiates a square wave voltage signal when the reflective
tape on the spinner is detected. An example output from the FOT is shown in Fig. 4.1 for
three fan revolutions. This figure shows an instantaneous step response when the
reflective tape is detected. These step signals are used to phase lock the pressure signals
with each fan revolution. This phase locking is used for the ensemble averaging of the
pressure signals with each fan revolution, discussed below. In order to accurately
ensemble average the data so that a direct comparison can be made at different measuring
locations for a given fan speed, the same number of sampling points is required for each
revolution. If the fan speed drifts during the testing, each acquisition will contain a
different number of sampling points per revolution. Therefore, the engine speed was
monitored with the monopole speed sensor, discussed in section 2.1, and with an
oscilloscope connected to the FOT signal to insure that the fan speed did not drift from
run to run.

Results and Discussion: Unsteady 149
Figure 4.1 Square Wave output from one-per-rev fiber-optic trigger
The flows in and around fans and axial compressors are inherently unsteady. Wakes,
potential flow fields, and shock interactions between blade rows generate the majority of
this unsteadiness, as discussed in section 1.2. However, local flow instabilities exist from
blade pass to blade pass, and revolution to revolution, which are both random and
unpredictable (Johnston and Fleeter, 1998). In order to accurately compare flow results
from different measuring locations and fan speeds, these random instabilities have to be
removed from the data. The most common and accepted method for removing these
random instabilities is the ensemble averaging of the data over one revolution. This
method was employed by each of the previous investigations of unsteady stator-rotor
interactions discussed in section 1.2. In the current study, the unsteady pressure signals
are separated into one fan revolution in the time domain using the signals from the FOT
0
5
10
15
0 1 2 3
Fan Revolutions
FOT
Out
put (
V)

Results and Discussion: Unsteady 150
to phase lock the data to each fan revolution. Each specific point in time is averaged with
that specific point in the other signals. This is done for each sampling point location in
time over the fan revolution. The ensemble average for the pressure at a given point in
time is:
Where, N is the number of fan revolutions, or ensembles, averaged. An example of the
ensemble averaging technique for four different phase locked signals is shown in Figure
4.2. Note that the signals are offset on the voltage scale for the example. A program was
written in Matlab to ensemble average the pressure data. The ensemble averaging of the
pressure signals will be discussed further in the next section.
(4.1)
time
N
iN
timeN
PP
����
�
�
����
�
�
=�
=0

Results and Discussion: Unsteady 151
Figure 4.2 Example of ensemble averaging
A spectral analysis is performed on the unsteady pressure data to determine the frequency
content of the signal so that a comparison can be made with the previous studies. The
frequency domain is obtained from the raw pressure signals, i.e. not ensemble averaged.
A Matlab program was written to perform a Fast Fourier Transform (FFT) on the
unsteady pressure data. The resolution of the frequency bandwidth for a given time
series is:
-0.2
0
0.2
0.4
0.6
0.8
1
0 0.0003 0.0006 0.0009 0.0012
Time (s)
Kulit
e O
utpu
t (V)
One ensemble average in time
(4.2) Nff s
BW =

Results and Discussion: Unsteady 152
Where fs is the sampling frequency, 500 kHz, and N is the total number of sampling
points, 131070. Therefore, the bandwidth resolution in the current study is 3.8 Hz.
4.1.2 Results and Discussion
High frequency pressure measurements were performed with a Kulite pressure transducer
facing downstream toward the fan and mounted flush at the IGV centerline in a TEB hole
at 1.1 in immersion from the engine cowling. The IGV trailing edge was placed 0.43 fan
chords upstream of the fan, which is in the range of typical IGV-fan spacings in modern
military engines. The fan leading edge is at an axial distance of 0.4 IGV chords
downstream of the IGV. The IGV was initially placed between two of the downstream
OGV. The rear-facing pressure transducer is used to detect the upstream propagating
unsteady pressure fluctuations generated by the rotor. For subsonic relative fan
velocities, the fan generates an upstream propagating potential flow field, also called
potential waves, as discussed in section 1.2. For transonic relative fan velocities, bow
shocks form on the fan blade leading edge and propagate upstream, as discussed in
section 1.2. Both of these conditions generate unsteady pressure fields upstream of the
fan at the fan blade passing frequency (BPF) and harmonics there of.
The first step in the on-blade measurements was determining the testing speeds for the
unsteady experiments. Measurements were performed between 7k and 14k rpm, in 0.5k
rpm increments. The converted DC component of the pressure signal was found to
correspond to the inlet static pressure at a given fan speed. The amplitudes of the signal

Results and Discussion: Unsteady 153
AC component, the unsteady pressure fluctuations, were observed on an oscilloscope in
real time. These results showed small pressure fluctuations at the blade passing
frequency (BPF) between 7k and 11k rpm fan speeds with amplitudes ranging from 0.05
to 0.3 psi peak to peak (P-P). At approximately 11.5k rpm, the pressure fluctuation
waveform changed and the amplitude dramatically increased to over 1 psi P-P at the BPF.
Furthermore, the noise emitted from the engine grew much louder and took on a
‘buzzsaw’ type tone, indicative of a transonic fan. The P-P pressure amplitudes
continued to increase with fan speed, reaching a maximum of 4.7 psi at 14k rpm, which
corresponds to 35% of the inlet total pressure. Since the objective of this study is to
examine the effectiveness of IGV TEB for both subsonic and transonic fan speeds,
measurements were taken for fan speeds of 10, 11, 12, 13 and 14k, corresponding to 70,
77, 85, 90 and 100% maximum fan speed. The calculated relative fan blade velocities
and Mach numbers for these fan speeds are shown in Table 4.1 for the blade tip and 1.1
in immersion from the engine inlet, the location of the transducer on the IGV. These
calculations show that transonic relative blade speeds are likely between 12k and 14k
rpm at 1.1 in immersion.

Results and Discussion: Unsteady 154
Fan Speed Fan Tip Fan Tip 1.1 in immersion 1.1 in immersion (rpm) Velocity (m/s) Mach # Velocity (m/s) Mach # 10000 260 0.812 232 0.715 11000 286 0.906 255 0.795 12000 312 1.004 279 0.900 13000 339 1.111 303 0.970 14000 366 1.225 327 1.063
Table 4.1 Calculated relative fan blade velocity and Mach number
In order to determine if the fan in the F109 is at a transonic condition at the higher fan
speeds, the pressure waveforms are compared to previous investigations. The AC
component of the pressure signals was routed through signal filters and into a LeCroy
Waveform Recorder, as discussed in section 2.3.1. These raw signals of the pressure
fluctuations show different waveforms for 10 and 11k rpm, compared to 12-14k rpm fan
speeds, as shown in Fig. 4.3 for 10 and 13k over 25% of one fan rotation. Note that the
pressure scales are different for each plot. The waveform of the lower fan speed consists
of a sinusoidal type wave, where the waveform at the higher speed consists of a step
followed by a roll-off of the signal for each blade pass. The step in the signal at the
higher fan speeds is indicative of a shock wave passing over the transducer. The
ensemble averaged waveforms measured by Sanders and Fleeter (1999) near the trailing
edge of an IGV for both subsonic and transonic rotor speeds is shown in Fig. 4.4, note
that the pressure scales are different on each plot. The larger amplitude transonic
waveform agrees with the waveform at 13k rpm in the current study in that a step is

Results and Discussion: Unsteady 155
observed followed by a roll-off in the signal at each blade pass. The smaller amplitude
subsonic waveform is similar to the 10k rpm waveform. Furthermore, the differences in
P-P pressure amplitude between 10k and 13k is of the same order as the difference
between the subsonic and transonic pressure amplitudes in the Fleeter study. Therefore,
it is concluded that subsonic relative fan blade velocities exist at fan speeds of 10k and
11k rpm, where the fan generates an upstream propagating potential flow field.
Moreover, transonic relative fan blade velocities exist at fan speeds of 12, 13 and 14k
rpm, where the fan leading edge shocks propagate upstream.

Results and Discussion: Unsteady 156
Figure 4.3 Waveform comparison between subsonic and transonic fan
-0.2-0.1
00.10.20.3
0 0.05 0.1 0.15 0.2 0.25
Fan Revolutions
Pres
sure
(psi
)
-1.5-1
-0.50
0.51
1.5
0 0.05 0.1 0.15 0.2 0.25
Fan Revolutions
Pres
sure
(psi
)
10 k rpm
13 k rpm

Results and Discussion: Unsteady 157
Figure 4.4 IGV on-blade pressure waveforms (Sanders and Fleeter, 1999)
It should be noted that the waveform from the 10k rpm subsonic fan speed, Fig. 4.3,
agree with the waveforms of the upstream propagating potential waves measured with
hot-wire probes in an F109 engine by Falk and Jumper, 1998. However, that study was
performed for fan speeds between 12k and 14k rpm, as discussed in section 1.2, which
are transonic in the current study. In recent discussions with Falk and Jumper, 2000, they
believe that the fan blades of the F109 used in their study do not reach a transonic
velocity due to the higher altitude at the Air Force Academy. Therefore, the
measurements made in that study were performed for subsonic relative blade velocities
only.
Transonicrotor
Subsonicrotor

Results and Discussion: Unsteady 158
The average peak to peak (P-P) pressure amplitudes of the raw on-blade measurements
are shown in Figure 4.5 for each fan speed tested, the ensemble average results are
addressed later. These average P-P amplitudes correspond to 1.9, 2.7, 5.9, 9.9, and
18.2% of the inlet total pressure for the fan speeds tested. Maximum P-P amplitudes of
4.7 psi, 35% of the inlet PT, were observed at 14k rpm. These results show a significant
increase in P-P unsteady pressure amplitudes between the subsonic and transonic fan
speeds, with the average amplitude at 14k being 9.6 times greater than that at 10k.
Furthermore, the amplitudes for the transonic fan cases increase exponentially with
increasing fan speed.
Figure 4.5 Peak to Peak amplitude of unsteady pressure fluctuations at IGV TE
As discussed in section 1.2, Sanders and Fleeter (1999) found higher average IGV
surface unsteady pressure amplitudes of 10% and 35% of the inlet total pressure for the
00.5
11.5
22.5
10 11 12 13 14 15
Fan Speed (krpm)
P-P
Pres
sure
Am
plitu
de
(psi
g) RawEnsemble Avg.

Results and Discussion: Unsteady 159
subsonic and transonic rotor conditions, respectively. The IGV-rotor spacing was 0.414
Cr, compared to 0.43 in the current study. Inlet flow conditions and relative rotor speeds
were not reported. However, in personal communications with Fleeter (2000), the inlet
velocity and relative fan speeds were similar to those in the current study. Therefore, the
higher pressure amplitudes in that study were due to the thicker leading edge of the
NACA65 rotor blades compared to the relatively thin fan blades of the F109. Previous
studies have shown that thicker leading edge rotor blades generate stronger bow shocks
under the same flow conditions (Breugelmans, 1978).
The high amplitude pressure fluctuations at the IGV trailing edge, in the current study,
demonstrate the significance of the upstream propagating forcing function generated by
the fan’s PFF and passing shocks on the IGV surface. Until recently, the interaction of
the rotor PFF and passing shocks on an upstream stator have been considered second
order compared to the forcing function generated by the IGV wakes on the downstream
rotor. However, recent IGV failures and premature maintenance replacements have been
attributed to HCF. The results of the current study agree with the previous studies by
demonstrating a first order forcing function at the IGV trailing edge, which generates a
periodic loading and lift on the vane. Furthermore, these results demonstrate the
likelihood of the fan unsteady pressure fields altering the strength and the shape of the
IGV wakes. For transonic fan speeds, the strong passing shock waves may induce a flow
separation on the IGV surface further upstream on the vane chord, thereby creating a
larger wake compared the baseline results presented in Chapter 3.0. Finally, these results

Results and Discussion: Unsteady 160
present a concern for the TEB investigation in the Phase II experiments. Since P-P
pressure fluctuations as high as 4.7 psi, maximum, and 2.5 psi, average, were detected at
the TEB holes, the effectiveness of wake filling may be reduced by periodic blocking, or
resistance, at the exit of the TEB jet holes. These results will be discussed further in
Chapter 5.0.
The power spectral density (PSD) of the unsteady pressure signals is shown in Fig. 4.6
for each fan speed tested. Note that the magnitude of the PSD differs on each plot so that
the harmonics can be viewed at each fan speed. These results show that the fundamental
frequency for each signal is the blade passing frequency for a given fan speed, with much
smaller higher order harmonics of the BPF. In previous studies of IGV on-blade
unsteady pressure measurements upstream of a transonic rotor, the magnitude of higher
harmonic content was significant to the sixth harmonic of the BPF (Sanders and Fleeter,
1999; Probasco, et. al, 1998). Sanders speculated that shock reflections off of adjacent
vanes generated this higher harmonic content, as discussed in section 1.2. The results of
the current study, using only one IGV, validate this assumption. Therefore, using an
isolated IGV in the current study is advantageous by eliminating PFF and shock
reflections encountered in previous studies which used multiple IGV. This becomes
significant in the resolution of the IGV wake profiles in the unsteady total pressure
investigation in the next section.

Results and Discussion: Unsteady 161
Figure 4.6 Power Spectral Density of on-blade measurements
0 0 .5 1 1 .5 2 2 .5
x 104
0
500
1000
1500
2000
2500
3000
0 5 10 15 20 250
5
10
15
20
25
30
35
0 5 10 15 20 250
50
100
150
200
250
300
350
0 5 10 15 20 250
100
200
300
400
500
600
700
800
900
1000
0 5 10 15 20 250
200
400
600
800
1000
1200
1400
1600
1800
2000
10k rpm 11k rpm
12k rpm 13k rpm
14k rpm
Frequency (kHz)
Pow
er S
pect
ral
Den
sity

Results and Discussion: Unsteady 162
Comparison of IGV surface pressure fluctuations relative to downstream OGV
The final objective of the on-blade measurements is to determine if the downstream OGV
PFF is detectable at the IGV trailing edge, as discussed previously. Therefore,
measurements were performed at each fan speed with the IGV located between two of the
downstream OGV and directly upstream of an OGV. The pressure fluctuations measured
on the IGV trailing edge become increasingly sporadic with increasing fan speed, making
it impossible to determine if the pressure fluctuations differ at the two IGV
circumferential locations. This is due to the inherent random unsteadiness in engine
testing, especially for the transonic fan speeds. Therefore, it is necessary to ensemble
average the unsteady data in order to determine if the PFF of the OGV is detected at the
IGV trailing edge. The ensemble averaging technique is discussed in section 4.1.1. It
was determined that 100 ensemble averages, averaged over one fan revolution, was
adequate in removing the random pressure fluctuations in the signals. The difference
between 100 and 200 ensembles was negligible.
Ensemble averaging of the unsteady pressure data removes the random unsteady content
from the signals generated by local flow instabilities. The resulting ensemble averaged
P-P amplitudes of the pressure signals are therefore reduced when compared to the raw
data, as shown in Fig. 4.5. The reduction in amplitude is especially evident for the
transonic fan speeds where ensemble averaging reduces the P-P amplitude of the signal
by 35% at 14k rpm. Reductions in amplitude of the same order have been previously
reported for upstream pressure measurements of subsonic and transonic rotors (Falk,

Results and Discussion: Unsteady 163
1998, Johnston and Fleeter, 1998). Figure 4.7 shows the raw unsteady pressure
fluctuations compared to the 100 ensemble averaged data for the 11k subsonic fan speed.
The resulting ensemble average reduces the amplitude of the raw signal, while preserving
the phase and waveform well.
Figure 4.7 Raw versus 100 ensemble averages over 0.2 fan revolutions at 11k
Figure 4.8 shows the raw unsteady pressure fluctuations compared to the 100 ensemble
averaged data for the 12k transonic fan speed. The resulting ensemble average reduces
the amplitude of the raw signal, while preserving the phase well. However, the ensemble
averaging does not accurately preserve the step generated by the passing shocks in the
raw data, as shown in the figure. This is an unfortunate consequence of ensemble
averaging pressure signals generated by transonic rotors, as the passing shocks are highly
unsteady, showing slight random variance in phase for each fan blade from revolution to
-0.4
-0.2
0
0.2
0.4
0 0.2
Fan Revolution
Pres
sure
(psi
g)
Raw100 AVG

Results and Discussion: Unsteady 164
revolution (Johnston and Fleeter, 1998). However, without ensemble averaging the data,
a direct comparison between measurements could not be made.
Figure 4.8 Raw versus 100 ensemble averages for 0.2 fan revolutions at 12k
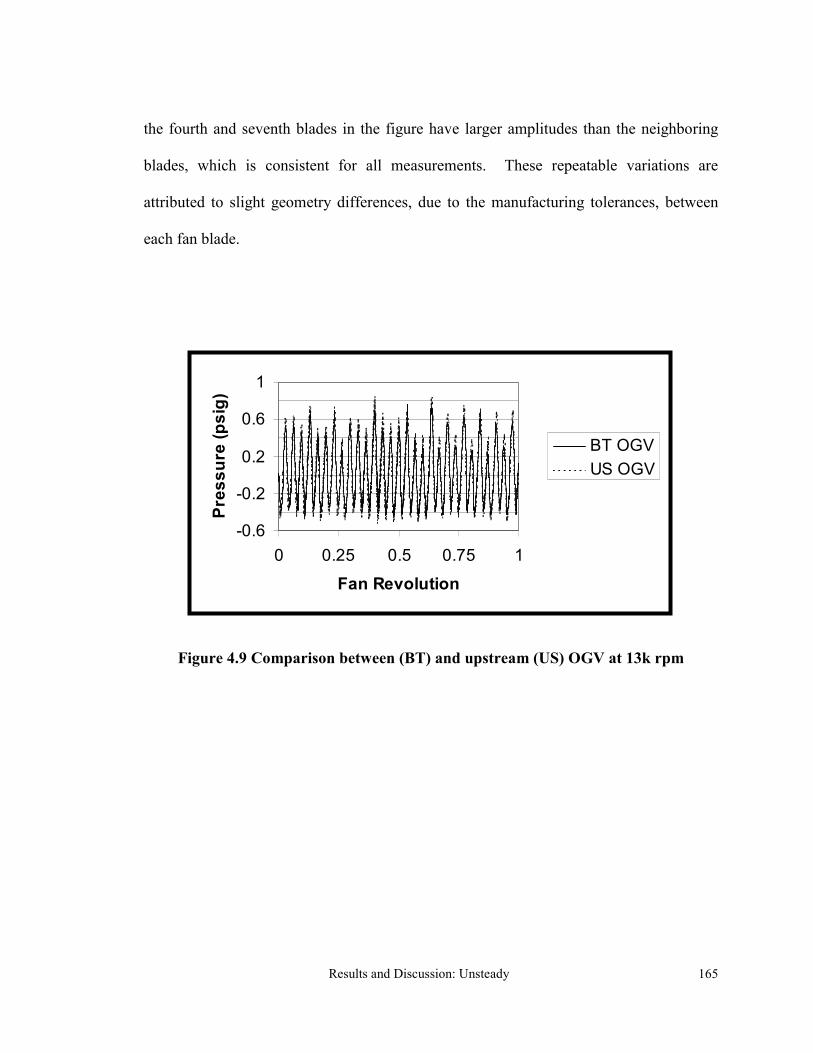
The ensemble averaged pressure fluctuations at the IGV trailing edge located between
(BT) and directly upstream (US) of the downstream OGV are shown in Fig. 4.9 for the
entire fan revolution. Results show no detectable influence of the OGV on the upstream
IGV for both subsonic and transonic fan speeds. Therefore, when the IGV is indexed in
the Phase II experiments, only disturbances from the downstream fan will impact the IGV
surface. Figure 4.9 also shows the repeatability of both the pressure measurements and
the ensemble averaging technique. Finally, these results show distinct variations in
amplitude and phase between the pressures fields generated by each fan blade. These
results are consistent for each fan speed measured. For instance, the pressure signals for
-1.5-1
-0.50
0.51
1.5
0.000 0.200
Fan Revolution
Pres
sure
(psi
g)
Raw100 AVG
Results and Discussion: Unsteady 165
the fourth and seventh blades in the figure have larger amplitudes than the neighboring
blades, which is consistent for all measurements. These repeatable variations are
attributed to slight geometry differences, due to the manufacturing tolerances, between
each fan blade.
Figure 4.9 Comparison between (BT) and upstream (US) OGV at 13k rpm
-0.6
-0.2
0.2
0.6
1
0 0.25 0.5 0.75 1
Fan Revolution
Pres
sure
(psi
g)
BT OGVUS OGV

Results and Discussion: Unsteady 166
4.2 High-Frequency Total Pressure Probe
High frequency total pressure measurements were performed with a Kulite pressure
transducer mounted between the IGV and fan, with the measuring head facing upstream
toward the IGV and the on-coming inlet flow, as discussed in section 2.3. The custom
made 0.1 in head XWC-065 Kulite is recessed one diameter into the probe. The probe is
mounted at a radial immersion of 1.1 in (2.8 cm) from the engine cowling. The probe
sensor head is located 0.15 IGV chords downstream of the IGV, and 0.26 fan chords
upstream of the fan leading edge, as shown in Fig. 4.10. The probe is fixed to the engine
casing, therefore the IGV is circumferentially indexed between runs in order to resolve
the IGV wake in the pitchwise (x) direction. The IGV trailing edge is located 0.43 fan
chords upstream of the fan, which is in the typical range of IGV-fan spacings in modern
military engines. The rotor leading edge is at an axial distance of 0.4 IGV chords
downstream of the IGV. Total pressure measurements are performed for both the no
flow control and TEB flow control cases. These measurements are performed at fan
speeds of 10k and 11k rpm (subsonic), and 12k, 13k, and 14k rpm (transonic). These fan
speeds correspond to 70, 77, 85, 90 and 100% maximum fan speed, respectively.

Results and Discussion: Unsteady 167
Figure 4.10 Unsteady total pressure measurements
The following sections will first present the data reduction techniques used in the Phase II
investigation, which includes the description of a unique method for reducing the
unsteady IGV wake profiles. The results and discussion of the time averaged and
unsteady IGV wake measurements are presented in sections 4.2.2 and 4.2.3 for subsonic
and transonic relative fan blade velocities, respectively.
4.2.1 Data Reduction
The voltage signals from the Kulite pressure transducer embedded in the total pressure
probe are divided into the DC and AC components, as discussed in section 2.3.1. The
DC component is used to determine the time averaged IGV wakes. The filtered AC
FanDirectionFlow
x
z
PT MeasurementPositions
Kulite

Results and Discussion: Unsteady 168
component is used to determine the unsteady total pressure fluctuations and is acquired
with the high speed LeCroy Waveform DAQ system. The signal from the one-per-
revolution fiber-optic trigger is acquired simultaneously with the AC signal. The data are
acquired at a sampling frequency of 500 kHz, over a period of 0.262 seconds, which
corresponds to approximately 50 fan revolutions per acquisition. For each measuring
location and fan speed tested, four data sets are acquired. The unsteady pressure
fluctuations are phase locked and ensemble averaged over 100 fan revolutions. The
ensemble averaging technique is discussed in section 4.1.1.
Initial total pressure measurements were performed with a clean inlet, i.e. no IGV, for the
five fan speeds tested. The time averaged inlet total pressure was obtained from the DC
component of the Kulite signal, as discussed in section 2.3.1.5. Reduction of the AC
signal components showed strong unsteady pressure fluctuations at the BPF, with P-P
amplitudes as high as 7 psi for the highest fan speed tested. These pressure fluctuations
are the result of the upstream propagating PFF and passing shocks from the subsonic and
transonic fan, respectively. Therefore, the Kulite in the total pressure probe, which is
facing upstream, is sensing the unsteady static pressure fluctuations of the PFF and
shocks at each blade pass, as shown in Fig. 4.11.

Results and Discussion: Unsteady 169
Figure 4.11 Shocks passing over total pressure probe in clean inlet
In the next step in the experiment, the IGV is placed onto the inlet and wake
measurements are taken with the total pressure probe. The time averaged total pressure
deficit in the IGV wake region is determined from the DC component of the Kulite
signal. However, the AC component of the Kulite signal is a combination of the
unsteady IGV wake fluctuations coupled with the fan passing PFF or shocks, as shown in
Fig. 4.12.
-2-10123
0 0.0005 0.001 0.0015 0.002 0.0025
Time (s)
Pres
sure
(psi
g)
Fan Direction
FanShocks
InletFlow
Probe
Probe Measurement

Results and Discussion: Unsteady 170
Figure 4.12 IGV unsteady wake coupled with passing rotor shocks
In order to resolve the unsteady wake profiles of the IGV, the raw signal containing the
wake data and the passing shock fluctuations must be uncoupled. Previous studies have
shown that the subsonic fan PFF and the transonic fan passing shocks propagate upstream
at an angle relative to the rotor direction, as discussed in section 1.2. Therefore, the
shock waves or potential flow waves that pass over the probe do not interfere with either
the IGV surface or the IGV wake, as shown in Fig. 4.13. In other words, the probe does
not obstruct the path of the passing shocks that effect the unsteady wake profile of the
IGV. Therefore, the unsteady pressure fluctuations from the shock/potential waves
Fan Direction
FanShocks
InletFlow
Probe
Wake
IGV
-3
-1.5
0
1.5
3
0 0.0005 0.001 0.0015 0.002 0.0025
Time (s)
Pres
sure
(psi
)Probe Measurement

Results and Discussion: Unsteady 171
passing over the probe is added to the incoming unsteady wake fluctuations at each point
in time.
Figure 4.13 Shock and wake directions relative to total pressure probe
In order to accurately uncouple the shock/potential waves passing over the probe from
the unsteady wake profile, the signals have to be ensemble averaged. The ensemble
Fan Direction
FanShocks
InletFlow
IGV
Path ofShock Detected
by Probe
Path ofShock Impinging
IGV Surface
UnsteadyWake
Information

Results and Discussion: Unsteady 172
averaging is employed for the same reasons discussed in the Phase I investigation. Since
the shock/potential waves passing over the probe are independent of the information from
the unsteady wake profile, the shock/potential waves can be subtracted out of the signal
at each point in time for a given pressure-time trace in the wake region. Therefore, the
ensemble averaged pressure fluctuations from the clean inlet measurements, as shown in
Fig. 4.11, are subtracted from the ensemble averaged total pressure measurements in the
wake region at each point in time for a given pitchwise measuring location, as shown in
Fig. 4.14. The resulting pressure fluctuations are the unsteady wake information over one
fan revolution.

Results and Discussion: Unsteady 173
Figure 4.14 Uncoupled unsteady IGV wake at a given measuring location
In order to resolve the unsteady wake profiles spatially, the pressure signals at each
measuring location are phase locked to each fan revolution. The probe and the reflective
tape on the spinner (FOT) are fixed throughout the Phase II experiments. The IGV and
IGV ring are indexed circumferentially between runs to measure different pitchwise
locations, as shown in Fig. 4.10. At each of the pitchwise measuring locations, the FOT
initiates the data acquisition at the same exact fan position, regardless of the IGV
position. Therefore, at t = 0 in each data set, the fan is fixed relative to each pitchwise
Fan Direction
FanShocks
InletFlow
Probe
Unsteady Wake Profile
IGV
IGVWake
Shocks PassingOver Probe
Removed from Signal
-0.8
-0.4
0
0.4
0.8
0 0.0005 0.001
Time (s)
Pres
sure
(psi
)

Results and Discussion: Unsteady 174
measuring location. The pitchwise profile of the unsteady wake can then be resolved for
each point in time relative to the fan position.
Summary of Resolving the Unsteady Wake Profiles
The unsteady pressure fluctuations for a clean inlet, with no IGV, are measured, phase
locked and ensemble averaged for each fan speed tested. The IGV is then indexed to
each pitchwise measuring location where the pressure fluctuations are measured, phase
locked and ensemble averaged. The unsteady pressure fluctuations from the clean inlet
measurements, which are comprised of passing shock/potential waves only, are
subtracted from each of the pitchwise signals at each point in time over one fan
revolution. The unsteady wake profiles are then obtained over the entire pitchwise
measuring range for each point in time over one average blade pass.

Results and Discussion: Unsteady 175
4.2.2 Clean Inlet Investigation
Initial unsteady total pressure measurements were conducted with a clean inlet, i.e. no
IGV, with the probe sensing head located 0.26 CF upstream of the fan. Measurements
were conducted at subsonic relative fan speeds of 10 and 11k rpm, and transonic relative
fan speeds of 12, 13 and 14k rpm. Since there are no obstructions upstream of the probe
location, the time averaged inlet total pressure is equal to the atmospheric pressure. The
unsteady pressure profiles measured with the probe detect the upstream propagating
potential flow and shock waves from the subsonic and transonic fan, respectively, as
shown in Fig. 4.11. Results showed high amplitude pressure fluctuations with maximum
P-P amplitudes of 1.4 psi and 7 psi for the 11k and 14k rpm fan speeds, respectively.
These correspond to 10 and 50% of the inlet total pressure. Probasco, et. al, (1998) also
found maximum pressure amplitudes as high as 7 psi for the same measuring location,
relative to the rotor chord, in the transonic compressor rig at CARL, as discussed in
section 1.2. These results demonstrate how severe the upstream propagating forcing
function, generated by the fan passing shocks, would be on an IGV located 0.26 CF
upstream of the fan, which is a typical IGV-fan spacing in new engine designs.
The average P-P pressure amplitudes for the raw and ensemble-averaged data are shown
in Figure 4.15, for the fan speeds tested. The average amplitudes for the raw data
correspond to 3.5, 5.0, 9.8, 19.8, and 28.9% of the inlet total pressure for each fan speed.
The ensemble averaging reduces the average pressure amplitudes, with a maximum

Results and Discussion: Unsteady 176
reduction of 30% at 14k rpm, which is the same as those observed in the Phase I
investigation.
Figure 4.15 Average P-P pressure fluctuations with clean inlet
The power spectral density (PSD) of the unsteady pressure signals at 14k rpm is shown in
Fig. 4.16. The fundamental frequency for the pressure signal is the blade passing
frequency, with smaller higher order harmonics of the BPF, similar to the PSD figures of
the on-blade measurements. This result shows that decreasing the measuring location
relative to the fan does not significantly increase the higher harmonic content of the
pressure fluctuations. Probasco, et. al, (1998) reported that the significance of higher
harmonic content of IGV surface pressure measurements increased with decreased axial
spacing. However, this study used multiple IGV, where only a single IGV is used in the
current study. Therefore, the increased significance of higher order harmonics in the
Probasco study is most likely the result of the increasing strength of the shock reflections
012345
8 10 12 14 16
Fan Speed (kRPM)
Pres
sure
(psi
g)
Raw
100 EnsembleAvg.

Results and Discussion: Unsteady 177
off of the adjacent vanes, and not the result of the axial measuring location upstream of
the fan.
Figure 4.16 PSD at 14k rpm fan speed with clean inlet
4.2.3 Subsonic Fan
Time Averaged Wakes
The total pressure wake profiles of the IGV were measured with a high frequency PT
located between the IGV and fan, facing upstream toward the IGV, at a radial immersion
of 1.1 in from the cowl for 10 and 11k rpm fan speeds. The sensing head of the probe is
located 0.15 CIGV downstream of the IGV trailing edge, and 0.26 CF upstream of the fan
leading edge. Since the probe was fixed to the engine casing, the IGV was
0 5 10 15 20 250
1000
2000
3000
4000
5000
6000
7000
8000
9000
10000
Frequency (kHz)
PSD

Results and Discussion: Unsteady 178
circumferentially indexed between runs to measure the wake profiles in the pitchwise
direction.
The time averaged total pressure measurements of the IGV wake profiles near the fan for
the subsonic fan speeds are shown in Figure 4.17. These wake profiles are compared to
baseline experiments, where steady IGV wake measurements were taken with the IGV
far upstream of the aerodynamic influence of the fan, which were presented in section
3.2. These results show that the wakes are compressed into the direction of the rotor by
the fan’s upstream propagating PFF, while the wake width of each wake is reduced by
approximately 12.5% for each fan speed compared to the baseline. The maximum wake
deficit for both fan speeds is 40% higher than the baseline. Furthermore, the wakes are
turned approximately 0.5° into the direction of the fan when compared to the baseline.
To determine the effects of the wake-PFF interaction on the average aerodynamic losses
generated by the wakes, the total pressure loss coefficient is found by integrating the
wake profiles, using Eq. 2.11. The total pressure loss coefficient of the time averaged
wakes was found to be 32% and 27% lower when compared to the baseline for 10
and 11k rpm, respectively. Therefore, for subsonic relative fan speeds, close IGV-fan
spacing is beneficial to the compressor stage by reducing the average aerodynamic losses
generated by the IGV wakes. However, close IGV-fan spacing has a detrimental effect
on the average magnitude of the forcing function (IGV wake deficit) that impinges on the
downstream fan. The close spacing actually produces a 40% increase in the magnitude of
the forcing function compared to the baseline, which may significantly increase rotor

Results and Discussion: Unsteady 179
blade loading, leading to HCF failures. This further demonstrates the need to investigate
the effectiveness of TEB flow control for typically close IGV-rotor spacings.
Figure 4.17 Time averaged PT wake profiles at subsonic fan speeds
0.98
0.985
0.99
0.995
1
1.005
-0.5 -0.25 0 0.25 0.5
Far-UpstreamNear Fan
0.9750.98
0.9850.99
0.9951
1.005
-0.5 -0.25 0 0.25 0.5
Far UpstreamNear Fan
11k rpm
10k rpmFan Direction
Pitchwise Direction (x/t)
P T /
P T∞∞ ∞∞

Results and Discussion: Unsteady 180
Previous investigations have shown that decreased component spacing in axial
compressors with subsonic rotor speeds increases the isentropic efficiency of the stage,
as discussed in section 1.2 (Mikolajczak, 1976; Smith 1970). Smith (1996, 1966) has
attributed 25-50% of this gain to “wake recovery”, the reversible inviscid wake
attenuation caused by the wakes passing through (between) the downstream blade rows.
The wake recovery theory characterizes the attenuated wake profiles as simultaneously
being compressed in the pitchwise direction while “stretching” in the flow direction
(larger wake deficit) when passing through the downstream blade row. Even though the
wake deficit is increased, the compression in the pitchwise direction produces an overall
wake profile with less aerodynamic losses, thereby increasing the isentropic efficiency of
the stage.
The results of the current study show IGV wake attenuation before the wake passes
through the downstream blade row. The IGV wake profile is consistent with the wake
recovery theory characteristics, i.e. compressed in the pitchwise direction and stretched in
the axial direction. Furthermore, the aerodynamic losses are reduced significantly
compared to the baseline wake. Therefore, these results show that reversible wake
recovery is occurring due only to the fan PFF interaction with the IGV wakes.
Several previous investigations have studied the effects of the PFF from downstream
stators on the wakes of upstream rotors. In the most recent study, Wo, et. al, (1999)
showed that the rotor wake deficit is reduced by the downstream stator PFF in a low
speed compressor rig. However, the wake attenuation was the result of axial

Results and Discussion: Unsteady 181
compression of the wake, not the pitchwise compression of the wake seen in the current
study for the IGV. In the rotor-stator wake-PFF interactions, the PFF of the stator is
fixed in the axial direction upstream from the stator leading edge; therefore the rotor
wakes are compressed in the axial direction. However, in stator-rotor wake-PFF
interactions, the rotor PFF propagates upstream along a curve in the direction of the rotor
(Falk, 1998), interfering with the side of the wake facing into the rotor direction, thereby
compressing the wake in the pitchwise direction. Therefore, the PFF-wake interactions
between stator-rotor are not analogous to the interactions between rotor-stator. To the
author’s knowledge, the current study is the first to show that wake recovery occurs in the
freestream due to the upstream propagating PFF interactions of a rotor with the wakes of
an upstream stator. The only previous study that measured the wakes of IGV upstream of
a subsonic rotor at close spacing (Johnson and Fleeter, 1996 and 1998) did not report
measuring a baseline wake, i.e. outside of the rotor aerodynamic influence. Therefore,
that study did not address the effects of the fan PFF on average wake shape or losses.
Unsteady Wake Profiles
This section will first compare the results of the current study with a very similar
previous investigation. The method for reducing the unsteady wake profiles in that study
will be employed for the current results and compared. An improved method for
resolving the unsteady IGV wake profiles will then be employed for the current results,
as discussed in section 4.1.1. The results of this unique method will then be presented
and discussed.

Results and Discussion: Unsteady 182
The interaction of a rotor’s upstream propagating PFF on upstream stators at close
spacing has only recently gained attention, as discussed in section 1.2. Therefore, there is
a very limited amount of information regarding the unsteady effects of the rotor PFF on
the wakes generated by upstream stators. The investigations by Johnson and Fleeter
(1996, 1998), discussed in section 1.2, provide the only published measurements of IGV
wakes located at close proximity to a downstream subsonic rotor. That study measured
the total pressure wake profiles of the IGV with a high frequency probe located between
the IGV and rotor under similar conditions to the current study. Fleeter reported that the
rotor unsteady PFF interacts constructively and destructively with the IGV wake over
each blade pass. The constructive interference increased the wake deficit and width,
while the destructive interference produced the opposite effect. This conclusion was
reached by time resolving the minimum and maximum unsteady wake profiles.
Figure 4.18 shows the average level of pressure unsteadiness in the Fleeter studies for
close IGV-rotor spacing as measured with as total pressure probe. The minimum and
maximum wake profiles were obtained by taking the average min/max pressure observed
at each of the pitchwise locations measured using the ensemble-averaged data. Using this
method for the results in the current study, Fig. 4.19 shows the average maximum, mean
and minimum IGV wake profiles for the 11k rpm fan speed. These results agree well
with the results from Fleeter, in that the magnitude of the unsteady pressure fluctuations
are increased in the wake region when compared to the fluctuations outside of the wake.

Results and Discussion: Unsteady 183
In other words, the unsteadiness in the wake region is greater than that measured in the
surrounding flow.
Figure 4.18 Average excursions about the mean (Johnson and Fleeter, 1996)
Figure 4.19 Average excursions about the mean in the current study at 11k rpm
0.97
0.98
0.99
1
1.01
-0.5 -0.25 0 0.25 0.5
Pitchwise Direction (x/t)
P T/P
To
MAXMeanMIN

Results and Discussion: Unsteady 184
In order to obtain the unsteady wake profiles in the pitchwise direction, the pressure
signals have to be time resolved. This is done by taking one point in time from each of
the pitchwise measuring locations, which are phase locked to the rotor relative position
and ensemble averaged. These points are then resolved into a spatial wake profile at one
point in time, an example of which is shown in Fig. 4.20. Note that the normalized total
pressure signals are offset for the example and the actual number of pitchwise locations
used in the study is greater than shown.
Figure 4.20 Example of time resolved wake profile at one instant in time
0.95
1
1.05
1.1
1.15
1.2
1.25
0 0.25 0.5 0.75 1
Time (ms)
P T/P
To
0.96
1.01
-0.5 -0.25 0 0.25 0.5
Pitchwise Direction (x/t)
P T/P
To
Pressure Signalsfrom Pitchwise
Measuring Locations
One Wake Profilein Time

Results and Discussion: Unsteady 185
Fleeter’s conclusion that the rotor PFF destructively and constructively interacts with the
IGV wake was drawn from the time resolved wake profiles, which showed a maximum
and minimum in the wake deficit over one blade pass, as shown in Fig. 4.21 from that
study. Using this method, the destructive and constructive interference of the IGV wake
in the current study is shown in Fig. 4.22 at 11k rpm. These results clearly show the
constructive and destructive interference of the fan PFF on the IGV wakes as defined by
Fleeter.
Figure 4.21 Rotor PFF destructive and constructive interaction with IGV wake
(Johnson and Fleeter, 1998)

Results and Discussion: Unsteady 186
Figure 4.22 Fan PFF destructive and constructive interaction with IGV wake
(Current Study)
The problem with time resolving the wake profiles in this fashion is that the static
pressure from the fan’s potential flow waves passing over the probe are added to the total
pressure measurements in the wake region at each point in time, as discussed in section
4.1.1. The results from the clean inlet measurements, presented previously, showed that
pressure fluctuations were passing over the probe at the fan BPF. Therefore, the pressure
fluctuations measured by the probe in the wake region are a combination of the upstream
passing PFF and the unsteady wake measurements. This is evident from Figures 4.20 and
4.22, which are from the current study. The pressure fluctuations in the freestream,
outside the wake region, are identical in amplitude and phase to the pressure fluctuations
measured with the clean inlet. Therefore, the freestream flow and the IGV wakes are not
actually oscillating in this fashion with each blade pass. Assuming that the unsteadiness
0.96
0.98
1
1.02
-0.5 -0.25 0 0.25 0.5
Pitchwise Direction (x/t)
P T/P
T ∞∞ ∞∞ DestructiveConstructive

Results and Discussion: Unsteady 187
in the clean inlet measurements is due only to the passing PFF, the normalized total
pressure in the freestream should be equal to unity regardless of the fan position. This
assumption is based on the fact that the amplitude of the unsteady fluctuations measured
with the probe in the clean inlet agreed well with previously reported on-blade and casing
mounted pressure measurements taken at the same axial location relative to the fan, as
discussed in section 2.1. Therefore, in order to accurately resolve the unsteady wake
profiles, the phase-locked ensemble-averaged measurements from the clean inlet are
subtracted from each of the phase-locked ensemble-averaged pitchwise measurements
downstream of the IGV, in each point in time, before the wakes are time resolved; as
described in detail in section 4.1.1.
Figure 4.23 shows the average P-P amplitudes of the ensemble-averaged pressure
fluctuations at each pitchwise location, after subtracting out the pressure fluctuations
from the clean inlet, as described above. Note that the maximum P-P amplitude occurs at
the x/t = +0.21 pitchwise location, and is substantially larger than the other amplitudes. It
is believed that this is caused by a potential wave reflection off of the IGV surface, which
will be discussed further in the following paragraph. By using the improved method, the
unsteadiness of the pressure fluctuations in the freestream flow is removed and the
normalized total pressure is reduced to unity. Furthermore, the unsteadiness in the wake
region is well preserved. Discounting the P-P amplitude at x/t = +0.21 (wave reflection),
the unsteadiness in the wake region is shown to be greatest at the pitchwise location
corresponding to the largest wake deficit, x/t = -0.07. The unsteadiness then decreases to

Results and Discussion: Unsteady 188
either side of this location until it is reduced to zero outside of the wake region, i.e. in the
freestream. Therefore, the unsteadiness in the wake, caused by the fan PFF, is at a
maximum at the location corresponding to the maximum wake deficit, and decays at each
pitchwise measuring location away from the maximum.
Figure 4.23 Average P-P pressure amplitude in wake region
Using the improved method for time resolving the total pressure wake profile, the wakes
with the smallest and greatest wake deficit over an average blade pass are shown in Fig.
4.24 for both fan speeds tested. These results clearly show that the PFF from the fan
destructively and constructively interferes with the IGV wakes with each blade pass.
These results also show a fluctuation in pressure at the x/t = +2.1 pitchwise measuring
location, which is consistent for both fan speeds. It is believed that this is due to a
potential wave reflection off of the IGV surface at each blade pass, which is directed
downstream into the probe. This assumption is based on the fact that the time averaged
00.10.20.30.40.5
-0.5 -0.25 0 0.25 0.5
Pitchwise Direction (x/t)
P-P
P T A
mpl
itude
(psi
g)
11k10k

Results and Discussion: Unsteady 189
normalized total pressure at this location does not indicate any losses in the flow, and that
the total pressure is greater than unity at the maximum value of the fluctuation.
Figure 4.24 Destructive (DI) and constructive (CI) interference of the IGV wake
0.97
0.98
0.99
1
1.01
-0.4 -0.2 0 0.2 0.4
DIMeanCI
0.97
0.98
0.99
1
1.01
-0.4 -0.2 0 0.2 0.4
DIMeanCI
Pitchwise Direction (x/t)
P T/P
T∞∞ ∞∞
Fan Direction
10k
11k

Results and Discussion: Unsteady 190
The results of the time resolved wakes on the previous page show that the constructive
interference increases both the wake deficit and wake width. The destructive interference
reduces the wake deficit, but does not substantially increase or decrease the wake width.
The total pressure loss coefficient, Eq. 2.11, is reduced by 7% and increased by 40% for
the destructively (DI) and constructively (CI) interfered wakes when compared to the
time-averaged wake for both speeds. However, the forcing function (IGV wake deficit)
is increased by 34% and 48% for the CI wakes when compared to the time-averaged
wake for 10k and 11k rpm fan speeds, respectively. This corresponds to an 84% and
100% increase in the forcing function when compared to the baseline wake. The forcing
function of the DI wakes is reduced by 24% and 27% when compared to the time-
averaged wake for 10k and 11k. These correspond to the same magnitude as the forcing
function of the baseline case, within 1%. Therefore, depending on which of these wake
profiles impacts the rotor, or perhaps a profile in between, the forcing function on the
downstream fan blades would be between the same and twice that of what is predicted by
measuring the wake of an isolated vane.
During the placement of the fiber-optic sensor, the reflective tape was positioned on the
spinner so that the trigger would initiate the DAQ when the leading edge of one particular
fan blade was at the 12 O’clock position, directly downstream of the total pressure probe,
as discussed in section 2.3.1.4. Therefore, the relative position of each fan blade to both
the probe and IGV trailing edge was known in time for each of the measurements. In
order to interpret these results, the behavior of the fan PFF must be understood.

Results and Discussion: Unsteady 191
A previous investigation of the upstream propagating PFF in the F109 engine showed
that the potential waves travel upstream from the fan leading edge, along a curve, in the
direction of the fan rotation, propagating upstream at the local sonic velocity, as
discussed in section 1.2 (Falk, 1998). In other words, the maximum potential wave
magnitude generated by a fan blade is detected upstream before that blade passes, and the
minimum potential wave magnitude is detected after one-half a blade passage from the
maximum. The maximum potential wave generates an increased pressure resistance to
the incoming inlet flow, where the minimum potential wave produces a decreased
resistance. Therefore, it is assumed that the time-resolved destructive interference of an
incoming wake is due to this increased resistance of the maximum fan PFF before the
potential wave-generating fan blade passes. The time-resolved constructive interference
is then due to the reduced resistance after one-half a blade passage after the DI is
observed.
Results from the clean inlet measurements show that the maximum pressure from the
PFF occurs when the fan blade leading edge is 55.5° from the IGV trailing edge relative
to the flow direction. In other words, the fan PFF is traveling into the wake at 34.5°
relative to the fan direction, which is consistent for both fan speeds. Since the potential
waves travel upstream along a curve in the direction of the rotor, this angle may differ
when measuring at a different axial spacing. Figures 4.25 and 4.26 show the direction of
the PFF, and the relative fan blade position to the IGV and probe at the instant in time

Results and Discussion: Unsteady 192
corresponding to the DI and CI wake profiles for the 10k and 11k rpm fan speeds,
respectively. These results show that as the leading edge of a fan blade approaches the
IGV wake, the upstream propagating potential wave destructively interferes with the
wake. This is consistent for both fan speeds tested. The constructively interfered wake
occurs between the maximum potential waves, after one-half a blade passage after the DI
profile is observed. This is consistent for both fan speeds tested. It appears from these
results that the CI wake, which has the maximum wake deficit, is ingested into the fan
passage (between blades), which is the path of the least flow resistance. Therefore, it is
speculated that the forcing function on the downstream fan blade suction surface is that of
the time resolved wake profile with the maximum magnitude (wake deficit). If this is the
case, the forcing function on the downstream fan is twice that predicted from the baseline
wake measurements. This would suggest that the forcing function prediction codes based
on linear cascade wake measurements and empirical wake correlations are under-
predicting the magnitude of the forcing function on the fan, for typical IGV-fan spacing
at subsonic relative fan speeds.

Results and Discussion: Unsteady 193
Figure 4.25 Relative position of fan for DI and CI, 10k rpm fan speed
Fan Direction
InletFlow
Destructive Interference
Constructive Interference
0.97
0.98
0.99
1
1.01
-0.4 -0.2 0 0.2 0.4Pitchwise Direction (x/t)
P T/P
T ∞∞ ∞∞
0.97
0.98
0.99
1
1.01
-0.4 -0.2 0 0.2 0.4
PFF
PFF
34.5°
Probe

Results and Discussion: Unsteady 194
Figure 4.26 Relative position of fan for DI and CI, 11k rpm fan speed
0.97
0.98
0.99
1
1.01
-0.4 -0.2 0 0.2 0.4Pitchwise Direction (x/t)
P T/P
T ∞∞ ∞∞
0.97
0.98
0.99
1
1.01
-0.4 -0.2 0 0.2 0.4
Fan Direction
InletFlow
Destructive Interference
Constructive Interference
PFF
PFF
34.5°
Probe

Results and Discussion: Unsteady 195
In order to show the unsteady behavior of the wake over one fan blade pass, various
points in time are chosen from the pressure-time trace at the pitchwise measuring location
corresponding to the greatest wake deficit in the time-averaged wake. Figure 4.27 shows
the pressure-time trace for one averaged blade pass at x/t = -0.7. Eight points in time are
chosen, as indicated by the circles, which correspond to t = 0, 0.125, 0.25, 0.375, 0.5,
0.625, 0.75, and 0.875 as a fraction of one blade pass. The points t = 0.25 and 0.75
correspond to the DI and CI cases, respectively.
Figure 4.27 Points in time for one fan blade pass at x/t = -0.7
The time resolved wake profiles for one blade pass are shown in Fig. 4.28 over the
positions in time described above for the 11k rpm fan speed. The triangle marks on the
pitchwise axis represent the location of the fan blade leading edge relative to the
pitchwise measuring locations at each instant in time. Note that the pitchwise axis is
stretched outside of the measuring range (±0.5) in order to show the relative fan blade
-0.2
-0.1
0
0.1
0.2
0 0.05 0.1 0.15 0.2
Time (ms)
Pres
sure
(psi
g)

Results and Discussion: Unsteady 196
positions. The normalized total pressure outside the measuring range was assumed to be
unity. The same wake profiles are shown in Figure 4.29 over the actual measuring range.
The wake with the minimum deficit, DI, and maximum deficit, CI, are shown at t = 0.25
and 0.75, respectively, which are the same wakes shown in Fig. 4.26. The destructive
interference of the IGV wake begins at t = 0.875 as the next fan blade approaches, the
wake deficit begins to decrease and the wake width begins to increase. The DI continues
to reduce the wake deficit and increase the wake thickness at t = 0 and 0.125, reaching a
maximum interference at t = 0.25 where the wake deficit is at the minimum value and the
wake width is at a maximum. The wake profile at t = 0.125 is a combination of the IGV
wake and the assumed potential wave reflection off of the IGV surface, and therefore is
not a split wake. The constructive interference of the wake begins at t = 0.375 where the
wake deficit begins to increase and the wake width begins to decrease. Even though the
fan blade is still approaching the IGV wake measured upstream, the strength of the
potential wave is waning. In other words, at this point the maximum potential wave has
passed the wake region in the direction of the fan. The wake deficit growth continues for
t = 0.5 and 0.625. At t = 0.75 the CI reaches a maximum, where the wake deficit is at the
maximum level and the wake thickness is at a minimum. At t = 0.875, the process begins
to repeat for the next blade pass. These results clearly show that the IGV wake is highly
unsteady over each fan blade pass due to the interaction of the wake with the fan PFF.
Both the wake deficit and wake widths are shown to vary over the fan blade pass.

Results and Discussion: Unsteady 197
Figure 4.28 Time resolved wake profiles over one fan blade pass at 11k rpm
with fan blade relative position
0.960.970.980.99
11.011.02
-3 -2 -1 0 1 2 3Pitchwise Direction (x/t)
P T/P
T∞∞ ∞∞
0.960.970.980.99
11.011.02
-3 -2 -1 0 1 2 3
0.960.970.980.99
11.011.02
-3 -2 -1 0 1 2 3
0.960.970.980.99
11.011.02
-3 -2 -1 0 1 2 3
0.960.970.980.99
11.011.02
-3 -2 -1 0 1 2 3
0.960.970.980.99
11.011.02
-3 -2 -1 0 1 2 3
0.960.970.980.99
11.011.02
-3 -2 -1 0 1 2 3
0.960.970.980.99
11.011.02
-3 -2 -1 0 1 2 3
t = 0
t = 0.125
t = 0.25
t = 0.375
t = 0.5
t = 0.625
t = 0.75
t = 0.875
Fan Direction Fan BladeLeading-edge

Results and Discussion: Unsteady 198
Figure 4.29 Time resolved wake profiles over one fan blade pass at 11k rpm
t = 0.5
0.96
0.98
1
1.02
-0.5 -0.25 0 0.25 0.5
t = 0
0.96
0.98
1
1.02
-0.5 -0.25 0 0.25 0.5
t = 0.125
0.96
0.98
1
1.02
-0.5 -0.25 0 0.25 0.5
t = 0.625
0.96
0.98
1
1.02
-0.5 -0.25 0 0.25 0.5
t = 0.75
0.96
0.98
1
1.02
-0.5 -0.25 0 0.25 0.5
t = 0.25
0.96
0.98
1
1.02
-0.5 -0.25 0 0.25 0.5
t = 0.375
0.96
0.98
1
1.02
-0.5 -0.25 0 0.25 0.5
t = 0.875
0.96
0.98
1
1.02
-0.5 -0.25 0 0.25 0.5
Pitchwise Direction (x/t)
P T/P
T∞∞ ∞∞
Fan Direction

Results and Discussion: Unsteady 199
Since one of the goals of the current study is to investigate TEB flow control between a
closely spaced IGV-fan, the results presented in this section suggest possible limiting
factors in the effectiveness of TEB to reduce the total pressure deficit in the IGV wake.
The fan PFF has been shown to compress the time-averaged wake in the pitchwise
direction and turn the wake in the direction of the rotor. Therefore, the direction of the
TEB jets may deviate from the direction of the wake. Furthermore, the time resolved
wake profiles show that the fan PFF destructively and constructively interferes with the
IGV wake width and deficit. The IGV wake has been shown to be unsteady over each
fan blade passing. Therefore, it is not known whether the TEB jets will respond to this
unsteadiness.

Results and Discussion: Unsteady 200
4.2.4 Transonic Fan
Using the same set-up and procedures at the subsonic fan measurements, both time
averaged and unsteady wake measurements were performed for fan speeds of 12k, 13k
and 14k rpm, which are transonic relative to the fan blade velocity. These correspond to
85, 90 and 100% of the maximum fan speed, respectively. The testing set-up and
procedures are found in section 2.3.3. To the author’s knowledge, this is the first
published experimental study to investigate the unsteady wake profiles of an IGV placed
at a typical spacing to a downstream transonic fan.
Time Averaged Wakes
The time averaged total pressure measurements of the IGV wake profiles near the fan for
the transonic speeds are shown in Fig. 4.30. These wake profiles are compared to the
baseline experiments, where the IGV wake measurements were performed with the IGV
far upstream of the aerodynamic influence of the fan, which were presented in section
3.2. These wake profiles clearly show that the IGV wake is considerably different in
shape and size when compared to the baseline and those at the subsonic fan speeds,
discussed previously. These results show that the fan shock interaction with the IGV
wakes and surface results in IGV wake profiles with considerable increases in wake
deficit and width when compared to the baseline. The maximum total pressure deficit in
the time-averaged wakes is 81, 93 and 100% greater than the baseline for the 12, 13, and
14k fan speeds. The wake width is increased by 25% for each fan speed when compared
to the baseline. Furthermore, the wakes are turned approximately 1° into the direction of

Results and Discussion: Unsteady 201
the fan rotation. To determine the effects of the IGV-shock and wake-shock interactions
on the average aerodynamic losses generated by the wakes, the total pressure loss
coefficient is found by integrating the wake profiles using Eq. 2.11. The total pressure
loss coefficient of the time averaged wakes are found to increase by a factor 1.60,
1.74 and 2.04 when compared to the baseline for 12, 13 and 14k fan speeds,
respectively. Therefore, for transonic relative fan speeds, close IGV-fan spacing is
detrimental to the performance of the compressor stage by increasing the average
aerodynamic losses generated by the IGV wakes. The IGV-shock and wake-shock
interactions produce the opposite effect at the same close spacing as compared to the
wake-PFF interactions at the subsonic fan speeds, where the aerodynamic losses were
substantially reduced. The close IGV-fan spacing also has a detrimental effect on the
average magnitude of the forcing function (wake deficit) for the transonic fan speeds.
The close spacing produces a 100% increase in the average forcing function magnitude
when compared to the baseline. A discussion of the plausible flow physics that generate
these wake profiles is discussed later with the presentation of the unsteady wake profiles.

Results and Discussion: Unsteady 202
Figure 4.30 Time averaged PT wake profiles at transonic fan speeds
0.950.960.970.98
0.991
1.01
-0.5 -0.25 0 0.25 0.5
Far UpstreamNear Fan
0.950.960.970.980.99
11.01
-0.5 -0.25 0 0.25 0.5
Far UpstreamNear Fan
0.950.960.970.980.99
11.01
-0.5 -0.25 0 0.25 0.5
Far UpstreamNear Fan
Fan Direction
Pitchwise Direction (x/t)
P T /
P T∞∞ ∞∞
12k rpm
13k rpm
14k rpm

Results and Discussion: Unsteady 203
As discussed in section 1.2, Gorrell and Copenhaver (1997) found that the isentropic
efficiency of a 1.5 stage transonic compressor rig was significantly decreased with
increased axial spacing between the IGV-rotor rows. These results were very surprising,
drawing an incredulous response. Up until this time it was commonly believed that
decreasing component spacing in axial compressors increased the isentropic efficiency
of the stage. This belief was based on the work by Smith (1970; 1966) and others, which
was previously discussed in section 2.1 and the subsonic results section. However, all of
these studies were performed in compressor rigs with subsonic relative blade velocities.
Therefore, after ruling out other possible sources for the decreased efficiency,
Copenhaver speculated that the IGV wake-rotor shock interaction must be the cause.
However, that study did not investigate the IGV wake profiles. The current study shows
that the IGV wake-shock interactions with the downstream fan result in a time-averaged
wake profile with total pressure loss coefficients that are a factor of 2 greater than the
baseline profiles and a factor of 5 greater than those in the subsonic investigation.
Therefore, this study conclusively shows that the IGV wake-shock interactions produce
significantly higher aerodynamic losses in the wake region compared to the same vane
location upstream of a subsonic rotor, which would subsequently reduce the stage
isentropic efficiency. Although the Copenhaver study did not mention it, it should be
noted that another contributing factor in the decreased efficiency might be the result of
shock reflections off of the IGV surface back into the downstream rotor.

Results and Discussion: Unsteady 204
Unsteady Wake Profiles
The time resolved unsteady wake profiles were obtained using the same methods
described in section 4.1.1 and were also presented with the subsonic fan results. The
results of the time resolved IGV wakes will first be presented, followed by a discussion
of the plausible flow physics generating these wake profiles.
Figure 4.31 shows the average P-P amplitudes of the ensemble-averaged pressure
fluctuations at each pitchwise location, after subtracting out the pressure fluctuations
from the clean inlet, for each of the transonic fan speeds tested. By using the improved
method, the unsteadiness of the pressure fluctuations in the freestream flow is removed
and the normalized total pressure is reduced to unity. Furthermore, the unsteadiness in
the wake region is well preserved. The unsteadiness in the wake region is shown to be
greatest at the pitchwise location corresponding to the largest wake deficit, x/t = -0.14.
The unsteadiness decreases to either side of this location until it is reduced to zero outside
of the wake region, i.e. in the freestream. The amplitude of the pressure fluctuations is
shown to increase substantially in the wake region with increasing fan speed.
Furthermore, the P-P amplitudes at the location of the maximum wake deficit, x/t = -0.14,
are 10 times greater than those observed at the location of maximum wake deficit at the
subsonic speeds. Therefore, the IGV wake-shock interactions generate unsteadiness in
the wake that is an order of magnitude greater than the unsteadiness generated by the
IGV wake-PFF interactions.

Results and Discussion: Unsteady 205
Figure 4.31 Average P-P pressure amplitudes in the IGV wake for transonic fan
Using the improved method for time resolving the total pressure wake profile, the wake
profiles with the minimum and maximum wake deficit over an average blade pass are
shown in Fig. 4.32 for each fan speed tested. These results show that the maximum wake
profiles are substantially wider and deeper than the time averaged wake. For the 14k fan
speed, the wake width is increased by 35%, and the wake deficit is increased by almost
three times. Interestingly, the minimum wake profiles show very little evidence of a
wake at all, with small variations in normalized total pressure about unity. A plausible
explanation for this is provided in a discussion following the presentation of the results.
These results also show possible shock reflections off of the IGV surface at x/t = +0.28 at
13 and 14k fan speeds.
00.5
11.5
22.5
-0.5 -0.25 0 0.25 0.5
Pitchwise Direction (x/t)
P-P
P T A
mpl
itude
(psi
g)
14k13k12k

Results and Discussion: Unsteady 206
Figure 4.32 Minimum and maximum time resolved wake profiles
0.85
0.9
0.95
1
1.05
-0.5 -0.25 0 0.25 0.5
MINMEANMAX
0.85
0.9
0.95
1
1.05
-0.5 -0.25 0 0.25 0.5
MINMEANMAX
0.85
0.9
0.95
1
1.05
-0.5 -0.25 0 0.25 0.5
MINMEANMAX
Fan Direction
Pitchwise Direction (x/t)
P T /
P T∞∞ ∞∞
12k rpm
13k rpm
14k rpm

Results and Discussion: Unsteady 207
The time resolved wake profiles over one average fan blade pass are shown in Fig. 4.33
for the 14k rpm fan speed. The triangle marks on the pitchwise axis represent the
location of the fan blade leading edge relative to the pitchwise measuring locations at
each instant in time. Note that the pitchwise axis is stretched outside of the measuring
range in order to show the relative fan blade positions. The normalized total pressure
outside the measuring range was assumed to be unity. The same wake profiles are shown
in Figure 4.34 over the actual measuring range. The profiles at t = 0.25 and t = 0.75
correspond to the points in time where the wake profiles show a minimum and maximum
wake deficit, respectively, and are the same as those shown in Fig. 4.32. After the time
of the maximum wake profile, t = 0.75, the wake begins to attenuate at t = 0.85. The
wake continues to attenuate at t = 0 and 0.125, reaching a minimum profile at t = 0.25.
After this point in time, the wake begins to either grow or develop again at t = 0.375. The
wake deficit and width continue to increase until the maximum is reached again at t =
0.75. A discussion of these results follows.

Results and Discussion: Unsteady 208
Figure 4.33 Time resolved wake profiles over one fan blade pass at 14k rpm
with fan blade relative position
0.80.850.9
0.951
1.05
-3 -2 -1 0 1 2 3Pitchwise Direction (x/t)
0.80.850.9
0.951
1.05
-3 -2 -1 0 1 2 3
0.80.850.9
0.951
1.05
-3 -2 -1 0 1 2 3
0.80.85
0.90.95
11.05
-3 -2 -1 0 1 2 3
0.80.850.9
0.951
1.05
-3 -2 -1 0 1 2 3
0.80.85
0.90.95
11.05
-3 -2 -1 0 1 2 3
0.80.850.9
0.951
1.05
-3 -2 -1 0 1 2 3
0.8
0.85
0.9
0.95
1
1.05
-3 -2 -1 0 1 2 3
t = 0
P T /
P T∞∞ ∞∞
t = 0.125
t = 0.25
t = 0.375
t = 0.5
t = 0.625
t = 0.75
t = 0.875
Fan Direction Fan Blade Leading Edge

Results and Discussion: Unsteady 209
Figure 4.34 Time resolved wake profiles over one fan blade pass at 14k rpm
0.80.850.9
0.951
1.05
-1 -0.5 0 0.5 1
0.80.850.9
0.951
1.05
-1 -0.5 0 0.5 1
0.80.850.9
0.951
1.05
-1 -0.5 0 0.5 1
0.80.85
0.90.95
11.05
-1 -0.5 0 0.5 1
0.80.85
0.90.95
11.05
-1 -0.5 0 0.5 1
0.80.850.9
0.951
1.05
-1 -0.5 0 0.5 1
0.80.85
0.90.95
11.05
-1 -0.5 0 0.5 1
0.8
0.85
0.9
0.95
1
1.05
-1 -0.5 0 0.5 1
Pitchwise Direction (x/t)
P T /
P T∞∞ ∞∞
t = 0
t = 0.125
t = 0.25
t = 0.375
t = 0.5
t = 0.625
t = 0.75
t = 0.875
Fan Direction

Results and Discussion: Unsteady 210
Discussion of Unsteady Wake Profiles
When the inlet flow is subsonic and the relative velocity of the fan blades is transonic,
bow shocks form just upstream of the fan blade leading edges, extending both upstream
into the inlet flow, and downstream into the neighboring blade passage, as shown in Fig.
4.11. The upstream portion of the shock wave propagates upstream at the local sonic
velocity, passing at the fan BPF (Sanders and Fleeter, 1999). These shock waves have
been shown to produce high amplitude pressure variations on the surface of an upstream
stator, as shown in this study, Sanders and Fleeter (1999), and Probasco (1998). Pressure
fluctuations as high as 4.7 psig P-P were found at the IGV trailing edge in the current
study. Unlike the subsonic fan PFF, which is believed to only interact with the IGV
wake, fan shock waves interact with both the IGV wake and the IGV surfaces.
Unfortunately, the interactions between these shock waves and the upstream IGV surface
are not well understood. Furthermore, the interaction of these shock waves with the
wakes of an upstream IGV has not previously been investigated.
In a very recently published article, Sanders and Fleeter (2000) provide a brief discussion
of the plausible affects of the upstream passing shock interactions on the boundary layer
of an upstream IGV, based on the 1999 paper. In the 1999 study, surface pressure
measurements were performed along the chord of both the suction and pressure surfaces
of an IGV placed at an axial distance upstream of a transonic rotor under similar
conditions as the current study, as discussed in section 1.2. The resulting pressure
fluctuations were phase-locked ensemble-averaged and time-resolved. These results

Results and Discussion: Unsteady 211
seemed to indicate that once the shock wave impacts the IGV pressure surface (surface
facing into rotor direction), it continues to move upstream along the IGV surface,
increasing in magnitude until a maximum is reached at about 10% chord upstream from
the trailing edge. At this point in time, a minimum pressure magnitude is observed at the
same chord location on the suction surface, 180° out of phase with that on the suction
surface. Sanders speculated that this was due to a pressure wave developing at the IGV
trailing edge periodically at the fan BPF. Sanders described this pressure wave as
forming at the point the shock wave reflects off of the IGV pressure surface, where a
significant increase in static pressure occurs on the surface. Since the flow field around
the IGV is subsonic, a pressure wave develops which “equalizes this over-pressurized
zone”.
An example of this is shown in Fig. 4.35 using the geometry of the current study. In the
region aft of the reflection point on the IGV surface, the static pressure increases
substantially, P2 > P1. The pressure wave described by Sanders would then develop in
the region surrounding P2, as shown in the figure. In the next instances in time, the shock
continues to propagate upstream along the IGV surface. Although it was not mentioned
in the study, in personal communication with the author, Fleeter (2000) speculates that
this pressure wave separates from the trailing edge of the IGV and propagates
downstream as a vortex, shedding off the vane at the fan BPF.

Results and Discussion: Unsteady 212
Figure 4.35 IGV trailing edge pressure wave
P1
P2Fan Shock
Fan Shocks
Probe
IGV
Fan Direction
InletFlow
Pressure Wave

Results and Discussion: Unsteady 213
In recent communications with Gorrell and Copenhaver (2000), an unpublished study
was recently performed where PIV measurements were taken in the transonic compressor
rig at CARL, Wright-Patterson AFB. Preliminary results seemed to indicate that the
passing rotor shocks generated visible flow separation at the trailing edge of the upstream
IGV. This separation then appeared to propagate downstream as a vortex, shedding off
the vane at the rotor BPF.
The results of the current study give credence to the pressure wave theory and the
Copenhaver observations. The time resolved wakes of the IGV appear to shed off of the
IGV at the fan blade passing frequency, as shown in Fig. 4.33 and 4.34. Furthermore, the
time averaged IGV wakes were shown to have much higher aerodynamic losses than the
baseline and subsonic wake profiles, which is symptomatic of fan shock induced
boundary layer separation on the IGV, thereby generating a larger wake profile.
Besides the fan shock interactions with the IGV surface, the fan shocks also periodically
interfere with the resulting wake. Therefore, it is possible that the minimum wake
profile, which shows little evidence of a wake, is due to complete destructive interference
by a passing shock and not a vortex separating from the vane at the BPF. In order to
determine if this is the case, measurements of the shocks passing over the probe must be
looked at carefully. The angle of the bow shocks could not be determined from the
measurements in the current study. However, the spacing between fan blades, coupled
with the spacing between the fan blades, probe and IGV, suggest that as one shock wave

Results and Discussion: Unsteady 214
is impacting the IGV surface, the next shock wave will interfere with the resulting wake,
as shown in Fig. 4.35. Therefore, the time resolved wake profiles are a result of the
combination of shock-IGV and shock-wake interactions. From the clean inlet and wake
measurements, it was determined that a shock wave passes over the total pressure probe
just prior to the occurrence of the maximum time resolved wake profile. Therefore, the
minimum wake profile is not caused by the destructive interference of a passing shock.
This further reinforces the assumption that the measured wake is shedding off of the vane
at the fan BPF.
The results of the time averaged and time resolved IGV wake profiles of the IGV located
at close proximity to a downstream transonic fan, present possible limiting factors in the
effectiveness of TEB. First, the time-averaged wakes are shown to be turned
approximately 1° into the rotor direction when compared to the baseline wakes.
Therefore, it is not known whether the TEB jets will follow or deviate from the turned
wake, as is the concern with the subsonic results. Furthermore, the minimum wake
profile in the time resolved results show little evidence of a wake at this point in the fan
blade pass. Therefore, it is not known whether the TEB jets will “over-blow” at this
point, generating a forcing function equal to the maximum wake deficit, but in the
opposite direction.

Results and Discussion: Unsteady TEB 215
5.0 Results and Discussion:
Unsteady Trailing Edge Blowing Flow Control The results from the unsteady wake measurements in the previous chapter demonstrated
some possible limiting factors for the effectiveness of TEB flow control to reduce the
IGV wake when the IGV is in close coupling with the downstream fan. The results from
the subsonic relative fan speeds showed that the time averaged IGV wake is compressed
in the pitchwise direction and is turned slightly into the direction of the fan rotation, when
compared to the baseline. Therefore, it is not known whether the TEB jet will follow or
deviate from the wake direction. Furthermore, the time resolved wake profiles showed
that the fan PFF destructively and constructively interferes with the IGV wake, causing
the wake to fluctuate in width and depth over each blade pass. Therefore, it is not known
whether the TEB jets will respond in the same manner to the fan PFF as the IGV wakes.
The results from the transonic relative fan speeds showed that the time averaged IGV
wake is turned into the fan rotation, and is considerably wider with a significantly larger
wake deficit when compared to the baseline. Therefore, it is not known whether the TEB
jets will expand in the pitchwise direction to fill this thicker wake, and whether the TEB
holes will choke since a higher momentum flow would be needed to fill in the deeper
wake. The time resolved wake profiles for the transonic fan case indicate that the IGV
wake is shedding off of the vane at the fan BPF due to the boundary layer shock
interactions, where the minimum wake profile over each fan blade pass is near unity.
This presents the greatest possible limiting factor of TEB. Even if the TEB fills in the

Results and Discussion: Unsteady TEB 216
maximum wake shed off of the vane during the blade pass, the TEB jet may over-blow
when the minimum wake is encountered over the blade pass. Therefore, even though the
maximum wake is filled, the jet would produce a forcing function on the rotor in the
opposite direction of the wake when the wake profile is at the minimum. Finally,
pressure fluctuations as high as 4.7 psi were detected on the IGV trailing edge in the
Phase I investigation. These high amplitude pressure fluctuations may generate a
periodic resistance on the TEB jets at the fan BPF, thereby reducing the effectiveness of
the wake filling. This final section in the presentation of the results of this study will
attempt to answer these questions.
A series of experiments were conducted to determine if trailing edge blowing (TEB) flow
control in an IGV could eliminate the low pressure and velocity wake profiles (deficits)
in the wakes of an IGV placed in close proximity to a downstream fan. Experiments
were conducted for both subsonic and transonic relative fan speeds. Unsteady total
pressure measurements of the IGV wake region were repeated with IGV TEB flow
control. This investigation used the same testing set-up and measuring procedures which
were used in the unsteady wake investigation, with the addition of the flow control
scheme, discussed in section 2.1.5. For each fan speed tested, the IGV was
circumferentially indexed so that the total pressure probe was at the pitchwise location,
relative to the IGV, which corresponds to the location where the maximum wake deficit
was observed in the time-averaged wake profiles of the previous section. After the
engine was brought to the desired speed, the TEB air supply pressure was adjusted so that
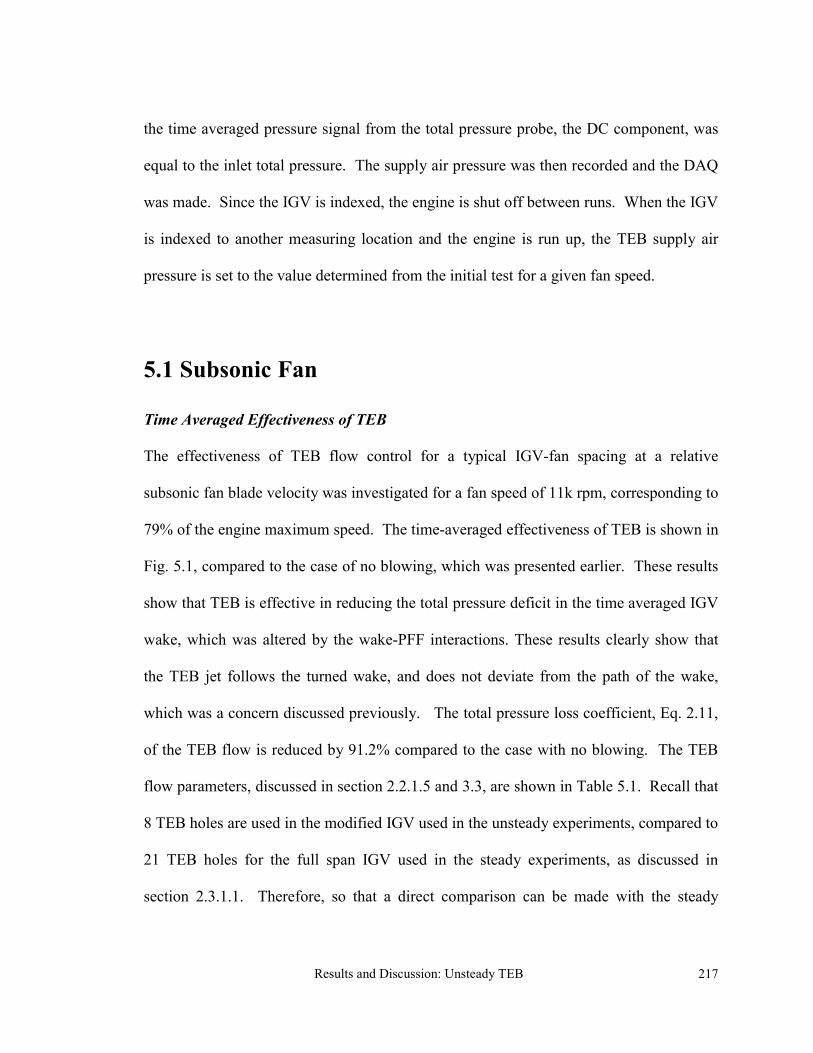
Results and Discussion: Unsteady TEB 217
the time averaged pressure signal from the total pressure probe, the DC component, was
equal to the inlet total pressure. The supply air pressure was then recorded and the DAQ
was made. Since the IGV is indexed, the engine is shut off between runs. When the IGV
is indexed to another measuring location and the engine is run up, the TEB supply air
pressure is set to the value determined from the initial test for a given fan speed.
5.1 Subsonic Fan
Time Averaged Effectiveness of TEB
The effectiveness of TEB flow control for a typical IGV-fan spacing at a relative
subsonic fan blade velocity was investigated for a fan speed of 11k rpm, corresponding to
79% of the engine maximum speed. The time-averaged effectiveness of TEB is shown in
Fig. 5.1, compared to the case of no blowing, which was presented earlier. These results
show that TEB is effective in reducing the total pressure deficit in the time averaged IGV
wake, which was altered by the wake-PFF interactions. These results clearly show that
the TEB jet follows the turned wake, and does not deviate from the path of the wake,
which was a concern discussed previously. The total pressure loss coefficient, Eq. 2.11,
of the TEB flow is reduced by 91.2% compared to the case with no blowing. The TEB
flow parameters, discussed in section 2.2.1.5 and 3.3, are shown in Table 5.1. Recall that
8 TEB holes are used in the modified IGV used in the unsteady experiments, compared to
21 TEB holes for the full span IGV used in the steady experiments, as discussed in
section 2.3.1.1. Therefore, so that a direct comparison can be made with the steady

Results and Discussion: Unsteady TEB 218
baseline experiments, the mass flow required for TEB in the unsteady experiments was
determined for one hole and multiplied by 21. This represents the mass flow required for
a full span IGV with the same span as the F109 fan blades. This result is listed in Table
5.1.
Figure 5.1 TEB flow control compared to wake—subsonic fan
Mass Flow (m••••
TEB/m••••∞∞∞∞) 8 holes 0.0088% per modified IGV
Mass Flow (m••••TEB/m••••
∞∞∞∞) 21 holes—full span 0.023% per IGV TEB Line Pressure (PT(TEB)/PT∞∞∞∞) 1.19
Avg. TEB Jet Velocity (uj/U∞∞∞∞) 1.043 Max. TEB Jet Velocity (ujmax/U∞∞∞∞) 1.782
Blowing Coefficient, CB [(ρρρρu)j/(ρρρρU)∞∞∞∞] 1.085 Momentum Coefficient, Cµµµµ [(ρρρρu2)j/(ρρρρU2)∞∞∞∞] 1.132
Discharge Coefficient, Co 0.64
Table 5.1 TEB flow parameters for subsonic fan—11k rpm
0.97
0.98
0.99
1
1.01
-0.5 -0.25 0 0.25 0.5
Pitchwise Direction (x/t)
P T/P
T ∞∞ ∞∞
Near FanWakeTEB
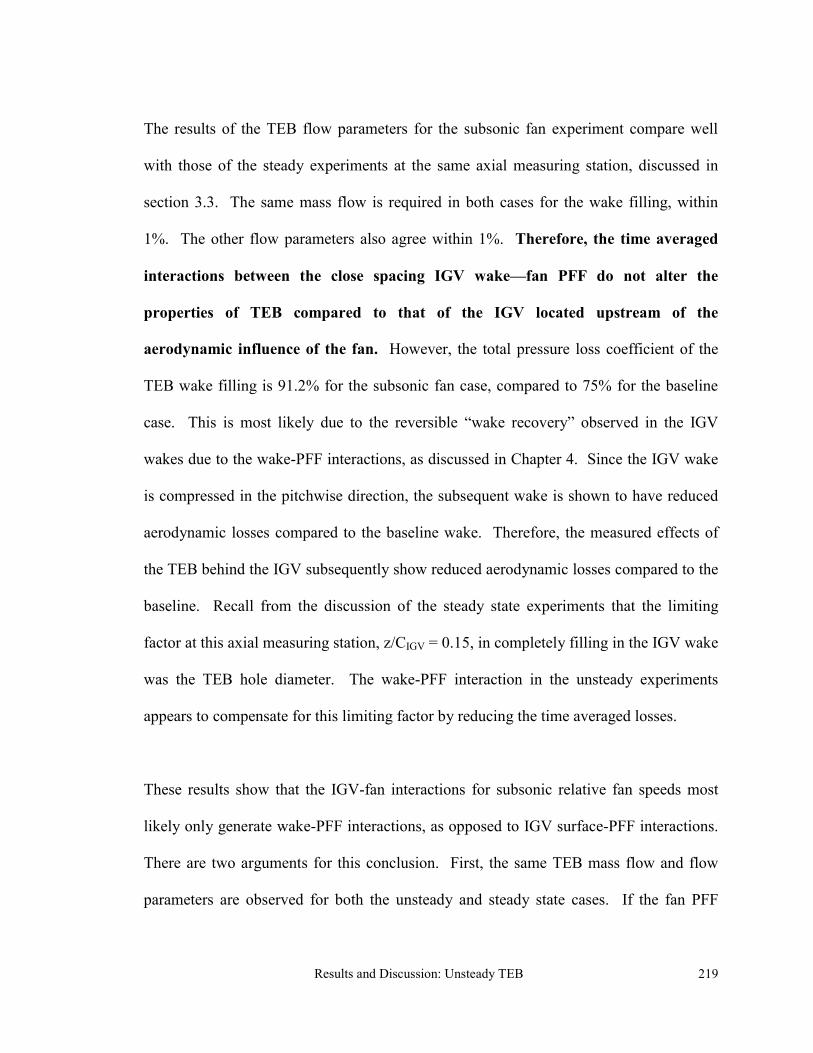
Results and Discussion: Unsteady TEB 219
The results of the TEB flow parameters for the subsonic fan experiment compare well
with those of the steady experiments at the same axial measuring station, discussed in
section 3.3. The same mass flow is required in both cases for the wake filling, within
1%. The other flow parameters also agree within 1%. Therefore, the time averaged
interactions between the close spacing IGV wake—fan PFF do not alter the
properties of TEB compared to that of the IGV located upstream of the
aerodynamic influence of the fan. However, the total pressure loss coefficient of the
TEB wake filling is 91.2% for the subsonic fan case, compared to 75% for the baseline
case. This is most likely due to the reversible “wake recovery” observed in the IGV
wakes due to the wake-PFF interactions, as discussed in Chapter 4. Since the IGV wake
is compressed in the pitchwise direction, the subsequent wake is shown to have reduced
aerodynamic losses compared to the baseline wake. Therefore, the measured effects of
the TEB behind the IGV subsequently show reduced aerodynamic losses compared to the
baseline. Recall from the discussion of the steady state experiments that the limiting
factor at this axial measuring station, z/CIGV = 0.15, in completely filling in the IGV wake
was the TEB hole diameter. The wake-PFF interaction in the unsteady experiments
appears to compensate for this limiting factor by reducing the time averaged losses.
These results show that the IGV-fan interactions for subsonic relative fan speeds most
likely only generate wake-PFF interactions, as opposed to IGV surface-PFF interactions.
There are two arguments for this conclusion. First, the same TEB mass flow and flow
parameters are observed for both the unsteady and steady state cases. If the fan PFF

Results and Discussion: Unsteady TEB 220
interaction generated either a loss or gain by interacting with the IGV boundary layer, a
greater or less amount of mass flow and momentum, respectively, would be required for
wake filling. Second, the unsteady pressure fluctuations measured at the IGV trailing
edge for the subsonic fan speeds were quite small, ~0.2 psi P-P. Therefore, it is unlikely
that these pressure fluctuations would prematurely separate the boundary layer on the
IGV, or delay the separation when compared to the baseline study.
Unsteady TEB Profiles
Using the improved unsteady wake reduction method, section 4.1.1, the average P-P
amplitudes of the ensemble-averaged pressure fluctuations at each pitchwise location,
after subtracting out the pressure fluctuations from the clean inlet, for TEB flow control
is shown in Fig. 5.2. These results are compared to the unsteady pressure fluctuations
observed in the wake region with no blowing. These results show that in the portion of
the wake reduced by TEB, the unsteadiness of the pressure fluctuations is effectively
removed. This is not to say that the TEB removes the unsteadiness in the flow, just that
the probe is measuring a near constant total pressure in the IGV wake region, which is
equal to the inlet total pressure. In other words, the portion of the wake reduced by TEB
produces the same unsteadiness as the freestream flow. In the portion of the wake in the
pitchwise direction that was not effected by TEB, x/t < -0.28 and x/t > 0.14, the
unsteadiness of the pressure fluctuations remained the same as the case with no blowing.
Therefore, in terms of the forcing function (wake deficit) on the downstream rotor,
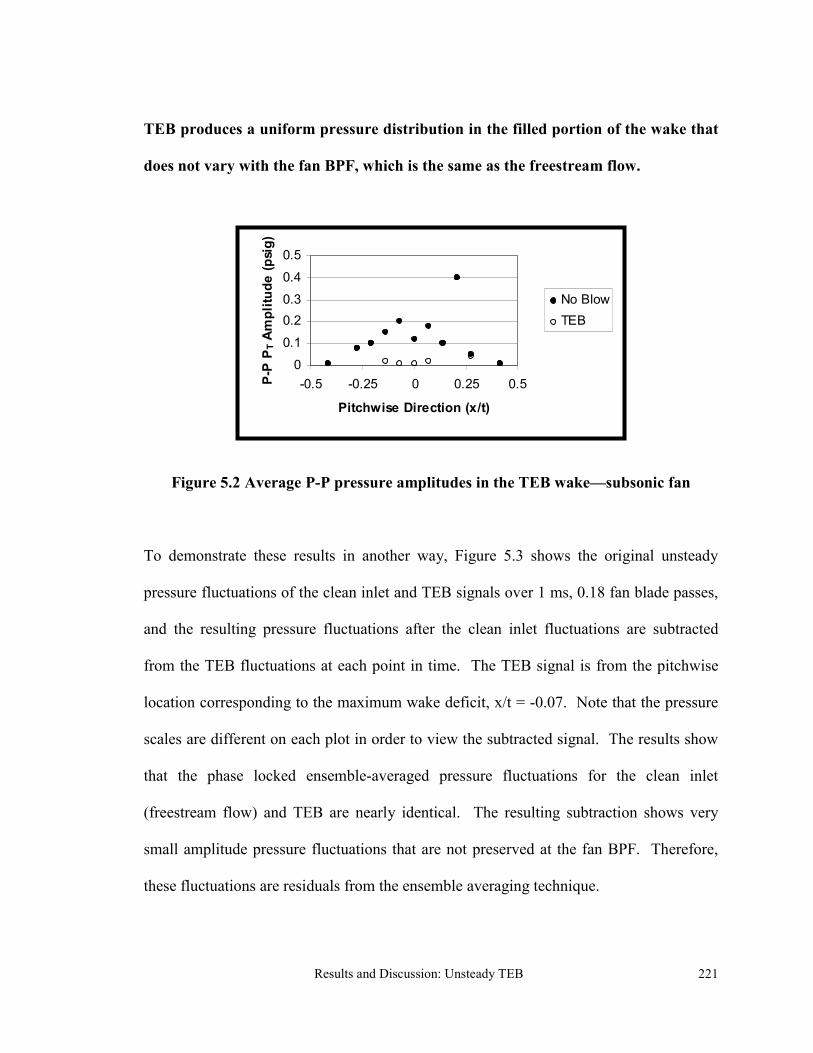
Results and Discussion: Unsteady TEB 221
TEB produces a uniform pressure distribution in the filled portion of the wake that
does not vary with the fan BPF, which is the same as the freestream flow.
Figure 5.2 Average P-P pressure amplitudes in the TEB wake—subsonic fan
To demonstrate these results in another way, Figure 5.3 shows the original unsteady
pressure fluctuations of the clean inlet and TEB signals over 1 ms, 0.18 fan blade passes,
and the resulting pressure fluctuations after the clean inlet fluctuations are subtracted
from the TEB fluctuations at each point in time. The TEB signal is from the pitchwise
location corresponding to the maximum wake deficit, x/t = -0.07. Note that the pressure
scales are different on each plot in order to view the subtracted signal. The results show
that the phase locked ensemble-averaged pressure fluctuations for the clean inlet
(freestream flow) and TEB are nearly identical. The resulting subtraction shows very
small amplitude pressure fluctuations that are not preserved at the fan BPF. Therefore,
these fluctuations are residuals from the ensemble averaging technique.
00.10.20.30.40.5
-0.5 -0.25 0 0.25 0.5
Pitchwise Direction (x/t)
P-P
P T A
mpl
itude
(psi
g)
No BlowTEB

Results and Discussion: Unsteady TEB 222
Figure 5.3 Subtracted TEB signal at location of maximum wake deficit
Figure 5.4 shows the destructive, mean and constructive interference of the TEB flow
profile downstream of the IGV. As discussed above, the region of the wake effected by
the TEB flow control shows negligible pressure fluctuations. The region outside of this
shows the same pressure fluctuations observed in the wake measurements, including the
assumed potential wave reflection.
-0.3-0.2-0.1
00.10.20.3
0 0.25 0.5 0.75 1
Time (ms)
Pres
sure
(psi
g)
TebClean Inlet
-0.015-0.01
-0.0050
0.0050.01
0.015
0 0.25 0.5 0.75 1
Time (ms)
Pres
sure
(psi
g)
Original Ensemble-Averaged Signals
Subtracted Signal
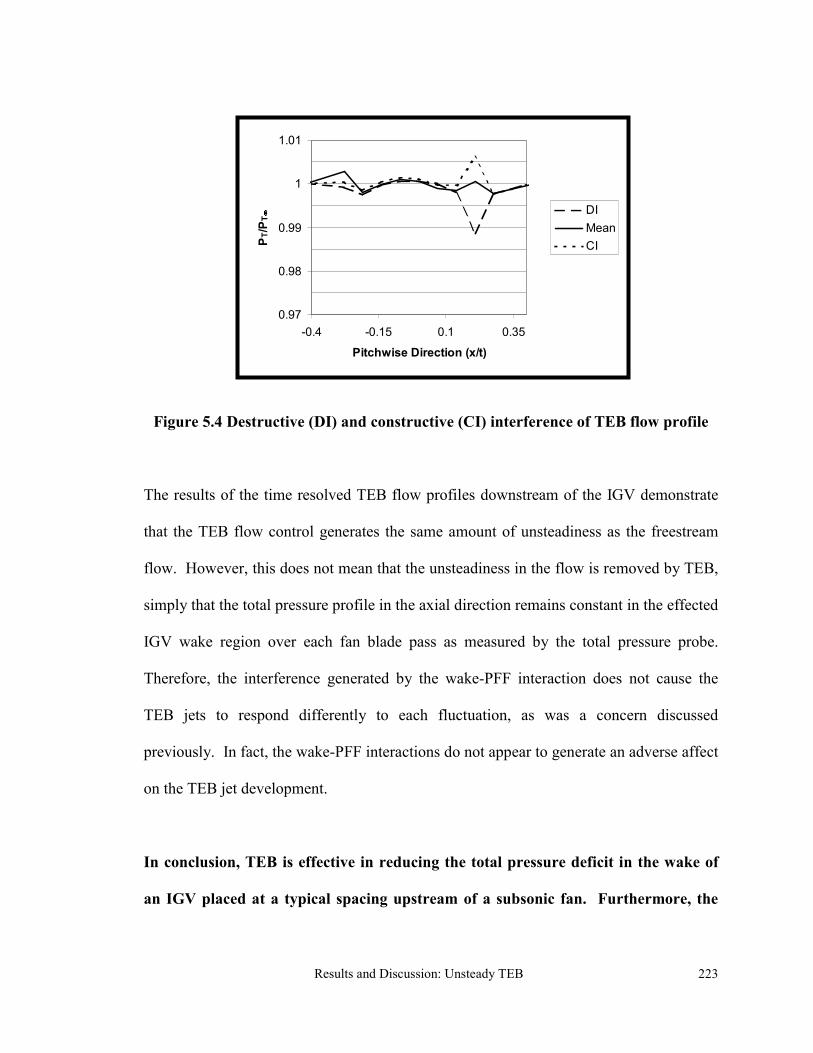
Results and Discussion: Unsteady TEB 223
Figure 5.4 Destructive (DI) and constructive (CI) interference of TEB flow profile
The results of the time resolved TEB flow profiles downstream of the IGV demonstrate
that the TEB flow control generates the same amount of unsteadiness as the freestream
flow. However, this does not mean that the unsteadiness in the flow is removed by TEB,
simply that the total pressure profile in the axial direction remains constant in the effected
IGV wake region over each fan blade pass as measured by the total pressure probe.
Therefore, the interference generated by the wake-PFF interaction does not cause the
TEB jets to respond differently to each fluctuation, as was a concern discussed
previously. In fact, the wake-PFF interactions do not appear to generate an adverse affect
on the TEB jet development.
In conclusion, TEB is effective in reducing the total pressure deficit in the wake of
an IGV placed at a typical spacing upstream of a subsonic fan. Furthermore, the
0.97
0.98
0.99
1
1.01
-0.4 -0.15 0.1 0.35
Pitchwise Direction (x/t)
P T/P
T
DIMeanCI

Results and Discussion: Unsteady TEB 224
total pressure loss in the wake was reduced from that seen in the baseline while
using the same amount of mass flow. Finally, the unsteadiness observed in the wake
profiles with no blowing generated by the destructive and constructive interference
of the IGV wake, do not adversely affect the TEB jet development. In fact, the total
pressure, as measured by the probe, contains a negligible amount of unsteadiness
when compared to the freestream.
5.2 Transonic Fan
Time Averaged Effectiveness of TEB
The effectiveness of TEB flow control for a typical IGV-fan spacing at relative transonic
fan blade velocities was investigated for fan speeds of 12k and 14k rpm, corresponding to
85 and 100% of the engine maximum speed, respectively. The time-averaged
effectiveness of TEB is shown in Fig. 5.5, compared to the case of no blowing, which
was presented earlier. These results show that TEB flow control eliminates the wake
region with the maximum total pressure deficit, but does not have an effect outside the
core of the wake. However, the TEB jets do appear to following the turning of the wake
in the direction of the rotor, which was a concern addressed earlier. The TEB flow
control reduces the total pressure loss coefficient, Eq. 2.11, by 68.8 and 68.4% compared
to the wakes with no blowing, at 12 and 14k rpm fan speeds, respectively. The TEB flow
parameters, discussed in section 2.2.1.5 and 3.3, are shown in Table 5.2. The mass flow
required for TEB is shown for the modified 8 hole IGV used in the unsteady experiments,
and the 21 hole IGV used in the steady baseline. The mass flow required for the reduced

Results and Discussion: Unsteady TEB 225
wake filling of the time averaged IGV wake near a transonic fan is 2.3 and 2.65 times
that required for the baseline and subsonic investigations, for 12 and 14k fan speed,
respectively. To put this into perspective, a fan with 30 blades would typically have
around 24 IGV. For 24 IGV, the baseline and subsonic results showed complete wake
filling would be achieved with using only 0.8% of the total engine mass flow. However,
the transonic results show that the mass flow required for 24 vanes would be at least 1.9
and 2.16% of the total engine mass flow, at 12 and 14k rpm, respectively. In the actual
implementation of TEB flow control in a military turbofan, the TEB supply air will have
to be bled from one of the downstream compressor stages, producing a cost to the
compressor. Therefore, 2% of the total engine mass flow might be undesirable to engine
designers, thereby making the concept of TEB less attractive. However, it should be
noted that relative transonic fan blade speeds usually exist only at the upper 1/3 span of
the blade near the tip (Cumpsty, 1989). Therefore, the IGV plenum could be partitioned
between the TEB supply air needed for the upper 1/3 of the fan (transonic) and the lower
2/3 of the fan (subsonic). This would result in a required mass flow of 1.2% of the
total engine flow, which is in the range of acceptable cost to the compressor.

Results and Discussion: Unsteady TEB 226
Figure 5.5 TEB flow control compared to wake—transonic fan
Pitchwise Direction (x/t)
P T /
P T∞∞ ∞∞
Fan Direction
0.94
0.96
0.98
1
1.02
-0.5 -0.25 0 0.25 0.5
Near FanWakeTEB
0.94
0.96
0.98
1
1.02
-0.5 -0.25 0 0.25 0.5
Near FanWakeTEB
12k
14k

Results and Discussion: Unsteady TEB 227
Fan Speed 12k rpm 14k rpm
Mass Flow (m••••TEB/m••••
∞∞∞∞) 8 holes 0.031% per modified IGV
0.035% per modified IGV
Mass Flow (m••••TEB/m••••
∞∞∞∞) 21 holes—full span 0.078% per IGV 0.09% per IGV TEB Line Pressure (PT(TEB)/PT∞∞∞∞) 2.24 3.55
Avg. TEB Jet Velocity (uj/U∞∞∞∞) 3.4 2.85 Max. TEB Jet Velocity (ujmax/U∞∞∞∞) 3.5 2.85
Blowing Coefficient, CB [(ρρρρu)j/(ρρρρU)∞∞∞∞] 3.85 4.41 Momentum Coefficient, Cµµµµ [(ρρρρu2)j/(ρρρρU2)∞∞∞∞] 13.09 13.04
Discharge Coefficient, Co 0.65 0.65
Table 5.2 TEB flow parameters for transonic fan—12k and 14k rpm
The mass flow required for TEB flow control for the transonic speeds increases between
12 and 14k rpm. The baseline results showed that for the same measuring locations, the
TEB mass flow to total engine mass flow ratio was constant for all fan speeds.
Therefore, this result shows that the IGV wake deficit near a transonic fan increases
disproportionately when compared to an isolated IGV. This is most likely due to the
increased strength of the shock waves with engine speed that interact with the IGV
surface.
The TEB flow parameters also show that the jet velocity to inlet velocity ratio has
increased substantially compared to the baseline and subsonic results. This increase is
due to the significant increase in the wake total pressure deficit due to the IGV boundary
layer—shock interactions, discussed in the case without flow control. The jet velocity at

Results and Discussion: Unsteady TEB 228
12k rpm is just under the local sonic speed, while the jet velocity at 14k rpm is choked.
This is evident by observing the TEB line pressure, velocity ratios, and blowing and
momentum coefficients. The density of the TEB supply air in the IGV plenum increased
by 30% between the 12 and 14k rpm cases. However, the velocity ratio decreased
between these two cases. Therefore, even though the holes are choked in the 14k case,
thereby limiting the TEB jet velocity to the local sonic velocity, the increased line
pressure increased the air density, subsequently increasing the mass flow even though the
velocity was not increased. Throughout the baseline results and discussion, it was
pointed out that TEB hole choking might reduce the effectiveness of wake filling because
the jet velocity could not be increased. This was also suggested in previous studies
(Naumann, 1997; Waitz, 1996). However, the current results show that TEB
effectiveness was the same at 12 and 14k rpm, even though the holes were choking at
12k. This is explained by observing the momentum coefficients for both fan speeds,
which are identical. Therefore, the effectiveness of TEB to fill in the wake is a first order
function of the jet momentum, and not the jet velocity, as has been previously reported.
Furthermore, these results seem to indicate that the TEB hole choking is not a limiting
factor, as long as the density of the TEB supply air can be increased accordingly. In the
baseline results, the hole diameter to downstream measuring location ratio was shown to
be a limiting factor in TEB effectiveness. Therefore, these results show that smaller
holes can be used to improve TEB effectiveness at closer axial spacings to the IGV
trailing edge.

Results and Discussion: Unsteady TEB 229
Finally, the effectiveness of IGV TEB near a transonic fan was reduced when compared
to the baseline and the subsonic results. This is most likely due the thicker wakes caused
by the IGV surface boundary layer—shock interactions, as discussed in Chapter 4.
Unsteady TEB Profiles
Using the improved unsteady wake reduction method, section 4.1.1, the average P-P
amplitudes of the ensemble-averaged pressure fluctuations at each pitchwise location,
after subtracting out the pressure fluctuations from the clean inlet, for TEB flow control
is shown in Fig. 5.6. These results are compared to the unsteady pressure fluctuations
observed in the wake region with no blowing. The unsteady pressure fluctuations in the
wake region are reduced by 81% and 79% with TEB compared to those of the wake with
no blowing, for the 12k and 14k cases, respectively. This is not as large as reduction as
the subsonic cases, where the unsteadiness was effectively reduced to zero in the TEB
effected region of the wake. Furthermore, the fluctuations in the TEB region occur at the
fan BPF. Again, this does not mean that the unsteadiness in the flow is reduced by TEB,
simply that the total pressure profile in the axial direction contains smaller pressure
fluctuations in the effected IGV wake region over each fan blade pass as measured by the
total pressure probe. In the portion of the wake in the pitchwise direction that was not
effected by TEB, x/t < -0.21 and x/t > 0, the unsteadiness of the pressure fluctuations
remained the same as the case with no blowing. Therefore, in terms of the forcing
function (wake deficit) on the downstream rotor, TEB produces a substantially
reduced total pressure fluctuation in the filled portion of the wake.

Results and Discussion: Unsteady TEB 230
Figure 5.6 Average P-P pressure amplitudes in the TEB wake—transonic fan
The minimum, mean and maximum TEB flow profiles over one averaged fan blade pass
is shown in Fig. 5.7. These results show that even though the pressure fluctuations in the
TEB effected region of the wake are higher in amplitude to those in the subsonic case, the
pressure fluctuations are still small compared to the region of the IGV wake not affected
by TEB. Furthermore, these results show that over-blowing is not occurring at the time
when the minimum wake is observed. Recall from the transonic results without blowing,
that the minimum wake profile produced very little evidence of a wake profile.
Therefore, the primary concern with implementing TEB flow control was that the wake
would be filled-in at the time of the wake maximum, but would over-blow at the time of
the minimum wake. Thereby producing a forcing function on the downstream fan that
was equal in magnitude, but opposite in direction as the IGV wake. These results clearly
show that over-blowing in this region is not a concern. There are two plausible
00.5
11.5
22.5
-0.5 -0.25 0 0.25 0.5
Pitchwise Direction (x/t)
P-P
P T A
mpl
itude
(psi
g)
14k No Blow14k TEB12k No Blow12k TEB

Results and Discussion: Unsteady TEB 231
explanations for this. First, if the fan passing shocks destructively interfere with the IGV
wake enough to eliminate its detection downstream, at a blade pass location between the
shock induced vortex shedding, then the TEB jets would also be attenuated. Second,
measurements made with the pressure transducer inside one of the TEB holes, Phase I,
showed pressure fluctuations on the IGV trailing edge with amplitudes as high as 4 psig
at the 14k rpm fan speed. Therefore, when the shock passes over the hole, at the time of
the minimum wake profile, the jet may experience resistance or blockage in between the
vortex shedding off the IGV.

Results and Discussion: Unsteady TEB 232
Figure 5.7 Minimum and maximum TEB flow profiles over one blade pass
In conclusion, TEB is effective in reducing the magnitude of the forcing function,
the total pressure deficit in the wake, of an IGV placed at a typical spacing
upstream of a transonic fan. Furthermore, the total pressure loss in the wake was
reduced by 68% when compared to the case without flow control. However, in
order to achieve this wake reduction, 2.5 times more mass flow was required when
compared to the subsonic fan and baseline TEB results. Finally, the unsteadiness
observed in the wake profiles with no blowing generated by the IGV-shock and
Pitchwise Direction (x/t)
P T /
P T∞∞ ∞∞
Fan Direction
0.85
0.9
0.95
1
1.05
-0.5 -0.25 0 0.25 0.5
MINMEANMAX
0.85
0.9
0.95
1
1.05
-0.5 -0.25 0 0.25 0.5
MINMEANMAX

Results and Discussion: Unsteady TEB 233
wake-shock interactions, do not adversely affect the TEB jet development. In fact,
the total pressure, as measured by the probe, contains a reduced amount of
unsteadiness when compared to the freestream.

Conclusions 234
6.0 Conclusions
In order to achieve the aggressive goals of the Department of Defense IHPTET program,
the component spacing in new axial compressor designs has been significantly reduced.
The close spacing between the IGV and first stage fan has produced many unexpected
results. Aerodynamic interactions between the IGV and fan, that were until recently
thought to have a second order effect, have been shown in the last three years to have a
first order effect on IGV blade loading, IGV wake profiles, and stage efficiency. The
effects of a transonic fan on the IGV wake have not been studied. Therefore, the first
objective of this study is to determine the effects of the fan PFF and passing shocks on
the aerodynamic losses generated by the IGV wakes. The second objective was to
determine the effects of the upstream passing shocks of a transonic fan on the wake
profiles shed by an upstream IGV.
High cycle fatigue failures of the fan blades in the first stage of axial compression in
modern military turbofan engines have been shown to be a result of the unsteady blade
loading generated by the wakes of the upstream inlet guide vanes (IGV). The best way to
reduce or eliminate these failures is to remove the forcing function itself, i.e. the IGV
wakes. Previous studies have shown the effectiveness of trailing edge blowing (TEB)
flow control in reducing the total pressure (forcing function) and velocity deficits in the
wakes of isolated stators. However, all of the previous studies have measured TEB
effectiveness at axial distances downstream of the stator that are not representative of a

Conclusions 235
rotor leading edge in a typical military engine. Therefore, the third objective of this study
was to investigate the effectiveness of TEB at closer axial measuring locations
downstream of an isolated IGV trailing edge. The effectiveness of IGV TEB flow control
in the harsh unsteady environment of close IGV-fan spacing has not been examined. The
fourth objective of the current study was to demonstrate the effectiveness of TEB in
reducing the wakes of an IGV placed at a typical distance upstream of a fan operating at
realistic conditions.
In order to achieve these objectives and demonstrate that TEB flow control is feasible in
modern military turbofan engines, the investigation was performed in a running full-scale
military turbofan engine, the Allied Signal F109. Since the objectives of this study focus
on the first stage of axial compression, the engine inlet and front fan are the only relevant
components in this investigation.
This research effort is separated into two categories, steady state and unsteady
aerodynamic investigations. The steady state investigation consists of time averaged
wake measurements of an isolated IGV, with and without TEB flow control, at closer
measuring distances downstream of the IGV than have been previously studied. These
steady experiments were also used for a baseline comparison in the unsteady
experiments. Therefore, in order to provide an analogous comparison, the steady
experiments are conducted in the F109 turbofan engine under the same inlet flow
conditions used in the unsteady experiments. In the steady experiments the IGV is placed

Conclusions 236
far upstream from the fan, well outside of any upstream propagating disturbances
generated by the fan. For this investigation, the engine is essentially being used as a wind
tunnel.
The unsteady experiments are divided into two separate phases: Phase I) High frequency
IGV surface pressure measurements; Phase II) High frequency IGV wake total pressure
measurements. Since previous investigations have shown substantial wave reflections off
of adjacent IGV blades, which interfere with the surrounding flow, the current study uses
a single IGV so that the unsteady wake profile can be determined without the pollution of
wave reflections. In the unsteady experiments, the IGV is placed at a typical spacing
upstream of the fan. Surface pressure measurements were performed on the IGV trailing
edge, and time averaged and unsteady IGV wake profiles were measured for subsonic
and transonic relative fan speeds.
This chapter will first summarize the conclusions reached in the steady state and unsteady
investigations. The contributions of this study to the field of turbomachinery will then be
presented. Finally, recommendations for future investigations will be discussed.
6.1 Steady-state Experiment Conclusions
A series of experiments were conducted to measure the baseline IGV wake profiles, with
and without TEB flow control, with the IGV placed well upstream of the aerodynamic
influence of the fan. Measurements were performed at various fan speeds at measuring

Conclusions 237
locations downstream of the IGV trailing edge equal to 0.15, 0.25, 0.5 and 0.75 IGV
chords. This measuring location represents the location of a fan leading edge at typical
IGV-fan spacings. Results showed that complete pitchwise and spanwise wake filling in
was achieved through TEB at the 0.5 and 0.75 measuring locations, while requiring only
0.032% of the total engine inlet mass flow. Integrating the mass flow deficit in the wake
confirmed this result. To put these results into perspective, an engine with 24 IGV would
require only 0.8% of the engine mass flow for TEB. This is significant because in the
actual implementation of TEB, the supply air will have to be bled from a downstream
compressor stage, thereby inducing a cost to the engine. A mass flow of ~1% of the total
engine flow is deemed acceptable by engine designers.
TEB flow control showed a reduced effectiveness at the two axial measuring stations
closest to the IGV trailing edge. At the 0.25 measuring station, the limiting factor was
the TEB hole spacing along the IGV span, as only partial wake filling was observed in
the spanwise direction. However, it was estimated that the mass flow required would be
0.032%, as the mass flow deficit in the wake region showed negligible change at each
axial measuring location. This closer axial spacing was found to be beneficial by
reducing the TEB jet velocity required for complete pitchwise wake filling, when
compared to the further spacings. This was attributed to increased jet dissipation at the
further spacings. At the 0.15 measuring location, TEB had a reduced effectiveness in the
pitchwise direction and no effect in the spanwise direction. The reduced effectiveness in
the pitchwise direction was attributed to the TEB hole diameter to axial measuring

Conclusions 238
location ratio, which was determined to be at least 12 for complete pitchwise filling. The
reduced effectiveness in the spanwise direction was attributed to span hole spacing, as
found for the 0.25 location.
6.2 Unsteady Experiment Conclusions
A series of experiments were conducted to investigate the effectiveness of TEB flow
control in an IGV placed at a typical distance upstream of a fan operating at both
subsonic and transonic relative blade speeds. The IGV was located 0.43 fan chords
upstream of the fan leading edge. Phase I experiments were first conducted to measure
the unsteady pressure fluctuations at the IGV trailing edge generated by the fan’s
upstream propagating PFF and shock waves at subsonic and transonic relative fan speeds,
respectively. A high frequency pressure transducer was flush mounted into an IGV TEB
hole at a 1.1 in immersion. Phase II experiments consisted of measuring the time
averaged and unsteady IGV wake profiles with located 0.43 fan chords upstream of a
subsonic and transonic fan. Measurements were performed for both no blowing and TEB
flow control. These measurements were compared with the baseline results in the steady
state experiments. The unsteady IGV wake profiles were measured with a high-
frequency total pressure probe, facing upstream toward the IGV and the incoming inlet
flow, at a radial immersion of 1.1 in, which is located directly downstream of the TEB
hole used in the Phase I investigation. All of the resulting pressure signals were phase
locked with the fan rotation and ensemble averaged.

Conclusions 239
The results of the Phase I on-blade pressure measurements showed conclusively that the
F109 fan operates at both subsonic and transonic relative fan speeds. The amplitudes of
the pressure fluctuations measured at the IGV trailing edge increased substantially
between the subsonic and transonic fan speeds. The passing shock waves generated P-P
pressure amplitudes that were 10 times those measured by the fan PFF, with maximum
pressure fluctuations of 4.7 psi P-P on the IGV surface at the highest fan speed tested.
This demonstrates the severity of the forcing function generated by the fan on the
upstream IGV. Both the fan PFF and passing shocks were found to occur at the fan BPF,
with less significant higher harmonic content.
Results of the Phase II upstream total pressure measurements in a clean inlet, i.e. no IGV,
showed significantly higher amplitude pressure fluctuations when compared to the Phase
I results at the same fan speeds, with maximum P-P pressure fluctuations of 7 psi at the
highest fan speed. These fluctuations were determined to be generated by the passing fan
PFF and shock waves for the subsonic and transonic fan speeds, respectively. It was
determined that the total pressure probe was measuring the static pressure fluctuations of
these passing waves. Therefore, an improved data reduction method was presented
which eliminated these pressure fluctuations from the unsteady wake measurements.
The time averaged wake profiles for the subsonic fan speeds showed that the wake was
compressed in the direction of the fan rotation and turned approximately 0.5° when
compared to the baseline wakes. The maximum wake deficit was found to be slightly

Conclusions 240
higher than the baseline. The total pressure loss coefficient of these wakes was found
to be 30% lower when compared to the steady baseline results. Therefore, for
subsonic relative fan speeds, close IGV-fan spacing is beneficial to the compressor stage
by reducing the average aerodynamic losses generated by the IGV wakes. The time
resolved unsteady IGV wake profiles showed that the PFF from the fan destructively and
constructively interferes with the IGV wakes with each blade pass.
The time averaged wake profiles for the transonic fan speeds showed that the fan shock
interaction with the IGV wakes and surface results in IGV wake profiles with
considerable increases in wake deficit and width when compared to the baseline. The
wake width is increased by 25% and the wake is turned approximately 1° into the
direction of the fan rotation, when compared to the baseline. The total pressure loss
coefficient of the time averaged wakes was found to increase by a factor 2 when
compared to the steady baseline results. Therefore, for transonic relative fan speeds,
close IGV-fan spacing is detrimental to the performance of the compressor stage by
increasing the average aerodynamic losses generated by the IGV wakes. The close IGV-
fan spacing also has a detrimental effect on the average magnitude of the forcing function
(wake deficit) for the transonic fan speeds. The close spacing produces a 100% increase
in the average forcing function magnitude when compared to the baseline. The time
resolved unsteady wake profiles showed that maximum wake width across a fan blade
pass is increased by 35%, and the wake deficit is increased by almost three times. The
minimum wake profiles show very little evidence of a wake at all, with small variations

Conclusions 241
in normalized total pressure about unity. The behavior of the time resolved wakes was
attributed to a combination of shock induced boundary layer separation on the IGV
surface, coupled with the shock interactions of the corresponding IGV wake.
The time averaged profiles of the subsonic relative fan speeds showed that TEB is
effective in reducing the total pressure deficit in the wake of an IGV placed at a typical
spacing upstream of a subsonic fan. Furthermore, the total pressure loss in the wake was
reduced from that seen in the baseline while using the same amount of mass flow.
Finally, the unsteadiness observed in the wake profiles with no blowing generated by the
destructive and constructive interference of the IGV wake, do not adversely affect the
TEB jet development. In fact, the total pressure, as measured by the probe, contains a
negligible amount of unsteadiness in the effected wake region when compared to the
freestream.
The time averaged profiles of the transonic relative fan speeds showed that TEB flow
control eliminates the wake region with the maximum total pressure deficit, but does not
have an effect outside the core of the wake. However, the TEB jets do appear to
following the turning of the wake in the direction of the rotor. The TEB flow control
reduces the total pressure loss coefficient by 68% compared to the wakes with no
blowing. The mass flow required for the reduced wake filling of the time averaged IGV
wake near a transonic fan is 2.6 times that required for the baseline and subsonic
investigations. The effectiveness of TEB to fill in the wake was shown to be a first order

Conclusions 242
function of the jet momentum, and not the jet velocity, as has been previously reported.
The time resolved wake profiles showed that TEB reduces the unsteadiness in the
effected wake region by 80% when compared to the case with no blowing. Therefore, in
terms of the forcing function (wake deficit) on the downstream rotor, TEB produces a
substantially reduced total pressure fluctuation in the filled portion of the wake.
In conclusion, TEB was found to be very effective in reducing the total pressure deficits
generated by IGV wakes when the IGV was placed at a typical spacing upstream of a
subsonic fan. TEB was found to be less effective in reducing the total pressure deficits
for transonic fan speeds due to the increased wake losses generated by shock-boundary
layer interactions on the IGV surfaces. However, the maximum magnitude of the forcing
function was eliminated and the total pressure deficits were reduced by almost 70%.
Therefore, this study shows that inlet guide vane TEB flow control is a feasible method
for reducing the IGV wake forcing function on the downstream fan in the harsh
environment of close component spacing in modern military turbofan engines.

References 243
References
Air Force Research Laboratory, “IHPTET: Air Dominance Through Propulsion Superiority”, Brochure, April 2000. Behnken, R.L., Leung, M., Murray, R.M., “Characterizing the Effects of Air Injection on Compressor Performance for Use in Active Control of Rotating Stall”, ASME Paper 97-GT-316, June 1997. Breugelmans, F.A.E., “The Effect of Leading-Edge Thickness on the Bow Shock in Transonic Rotors”, Transonic Flow Problems in Turbomachinery, Edited by T.C. Adamson and M.F. Platzer, Hemisphere Publishing Co., 1978. Cimbala, J.M., and Park, W.J., “An Experimental Investigation of the Turbulent Structure in a Two-Dimensional Momentumless Wake”, Journal of Fluid Mechanics, Vol. 213, pp. 479-509, 1990. Corcoran, Timothy, “Control of the Wake from a Simulated Blade by Trailing Edge Blowing,” Masters Thesis, Mechanical Engineering Department, Lehigh University, 1992. Cousins, W., Personal communication, Honeywell/Allied-Signal, 1999. Cumpsty, N.A., “Vibration and Noise—Compressor Aerodynamics”, Longman Scientific and Technical, 1st Edition, 1989. Cunningham, T., and Bruce, T., “Installation Manual for the TFE109-1 Turbofan Engine”, Allied-Signal Aerospace Company, Dec. 1992. Davenport, O.B., “Operational Readiness and High Cycle Fatigue”, Presented at t the 1998 IHPTET Conference, Wright-Patterson AFB, Sept. 1998. Day, I.J., “Active Suppression of Rotating Stall and Surge in Axial Compressors”, Journal of Turbomachinery, Vol. 115, pp. 40-47, 1993. Fabian, M.K., and Jumper, E.J., “Rearward Forcing of an Unsteady Compressible Cascade”, J. of Propulsion and Power, Vol. 15, No. 1, pp. 23-30, 1999. Falk, E.A., Jumper, E.J., and Fabian, M.K., “Upstream Propagating Potential Waves in the F109 Turbofan Engine Inlet Flow”, AIAA Paper 98-3294, 1998.

References 244
Fleeter, S., Personal communication, Purdue University, June 2000. Gorrell, S.E., Copenhaver, W.W., and Randall, M.C., “Effects of Upstream Wakes on the Performance of a Transonic Compressor Stage”, ISOABE Paper 97-7070, 1997. Haines, MGEN D., “Sustaining AF Engines”, Presented at the 1998 IHPTET Conference, Wright-Patterson AFB, Sept. 1998. Hamed, A. And Numbers, K., “Inlet Distortion Considerations for High Cycle Fatigue in Gas Turbine Engines”, 3rd High Cycle Fatigue Conference, San Antonio, TX, Feb. 1998. Harvell, J.K., Internal F109 Document, United States Air Force Academy, 1994. Hiller, K.W., Batterton, P.G., Bustadt, P.L., and Szuch, J.R., “Propulsion Systems Technology,” NASA SP-259, Capter XIII, pp. 387-388, 398, Nov. 1970. Hsu, S.T., and Wo, A.M., “Reduction of Unsteady Blade Loading by Beneficial use of Vortical and Potential Disturbances in an Axial Compressor with Rotor Clocking”, ASME J. of Turbomachinery, Vol. 120, pp. 705-713, Oct. 1998. Johnson, R., and Fleeter, S., “Time Resolved Variations of an IGV Flow Field in the Presence of a Rotor Potential Field”, AIAA Paper 96-2670, July 1996. Johnson, R., and Fleeter, S., “Three-Dimensional Time Resolved Measurements of IGV-Rotor Potential Interactions”, AIAA Paper 98-3896, July 1998. Johnston, R., and Fleeter, S., “High-Speed Rotor Wake Features and Inherent Flow Unsteadiness”, AIAA Paper 98-3297, July 1998. Kerrebrock, J.L., and Mikolajczak, A.A., “Intra-Stator Transport of Rotor Wakes and its Effect on Compressor Performance”, ASME J. of Engineering for Power, Vol. 92, pp. 359-368, 1970. Kielb, R.E., Personal communication, GE Aircraft Engines, January 1997. Kobayashi, H., Leger, T., Wolff, J.M., “Experimental and Theoretical Frequency Response of Pressure Transducers for High Speed Turbomachinery”, AIAA Paper 98-3745. Lakshiminarayana, B., and Davino, R., “Mean Velocity and Decay Characteristics of the Guidevane and Stator Blade Wake of an Axial Flow Compressor”, ASME Journal of Engineering for Power, Vol. 102, Jan. 1980, pp. 50-60.

References 245
Leitch, Thomas., “Reduction of Unsteady Stator-Rotor Interaction by Trailing Edge Blowing”, M.S. Thesis, Virginia Polytechnic Institute and State University, Blacksburg, VA, 1997. Leitch, T.A., Saunders, C.A., and Ng, W.F., “Reduction of Unsteady Stator-Rotor Interaction Using Trailing Edge Blowing”, AIAA Paper 99-1952, May 1999. Majjigi, R.K. and Gliebe, P.R., "Development of a Rotor Wake/Vortex model," Vol. 1 – Final Report, NASA Contract Report 174849, 1984, pp. 6-21. Manwaring, S.R., and Fleeter, S., “Rotor Blade Unsteady Aerodynamic Gust Response to Inlet Guide Vane Wakes”, ASME J. of Turbomachinery, Vol. 115, pp. 197-206, Jan. 1993. Manwaring, S.R., and Wisler, D.C., “Unsteady Aerodynamic and Gust Response in Compressors and Turbines”, ASME J. of Turbomachinery, Vol. 115, pp. 724-740, Oct. 1993. Mikolajczak, A.A., “The Practical Importance of Unsteady Flow”, AGARD CP-144, April 1976. Morris, R.J., Benedict, B.K., Cowles, B.A., Stange, W.A., and Scheuren, W.J., “Active Structural Control for Gas Turbine Engines”, ASME Paper 98-GT-514, IGTI, June 1998. Morris, R.J., Personal Communication, Pratt & Whitney, 1999. Naumann, R. Georg, “Control of the Wake from a Simulated Blade by Trailing Edge Blowing”, Masters Thesis, Mechanical Engineering Department, Lehigh University, 1992. Park, W.J., and Cimbala, J.M., “The Effects of Jet Injection Geometry on Two-dimensional Momentumless Wakes,” Journal of Fluid Mechanics, Vol. 224, pp. 29-47, 1991. Popp, Oliver, “Steady and Unsteady Heat Transfer in a Film Cooled Transonic Turbine Cascade”, Doctoral Dissertation, Mechanical Engineering Department, Virginia Tech, 1999. Pratt and Whitney, http://www.pratt-whitney.com/engines/gallery/lg.f119.cut.html, 2000. Probasco, D.P., Wolff, J.M., Copenhaver, W.W., and Chriss, R.M., “Unsteady Blade Row Potential Interaction in a Compression Stage”, AIAA Paper 97-3285, July 1997.

References 246
Probasco, D.P., Wolff, J.M., Copenhaver, W.W., and Chriss, R.M., “Axial Spacing Effects in a Transonic Compressor on the Upstream Vane Loading”, AIAA Paper 98-3431, 1998. Richardson, S., “The High Cycle Fatigue (HCF) S&T Plan”, Status Report, Turbine Engine Division, Wright Laboratories, 1995. Ritchie, R.O., Boyce, B.L., Campbell, J.P. and Roder, O., “High-Cycle Fatigue of Turbine Engine Alloys”, Presented at the Fatigue Symposium, The Society of Materials Science, Japan, 1998. Roa, N.M., Feng, J.F., Burdisso, R.A., and Ng, W.F., “Active Flow Control to Reduce Fan Blade Vibration and Noise”, AIAA Paper 99-1952, May 1999. Sanders, A.J., and Fleeter, S., “Vane Row Indexing for Passive Vibration Control of Axial Flow Turbomachine Rotors”, AIAA Paper 95-2656, July 1995. Sanders, A.J., and Fleeter, S., “Transonic Axial-Flow Compressor IGV-Rotor Interactions”, HCF Conference, Monterey, CA, March 1999. Sanders, A.J., and Fleeter, S., “Experimental Investigation of Rotor-Inlet Guide Vane Interactions in Transonic Axial-Flow Compressor”, AIAA Journal of Propulsion and Power, Vol. 16, No. 3, pp. 421-430, May-June 2000. Saunders, C.A., “Noise Reduction in an Axisymmetric Supersonic Inlet using Trailing Edge Blowing,” M.S. Thesis, Virginia Polytechnic and State University, Blacksburg, VA 1998. Sell, Julian, “Cascade Testing to Assess the Effectiveness of Mass Addition/Removal Wake Management Strategies for Reduction of Rotor-Stator Interaction Noise”, MS Thesis, Massachusetts Institute of Technology, Cambridge, MA 1997. Sheldahl, R.E. and Klimas, P.C., “Aerodynamic Characteristics of Seven Airfoil Sections Through 180 Degrees Angle of Attack”, SAND80-2114, Sandia National Laboratories, March 1981. Smith, L.H., “Wake Dispersion in Turbomachines”, J. of Basic Engineering, pp. 688-690, Sept. 1966. Smith, L.H., “Casing Boundary Layers in Multistage Axial Flow Compressors”, Flow Research in Blading, edited by L.S. Dzung, Elsevier Publishing Co., 1970. Smith, L.H., “Wake Ingestion Propulsion Benefit”, J. of Propulsion and Power, Vol. 9, No. 1, pp. 74-82, 1993.

References 247
Thomson, D.E. and Griffin, J.T., “The National Turbine Engine High Cycle Fatigue Program”, Memo describing the National HCF Program, 1999. Waitz, I.A., Brookfield, J.M., Sell, J., and Hayden, B.J., “Preliminary Assessment of Wake Management Strategies for Reduction of Turbomachinery Fan Noise”, Journal of Propulsion and Power, Vol. 12, No. 5, pp. 958-966, 1996. Weigl, H., Paduano, J., Epstein, A., Greitzer, E., Bright, M., and Strzisar, A., “Active Stabilization of Rotating Stall in a Transonic Single Stage Axial Compressor”, ASME IGTI Paper 97-GT-316, June 1997. Wo, A.M., Chung, M.H., Chang, S.J., and Lee, S.F., Wake Vorticity Decay and Blade Response in an Axial Compressor with Varying Axial Gap”, ASME IGTI Paper 99-GT-451, June 1999.

Appendix A 248
Appendix A
Uncertainty Analysis
There are two types of errors in measurement uncertainty, bias and precision errors
(Beckwith, 1993). Bias uncertainty is defined as errors that occur consistently for each
different measurement in an experiment, such as DC offsets. Precision uncertainty is
defined as random errors that vary from measurement to measurement in the
experiments. If more than one measurement is used to determine a given property, the
error is compounded. For example, in determining the flow velocity from the Pitot-static
probe, the engine inlet total pressure, static pressure and total temperature are used.
Therefore, the errors from each of these measurements result in an uncertainty in the
velocity calculation that is different than the uncertainty of the individual measurements.
This compounded uncertainty is determined from the propagation of uncertainty, given
by:
Where y is the given equation derived from measurements xn with uncertainty u. The
total uncertainty is then given by:
(A.1) 22
22
2
11
... ���
����
�
∂∂++��
�
����
�
∂∂+��
�
����
�
∂∂= n
ny u
xyu
xyu
xyu

Appendix A 249
Where B and P represent the bias and precision uncertainty, respectively.
Far Upstream IGV Wake Measurements (Steady-State)
The pressure transducers used in the steady experiments have a nominal precision error
of ± 0.1%, as discussed in section 2.2.1.3. Bias errors, such as the DC offset, were
accounted for in the calibration and data reduction techniques. For all wake
measurements, 1000 samples were averaged for each data point, as discussed in section
2.2.1.5. The total pressure wake measurements were all acquired with the 5 pisg pressure
transducer. Therefore, the total pressure wake measurements have a total
uncertainty of ±±±± 0.1%, which corresponds to ±±±± 0.005 psig, within a 95% confidence
interval (CI).
The velocity in the IGV wakes is determined from Eq. 2.7 using the total pressure and
static pressure measurements from the Pitot-static probe and the inlet total temperature.
Both pressures were measured with a 5 psig transducer with a nominal error of ± 0.1 %.
The transducers were calibrated with a dead weight tester which was checked with a ±
0.1 % high precision Fluke calibrator. The total temperature was obtained from the local
weather service at the Virginia Tech airport, and is assumed to have an error of ± 1 %.
(A.2) 22nnn PBU +=

Appendix A 250
Therefore, the total uncertainty of the IGV wake velocity measurements is ±±±± 0.514%
within a 95% CI.
The total pressure loss coefficient of the IGV wake was determined using Eq. 2.12. This
coefficient is determined by integrating the wake total pressure profile over a fixed
pitchwise distance. The nominal error of the 5 psig pressure transducers and the probe
traversing mechanism is ± 0.1%. Therefore, the total uncertainty of the total pressure
loss coefficient calculation is ±±±± 3.16%.
The momentum thickness of the IGV wake was determined using Eq. 2.14. Using the
resulting uncertainty of the velocity calculation and the nominal error of the traverse, the
total uncertainty of the momentum thickness calculation is ±±±± 7.9%.
Trailing Edge Blowing (TEB) Parameters
The mass flow of the TEB supply air was obtained from Equation 2.2, as a function of
the differential pressure across the orifice plate and the total pressure and total
temperature of the TEB supply line. The total uncertainty of the TEB mass flow
measurements is ±±±± 0.714%.
The TEB blowing coefficient was obtained from Equation 2.17, as a function of total and
static pressure measured with the Pitot-static probe, the total (ambient) temperature, and
the total pressure and total temperature in the IGV plenum. The pressure measurements
Appendix A 251
were performed with the 5 psig pressure transducers. The total uncertainty of the
blowing coefficient is ±±±± 1.02%.
The momentum coefficient was obtained from Equation 2.18 as a function of the total
and static pressure measured with the Pitot-static probe, and the plenum total pressure.
Each of these measurements was made with the 5 psig pressure transducers. The total
uncertainty of the momentum coefficient is ±±±± 0.107%.
The average TEB hole jet velocity was obtained by dividing the TEB supply mass flow
by the total area of the TEB holes and the local static density. The total uncertainty of
the average TEB jet velocity is ±±±± 1.23%. The maximum TEB hole jet velocity was
obtained from Equation 2.16, as a function of the total and static pressure from the Pitot-
static probe, the total (ambient) temperature, and the total pressure and total temperature
in the IGV plenum. The total uncertainty of the maximum TEB jet velocity is ±±±±
1.01%.
The discharge coefficient of the TEB holes was obtained from Equation 2.19, as a
function of the measured mass flow from the mass flow meter divided by the total TEB
hole area, the average TEB jet velocity, and the local static density. The total
uncertainty of the discharge coefficient is ±±±± 1.33%.

Appendix A 252
Unsteady On-Vane Pressure Measurements
The on-vane pressure measurements were performed with a 5 psig high frequency Kulite
pressure transducer, which has a precision error of 0.1%. The Kulite transducer was
routed through the signal amplifier, as discussed in Chapter 2.0. An uncertainty analysis
of the amplifier is found in Popp, 1999. The total uncertainty of the on-vane pressure
measurements is ±±±± 1.06%.
Unsteady Total Pressure Probe Measurements
The total pressure in the IGV wake, with the IGV placed close to the downstream fan,
was obtained with a 5 psig Kulite high frequency total pressure probe. The total
uncertainty of the total pressure measurements in the IGV wake region is ±±±± 1.05%.
The total pressure loss coefficient of the IGV wakes for both subsonic and transonic
relative fan blade speeds was obtained from Equation 2.12. The total uncertainty of the
loss coefficient calculation for the high frequency probe is ±±±± 3.32 %.
Ensemble Averaging
The unsteady on-vane and total pressure probe measurements were phase locked with the
fan revolution, and then ensemble averaged over one fan revolution, as discussed in
Chapter 4.0. One-hundred ensemble averages for each measurement was determined to
be sufficient in removing the random pressure fluctuations caused by local flow

Appendix A 253
unsteadiness with each blade pass and blade revolution. The typical method for
determining the standard deviation of the ensemble averages at each instant in time is
given by (Falk, 1999):
Where N is the number of ensembles (100), k is one instant in time over the fan
revolution, and P is the on-vane or probe pressure measurement. The precision error of
the ensemble-mean value at each instant in time is provided by the standard deviation of
the means, given by (Falk, 1999):
From this, the minimum, mean, and maximum standard deviation of the means is shown
in Table A.1 for each of the fan speeds tested. The standard deviation of the subsonic
relative fan speeds is nearly identical. However, the standard deviation for the transonic
relative fan speeds is greater than the subsonic speeds. Furthermore, the standard
deviation increases with increasing fan speed for the transonic fan. This behavior can be
observed in Figures 4.5 and 4.15 which show the peak to peak pressure fluctuations for
the raw and ensemble averaged data for each fan speed tested. The reasons for this
behavior can be found with above mentioned figures in Chapter 4.0.
(A.3) 2
1
)(1
1ik k
N
ikx PP
NS −
−= �
=
(A.4) N
SS k
K
xx =

Appendix A 254
Standard Deviation of the Means (%) Fan Speed (kRPM) Min Mean Max
10 1.04 1.25 1.54 11 1.05 1.30 1.57 12 1.42 1.82 2.14 13 1.38 2.04 2.63 14 1.64 2.28 2.79
Table A.1 Standard deviation of ensemble averages

Design Drawings 255
Appendix B
Design Drawings
This appendix provides the design drawings of the primary equipment used in the current
study. The design drawings for the IGV used in the far upstream steady state
experiments are shown in Fig. B.1-6. The modified IGV design used in the near fan
unsteady experiments, discussed in section 2.3.1.1, are shown in Fig. B.7-12. The design
drawings of the IGV inlet ring are shown in Fig. B.13-17. Finally, the drawings of the
traverse inlet ring are shown in Fig. B.18-20.

Design Drawings 256
Figure B.1 IGV Design Step 1—Wire EDM

Design Drawings 257
Figure B.2 IGV Design Step 2—Top Clamp/Block

Design Drawings 258
Figure B.3 IGV Design Step 3—Holes for Shoulder Bolts

Design Drawings 259
Figure B.4 IGV Design Step 4—EDM Plenum Cut-out

Design Drawings 260
Figure B.5 IGV Design Step 5—TEB Holes

Design Drawings 261
Figure B.6 IGV Design Step 6—Bottom Plenum Plug

Design Drawings 262
Figure B.7 Modified IGV Design Step 1—Wire EDM

Design Drawings 263
Figure B.8 Modified IGV Design Step 2—Holes for Shoulder Bolts

Design Drawings 264
Figure B.9 Modified IGV Design Step 3—EDM Plenum Cut-out

Design Drawings 265
Figure B.10 Modified IGV Design Step 4—Notch Cut-out

Design Drawings 266
Figure B.11 Modified IGV Design Step 5—TEB Holes

Design Drawings 267
Figure B.12 Modified IGV Design Step 6—Bottom Plenum Plug

Design Drawings 268
Figure B.13 IGV Ring Orthogonal View

Design Drawings 269
Figure B.14 IGV Ring Dimensions

Design Drawings 270
Figure B.15 IGV Ring Front View Dimensions

Design Drawings 271
Figure B.16 IGV Ring Slots for IGV Placement

Design Drawings 272
Figure B.17 IGV Slot Plugs

Design Drawings 273
Figure B.18 Traverse Ring Orthogonal View

Design Drawings 274
Figure B.19 Traverse Ring Dimensions

Design Drawings 275
Figure B.20 Traverse Ring Front and Top Dimensions

Vita 276
Vita
Jeffrey D. Kozak was born on April 3, 1971 at McConnell AFB, Kansas. He attended
Paul VI high school in Fairfax, VA where he graduated in 1989. The author received his
Bachelor's in Mechanical Engineering in 1993 from Gannon University in Erie, PA.
While in Erie, he was employed by Johnson Controls, Smith Meter and General Electric
over the summers. The author received his Master's of Science in Mechanical
Engineering from Virginia Tech under Dr. Wing-Fai Ng in August of 1995. The title of
his Master's thesis was "Three-Dimensional Viscous Flow Calculations of a Bifurcated
2D Supersonic Engine Inlet at Takeoff". The author continued working with Dr. Ng for
his doctoral work. While at Virginia Tech, the author worked as a lab instructor for five
semesters, conducted published research on Supersonic Inlet Instabilities and Fiber-Optic
pressure transducers, and served on the College of Engineering's Graduate Student
Committee. The author is currently employed at Technology In Blacksburg, Inc., where
he began employment in January 2000. He has accepted a tenure-track assistant
professorship at the Rochester Institute of Technology, Rochester, NY, which will begin
in September 2000. The author defended his Dissertation on August 3, 2000.
________________________
Jeffrey D. Kozak