4 wetland and stormwater analysis - cob home wetland and stormwater analysis ... (impervious roof or...
TRANSCRIPT
Stormwater Site Plan for Fairhaven Highlands August 2007
4 Wetland and Stormwater Analysis
4.1 Basin Analysis
For hydrologic modeling purposes five overall basins were identified. The basins were divided into sub-basins with a common POC. The purpose of this stormwater analysis is not only to provide water quality treatment and attenuation to the existing creek drainage systems, but it is also to maintain wetland quality and function. A wetland fluctuation analysis was performed for Wetlands CC and KK. The fluctuation analysis is located in Appendix 3 with the monitoring data from NES and wetland stage storage tables. Appendix 5 contains the land use input for the WWHM.
The SWMM and the WWHM were designed with the intent to reduce erosive flow rates in streams while providing an adequate level of water quality. When analyzing the flow rates into the on-site wetlands the design must be careful to provide these wetlands with enough water. After multiple discussions with NES and CCS it was decided that it would be prudent to concentrate on matching the lower frequency storms, rather than the higher frequency storms that the WWHM is careful not to exceed. This means that during the 6 month to 5 year events, which are obviously the most frequent, we are matching the runoff to the wetlands as closely as possible. The higher frequency storms would then be allowed exceed the pre-developed flow rate by a statistically acceptable amount, as long as the basin's point of concentration flow rates meet the SWMM criteria. This design criterion ensures that the wetlands water levels are maintained during the important low flow events. The WWHM reports containing the postdeveloprnent flow rates to the five major wetlands are shown in Appendix 6. Flows were modeled using the lateral flow basin elements in the WWHM. The pervious and impervious lateral basins are similar to the standard basins except that runoff from the lateral basin is routed to another lateral basin which has a different land type. This is appropriate for the Fairhaven Highlands project where there is sheet runoff from one land type (impervious roof or street surface) to another (lawn to forested buffer to wetland areas).
Appendix 7 contains the WWHM reports illustrating that flow frequencies and durations were satisfied for flows entering the Padden Creek and Chuckanut Creek watersheds.
4.1.1 Basin PC-1
Basin PC-1 is located on the westerly portion of the subject property and sheet flows to the west with the majority of the stormwater eventually entering the City of Bellingharn's stormwater system at the east end oflris Lane. Stormwater flows easterly along the northerly line of the lots on the northerly side of Iris Lane to a low point approximately 350ft to the west, in a Cityrnaintained stonnwater conveyance ditch. There the stormwater enters a 36" storm drain pipe, flowing 1700 ft northerly, through the Robin Lane Mobile Horne Park, through Fairhaven Park, and eventually daylighting into Padden Creek.
Page 9 of 58
Stormwater Site Plan for Fairhaven Highlands August 2007
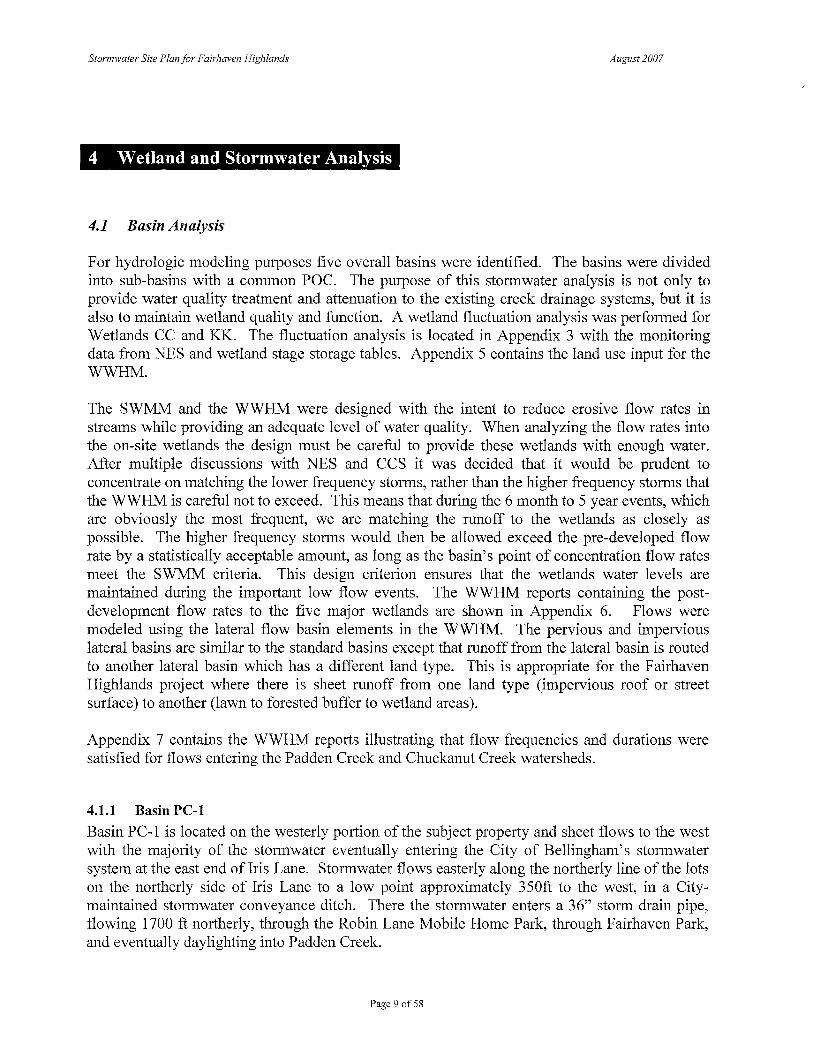
Two pre-development sub-basins were identified within Basin I, as shown on Exhibit 4, PreDevelopment Basin Map. Sub-basin FF contributes to the hydrology of Wetland FF, although both NES and GeoEngineers state that Wetland FF is a sloped wetland generally fed via subsurface conveyance, not overland flow. Due to the steep nature of the westerly slope and hydraulic characteristics of the wetland our design does not attempt to match the pre and postdeveloped conditions based on surface flows. A portion of Basin I is routed to the infiltration zone in order to comply with the parameters set forth in the SWMM to match duration values at the Padden Creek point of concentration, the project's westerly property line. Figure I displays the duration and flow frequencies for Wetland FF.
Figure 1: Wetland FF Duration Analysis
~, R~ults
s 0 J u.
0.46 ~-e---------------------1
•@ o~
0.36 1------~'fr------------------
" 0.26 1-------------"R,-- -------------
•• .... 0.17 1------:~~------"i •~-----------
~~ ~-
' ~D.~
"
Pe-rce-nt Time- E:xce-e-ding
501 POC 1 Predeveloped
801 POC 1 Mitigated flow
Wetland Fluctuation Durations Flow Frequent:;.Y Water Quality Hydrograph ~---'--.....:;.~--~-='--""-~~~~~~~~~_,
RUN ANALYSIS ~]
4.1.2 Basin PC-2
Basin 2 is located on the northerly portion of the subject property and sheet flows to the north, feeding the mostly offsite Wetland BB. Stormwater flows from Wetland BB westerly through a series of forested drainage swales eventually entering the City's stom1water system at the south side of Fairhaven Park. Pre and post developed basins are delineated in Exhibits 6-8.
A post-development wetland analysis was perfom1ed with the intent to match pre-developed flows from lower frequency stom1 events feeding the wetlands. This will ensure that Wetland BB received adequate flow to maintain the wetland hydrology and function. Post-developed flows will receive water quality treatment by rain gardens prior to dispersal to the wetland
Page IO of58

Stormwater Site Plan for Fairhaven Highlands August 2007
In addition, an overall basin stormwater analysis was perfonned to match the point of concentration flow and durations as directed in the SWMM. A portion of Basin 2 will be routed to the infiltration zone to provide proper attenuation at the point of concentration.
In the developed condition, Wetland BB receives flows from the stormwater detention pond located in the cul-de-sac and dispersed flows from forested, landscaped and impervious surfaces. All flows will receive primary treatment from bioretention facilities (rain gardens) and secondary treatment by dispersion over native vegetation.
Figure 3 displays the duration and flow frequencies for Wetland FF.
Figure 2: Wetland BB Duration Analysis
~Results
· ~ 0 J u. , . 0.28 1-----------"~•'l.--'. '4'~J..--------------
% .. , .~
~. 0.12 L__ __ ___. ___ ____.. ___ __._ _ _:::,~,..,_._ ___ _._ _ __ __.
502 POC 2 Predeveloped
802 POC 2 Mitigated flow
10E-4 10E-3 10E-2 10E-1 10 100
Percent Time Exceeding
Durations . Flow Frequency Water Quality H.)ldrograph Wetland Fluctuation ~~~......:.~_,.___...--= ....... ~~....,
Analyze datasets RUN ANALYSIS f~J
4.1.3 Basin PC-3
Basin 3 is located in the center of the project and is comprised mainly of the valley and slopes separating the two ridges. The runoff flowing into the valley has resulted in the two larger wetlands, Wetland CC and Wetland KK, as delineated in the NES report. Stormwater sheet flows through the existing forest and enters the wetlands. Stormwater runoff from Wetland KK periodically overflows to the southwest and eventually to Wetland CC (Observed by NES). Overflow runoff leaves Wetland CC via an existing drainage swale flowing northwesterly to the point of concentration for Basin 3.
Page 11 of58
Stormwater Site P Zan for Fairhaven Highlands August 2007
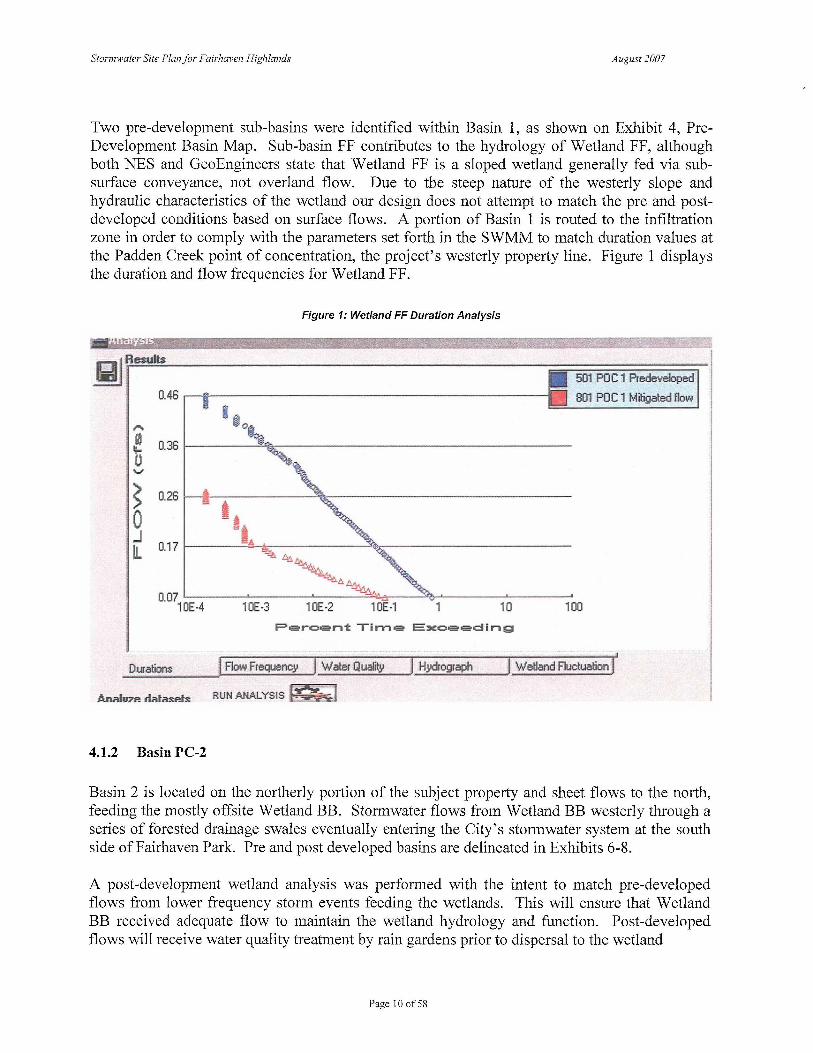
Two pre and post-development sub-basins were identified within Basin 3 as shown on the pre and post developed Exhibits. Sub-basin CC is the watershed contributing to the hydrology of Wetland CC and Sub-Basin KK is the watershed for Wetland KK. A wetland fluctuation analysis was performed for the pre-development condition for both wetlands. Again, postdeveloprnent wetland analyses were performed to match lower frequency storms as closely as possible (See wetland fluctuation analysis, Appendix 3). Combinations of pervious and impervious surface runoff are directed to these wetlands via sheetflow to provide adequate flows to maintain wetland hydrology and function.
The SWMM analysis was also performed to match pre-developed flow conditions at the point of concentration for the Padden Creek watershed. A portion of Basin 2 will be routed to the infiltration zone to provide proper attenuation at the point of concentration.
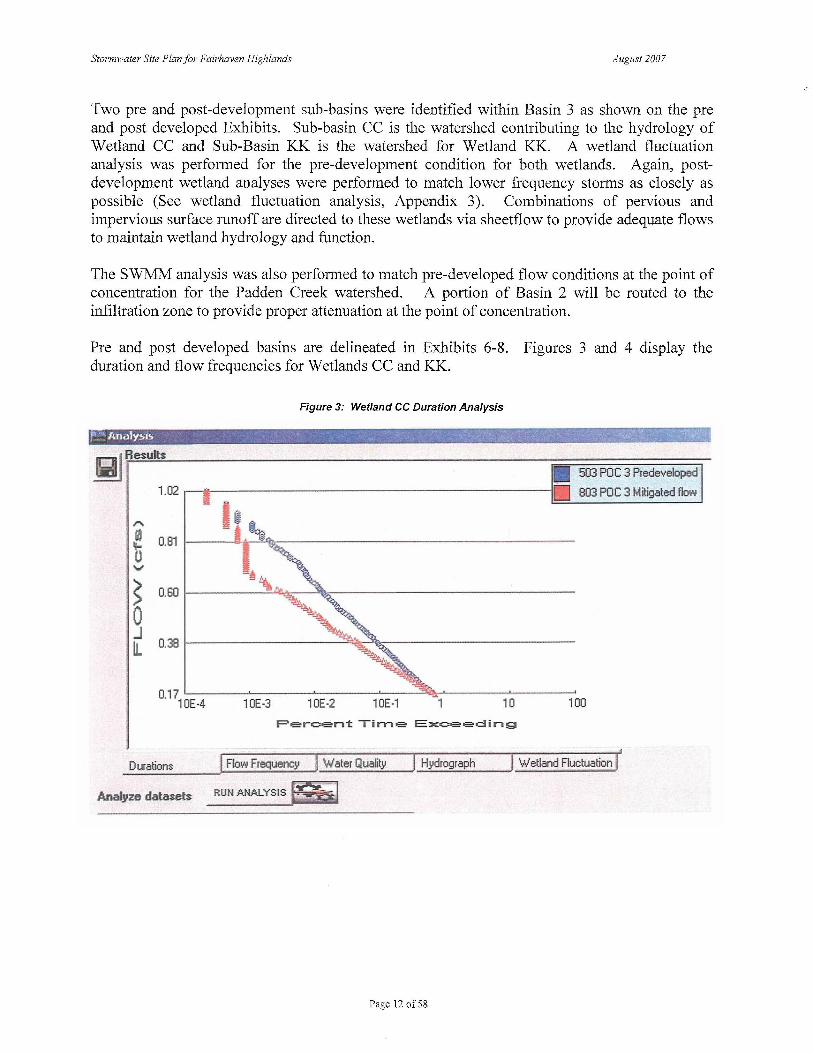
Pre and post developed basins are delineated in Exhibits 6-8. Figures 3 and 4 display the duration and flow frequencies for Wetlands CC and KK.
Figure 3: Wetland CC Duration Analysis
~I Results
1.02 .---ll---------------------t
s 0 J u.
0.1710E·4 10E·3 10E·2 10E·1 10
Percent Time Exceeding
503 PO C 3 Predeveloped
803 POC 3 Mitigated flow
100
Durations Flow Frequenc.Y. Water Qualit.y . H_ydrograph Wetland Fluctuation ~~...-..._..~_,,_.__..._..~~_,
Analyze datasets RUN ANALYSIS$]
Page 12 of 58
Stormwater Site Plan for Fairhaven Highlands
~ .Q J
' u.
Figure 4: Wetland KK Duration Analysis
I 111
-~ 1.07 !------~~' ·--------------,,
~, ~ 0.79 !---------'~---------------
August 2007
504 POC 4 Predeireloped
804 POC 4 Mitigated flow
0.2210E-4 10E-3 10E-2 10E-1 10 100
F'ercen1: Time Exceeding
Durations Flow Frequency _Water Quality H_ydrograph ~ Wetland Fluctuation -=.:::::::::::..::..~~.J-~~..:--=--' ·~~~..:......~J.......;:..........-=-: ......... ~....;,
Analyze datasets RUN Al~AL YSIS ~J
4.1.4 Basin 4
Basin 4 is located along the southern end of the project and drains to the Chuckanut Creek watershed. Basin 4 drains to the south and west approximately 700ft via sheet flow. Flows are collected in an existing drainage swale running southerly and parallel to Chuckanut Drive for approximately 900ft before entering a 12" concrete culvert and then daylighting to Hoag's Creek. Hoag's creek then flows through a culvert, underneath Chuckanut Drive and then flows approximately 550ft to Chuckanut Creek. Chuckanut Creek then flows 1500 ft before entering Chuckanut Bay.
Basin 4 does not contain or affect any wetlands so only the SWMM storn1water analysis was performed to attenuate post-developed flows to match the pre-developed condition. The results of the WWHM model are included in Appendix 7. Pre and post developed basins are delineated in Exhibits 4-6. Stonnwater flows are mitigated m the proposed storn1water detention/infiltration facility.
4.1.5 Basin 5
Basin 5 is located along the easterly boundary of the project and drains to the Chuckanut Creek watershed. A portion of the area contributes flows to offsite Wetland JJ, which is delineated in
Page 13 of 58
Stormwater Site Plan for Fairhaven Highlands August 2007
NES' s report as "a slope wetland that appears to drain to the east into a larger depressed area at the toe of the slope." Stormwater runoff from the project collects in Wetland JJ and flows 900ft easterly to the toe of slope. There, the runoff enters the larger depressed area, which is a large off-site wetland that parallels the Interurban trail. Runoff then migrates approximately 2000 ft to the south before becoming the channel that creates Hoag' s Creek. Hoag' s Creek continues to flow in a southerly direction approximately 1,350 feet before entering the culvert which crosses underneath Chuckanut Drive.
In the developed condition, Wetland JJ receives dispersed flows from forested, landscaped and impervious surfaces. All flows will receive primary treatment from bioretention facilities (rain gardens) and secondary treatment by dispersion over native vegetation. Flows are mitigated through attenuation in the stormwater detention facility.
Pre and post developed basins are delineated in Exhibits 4-6.
4.2 Flow Control
The project's developed stonn water site runoff flow rates will be attenuated to match the existing condition runoff flows in accordance with the SWMM. This will be accomplished by three methods. First, the design will release non-attenuated flows to the existing site wetlands to maintain wetland hydrology as discussed earlier and documented in the appendices. Second, a large portion of the site will be attenuated using an infiltration zone as shown on Exhibit 5 and Exhibit 7. Infiltration is a preferred storm water management practice for areas with adequate soils to recharge groundwater. . The infiltration zone is an area identified by GeoEngineers during their test pit analysis. Further analysis was performed in this area to quantify the infiltration capabilities and extents of this zone. In addition to the original shallow test pits, GeoEngineers drilled soil borings and installed piezometers at the infiltration area. These results showed sand and gravel extending to a depth of approximately 50 ft. These results prompted GeoEngineers to perform the SWMM recommended pilot infiltration tests (PIT) in this area to quantify a long-tenn infiltration rate. GeoEngineers arrived at a long-term infiltration rate, based on these large-scale field tests, of 1 in/hr (infiltration reduction factor of safety equal to 6). The stormwater infiltration design utilized this underlying infiltration rate in conjunction with a detention zone above consisting of 5 ft of drain rock with a porosity of 40%. This area is in the middle of the proposed recreation space and will be overlain with a geotechnical fabric, topsoil, and grass and landscaping. The community open space area will be graded to allow 0.5 ft of additional ponding during an extreme storm event. The overall effect will be an aesthetically pleasing usable open space overlying the stormwater facility. (See Exhibit 5). Lastly, stonnwater flows will be attenuated using stormwater detention facilities. The current design will require two separate detention facilities, one located at the end of the single-family cul-desac (open pond), and the other located in a concrete storm water vault, under the road, at the entrance to the project. The pond located at the end of the cul-de-sac will be landscaped softening the typical cul-de-sac features while providing stormwater attenuation.
Pagel4of58

Stormwater Site Plan for Fairhaven Highlands August 2007
The stonnwater vault, located at the entrance will be used for water storage and also as a retaining wall for the road. This multi-use design leaves room for additional open space at the project entrance while achieving the flow attenuation requirements set forth in the SWMM.
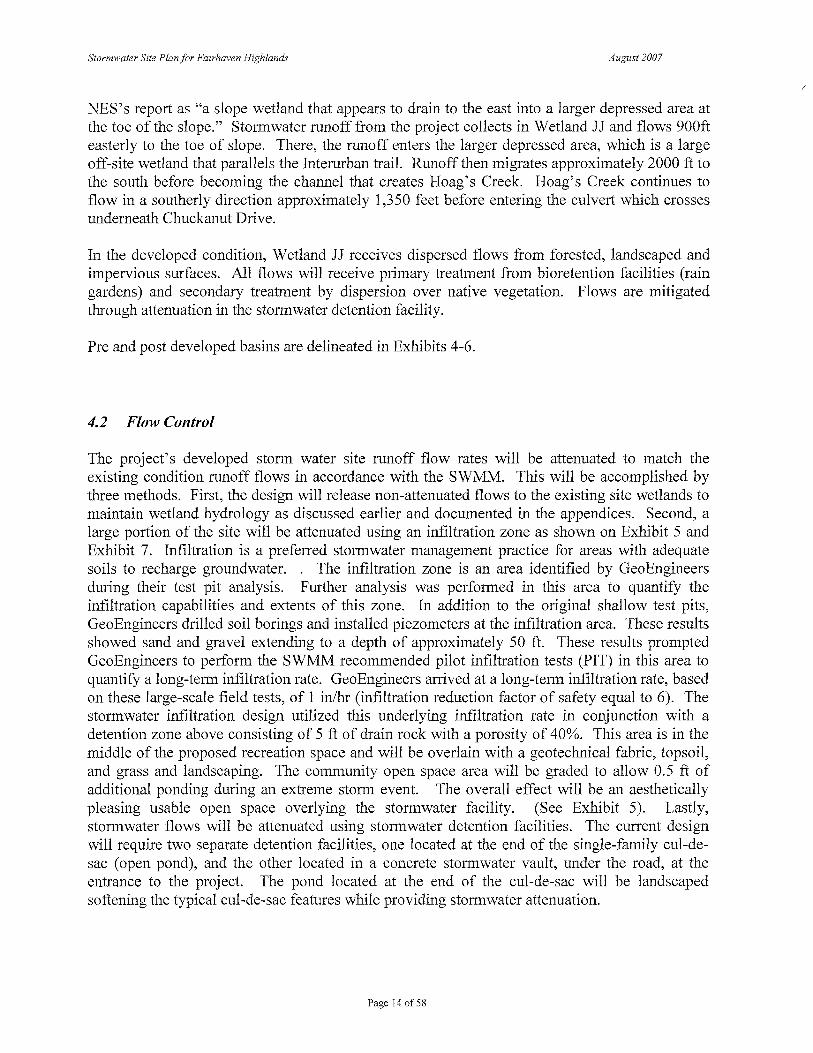
Figures 4 and 5 display that flow duration standards have been satisfied for the Padden Creek and Chuckanut Bay watersheds.
Figure 5: Padden Creek Duration Analysis
Jill Result$
s 0 J IL
1.55 ~--tt----------------------l
Oo.~,.. .. 1.21 1---9--,------""'~·. r;--------------------1
t i,
0.20 i__ _ _ __._ ___ _,__ ___ _.__ _ _ __.__::~>----'----
5m POC 1 Predeveloped
801 POC 1 Mitigated flow
10E-4 10E-3 10E-2 1DE·1 10 100
Perc ent Tim e Exceeding
Durations Flow Frequency \1/ater Quality Hydrograph _.:::.,..:;:_:_.;.;:.:.;.;:__ __ _,_~----~~~~~~~~ W etland Fluctuation j
Analyze datasets RUN ANALYSIS ~
Page 15 of58
Stormwater Site P !an for Fairhaven Highlands August 2007
Figure 6: Chuckanut Bay Duration Analysis
eneral Project Information-----------------------~Rewlf$
r. f/j
1.08 lj..
0 v
~ 0.79
0 J
0.51 u.
I ! I 5m POC 1 Predeveloped
801 POC 1 Mitigated flow
0.22 .___ __ __,, ___ __,_ ___ _._ __ ~.,_._ ___ _,__ ___ _. 10E-4 10E-3 10E-2 10E-1 10 100
Pe.rce.nt Time- E:xce.eoding
Durations Flow Frequency Water Quality Hydrograph Wetland Fluctuation ~~~----~....,.·----------~~~
Analyze dataset$ RUN ANALYSIS 19il
4.3 Stormwater Quality Treatment
4.3.1 Bioretention
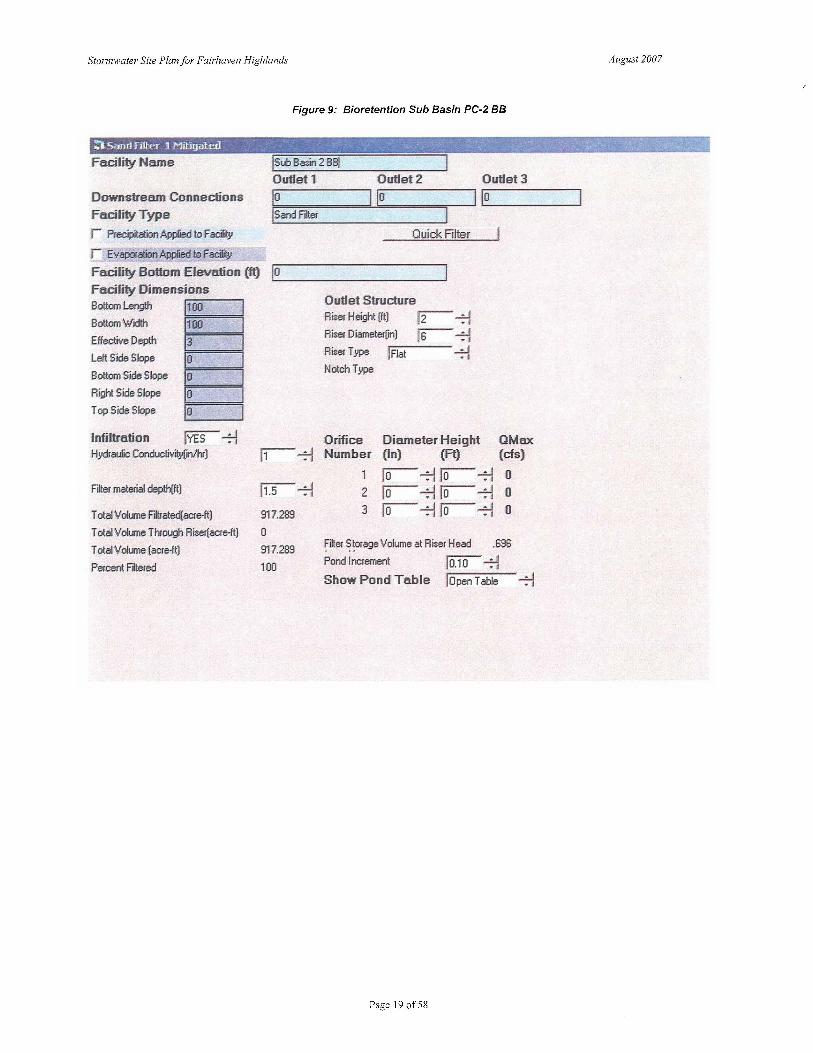
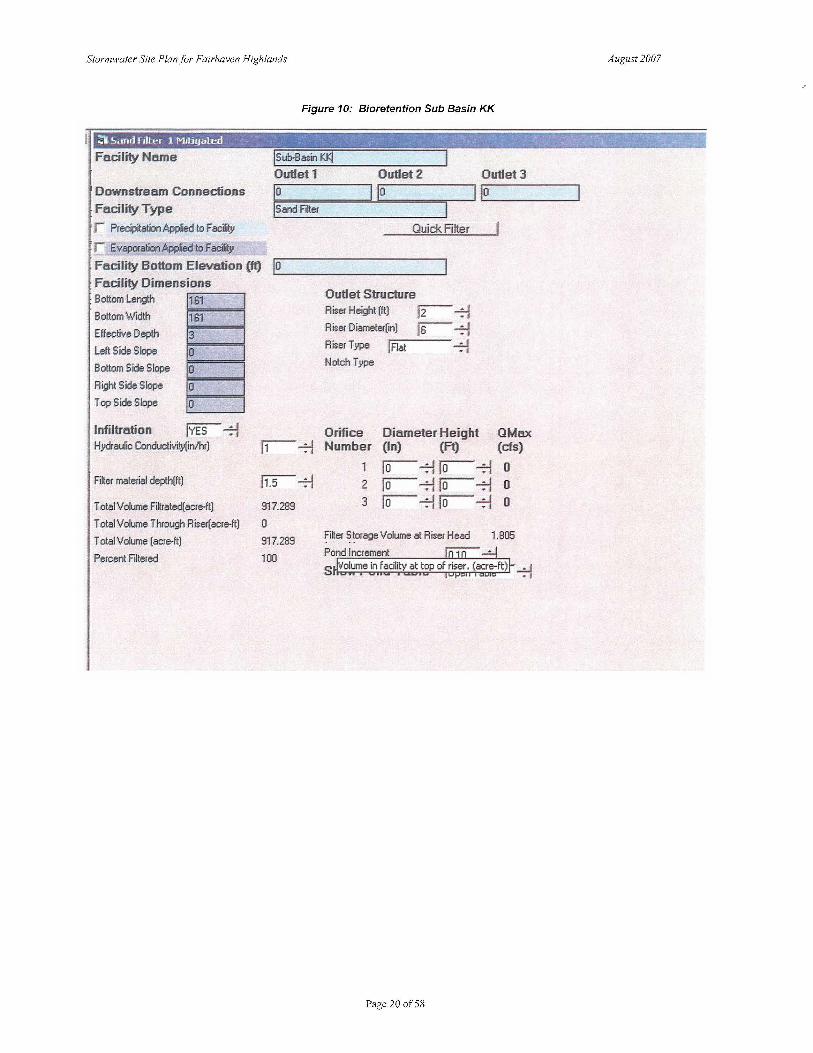
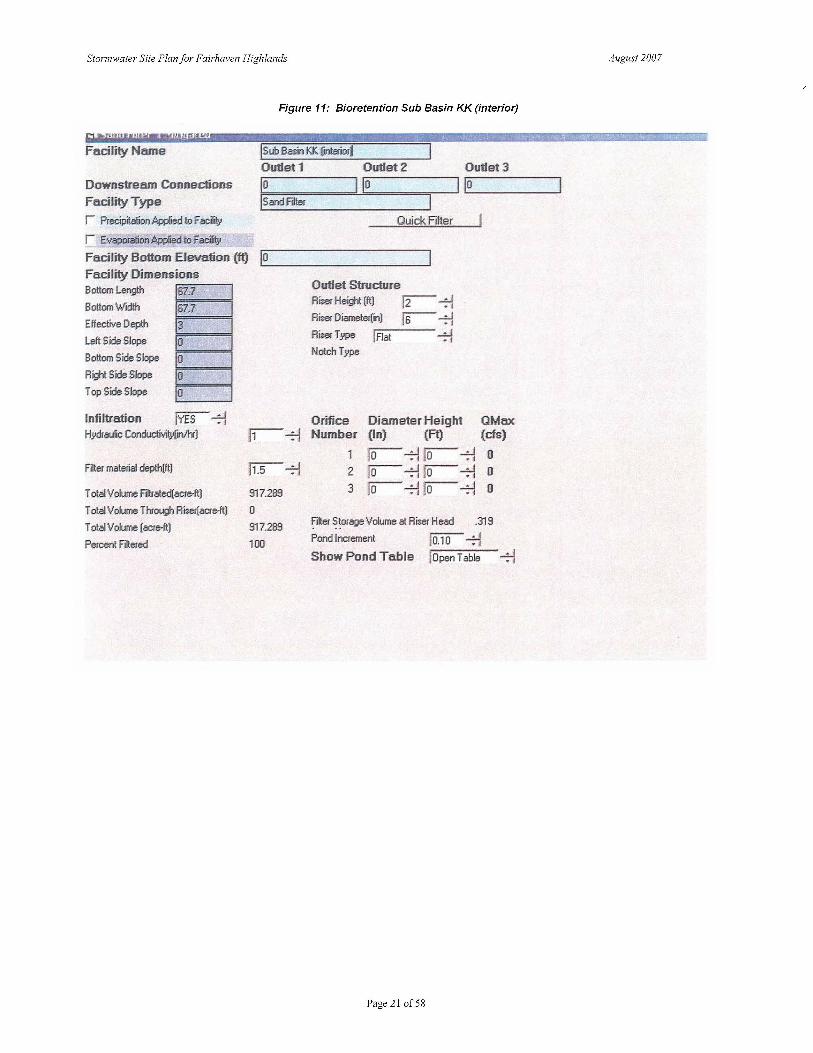
Bio-retention areas (also referred to as rain gardens) will be integrated to treat stormwater runoff throughout the project. Rain gardens function as soil and plant-base facilities that remove pollutants through a variety of physical, biological, and chemical treatment processes and qualify for enhanced treatment (required for multi-family areas). The rain gardens were modeled as Hydrologic Type C soils using the Sand Filter feature in WWHM in order to size the facility to treat 91 % of the influent runoff volume. Material layer thickness equals 1.5 ft of engineered soil mix with an infiltration rate of 1 inch/hr (per bioretention planting soil mix recommended in the Low Impact Development Technical Guidance Manual for Puget Sound) with 0.5 ft of available ponding. A typical profile is illustrated in Exhibit 9 and a bioretention planting list and soil specification are included in Appendix 8.
The project utilizes raingardens throughout to provide water quality treatment for all stormwater discharges to wetlands and forests (See Exhibit 8). There are linear raingardens parallel to many of the roads. There will be linear raingardens in conjunction with level spreaders discharging to forested wetland buffers. The rain gardens in conjunction with other appropriate water quality treatment BMPs will meet the SWMM guidelines (See Appendix, WWHM Rep01i for Water Quality), and flow dispersion will also help meet temperature reduction concerns by filtering
Page 16 of58
Stormwater Site Plan for Fairhaven Highlands August 2007
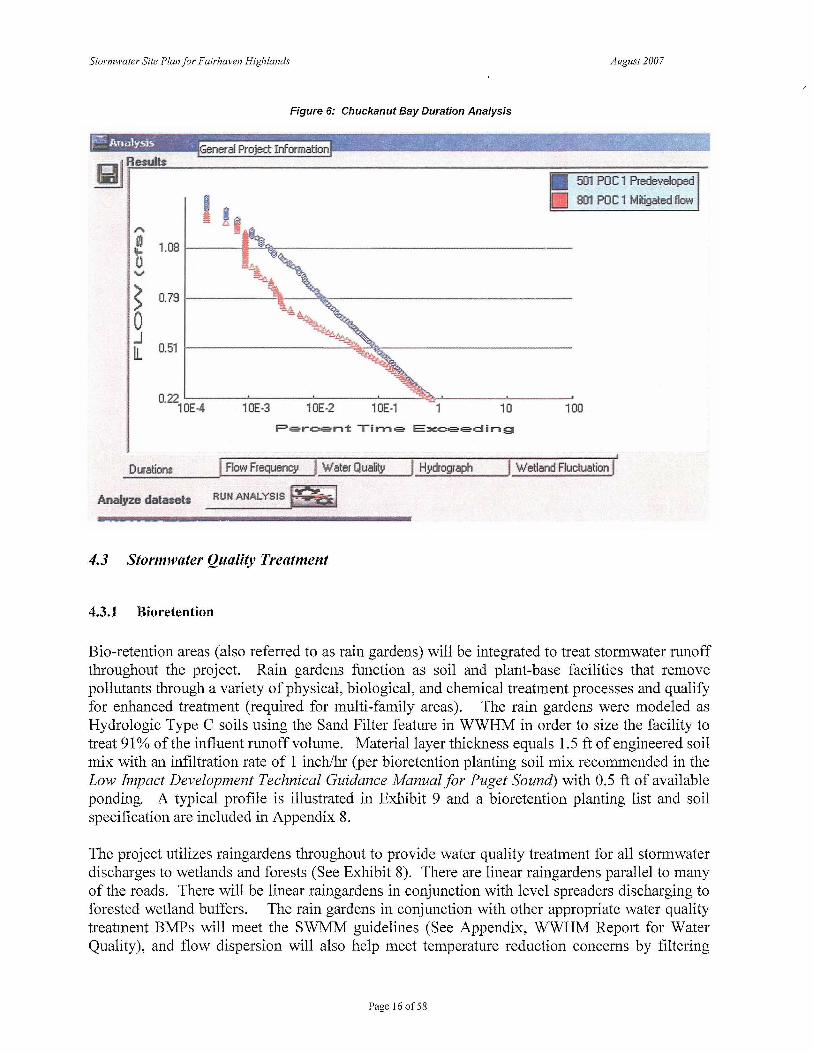
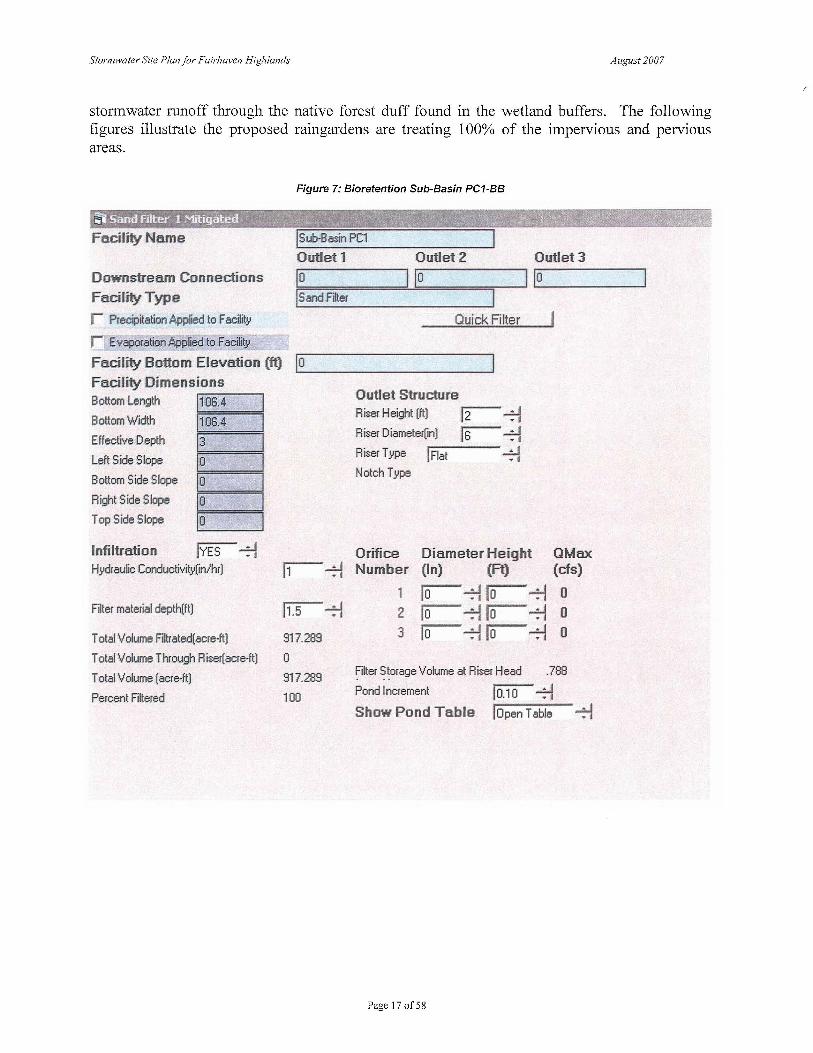
stonnwater runoff through the native forest duff found in the wetland buffers. The following figures illustrate the proposed raingardens are treating 100% of the impervious and pervious areas.
Facility Na.me
Downstream Connections Facility Type r Precipitation A.pplied to F acifity
r Evaporation ,6,pplied to Facility
Figure 7: Bioretention Sub-Basin PC1-BB
!sub-Basin PC1
0~~1 0~~2 0~~3 l~o -----.1 ~lo -----.ll~o -----. ls and Filter
Quick Filter
Facility Bottom Elevation (ft) ._lo _________ __. Facility Dimensions Bottom Length l1DB.4 Bottom Width 1106.4 Effective Depth 13 Left Side Slope jo Bottom Side Slope 10 Right Side Slope 10 Top Side Slope 10
I nfi ltrati on !YES~ Hydraulic Conductivity(in/hr)
Filter material depth(ft)
Total Volume Filtrated(.acre·ft)
Total Volume Through Riser(acre·ft)
Total Volume (acre-ft]
Percent Filtered
Outlet Structure Riser Height (ft)
Riser Diameter(in)
Riser Type !Flat
Notch Type
~-:--! rs---:--!
_.:.J • t
Orifice ~ -;-j Number
Diameter Height (In) (Ft)
QM ax (ds)
~~ 917.289
0
917.289
100
2 3
W- -:1 lo ~ o W- -;1..-lo -~ o W-~ lo ~ o
Filter Storage Volume at Riser Head .788
Pond Increment ~ -:-'i Show Pond Table fOpen Table
Page 17 of58
....:..I • t
Stormwater Site Plan for Fairhaven Highlands
Facility Name
1 Downstream Connections : Facility Type
' r Precipitation fo.pp6ed to F acilit.Y
; r E vaparatlon Appli.Eid to Facility
Figure 8: Bioretention Sub Basin PC-FF
lsubBamff Outlet 1 OuUet 2 OuUet 3
:10::::::::1~10::::::::::::=-=11~0~~~---' !sand Filler
Quick Filter
, FaciUty Bottom Elevation (ft) '-lo _____ _ __ ___, Facility Dimensions Bottom Length ,....11-77---.
Bottom Width 177 I======:
Effective Depth 3 l=====l
Left Side Slope O l=======l
Bottom Side Slope O A'9h! Side Slope l=o=====l
T.op Side Slope l._o __ __.
Infiltration Hydraulic Conductivlty(in/hr)
Filter IJJQterial deplhlft)
T o!al Volume Filtrated(acre-ft)
Total Volume Through Riser{acre-ft)
Total Volume {acre-ft)
Percent filtered
Outlet Structure Riser Height (ft) ~ ~
Riser Diameter[in) rs-~
Riser Type l FJat -:'i Notch Type
Orifice r;---;1 Number
Diameter Height QM ax (In) (Ft) (ds)
~~ 917.289
0
917.289
100
ro-~ ro--:1 0 2 W--;Ho-~ o 3 ro--~ro--~ 0
mer Storage Volume at Riser Head 2.182
Pond Increment ro:;o---;1 Show Pond Table ]Open Table ..;--!
Page 18 of58
August 2007
Stormwater Site Plan for Fairhaven Highlands
Faality Name
Downstream Connections Facility Type
r PrecipitaficmAppljed to Facii!_y
r E vapora!ion Applied to F dy
Figure 9: Bioretention Sub Basin PC-2 BB
lsw Basin 2 BBl Outlet 1 Outlet 2 Outlet 3 l.-o-----.l l.-o-----.11.--o----~ !sand Filter
Quick Filter
Facility Bottom Elevation (ft) l._o _________ _. Facility Dimensions Bottom Length Bottom Width
Effective Depth
Left Side Slope
Bollom Side Slope
Right Side Slcipe
Top Side Slope
Infiltration
1-100--~,
B § lo I (YES-:-!
Hyrlraufic Conduc!ivity{in/hr)
Filter material depth(ft)
T olalVolume Fdtrated(acre-ft)
T olal Volume T hrciugh Riser( acre-fl)
T citalVolurne (<icre.ft)
Percent Filtered
Outlet Structure Riser Height (ft) ~~ Riser Diameter[ln) rs--~
Riser Type
Notch Type jFJat ~
Orifice Diameter Height OMax ri---:i Number (In) (R) (cfs)
ro-~ ro--;-j 0 ~~ 2 ro---;1ro-~ 0
917.289 3 w--~ ro-~ 0
0
917.289
100
Filter ~~orage Volume at Riser Head .696
Pond Increment fD.10 ~ Show Pond Table !open Table ~
Page 19 of58
August 2007
Stormwater Site Plan for Fairhaven Highlands
Facility Name
Downstream Connections Facility Type r Precipitation .A.pplied to Facility
r EvaporaUon Applied lo Facilit,Y
Figure 10: Bioretention Sub Basin KK
Outlet 1 OuUet Z Outlet 3
:10:::::::::::::::~1'~=0::::::;~-=1~10~~~~--' JSand Filter
Quick Filter
Facility Bottom Elevation (ff) ,_Jo _________ __,
Facility Dimensions Bottom Length ..... ,, 61----.j
Bottom\l/idth ~361 Eff.ective Depth ~
Left Side Slope §0~ Bottom Side Slope Right Side Slope
Top Side Slope
Infiltration Hydraulic Conductivi\Y(in/hr)
Fiiter material depthflt)
Total Volume Filtrated(acre·fl) 917.289
Total Volume Through Riser(.acre-ft) 0
· Total Volume {acre-ft)
Per.cent Filtered
917.289
100
Outlet Structure Riser Height (ft) rr---~ Riser Diameter[ln) W--;1 Riser Type JRat ~ Notch Type
Orifice Number
Diameter Height QMax
2 3
(In) (Ft) (cfs)
ro-~ ro--;1 0 ro-- --:1 ro-~ 0 ro-~ ro-- -;1 0
Filter Storage Volume at Riser Head 1.805
Page 20 of 58
August 2007
Stormwater Site Plan for Fairhaven Highlands
.. Facility Name
Downstream Connections Facility Type
r Precipaa!lon tl.pp~ed to F aclflty
l EvaporationAppfiedtof~
Figure 11: Bioretention Sub Basin KK (interior)
Outlet 1 Outlet 2 Outlet 3
.:10::::::::1~10::::::~-=1~10~~~--' lsa00 Filter
Quick Filter
Facility Bottom Elevation {ft) ,_Jo _________ _.
Fa.cility Dimensions BottPm Length
Bottom Width
Effective De¢!
~ft Side Slope
Bottom Side Slope
RiJJht Side Slope
Top Side Slope
13 I lo I lo I Jo I jo I
Infiltration JYES -;1 Hydrauric Conductivity{in/hr)
Filter material depth~t)
T otalVolume Filtrated{acre-ft)
Total Volume Through Aiser(acre-ft)
Total Volume {acre•ft)
Percent Filtered
Outlet Structure Airer Height {ft] p-- -;1 Riser Diame!erfinJ rs- -:1 Riser T .l'l)e j Flat -;1 Notch Type
Orifice Dia.meter Height OMax rr----:-j Number (In) (Ft) (cfs)
917.209
0
317.209 100
ro--:-l ro- -:-l 0 2 w-- -:-l ro-~ 0 3 ro- -:-1 ro---;-! 0
filter ~~orage Volume at Riser Head .319
Pond Increment JD.10 -;-i Show Pond Ta.hie ]Open Table -:-J
Page 21 of58
August 2007

Stormwater Site Plan for Fairhaven Highlands
Facility Name
Downstream Connections Facility Type
r Precipitation Apptied to F aci1i!.v
Facility Dimensions Bottom Length ~1134-,, -.9-~I
Bottom 1vl/idth 1134.9 I
E::j Effective Depth
Left Side Slope
Bottom Side Slope E==:J0 Right Side Slope E==:J
Top Side Slope jo I Infiltration ~ ~ Hydraulic Conduc.tiYity(in/hr)
Filter material depth(tt)
Total Volume Filtrated{acre·ft)
T olal Volume Thiough Riser(acre·ft}
Total Volume (acre-ft)
Percent Filtered
4.3.2 Pervious Pavement
Figure 12: Bioretention Sub Basin CC
jsub Basin CCj
D
Quick Filter
Outlet Structure Riser Height (ft) ~~ Riser Diameter(in) rs-- -;-I Riser Type
Notch Type ~ Flat ~ . '
Orifice r;---~ Number
Diameter Height OMax (In) (Ft) (ds)
~~ 917.289
0
917.289
100
ro-~ ro--:-1 0 2 ro-~ ro--:-1 0
ro-~ ro- --:-1 0 3
~ilter ~~orage Volume at Riser Head 1.267
Pond Increment fiiiD .-:--j Show Pond Table !Open Table
August 2007
Much of the on-street parking and local building parking areas will be constructed of pervious asphalt. The areas will be paved with pervious asphalt over a 1 ft drain rock reservoir to reduce impervious area, provide detention, recharge groundwater, and improve water quality.
Porous asphalt pavement consists of standard bituminous asphalt in which the aggregate fines (particles smaller than 600 µm, or the No. 30 sieve) have been screened and reduced. A 1 ft bed of unifom1ly graded and clean washed aggregate (1.5 to 2.5-inch stone mix such as AASHTO No. 2) with a void space of 40% is placed beneath the pavement The bottom of the recharge bed
Page 22 of 58
Stormwater Site Plan for Fairhaven Highlands August 2007
is excavated to a level surface and is not compacted, allowing stormwater to distribute and infiltrate evenly over the entire bed bottom area.
The advantages of using porous pavement include water treatment by pollutant removal, recharge to local aquifers, and decreasing impervious cover. Porous pavement pollutant removal mechanisms include absorption, straining, and microbiological decomposition in the soil. An estimate of porous pavement pollutant removal efficiency is provided by two long-term monitoring studies conducted in Rockville, MD, and Prince Will, VA. These studies indicate removal efficiencies of between 82 and 92 percent for sedimentation, 65 percent for total phosphorous, and between 80 and 85 percent of total nitrogen. The Rockville, MD, site also indicated high removal rates for zinc, lead, and chemical oxygen demand (EPA Storm water Technology Fact Sheet EPA 832-F-99-023).
Initial research of pervious asphalt described in the LIDM indicates that properly designed and maintained permeable pavements can virtually eliminate surface flows for low intensity storms common in the Pacific Northwest; store or significantly attenuate subsurface flows (dependent on underlying soil and aggregate storage design and provide water quality treatment for nutrients, metals, and hydrocarbons
Page 23 of 58