4. variation in seismic noise at seismic stations …. variation in seismic... · variation in...
TRANSCRIPT
Pakistan Journal of Meteorology vol. 1 Issue:1 (Jan – March 2004)
33
VARIATION IN SEISMIC NOISE AT SEISMIC STATIONS WITH IMPLICATIONS FOR EVENT DETECTION By Jamshaid Ali, M. Daud Shah, M. Qaisar, Zahid Ali. Micro Seismic Studies Programme (MSSP). Abstract: A network of 23 analog seismic stations was established in Pakistan to monitor seismic activity. The instrumentation of seismic stations includes short period seismometers with natural period at 1 Hz. The seismic noise conditions of five seismic stations are studied to determine the detection capability in the frequency range from 1.0 Hz to 10.0 Hz regarding monitoring of local and regional seismicity. The Power spectral density of noise level of the records was computed by taking day and night samples during winter and summer seasons. The seismic noise levels at these stations range from –120 db to –157 db between 1.0 to 10 Hz, which is well within the limits defined by the Peterson’s new low and high noise model. The observed noise variations recorded during day and night range from 5 db to 17 db, depending on the site of the station. The detect-ability estimates of the selected five seismic stations installed at Fort Munroe, Cherat, Thammi Wali, Dhulian and Sargodha assume a conservative signal-to-noise ratio of 3. These stations showed detection capability 3.1, 3.3, 3.4, 3.5 and 3.8 magnitudes at 1000 km distance respectively.
Introduction: Modern seismometers can detect ground movements as small as the size of atomic spacing and thus in principal can detect the seismic wave from the smallest seismic events. However, not only the seismic events (man made or earthquakes) cause vibration in the earth but also other natural processes such as wind, ocean waves and cultural activities such as automobile traffic and factories generates continuous back ground vibrations collectively referred to as seismic noise. The seismic sensors are frequently deployed in deep tunnels or mines in order to isolate them as much as possible. The quietest sites for seismic stations are in remote areas. Considering these facts the seismic ground noise levels of a few seismic stations recorded by PAEC seismic network are studied to define the factors that affect ground noise levels and for establishing network criteria for detecting small seismic events. This study also looks into how the average noise spectrum depends on site, time (day and night) and season variation.
Pakistan Journal of Meteorology vol. 1 Issue:1 (Jan – March 2004)
34
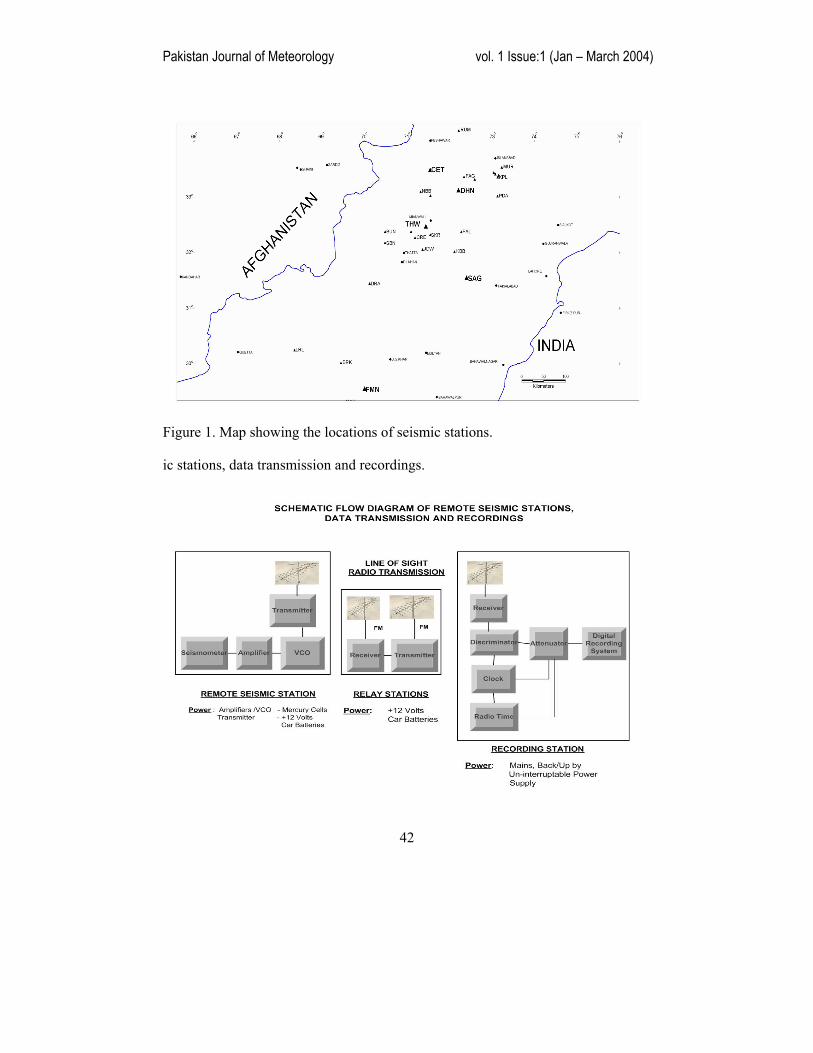
Description of the sites of the stations: The selected seismic stations are shown in Figure 1 and listed in Table 1. The seismometers installed at these stations are of the type HS-10-1B with 1 Hz natural frequency manufactured by Geo Space Corporation, which is high sensitivity self-generating velocity transducer. The seismometers are buried at a depth of 3 to 5 feet. The seismic data is recorded at the central recording Lab at Nilore and recording system is shown in Figure 2. Different environmental conditions exist at the seismic stations and they are briefly described as under.
Fort Munroe (FMO): It is located at Fort Munroe hill station on Sulaiman Fold and Thrust Belt at an elevation of 6000 feet from sea level. All the rocks masses in the area are of sedimentary nature and comprise deformed beds of limestone, shale and sandstone. This site is well safe from natural activities like streams/river and land sliding that may produce noise. The site and its surrounding have very low density of population and hence low rate of man-made noise. The sensor is placed upon thick-bedded sedimentary rock.
Cherat (CET): It is situated at Cherat hill station in NW Himalayan Fold and Thrust Belt, at an elevation of approximately 5000 feet from sea level. This region lies in the Main Boundary Thrust area, consisting of thick-bedded metamorphosed rocks of very old age (400 m y. old) dominantly slates and meta-sandstones. High to moderate winds strike the station and the vegetation at the site enhances the coupling of wind energy in to seismic noise at high frequency. The sensor is installed at depth of 3 feet in a thick-bedded rock.
Thammi Wali (THW): It is located in a mountainous area that lies at the intersection of Kohat and Potowar plateaus very close to Kalabagh strike slip fault. The site is surrounded by agricultural land and is susceptible to noise produced by agricultural activities. At Thammi Wali, the sensor with sensitivity 5.12 V/I/S is located approximately at 5 feet into a pit near the mountain.
Sargodha (SAG): It is located on flood plain deposits of Indus plains, mainly loose sandstone and siltstone. An unmatelled road passes near the site but the road traffic is minimal. The seismometer is installed at a depth of about 5 feet.
Dhulian (DHN): It is located in hilly area very close to Soan Basin in north Potohar Deformed Zone (southern extremity of NW Himalayan Fold and Thrust Belt). The basement is post Himalayan sedimentary molasses, massive thick gray sandstone. Dhulian station site is fairly isolated from human activities.
Pakistan Journal of Meteorology vol. 1 Issue:1 (Jan – March 2004)
35
Geology and Tectonic Features of the Area: Pakistan region comprises diverse nature of geologic features as it lies at the junction of Indian, Eurasian and Arabian plate boundaries, with a geologic history of subduction volcanism, mountain orogeny and also the marine to alluvial rock formations. The morphology of the region ranges from world’s most uplifted terrain, Himalayas, through plateaus, basins to seashore, Arabian. This sets a wide verity of structural, stratigraphical and geo-morphological features in a very short region.
Geodynamics of study area: The collision between Indian and Eurasian plates (about 55 m.y. ago) is responsible for the present geodynamics and stratigraphy of the area. The significant tectonic features of the region include joint mountain ranges in N and NW (Karakuram, Himalayas, Hindu Kush, Sulaiman etc), regional to local scale thrust faults (Main Karakorum Thrust MKT, Main Mantle Thrust MMT, Main Boundary Thrust MBT, etc), transform fault (Chaman), subduction associated volcanics (Chagai), plateaus, Indus Basin and delta.
The major geological features observed in area are resulted by Late Mesozoic and Cenozoic tectonism. This resulted wide distribution of igneous and meta-sedimentary rocks in N and NW, uplifted marine shelf sedimentary sequence in W and SW and great Indus plains of unconsolidated alluvium in E and SE of study area. These features become more pronounced during the post Himalayan orogeny. The collision sets the trends for the greater emergence of seismicity in the region. The present day seismicity is directly or indirectly related to the post Himalayan orogeny that has generated diverse and integrated system of active faults.
The geologic and tectonic features can be broadly categorized in to two types (Figure 3).
The mountain region comprising northwest Himalayan fold-and-thrust belt (Sub-Himalayas) and Sulaiman Fold and Thrust Belt, making the boundary between the two continental plates Indian and Eurasia.
The tectonically less complex Indus Plain formed by the alluvial deposits of the Indus River and its tributaries.
Northwest Himalayan Fold and Thrust Belt: This belt occupies a 250 km wide and about 560 km long, irregularly shaped mountainous region formed by the folded and faulted broad anticlines of sediments resulting from the collision of Indian and Eurasia plates (Deway and Bird, 1970;

Pakistan Journal of Meteorology vol. 1 Issue:1 (Jan – March 2004)
36
Mckenzi and Sclater, 1971; Molnar and Tapponier, 1975). The Hazara-Kashmir and Naga Parbat Syntaxes form its eastern margin. It covers all the terrain between Main Mantle Thrust (MMT) in the north and Salt Range Thrust in the south. This region is composed of the mountain ranges of Naga Parbat, Hazara, southern Kohistan, Swat, Margalla, Kalachitta, Kohat, Sufid Koh, Salt Range, and the in between basins and plateaus (White 1979, Jacob and Quittmeyer, 1979). The structures, that define the tectonics of the area, include Potwar Plateau (Soan Syncline), Main Boundary Thrust, Salt Range Thrust (SRT), Jhelum Fault (JF), Attock Cherat Range. The critical tectonic features that determine the seismic setup of the area include Main Boundary Thrust (MBT), Salt Range Thrust, Jhelum Fault, Kalabagh Fault, and Khairabad Fault (Kazmi and Jan, 1997).
Sulaiman Fold and Thrust Belt: This is an arc shaped elongated mountain belt about 300 km long, representing the western margin of Indian Plate in the Region. The relief ranges from a few hundred meters to nearly 3,600 m. The significant tectonic features of the region include thrusting with considerable strike slip component that has develop extensive mountain ranges and is also responsible for the present day seismicity in central Pakistan (Abdel Gawad, 1971). The general development of the faults of the region is EW trending arc shaped in the central part and NS trending in eastern and western parts.
The Indus Plain: The Indus Plain is bounded by mountain ranges to the north and west, by the Arabian Sea to the south and the Thar Desert to the east. The most conspicuous features in the Indus Plain are inter basinal ridges between Shahkot and Chiniot and small hillrocks near Khair Pur, Hyderabad and Thatta. In the north these attain an altitude of about 250 meter above sea level. The Indus Plain has gentle southward slope ranging from about 1.0 – 0.2 m / km in the north to 0.1 m / km or less in the southern part near the Indus delta. Its elevation in the north is about 180 m to 210 m, in its central part near Sukkur it is about 54 m and near the delta only 3 to 4 meter above the sea level (Islam, 1959). It comprises the flood plains, Barr- plains and the deltaic flood plains where process of degradation and aggradation are in progress. The flood plains of Indus may be defined as low-lying tracts of land along the rivers (Kazmi, 1966).
Seismic Data and Noise Analysis: For the purpose of this work, two months seismic data recorded by the network during Summer and Winter was taken for noise analysis. Five stations (FMO, CET, THW, SAG, DHN) were selected and recorded data of these stations was analyzed for different timings of day and night separately. The noise level is
Pakistan Journal of Meteorology vol. 1 Issue:1 (Jan – March 2004)
37
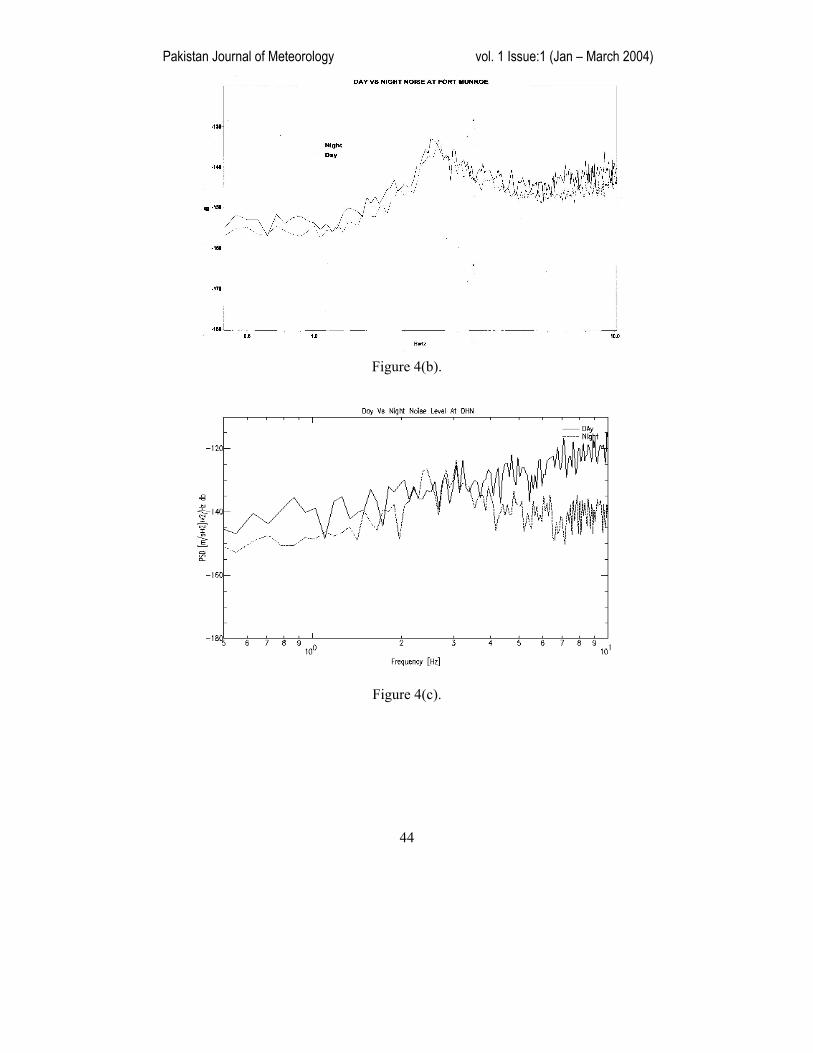
studied by means of acceleration power spectral density analysis applied at 1 Hz frequency. The average power spectral density of noise level of the records was computed by taking day and night time samples for each station during winter and summer and it was observed that winter and night-time represent low noise as compared with that of summer and daytime noise. Based upon noise conditions, average estimate of power spectral density from day and night time samples, during winter, are shown in Figures 4(a-e). The lowest noise levels were observed for winter nighttime samples for each station. The seismic station at Fort Munroe (FMO) shows the lowest noise level, which is –155 db at 1 Hz but increases up to –134 db at 2.5 Hz and remains high as –145 db between 7 to 10 Hz. The noise level at Cherat seismic station (CET) is –153 db at 1 Hz but noise spikes between 4 to 6 Hz are seen which may be due to impact of high speed wind at the site, as high frequency (1 ‹ f ‹ 60 Hz) noise levels are strongly correlated with wind speed (Wither et al., 1996 and Young et al., 1996). The noise level at Thammi Wali seismic station (THW) is -151 db at 1 Hz and increases towards 5 Hz and then remains constant up to 10 Hz. The seismic station at Dhulian (DHN) shows some spectral lines having noise level –137 db between 2 to 4 Hz and -148 db at 1 Hz. The noise level at Sargodha seismic station (SAG) is –140 db around 1 Hz but the noise level increases up to –130 db between 4 to 6 Hz.
It is further observed that daytime variations are not significant below 0.5 Hz at all stations. At Fort Munroe (FMO) daytime noise dominates the night-time noise by 5 db between 6 to 9 Hz. The station at Cherat (CET) shows significant daytime variation above 3 Hz and ranges from 5 to 17 db between 4 to 6 Hz. At Thammi Wali station (THW), the daytime noise variation is prominent with the increase in noise level about 7 db between 1.5 to 3.5 Hz and above this frequency; the increase in noise is up to 17 db during the daytime. The increase in daytime noise relative to nighttime noise at Dhulian station (DHN) starts at 2 Hz and reaches up to 7 db between 4 to 8 Hz. At Sargodha station (SAG), an increase of 8 db in the noise level during daytime relative to nighttime is noticed around 1 Hz and it attains high value as 17 db along with spectral lines between 5 to 6 Hz.
Conversion of Spectral Power Densities in to Recording Amplitude: The acceleration power spectral density of noise level is computed and then the velocity and displacement power spectral density is calculated by using following relations (Bormann, 1998).
Pv = Pa (db) + 20 log (T/2π) (1)
Pd = Pv (db) + 20 log (T/2π) (2)

Pakistan Journal of Meteorology vol. 1 Issue:1 (Jan – March 2004)
38
where Pa is acceleration power spectral density Pv is velocity power spectral density Pd is displacement power spectral density T is time period
According to Aki and Richard (1980), the root mean square amplitude (Arms) of a wavelet f (t) can be approximated in term of spectral density and bandwidth according to the following relation
Arms = {P× ( fu – fl )}1/2 (3)
where fu and fl is upper and lower frequency and P is the power spectral density.
The equation (3) shows that the root mean square amplitude (Arms) depends on the bandwidth.
To reduce the
dependency on bandwidth ( fu – fl ), the concept of
constant relative bandwidth (RBW) is used and it is defined as under
RBW = ( fu – fl ) / f0 (4)
where f0 is the geometric mean of fu and fl .If fu and fl are upper and lower corner frequencies and the filter is “n” octave, then the ratio of upper and lower frequency is
fu / fl = 2n (5)
And
f0 = (fu x fl) ½
= fl x 2n/2 (6)
Thus the relative bandwidth can be defined in term of filter parameters as below
RBW = ( fu - fi ) / f0 = (2n – 1)/2n/2 (7)
and equation (3) becomes as under
Arms = {P x (fu - fi)}1/2 = (P × fo × RBW) 1/2 (8)
where P is power spectral density
Aki and Richard (1980) showed that for one octave filter, the Arms values has a Gaussian distribution and hence average peak amplitude ( Aapa) can be approximated to 1.253 x Arms i.e.

Pakistan Journal of Meteorology vol. 1 Issue:1 (Jan – March 2004)
39
Aapa=1.253 x Arms (9)
In the present case one octave filter has been chosen. The relative bandwidth for one octave filter is
RBW = ( fu – fl ) /f0 = 0.707 (10)
where f0 = 1 Hz, fu = 1.41 Hz and fl = 0 .7 Hz
Accordingly the average peak amplitudes (Aapa) and minimum detectable magnitudes (ML) at 1000 km distance are calculated and given in Table 2.
Estimate of Minimum Detectable Magnitude: The minimum detectable magnitude versus distance at five seismic stations of the PAEC seismic network is estimated from the noise observations discussed previously. The average value of the power spectral density of noise levels relative to 1(m/s2)2 / Hz was used to quantify the average peak amplitude of the noise at each station. Minimally detectable event is defined, as the signal recorded at seismic station should be three times the background noise amplitude because it is a realistic level for detection and phase identification amidst background noise. The magnitude is calculated by using the following equation (Richter, 1958).
ML = log A+ 2.56 log ∆ - 1.67 (11)
Where A is average peak amplitude in micron and ∆ is distance in kilometer.
The magnitude vs distance for these stations are estimated and results are shown in Figure 5. The seismic station at Fort Munroe (FMO) shows minimum magnitude detectability and can detect an event with magnitude 3.1 at 1,000 km. CET and THW show magnitude detectability 3.3 and 3.4 respectively. The minimum magnitude detectability at DHN and SAG is 3.5 and 3.8 respectively.
Conclusion: Average noise level above 1 Hz depends strongly on the characteristics of the station site. All the selected sites have a noise level that is well with in the limits defined by the Peterson’s new low and high noise model (Figure 6). The station at Fort Munroe (FMO) has the lowest noise level that is –155 db at 1 Hz where as the Sargodha seismic station (SAG) has the highest noise level –140 db at 1 Hz. The Cherat seismic station (CET) has the noise level –153 db at 1 Hz but reaches up to –125 db between 4 to 6 Hz. At Dhulian seismic station (DHN) the noise level raises to –135 db between 2 to 4 Hz. The noise level at Thammi Wali seismic

Pakistan Journal of Meteorology vol. 1 Issue:1 (Jan – March 2004)
40
station (THW) fluctuates around -133 db between 3 to 10 H z. However the noise fluctuations observed in mountainous stations located at Cherat, Fort Munroe and Dhulian are due to the impact of high-speed wind.
The estimated average magnitudes show that ML 2.9 event at 500 km and ML 3.6 event at 1,000 km distance should be detected by all the selected stations under winter and night noise condition if signal frequency is 1 Hz. Actual minimum magnitude detectable at the stations may be a bit smaller than those estimated here due to conservativeness in assumption of signal–to-noise level. Because of lower noise level, the station FMO has shown the best performance in detecting the seismic events.
The seismic noise level at Sargodha seismic station (SAG) is higher with respect to other stations. It may be due to the working of stone breaking/crushing machines in the vicinity of this station. It can be reduced partially by shifting the station to a new site with minimal seismic noise sources (manmade and natural) as compared to previous one and installing the seismometer on isolated concrete structure in a vault.
References: Abdel Gawad, M., (1971). Wrench movements in the Baluchistan arc and relation to Himalayan-Indian ocean tectonics. Bull Geol. Soc. Am., V. 82, pp. 1235-1250.
Aki, K., & Richard, P. G., (1980). Quantitative seismology. Freeman, San Francisco, V. I, p. 498.
Bormann, P., (1998). Conversion and comparability of data presentations on seismic back ground noise. J. Seism., V. 2, pp. 37-45.
Dewey, J. & Bird, J. (1970). Mountain belts and the new global tectonics. J. Geophys. Res., V. 75, pp. 2625-2647.
Gansser, A., (1964). Geology of the Himalayas. Wiley, New York, p. 289.
Islam, S. R., (1959). The Indus submarine canyon. Pak. Geog. Review, V. 14, pp. 32-34.
Jacob, K. H. & Quittmeyer, R. L., (1979). The Makran region of Pakistan and Iran: Trench arc system with active plate subduction. In: Geodynamics of Pakistan (Farah, A. & Dejong K. A., eds). Geol. Surv., Quetta, pp. 305-317.

Pakistan Journal of Meteorology vol. 1 Issue:1 (Jan – March 2004)
41
Kazmi, A. H., (1966). Geology of Indus plain. Geology Dept., Cambridge Univ., U. K., p. 98.
Kazmi, A. H., and Jan, M. Q., (1977). Geology and tectonics of Pakistan, Graphic publishers Karachi, Pakistan.
Molnar, P. & Tapponier, P., (1975). Cenozoic tectonics of Asia: effects of continental collision. Science, V. 189, pp. 419-426.
McKenzi, D. & Sclater J. G., (1971). The evaluation of Indian Ocean since the late Cretaceous. Royal Astron. Soc. Geophys. J., V. 24.
Nowroozi, A., (1971). Seismo-tectonics of the Persian plate, Eastern Turkey, Caucasus and Hindu Kush region. Bull. Seism. Soc. Am., V. 61, pp. 823-850.
Peterson, J., (1993). Observations and modeling of seismic back ground noise. U. S. Geol. Survey Open–File Report 93-322, p. 95.
Richter, C. F., (1958). Elementary Seismology, W.H. Freeman & Co., San Francisco.
White, R. S., (1979). Deformation of the Makran Continental margin. Geol. Surv. Pak., Quetta.
Withers, M. M., R. C. Aster, C.J. Young and E.P. Chael, (1996): High frequency analysis of seismic background noise as function of wind speed and shallow depth, Bull. Seism. Soc. Am., V. 86, pp. 1507-1515.
Young, C. J., E. P. CHAEL, M. M. Wither and R. C. Aster, (1996). A comparison of the high (› 1 Hz) surface and subsurface noise environment at three sites in the United States, Bull. Seism. Soc. Am., V. 86, pp. 1516-1528.
Pakistan Journal of Meteorology vol. 1 Issue:1 (Jan – March 2004)
42
Figure 1. Map showing the locations of seismic stations.
ic stations, data transmission and recordings.

Pakistan Journal of Meteorology vol. 1 Issue:1 (Jan – March 2004)
43
Figure 3. Geologic and tectonic features of the area around the network.
Figure 4(a).
Pakistan Journal of Meteorology vol. 1 Issue:1 (Jan – March 2004)
44
Figure 4(b).
Figure 4(c).

Pakistan Journal of Meteorology vol. 1 Issue:1 (Jan – March 2004)
45
Figure 4(d).
Figure 4(e).

Pakistan Journal of Meteorology vol. 1 Issue:1 (Jan – March 2004)
46
Figure 5. Minimum Detectable Magnitude vs Distance.
Table 1. Station Locations
Station Name Station Code Latitude Longitude
Cherat CET 33° 49.24َ N 71° 54.32َ E
Thammi Wali THW 32° 47.39َ N 71° 44.33َ E
Sargodha SAG 31° 55.17َ N 72° 40.18َ E
Dhulian DHN 33° 12.54َ N 72° 21.28َ E
Fort Munroe FMO 29° 55.26َ N 70° 00.59َ E
0
0.5
1
1.5
2
2.5
3
3.5
4
100 200 300 400 500 600 700 800 900 1000Distance (km)
Mag
nitu
de
SAGDHNTHWCETFMO

Pakistan Journal of Meteorology vol. 1 Issue:1 (Jan – March 2004)
47
Table 2. Minimum Detectable Magnitude (ML) at 1000 km distance
Station Name Magnitude
(ML)
Fort Munroe 3.1
Cherat 3.3
Thammi Wali 3.4
Dhulian 3.5
Sargodha 3.8
Pow
er S
pect
ral D
ensi
ty (m
/s 2
)2 /Hz
db
Frequency (Hz)
High Model
THW
CET
Figure 6. Seismic Noise at Cherat and Thammi Wali stations of MSSP network as compared to the new global seismic noise model by Peterson (1993).