4 taxes applicable to mining in south …s3.amazonaws.com/zanran_storage/ taxes applicable to mining...
TRANSCRIPT

Northern Cape Province – Miner al sector strategy
41
4 TAXES APPLICABLE TO MINING IN SOUTH AFRICA
4.1 INTRODUCTION Trevor Manuel summarised the Governments approach well on the 24 Oct ober 2002 with these words:
“The central chal lenge f acing the Government that took of f ice in April 1994 was to build a modern, vibrant economy that could assume its r ightf ul place in the global economic community, whi le addressing the massive back logs in access to v ital social and economic serv ices, which was manif est in the extreme inequality of income and wealth.” (Manuel 2002)
There have been f ar reaching changes in t he Sout h Af rican mining sector in t he past f ew years with t he change f rom t he large mining houses, and in the last three years t he introduction of :
the Mineral and Petroleum Resources Development Act, 2002 (“the MPRDA”); the Broad-Based Socio-Economic Empowerment Charter, 2002 (“the Charter”) and the related “Scorecard” (2003) (“the Scorecard”); and the Mineral and Petroleum Royalty Bill, (2003) (“t he M&PMB”) the Beneficiation Bill (as yet unpublished) and the Precious Minerals and Diamonds
General Amendment Bill (released f or public comment 2004) (“the PMDB”)
4.1.1 WHEN IS TAX MINING TAX
Tax can only be considered as a mining tax when a mineral is being mined. This legislative def inition appears of what constit utes a mineral is apparently more expans ive than the current interpretation of the term “mineral” as used in the Income Tax Act. According to Van Blerck (1992), revenue enf orcement accepts that the quarry ing of conglomerat e does not constitute minerals. Sand, stone, rocks (such as granite), gravel, c lay , soil, etc. may also theref ore fall outside the mining regime for purposes of the Income Tax Act.
4.1.2 TAX ADMINISTRATION
Companies pay tax over a f iscal year coinc iding wit h the company's financial year. Companies and close corporations are taken as prov isional taxpayers and must theref ore pay tax in two inst alments, the f irst f alling due six months af ter the commencement of the year of assessment and the second at the end of the year of assessment. Late payment leads to a penalty and interest. A third (“top up”) payment must be made within seven mont hs af ter the end of the assessment year if the total amount paid by way of prov isional taxes is less than the amount of tax assessed. Int erest (non-deductible) is payable (13%. ). If the total amount paid exceeds the tax assessed, interest is payable to the taxpayer (9%). This interest is not taxable in the hands of non-resident taxpayers.(Werksmans 2004)
4.1.3 OVERVIEW OF RECENT LEGISLATION
Changes that foster an environment that is internationally competitive, encourages investment and leads to economic growt h are import ant, and this has been t he aim of the government in recent years.
Northern Cape Province – Miner al sector strategy
42
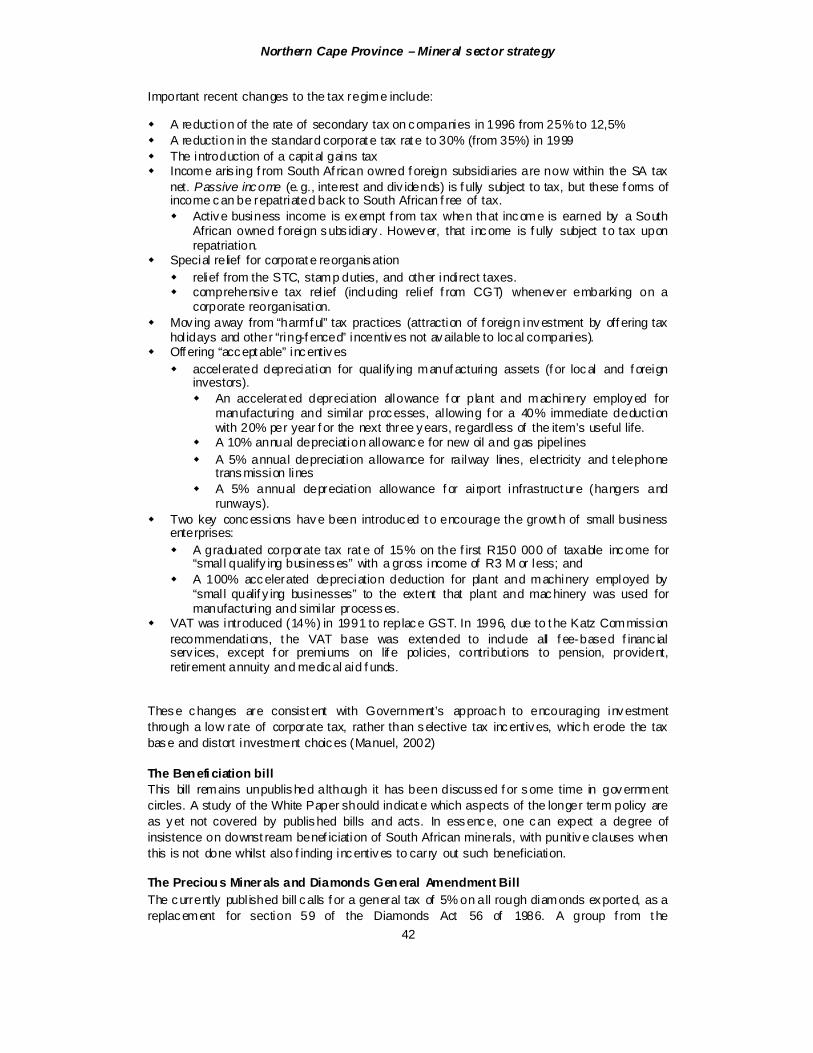
Important recent changes to the tax regime include:
A reduction of the rate of secondary tax on companies in 1996 from 25% to 12,5% A reduction in the standard corporat e tax rat e to 30% (from 35%) in 1999 The introduction of a capit al gains tax Income aris ing f rom South Af rican owned f oreign subsidiaries are now within the SA tax
net. Passive income (e. g., interest and div idends) is f ully subject to tax, but these f orms of income can be repatriated back to South African f ree of tax.
Active business income is exempt f rom tax when that income is earned by a South African owned f oreign subs idiary . However, that income is f ully subject t o tax upon repatriation.
Special relief for corporat e reorganisation relief from the STC, stamp duties, and other indirect taxes. comprehensive tax rel ief (including relief f rom CGT) whenever embarking on a
corporate reorganisation. Mov ing away from “harmf ul” tax practices (attraction of f oreign investment by off ering tax
hol idays and other “ring-f enced” incentives not available to local companies). Off ering “accept able” incentives
accelerated depreciation for qual ify ing manuf acturing assets (f or local and f oreign investors).
An accelerat ed depreciation allowance f or plant and machinery employed for manufacturing and similar processes, al lowing f or a 40% immediate deduction with 20% per year f or the next three years, regardless of the item’s useful life.
A 10% annual depreciation allowance for new oil and gas pipel ines A 5% annual depreciation allowance for railway lines, electricity and t elephone
transmission lines A 5% annual depreciation allowance f or airport infrastruct ure (hangers and
runways). Two key concessions have been introduced t o encourage the growt h of small business
enterprises: A graduated corporate tax rat e of 15% on the f irst R150 000 of taxable income for
“smal l qualify ing businesses” with a gross income of R3 M or less; and A 100% accelerated depreciation deduction for plant and machinery employed by
“smal l qualif y ing businesses” to the extent that plant and machinery was used for manufacturing and simi lar processes.
VAT was introduced (14%) in 1991 to replace GST. In 1996, due to t he Katz Commission recommendations, t he VAT base was extended to include all f ee-based f inanc ial serv ices, except f or premiums on lif e pol icies, contributions to pension, provident, retirement annuity and medical aid f unds.
These changes are consist ent with Government’s approach to encouraging investment through a low rate of corporate tax, rather than selective tax incentives, which erode the tax base and distort investment choices (Manuel, 2002)
The Benefi ciation bill This bill remains unpublished although it has been discussed f or some time in government circles. A study of the White Paper should indicat e which aspects of the longer term policy are as yet not covered by published bills and acts. In essence, one can expect a degree of insistence on downst ream benef iciation of South African minerals, with punitive clauses when this is not done whilst also f inding incentives to carry out such beneficiation.
The Precious Miner als and Diamonds General Amendment Bill The currently publ ished bill calls f or a general tax of 5% on all rough diamonds exported, as a replacement for section 59 of the Diamonds Act 56 of 1986. A group f rom t he

Northern Cape Province – Miner al sector strategy
43
interdepartment al redraf ting team recently v isited London, Antwerp and I ndia to get a better understanding of the world diamond and jewellery market. The bill is currently being hotly debat ed and many written submissions have been submitted to the int erdepartmental redraf ting t eam. It is possible that the final product could dif fer considerably f rom the published bill, and it is expected that the results of the changes would give a s ignif icant boost to local benef iciation of diamonds.
The industry and government met for two days (11-12th October, 2004) to debate some of the issues. The f ollowing represents some of the highlights of this debate:
The bill appears to be one which aff ects prov inces and theref ore would be directed to t he National Council of Prov inces according to section 75 of the constitution
If the 5% t ax were to be instituted it must be set out in the f orm of a money bill The current system which calls f or a 15% tax (but there are escape clauses) has led to no
tax intake in all the years it has been in place. Minist er Mlambo-Ngcuka ensured all present that the new act would
ensure security of supply , restructure diamond board was to be with t he government play ing a stronger role There wi ll be a new supply agency v ia the diamond board There wi ll be a degree of restriction wit h regard dealers
The larger miners and cutters cal led f or a chart er to set out requirements f or the cutting and deal ing sections of the market
De Beers suggested a partnership with government in a selling organisation modelled on the Indian system
It became clear that major constraints to growing the downstream market include: Lack of supply to smaller cutt ers due to pricing and packet size constraints VAT on uncut diamonds, which causes local stones to be the most expensive in the
world due to t he need to f inance the VAT Section 59 agreements Treasury agreements (2% agreement wit h Transhex) Lack of dat a and possible inconsistency of f oreign currency returns versus local
tender prices
The bill is expected to pass through parliament in 2005.

Northern Cape Province – Miner al sector strategy
44
Write off allowances Table 3: Write-off allowances for capit al expenditure
Cap ital expenditure Allo wanc e First y ear Subsequent y ears Mini ng Capi tal expenditure+ 100% #@ #@
Care and Mai ntenanc e 100%
Infrast ructure 10% 10% Priv ate motor v ehicl es 20% 20% Land Not deduc tible Mineral rights Not deduc tible Mineral ex plorati on+ + 100% #@ #@
Railway lines for transpo rtation of persons, goods or things
5% 5%
Certain beneficiation proc ess es (e.g. briquet ting fines, ferroc hrome Ti tanium sl ag)
50% or 10% of assets&
Indust rial Plant and Mac hinery!! @@ 20-33,3% 20-33.3% Housi ng projects (Min 5 units) for employ ees!! 10% 2% +It may be difficult to determine the line between mining and beneficiation. The latter is seen as manufacturing and allows for a write-of f allowance of 40:20:20:20. It appears that i n South Africa, mini ng includes beneficiation to the metal wher e the conversion is done by the s ame legal entit y. Where another legal entit y refines the product (e.g. Rand refineries) they are s ubjec t to the manufacturing tax write-of f provisions #Note that this is limited to income deri ved from mining at the mine concerned (due to ring fencing rules), excess expenditures, if any, can be carried forward indefinitel y and will be deemed to be capital expenditure incurred in the next year of ass ess ment (Deloitte Touche Tohmatsu, 2004) @ Income from the disposal of mi ning assets can be set off against mining capital expenditure, so that onl y net expenditure qualifies for the deduction. ++ may be spread over a number of years !! may not be applicable to mining, @@SB gets 100% Sources: Deloitte Touche Tohmatsu, 2004, Werksmans 2004
Mining capital expenditure includes the costs of all mine equipment, shaf t sinking and other development work, pre-production administration and management costs, as well as infrastructure costs. The latter can include costs incurred f or the benef it of staff (such as employee housing, hospit als, schools, and recreational f acilities) and f or systems for transporting the mine’s output to existing public transport systems or outlets (Deloitte Touche Tohmatsu, 2004).
An additional large scale industrial investment allowance as a percent age of the cost of plant, machinery or indust rial buildings may be allowed where the activ ity counts as manuf acturing, examples include briquetting of fine ore production of ferrochrome or tit anium slag. The allowance is granted in addition to t he normal capital allowances granted to such assets. The project must be approved by the minister of trade and industry as a “st rategic industr ial project”. To qualif y as a strategic industr ial project, the following conditions must be satisf ied:
the total cost of the plant, machinery and industr ial buildings t o be used by the project must be at least R50M
the assets must be brought into use by the project wit hin three years f rom t he dat e of approval;

Northern Cape Province – Miner al sector strategy
45
the project must increase South African production in the relevant industrial sect or, af ter taking into account any displacement of existing production and, if the project is an expansion of an existing operation, the project must signif icantly increase the production of that operation;
the project must not receive any other incentives f rom the government; the project must have long-term commercial v iability; the application f or approval must be submitted before July 31 2005 (applications will be
denied once t he total f or strategic industrial projects exceeds R10 bil lion; and the project must signif icantly increase growth or employment in South Af rica.
In addition, the minister wi ll t ake int o account the extent to which t he project will upgrade South Af rican industry as well as the extent to which t he project will prov ide general business links in South Af rica. The al lowance will be either 50% or 100% of the cost of the relevant assets. The al lowance will be granted in t he year that the company brings t he relevant asset into use. (Deloitte Touche Tohmatsu, 2004).
The I ncome Tax Act allows special deductions relating to repairs, wear and t ear and depreciation, legal expenses, medical and dental expenses, restraint of trade payments, bad and doubtf ul debts, leasehold improvements, lease premiums, donations to public benef it organisations, trading stock and contributions to pension and prov ident f unds and reti rement annuities (Werksmans, 2004), it is unc lear to what extent these are appl icable to mining companies.
4.2 INDIRECT TAXATION Only some of the more pertinent indirect taxes are covered.
4.2.1 EXPORT DUTY ON DIAMONDS
According to Section 62 of the Diamond Act, No 56 of 1986, all unpol ished diamonds exported from South Af rica are subject to an export duty of 15 per cent of their fair market value. However, Section 63(1) of the Act provides that a diamond may be exempted f rom export duty subject to the following conditions:
the diamond has been recovered or won f rom a mine t hat cannot be worked prof itably but should nevert heless be worked or developed in the national interest;
in accordance with Section 59 of the Act, the diamond has been offered f or sale to a local diamond cutter or toolmaker at a diamond exchange regist ered in terms of the Act, and that it could not be sold at a f air price;
it is permitted by an agreement between the South African Diamond Board and a producer or a dealer, concluded f or the purpose of helping to promote the local diamond cutting and tool-making industry;
it is a synthetic diamond; the Minister with the concurrence of the Minister of Finance determines that it be so
exempted.
The current Precious Minerals and Diamonds General Amendment Bill imposes a 5% duty on all rough diamond export. Although int ended t o stimulate t he local cutting industry , this could have a very negative ef f ect in that it wil l directly lower prof its or (at the current rand/dollar exchange rat es) increase losses, would probably lead to highgrading (where possible) and have no beneficial ef fect except for adding to the tax takein the short term. If, however it causes a f urtherance of losses, or results in highgrading, it could considerably lower t he period over which tax could be lev ied (and over which jobs and f oreign income would be available).

Northern Cape Province – Miner al sector strategy
46
4.2.2 FUEL TAX
While the tax on petrol in South Af rica compares f avourably with most countries, the same cannot be said about the way agriculture, f orestry, f ishing and mining are t axed on diesel. Until a f ew years ago, no t ax relief was given t o these primary industr ies, so that they were at a disadvant age when striving to compete on the world market and their prices of domestic products are higher than need be.
All South Af rican "of f -road" industries, such as shipping, of f shore oi l exploration; f orest ry , mining and f arming have to pay taxes on diesel. However, as from 7 April 2004 the tax relief on diesel tax f or primary producers such as mining inc reased f rom 31. 6% to 38.8% (essentially to make up f or an inc reased tax rate) (MSI Nolands 2004).
4.2.3 LOCAL AND REGIONAL GOVERNM ENT TAXES
4.2.3.1 MUNICIPAL TAXES Local governments levy rates on the value of f ixed property to f inance the cost of municipal serv ices (Anon., 2004). The value of real est ate on which such local t axes are lev ied may include land together with improvements and buildings on the property (Werksmans, 2004).
4.2.3.2 REGIONAL SERVICES COUNCIL LEVIES Regional Serv ices Councils, Metropolitan Councils and Joint Serv ices Boards are responsible f or the supply of basic services within their regions. A regional establishment levy is payable by businesses t o these councils. This is calculat ed on t he gross consideration received in respect of the sale or letting of goods, the sale or letting of f ixed property and any trade, business or prof essional serv ice rendered. A regional serv ices levy is also payable on t he salary paid by an employer to employees.
The amounts of these lev ies vary from region to region, but t he amounts are very small – for example, in the Johannesburg area, the regional establishment levy, payable on income, is 0.1408% whi le t he regional serv ices levy , payable on remuneration, is 0.3509% (Werksmans, 2004). VAT is added to these amounts.
4.3 COMPARISON TO OTHER DEVELOPING COUNTRIES Table 4 indicates the total ef fective tax f or all tax types on a typical mine in a selection of countries that compete f or mining investment. Although there is a wide disparity in rates, most developing economies have an ef fective rate in t he 42-63% range. Based on this comparison by Otto (2000) Sout h Af rica has the lowest rate. .

Northern Cape Province – Miner al sector strategy
47
Table 4 Total eff ective tax rate in developing economies
Model Gold Mine Effective tax rate (%)
Model Copper Mine Effective tax rate (%)
Burkina Faso 106.0 83.9 Poland 90.2 37.1 China 73.9 41.7 Pap.New Guinea 72.3 57.8 Ivory Coast 69.1 62.4 Mexico 62.9 49.9 Uzbekistan 62.0 62.9 Indonesia 60.4 48.6 Boliv ia 52.4 43.1 Tanzania 57.9 47.8 Kazakstan 54.4 46.1 Ghana 56.7 54.4 Greenland 54.9 50.2 Peru 45.5 42.8 Zimbabwe 45.9 39.8 Argentina 42.5 40.0 Chile 36.8 36.6 Philippines 38.2 45.3 South Af rica 32.6 45.0
Source: Ot to, 2000
4.4 IMPACT OF TAXATION ON PROFITABILITY Prof itability (and with it the abi lity to compete eff ectively) of Sout h Af rican companies is hampered by several factors namely
Inequitable income taxation (f oreign companies pay 35% but are exempt f rom STC vs local 30% plus STC)
South Af rican companies must pay a proportional f uel levy which is not required f rom f oreign companies.

Northern Cape Province – Miner al sector strategy
48
5 ASSESSMENT OF MAJOR MINERAL OPERATIONS
5.1 BASE METALS (COPPER, LEAD & ZINC)
5.1.1 OVERVIEW The world is currently experiencing a commodity boom mainly as a result of strong growth in the Asian economies, led by China. This has led to signif icant inc reases in base metals prices, with the copper price f or instance, increasing f rom US$1 457/t in 1986 to the current (8 October 2004) price of US$3 197/t (equivalent to R20 876 at an exchange rate of R6.53/$).
The Black Mountain copper–lead-zinc mine is t he only base metal mine operating in t he Prov ince. It has recently completed a major capit al expenditure program, which has enabled it to access the Black Mountain ore body to supplement production f rom its Broken Hill ore body , thereby ext ending its lif e to 2013. The mine is also mining a small t onnage of zinc ore (10 ktpm) f rom the Gamsberg trial mine to supplement f eed to its concentrator. In October 2003, Okiep Copper Company closed its last mining operation. It is currently busy with closure and rehabi litation. The company is investigating whether it wil l be economic to reprocess some of the old tai lings dams at the current copper price levels.
There a number of deposits that have been considered t o be uneconomic in t he past that that could be re-examined in the light of prevailing high metal prices modern extraction techniques such as bacterial leaching, Sirosmelt and/or Solvent Extraction/Electro-winning. The Gamsberg zinc deposit near Aggenys appears t o be the most promising, prov ided that the manganese in the ore can be removed economically .
5.1.2 MARKETS World industrial expansion, according to Standard Bank (July 2004), is currently growing at about 6% and is expected to slow down to about 5% in 2005 with the corresponding figures f or China being 17% and 13%, respectively . Growt h of China’s GDP is expect ed to s low down to 7% per annum, but industrial and inf rastructure projects that have been initiat ed should sust ain demand f rom China for some years t o come. A large proportion t hereof involves power generation and transmission, and construction. In addition the demand for motor vehicles is expected to exceed 600 000 units in 2004 but with the growt h in demand slowing f rom about 40% in 2004 to about 20% in 2005.
China, a major zinc producer, is expect ed t o decrease its zinc production due to problems with power supply . Copper production in Zambia was reduced from 700 kt in 1970 to 241 kt in 2000 as a result of nationalisation of mines. Presently however, the mines in t he country are being re-opened as a result of the government’s privatisation pol icy . Error! Reference source not found. illust rates how the prices have risen.
Table 5 Base Metal Prices (2001 to 2004)
8/10/2001 8/10/2002 8/10/2003 8/10/2004 Pr ice/tonn e Pr ice/tonn e Pr ice/tonne Pr ice/tonn e
Metal
US$ R US$ R US$ R US$ R Cu 1 391 12 908 1 443 15 180 1 840 12 641 3 197 20 876

Northern Cape Province – Miner al sector strategy
49
Pb 462 4 287 412 4 334 561 3 854 983 6 419 Zn 770 7 146 743 7 811 876 6 019 1 132 7 389 US$ 1 9.28 1 10.52 1 6.87 1 6.53
5.1.3 REVIEW OF INVESTMENT OPPORTUNITIES Gamsberg Zinc Deposit The large Gamsberg zinc-lead mass ive sulphide deposit located some 45km to the east the Black Mount ain mine is estimated to contain 150 Mt of ore averaging 7.1 % Zn and 0.5 % Pb. The project concept underly ing the most recent f easibil ity study , that was carried out during 2000 to 2001 by Anglo American, envisaged establishing a large scale open cast mine to produce 600 ktpa of zinc concentrate.
The base case scenario envisaged rail ing the concentrat e to Saldanha f or smelting to produce 300 ktpa of zinc ingots and 540 ktpa of sulphuric acid, bot h f or export. The alternative scenario is to locate the smelter at Gamsberg. Both scenarios require access to the Sishen line and envisage building a dedicated rail line linking Gamsberg to loop 10 on t he Sishen-Saldanha line. It is understood that the project faces three major problems:
The transport cost: both capital and operating Market entry risk: the scale of the env isaged production, especially f or the sulphuric acid
wi ll make market entry very difficult. Technical risk: the ore has a high manganese cont ent and t he company is researching
methods to deal wit h it.
No decision was made to progress with the project.
Lutzputs Iron-Copper-Silver Deposits Vein hosted iron-copper silver bodies occur on the f arm Cnydas East 439 in the Lutzputs area, about 60 km West of Upingt on. Sulphide mineralisation, consisting of chalcopy rite (Cu), f reibergite (argentiferous Cu, Fe, Sb), arsenopyrite (As) and pyrite (Fe) is confined largely to sheared portions of magnetite-haematit e bodies that cont ain iron ore grading at 52.5 % iron, with accessory copper. The bodies st rike north, north-east and have maximum dimensions of 400 x 600 m at surf ace. The depos its have been found to be uneconomic as a result of the erratic nat ure of the sulphide mineralisation and the l imit ed t onnage available. This has been conf irmed by a recent assessment carried out by Freeman (October 2004).
Boksputs Several lenses of cuprif erous iron sulphides are f ound on the f arm Boksputs 118, 30 km nort hwest of Putsonderwater. They lie within chloritic, amphibolitic and garnet-biotite gneisses of the Jannelsepan f ormation. There are six lodes on the f arm, four of which contain 1.5 % Cu in 1.7 Mt of ore. This is potentially a small mining opportunity if one or more mines were also to be est abl ished in t he area, for instance at Jacomynspan and Rok Optel (see paragraph on Putsonderwat er ore-bodies, below) and inf rastruct ure were to be shared or hired.
Putsonderwater disseminated nickel-copper sulphide ore-bodies. There are f our low-grade copper-nickel occurrences near Putsonderwat er, in t he Kenhardt District, three of which occur on the f arms Jacomynspan 176, Hartebeest Pan 175 and Rok Opt el 172. The latter constit ute a total ore reserve of about 149 Mt grading about 0.3 % Ni and 0.2 % Cu. Further det ails are given in the section on nickel deposits.
Areachap
Northern Cape Province – Miner al sector strategy
50
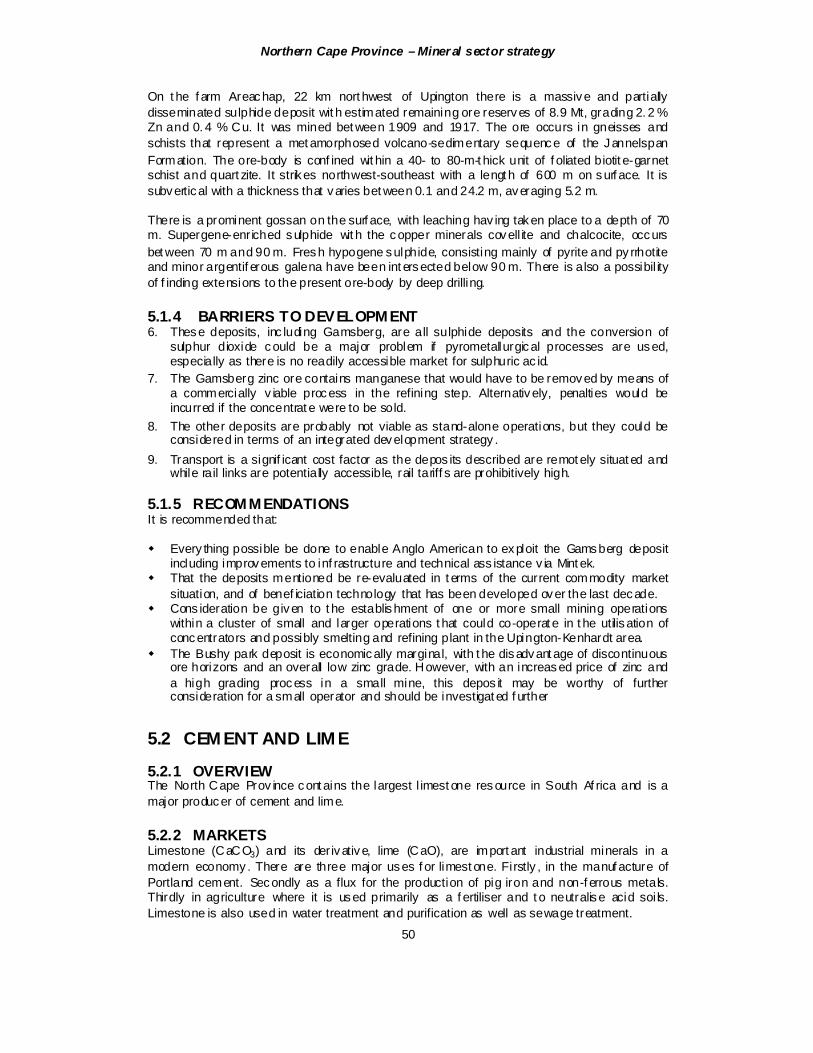
On t he f arm Areachap, 22 km nort hwest of Upington there is a massive and partially disseminated sulphide deposit wit h estimated remaining ore reserves of 8.9 Mt, grading 2. 2 % Zn and 0. 4 % Cu. It was mined bet ween 1909 and 1917. The ore occurs in gneisses and schists that represent a met amorphosed volcano-sedimentary sequence of the Jannelspan Formation. The ore-body is conf ined wit hin a 40- to 80-m-t hick unit of f oliated biotit e-garnet schist and quart zite. It strikes northwest-southeast with a lengt h of 600 m on surf ace. It is subvertical with a thickness that varies bet ween 0.1 and 24.2 m, averaging 5.2 m.
There is a prominent gossan on the surf ace, with leaching hav ing taken place to a depth of 70 m. Supergene-enriched sulphide wit h the copper minerals covell ite and chalcocite, occurs bet ween 70 m and 90 m. Fresh hypogene sulphide, consisting mainly of pyrite and py rrhotite and minor argentif erous galena have been int ersected below 90 m. There is also a possibil ity of f inding extensions to the present ore-body by deep drilling.
5.1.4 BARRIERS TO DEVELOPMENT 6. These deposits, inc luding Gamsberg, are all sulphide deposits and the conversion of
sulphur dioxide could be a major problem if pyrometallurgical processes are used, especially as there is no readily accessible market for sulphuric ac id.
7. The Gamsberg zinc ore contains manganese that would have to be removed by means of a commercially v iable process in the refining step. Alternatively, penalties would be incurred if the concentrat e were to be sold.
8. The other deposits are probably not viable as stand-alone operations, but they could be considered in terms of an integrated development strategy .
9. Transport is a signif icant cost factor as the depos its described are remot ely situat ed and while rail links are potentially accessible, rail tariff s are prohibitively high.
5.1.5 RECOMMENDATIONS It is recommended that:
Every thing possible be done to enable Anglo American to exploit the Gamsberg deposit including improvements to inf rastructure and technical ass istance v ia Mint ek.
That the deposits mentioned be re-evaluated in t erms of the current commodity market situation, and of benef iciation technology that has been developed over the last decade.
Cons ideration be given to t he establishment of one or more small mining operations within a cluster of small and larger operations t hat could co-operat e in t he utilisation of concentrators and possibly smelting and refining plant in the Upington-Kenhardt area.
The Bushy park deposit is economically marginal, with t he disadvant age of discontinuous ore horizons and an overall low zinc grade. However, with an increased price of zinc and a high grading process in a small mine, this depos it may be worthy of further consideration for a small operator and should be investigat ed f urther
5.2 CEM ENT AND LIM E
5.2.1 OVERVIEW The North Cape Prov ince cont ains the largest l imest one resource in South Af rica and is a major producer of cement and lime.
5.2.2 MARKETS Limestone (CaCO3) and its derivative, lime (CaO), are import ant industrial minerals in a modern economy . There are three major uses f or limest one. Firstly , in the manuf acture of Portland cement. Secondly as a flux for the production of pig iron and non-f errous metals. Thirdly in agriculture where it is used primarily as a f ertiliser and t o neutralise acid soi ls. Limestone is also used in water treatment and purification as well as sewage treatment.

Northern Cape Province – Miner al sector strategy
51
In Sout h Af rica, limestone production is strongly linked to construction demand and t heref ore cement demand. In 2002, limest one production increased by 9.5%, to 11.218 Mt. This was largely driven by increased demand f or cement as a result of renewed short-term investment in inf rastructure wit hin the country. In contrast, local sales of lime stagnated and exports of lime dropped by 26.6% due to low ferrochrome production by Zimbabwe Alloys.
PPC are planning a brownf ields expansion to their cement production f acilities (estimat ed at R750m) to be completed by 2008 (PPC, 2004).
5.2.3 CURRENT MINING OPERATIONS The major limestone resource in the North Cape occurs in a 150 km long belt, only a f ew kilometres wide, that extends along the western edge of the Ghaap plateau f rom Griquat own in the south t o Kuruman in t he north. Within this belt, the strata dip gently to the west and t he limest one is present in large lenses up to 10km long and 200 m thick. The CaCO3 content is above 90% and the magnesium carbonates seldom exceed 5%.
Deposits of limestone tuf a or travertine (>95% CaCO3) are f ound along the escarpment f orming the eastern edge of the Ghaap plateau. With t he exception of the large deposit at Ulco, where medium t o high-grade l imestone is mined on a large scale, the travertine occurs in small deposits. The Ulco deposit is being mined at a rate of 2 Mtpa producing a product with a 96% CaCO3 cont ent. In 1998, the Ulco resource was estimated to contain more than 100 Mt of limestone.
There are a number of ot her limest one depos its in the Northern Cape but they are generally of no economic signif icance because of their location and or size. Resources of high grade (several billion tonnes) limestone are found in the Richtersveld near t he Black Hills and west of Vioolsdrif t but they have not been exploited to dat e due to t heir remote location. Small-scale exploit ation of high-grade limestone (96% CaCO3) has occurred North of Steinkopf to supply the now defunct copper smelter at O’okiep (Martini, J.E.J. and Wilson, M.G.C., 1998).
There are three l imestone quarry ing operations in the Nort hern Cape, t wo of which supply cement plants and the ot her a lime s intering plant. Alpha Cement operates the Ulco travertine quarry and cement plant, which has the capacity to produce 1. 2 Mt pa of cement. Pretoria Portland Cement (PPC) operates the Lime Acres quarry and cement plant near Danielskuil with a production capacity of 1.5 Mtpa of cement. PPC are planning an estimated R750 M brownfields expansion to their cement production f acilities to be completed by 2008 (PPC, 2004). Idwala Industr ial Holdings (Pty ) Ltd operat e the Idwala quarry and lime plant locat ed close to t he PPC plant near Danielskuil. This plant is the major lime producer in South Africa.
5.2.4 REVIEW OF INVESTMENT OPPORTUNITIES The main opportunities rest in the de-bottlenecking and brownfields expansion of the existing producers. It is unlikely that a new greenf ield plant wi ll be established in t he short to medium term depit e the availability of suff icient resources. The reason for this is t hat t he deposits are locat ed t oo f ar away from the major markets and thus f ace a major transport penalty when competing against better-locat ed plants. The modern t rend in cement plant design is t o build smaller plants located closer to the end markets.
5.2.5 BARRIERS TO DEVELOPMENT The major barrier to development is the location of the deposits wit h respect to their major markets.
5.2.6 RECOMMENDATIONS None

Northern Cape Province – Miner al sector strategy
52
5.3 DIAMONDS
5.3.1 OVERVIEW The diamond industry in South Africa is the world’s fourt h largest, producing an estimat ed 12.6 mil lion carats in 2003, against a level of around 11 million carats in 2002. (SADB 2004). Production f rom unregistered diamond miners sources was estimated at 260 kct in 2002. Diamond production is dominat ed local ly by the De Beers Group, which produced over 95% of SA’s f ormal diamond production (carats ) in 2002.
In 2003, t he Northern Cape produced 33% of South Africa’s diamonds, but the prov ince has averaged over 36% of the country ’s production over the past 10 years. The recent increase in production f rom t he Western Cape and North West has been the main reason behind t he drop in 2003. Figur e 3 illustrates the proportional production f rom the Northern Cape in 1994 and 2003.
Figure 3: SA Diamond Production by Province
Total Diamond Production 2003
Free State1.0%Gauteng
10.1%
Limpopo53.9%
NorthernCape33.2%
WesternCape1.0%
Northwest0.9%
Northern Cape Province – Miner al sector strategy
53
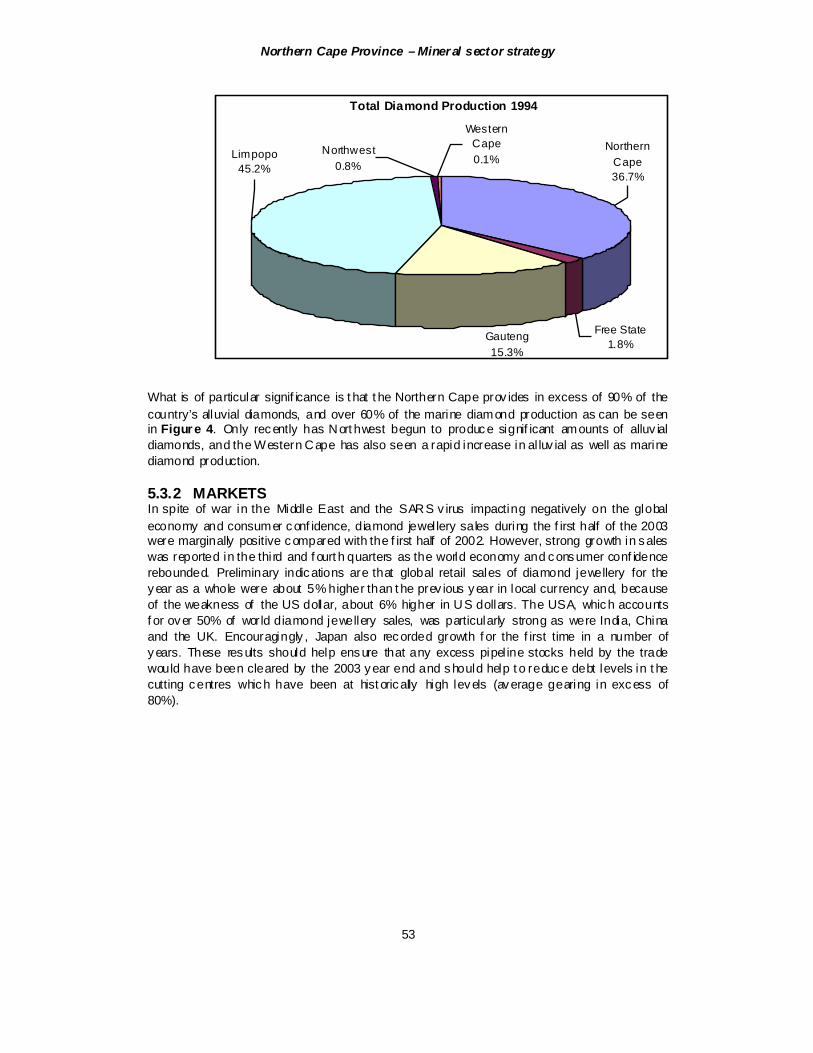
What is of particular signif icance is t hat t he Northern Cape prov ides in excess of 90% of the country’s alluvial diamonds, and over 60% of the marine diamond production as can be seen in Figur e 4. Only recently has Nort hwest begun to produce signif icant amounts of alluv ial diamonds, and the Western Cape has also seen a rapid increase in al luv ial as well as marine diamond production.
5.3.2 MARKETS In spite of war in the Middle East and the SARS v irus impacting negatively on the global economy and consumer conf idence, diamond jewel lery sales during the f irst half of the 2003 were marginally positive compared with the f irst half of 2002. However, strong growth in sales was reported in the third and f ourt h quarters as the world economy and consumer conf idence rebounded. Preliminary indications are that global retail sales of diamond jewellery for the year as a whole were about 5% higher than t he prev ious year in local currency and, because of the weakness of the US dollar, about 6% higher in US dollars. The USA, which accounts f or over 50% of world diamond jewellery sales, was particularly strong as were India, China and the UK. Encouragingly , Japan also recorded growth f or the f irst time in a number of years. These results should help ensure that any excess pipel ine stocks held by the trade would have been cleared by the 2003 year end and should help t o reduce debt levels in t he cutting centres which have been at hist orically high levels (average gearing in excess of 80%).
Total Diamond Production 1994
NorthernCape36.7%
Free State1.8%
Gauteng15.3%
Limpopo45.2%
WesternCape0.1%
Northwest0.8%

Northern Cape Province – Miner al sector strategy
54
Total SA Diam ond Production
0
20 00
40 00
60 00
80 00
100 00
120 00
140 00
1994 199 5 1996 1997 19 98 1999 2 000 2001 200 2 2003
'000 ct
Rest of SA NC Alluv ial NC Marine NC Other
Figure 4: SA Diamond Production 1994-2003
The strong demand f or rough diamonds f rom the cutting centres in t he f irst half of the year continued through into t he second half and f ull year sales by the Diamond Trading Company (DTC) were US$5.5 B, 7% more than in 2002.
During t he year, the DTC raised its rough diamond prices on three occasions and, by the year end, its prices were, on average, about 10% higher than at the beginning of the year. Increased sales at higher prices and lower f inancing costs more than compensated for the negative impact of the signif icant apprec iation of the rand.
5.3.2.1 POLISHED DIAMONDS Economic f actors such as t he economic growth rat e of consuming nations, employment, disposable income levels and f oreign exchange rat es would be expect ed to have a much greater influence on polished diamond prices than does the marketing and supply strategies of the DTC. Polished diamond prices would theref ore be much more sensitive t o supply and demand than rough prices, although the underly ing rough prices would ultimat ely aff ect the pol ished market.
The actual price of a polished stone would be very dependent on the so-cal led “4 C’s ”, being Cut, Clarity , Colour and Carats (size). These prices can vary signif icantly , from less than US$200/ct f or a smal ler, lower qual ity stones, to US$100 000/ct and more f or a large high quality stones. Transhex recently received US$43 000 per carat f or an 8, 6 carat orange (uncut) stone, and US$36 600 per carat f or a 27. 7 carat pink (uncut) stone.
5.3.2.2 ROUGH DIAMONDS During 2003 and early 2004, a shortage of rough diamonds in the local cutting centres and strong demand f or diamond jewellery at the consumer level ensured a good year for the industry in general. This strength in the rough market led t o increased demand and higher pricing levels being attained at regular tender sales. Throughout the year companies experienced rough prices strengthening, with the f irst quart er of 2004 alone showing price increases of some 10%.
An import ant feat ure of rough diamond production is the f act that, generally , only bet ween 30% and 50% of kimberl ite production is of gem quality. On the other hand, in excess of 60% of alluvial diamonds and around 80% of marine diamond production is gem quality . Theref ore,

Northern Cape Province – Miner al sector strategy
55
it is logical t hat t he marketing st rategy of kimberlit e production would be diff erent f rom that of other production sources.
The DME has identif ied three broad categories of diamond marketing:
Gem diamonds: these are market ed in al l importing countries, and De Beers has a competitive advantage in this category through t he DTC. Diamonds are typically above US$200 per carat.
Near-gem diamonds (“Indian Goods”): marketed mostly in India, where the cost of cutting is low enough to cater f or smaller, lower quality diamonds. Rio Tinto, and in particular Argyle Diamonds, have the competitive advantage here. Large quantities of De Beers diamonds are also now being suppl ied into this market. These diamonds would typically be in the US$20 - 200 per carat range.
Indust rial diamonds: these are market ed mainly in the UK, USA and Japan. The DRC’s MIBA Mine reportedly has the market advant age here where the diamonds general ly have a value less than US$20 per carat.
It is important to note that diamonds are highly transportable goods and theref ore will t end to be cut wherever in the world it is most economical. The rule of thumb is that the cutting cost per carat must not be more than 10% of the carat cost of the rough stone.
Rough Gem Mar ket The rough gem-diamond market, was dominated by the De Beers Group in the past. Today the Diamond Trading Company (DTC) alt hough not in as strong a position in the past is still the major player in the world. The DTC markets its diamonds approximat ely 11 times per year v ia so-called “sights” and select ed buyers, the “sightholders” are allowed to participate. De Beers also has a marketing arm f or those smaller cutters outside of the elite sight holder group in some count ries (e.g. Diamdel in South Africa).
Polished gem market Polished gems are market ed f reely through much of the world. Many sightholders encouraged by the DTC “Supplier of Choice” programme are moving into the cut trading area and may have jewellery manuf acturing units, retail outlets and branded jewellery. The cut dealers are theref ore being progressively sidel ined.
Near -Gem Market India has become prominent f or creating a competitive new market f or lower quality and smaller st ones which may prev iously been categorised as industrial diamonds because t he big companies believed they were uneconomic to cut. Cutting costs in India can be less than US$10 per carat, and t he application of innovative technology and business practices has made this a viable industry f or a large proportion of the world’s small diamonds. Finished stones down to 0.005 cts (200 stones per carat) can be cut as f ull br illiants (57 f acets). However, although I ndia does special ise in the smal ler stones they are using their competitive edge to move more and more into the larger market, cutting st ones of at least 22 cts.
Industrial Diamonds Other than as f ine jewels, diamonds, through t heir strength, hardness and optical qualities, toget her with their thermal and electronic properties have made them essential components in many industrial processes and appl ications. An industrial diamond is classified as such when one or more of the “4 C’s” is adversely aff ected, thereby making it unusable as a gem stone.

Northern Cape Province – Miner al sector strategy
56
Broadly speak ing, industr ial diamonds have three main applications:
Used in its primary f orm as a cutting t ool, Embedded either as f ine chips or dust wit hin other mat erials to be used as an abrasive or
cutting t ool, As a powder or paste for use in grinding and pol ishing
5.3.3 CURRENT MINING OPERATIONS The t hree types of diamond deposits are prevalent in Sout h Af rica, namely Kimberl ite, alluv ial (including coastal) and marine. The vast majority of South Af rican diamond production comes f rom primary kimberlit e sources, as can be shown in Figure 5.
Only the main operating entities have been highlighted, as it is not possible currently in South Africa to get information with statistical int egrity regarding the smal ler operations and artisanal miners (diggers).
Figure 5: SA Diamond Production by Source As the Northern Cape provided some 33% of all diamond production and 27% of kimberlitic diamonds in 2003, the province has a significant role to play in the SA diamond industry .
5.3.4 REVIEW OF INVESTMENT OPPORTUNITIES The large players in the diamond market seem relatively stable in terms of their existing operations, but t here are a number of smaller companies which are either operating or exploring the potential of establishing operating mines. These players inc lude Firestone, Etruscan Resources, Mountain Lake Resources, Global D iamonds, Majestic Resources, Synergy Met als, Monroe Minerals and Thabex, among many others. [ Mbendi 2004].
There is obv ious ly good potential for small scale diamond operat ors in both the alluv ial and coastal depos it areas, where concessions still ex ist. Even though rights t o mine concessions may be held by the larger companies, the equity requirements of the Mining Chart er and t he Mineral and Petroleum Resources Development Act should open t he door f or BEE companies to participate in these.
One of the most c rucial areas f or smaller companies and small scale mining operators is t he access to capit al, and with the risk of diamond mining ventures, this situation is still critical. Investment in an umbrella organisation to prov ide cent ral services t o smaller operators, as well as a regulated market where producers can sell diamonds to a central body rather than attempt to pursue t heir own marketing st rategies, would be a good target ed application of f unds.
Total SA Diamond Production
0
2000
4000
6000
8000
10000
12000
14000
1 2 3 4 5 6 7 8 9 10
'000 ct
Alluvial Marine Kimber lite & Other

Northern Cape Province – Miner al sector strategy
57
Kimb erli te a complex group of hy bri d vol atile-rich, potas sic, ultramafic roc ks with a fine-grai ned matrix and mac rocrysts of olivine and several of the following: ilmenite, garnet, di opsi de, phl ogopi te, enstatite, c hromite. x enoc rysts and xenoliths are also common Group I kimber lite is ty pically CO2 -ric h and less potassic than Group 2 ki mberlite Group II kimb erlite (orangeite) is typically H2O-rich and has a mica-r ich matrix (also with calcite, di opsi de, apatite)
The pot ential of setting up a “cutting & pol ishing hub” in conjunction perhaps with other gemst one manuf acturing operations would also prov ide an excel lent interface bet ween possibly struggling small scale operators and a f ocused marketing strategy via a concentrat ed “cluster“ of gemstone and jewellery -related industries. Such an area could also become a tourist destination.
5.3.4.1 KIMBERLITE DIAMOND MINING IN THE NORTHERN CAPE Most of South Af rica's kimberlite mines are operat ed by De Beers, with smaller producers in Southern Era, Trivalence Mining Corporation and Rex Diamonds.
De Beers : Ki mberley Mines Location: Kimberley , Northern Cape, Sout h Af rica Established: 1871 Current lif e of mine: 17 years – The new CTP extends the potential lif e for about 30 years Mining method: Underground Employees: 1749
There are f ive pipes in the Kimberley Mines group, the De Beers, Kimberley , Bultf ontein, Dutoitspan and Wesselt on pipes. Presently, they are relatively minor contributors to the t otal South Af rican diamond production with only Bultf ontein, Dutoitspan and Wesselton in operation. The Kimberley Mine closed in 1914 and the De Beers Mine in 1990. In addition, the mine dumps are being re-processed by both De Beers and private operators. In 2003, t he Kimberley mines recovered some 1.05 million carats at an average grade of 17.7 carats per hundred tons.
Table 6 Kimberley Mines Production)
Production Statistics 2003 2002 2001 Ore Treated (‘ 000 metric tons ) 5 962 3 633 3 766 Diamonds recov ered (carats ) 1 054 181 473 975 549 724 Grade (carats/100 tons ) 17.7 13.0 14.6
The pipes, dated at 84-87 Ma, intrude int o Dwyka Group sediments, overlain by porphy ritic lavas of the Ventersdorp Supergroup. It is estimated that approximately 1 400 m of erosion has t aken place since t he emplacement of the pipes. At present day surface, all t he pipes were in the diatreme zone, and the gradation into the root zone takes place at between 400 and 800 metres. Several diff erent kimberlite types are present.
Other diamondif erous kimberlite int rusions in the Kimberley area include the Kamf ersdam, Otto's Kopje and Belgrav ia pipes. Kamfersdam, situated on the f arm Roodepan 7 km north of
Northern Cape Province – Miner al sector strategy
58
Kimberley , was prev iously mined by De Beers, but closed in 1907. Otto's Kopje, on t he Kimberley Townlands, was discovered in 1880, mined f rom 1891 to 1905 and again f rom 1911 to 1913. Alt hough the grades f rom this mine were low, the diamond quality was high, and one exceptional diamond of 336 carats was recovered in 1896.
The Combined Treatment Plant (CTP) The Combined Treatment Plant in Kimberley , designed to retreat dumps in the area, has f inally overcome its teething problems and is starting t o approach its f ull capacity of 20 kt per day . For Kimberley Mines, this means that previously marginal or uneconomic resources now become real istic mining opportunities ext ending to 2018 and possibly even 2030 if all opportunities are realised.
The new plant wi ll treat approximat ely 7.5 Mtpa of ore producing 1.8 Mct at its peak. It will more than tr iples current carat production. This will extend the lif e of Kimberley operations for about 30 years. In South Af rica overall carat production was also increased by 15% in 2003 through a variety of projects, most notably the new combined treatment plant which contributed to Kimberley 's production of more than one million carats, a f eat last achieved in 1986.
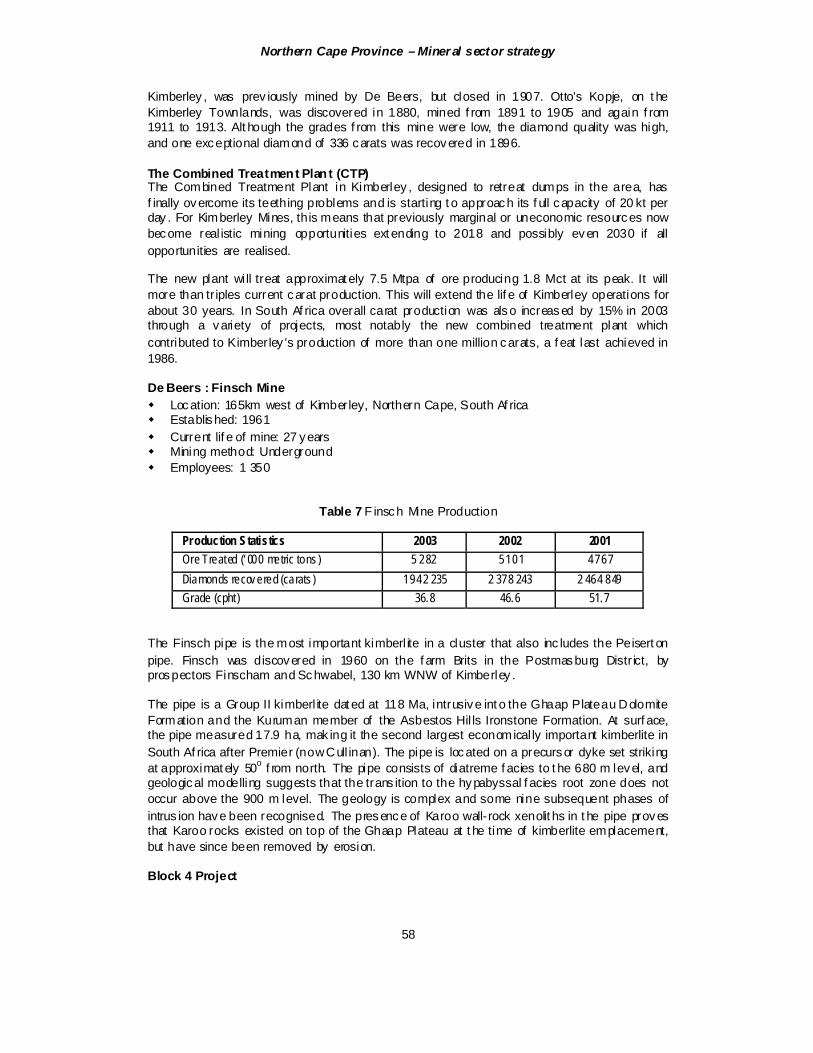
De Beers : Finsch Mine Location: 165km west of Kimberley, Northern Cape, South Af rica Established: 1961 Current lif e of mine: 27 years Mining method: Underground Employees: 1 350
Table 7 F insch Mine Production
Production Statistics 2003 2002 2001 Ore Treated (‘ 000 metric tons ) 5 282 5 101 4 767 Diamonds recov ered (carats ) 1 942 235 2 378 243 2 464 849 Grade (cpht) 36.8 46.6 51.7
The Finsch pipe is the most important kimberl ite in a cluster that also inc ludes the Peisert on pipe. Finsch was discovered in 1960 on the f arm Brits in the Postmasburg Distr ict, by prospectors Finscham and Schwabel, 130 km WNW of Kimberley .
The pipe is a Group II kimberl ite dat ed at 118 Ma, intrusive int o the Ghaap Plateau Dolomite Formation and the Kuruman member of the Asbestos Hil ls Ironstone Formation. At surf ace, the pipe measured 17.9 ha, mak ing it the second largest economical ly important kimberlite in South Af rica after Premier (now Cull inan). The pipe is located on a precursor dyke set striking at approximat ely 50o f rom north. The pipe consists of diatreme f acies to t he 680 m level, and geological modelling suggests that the trans ition to the hypabyssal f acies root zone does not occur above the 900 m level. The geology is complex and some nine subsequent phases of intrus ion have been recognised. The presence of Karoo wall-rock xenolit hs in t he pipe proves that Karoo rocks existed on top of the Ghaap Plateau at t he time of kimberlite emplacement, but have since been removed by erosion.
Block 4 Project

Northern Cape Province – Miner al sector strategy
59
Board approval was given f or the R2 bn Block Cave Project at Finsch Mine. The aim of the project is to ext end the underground life of Finsch Mine by ± 25 years by exploiting reserves that lie below the current Block 3 level.
The Block Cave (Block 4) at Finsch Mine comprises of two levels, an undercut level at 610 m and an extraction level at 630 m below surf ace. The undercut is a void created to induce cav ing of ground while the extraction level is equipped to extract the caved ground wit h the use of a mechanised f leet.
The depletion of current reserves is due in 2007, by which time t he new block cave wi ll be in f ull production. The undercutting process will commence mid 2004, with the opening of troughs expected later in t he year. The undercutting and trough opening process will be complet ed in 2009. A peak production rate of 3.8 Mt pa can be expect ed f rom the cave in 2007. The steady state production rate wil l be maintained unti l the year 2011. The new block cave reserves are expected to be depleted in approximately 2015.
Crown Diamonds : Messina Mine Location: 60km West of Warrenton Established: N/A Current lif e of mine: about 5 years Mining method: Underground Employees: 354
The Messina Mine property is composed of mining leases, diamond rights, surface r ights and f ree holdings on various farms in the Northern Cape Prov ince and covers 1 700 m of a 2 400 m kimberlite f issure (known as the Bobbejaan Fissure). The f issure system consists of three distinct vertical units which range in width between 20 and 110 cm and average 55 cm. Following down dip diamond dril ling in 2003 the mineral resource and ore reserve, af ter apply ing t he guidelines of the JORC code has been estimated t o be 449 kt (ROM) grading 28 cpht.
The mine operat es t wo surf ace shaf ts and one underground sub shaf t. Drives are est abl ished at 35 metre vertical intervals with access f rom the shaf t and cross cuts positioned to the south of the near vertical f issures. A shrinkage stoping method of mining is employed to extract kimberlit e f rom the f issure system which af ter crushing and washing is passed through a cyclone f eed pump, screened, af ter which concentrate is passed through a wet f lowsort X-ray machine backed up by grease tables. The process plant operates on an 18 hour, t wo shif t, f ive days per week cycle. The rated capac ity of the plant is 50 tph to the sorting and crushing section and 38 tph rec irculating load in the pans.
The mine's infrastructure is located around the Albertse Shaft where the recovery plant is locat ed, which includes workshops, of f ices, and st ores while the compressor station and timber yard are located at the Hal iday Shaf t. Nearly half of the semi-skil led underground workf orce is housed in the mine hostel while the remainder is bussed in from towns 60 km away . The mine has a labour force of 354, of which 41 are rated as skilled and the balance semi-skilled. All semi-sk illed employees are unionised, with up t o 200 accommodated in on site hostels. In t he six month period to December 2003, a total of 43 214 t were hoist ed to t he surf ace of which 26 794 t were treated at the plant to produce 11 086 carats of diamonds for an average y ield of 41 cpht.
5.3.4.2 ALLUVIAL DIAMOND MINING IN THE NORTHERN CAPE Alluv ial gravels, extending f rom the Lichtenburg to Barkly West districts along the Orange and Vaal Rivers and on the Nort hern and Western Cape coasts, yield diamonds commonly of a
Northern Cape Province – Miner al sector strategy
60
better qual ity than those f ound in the original kimberlite. The early diamond rushes at Hopetown and near Kimberley , were f ollowed by a succession of rushes to t he alluv ial diamond fields of the Northern Cape and what is now the North West Prov ince. Examples were those in t he 1920s and 1930s at Lichtenburg, Bakerville and the Mafikeng dist rict. Although there are still 1 500 alluv ial diggers in the North West, Northern Cape and Free State provinces, the prospects f or new labour-intensive small-scale diamond mines have been greatly reduced.
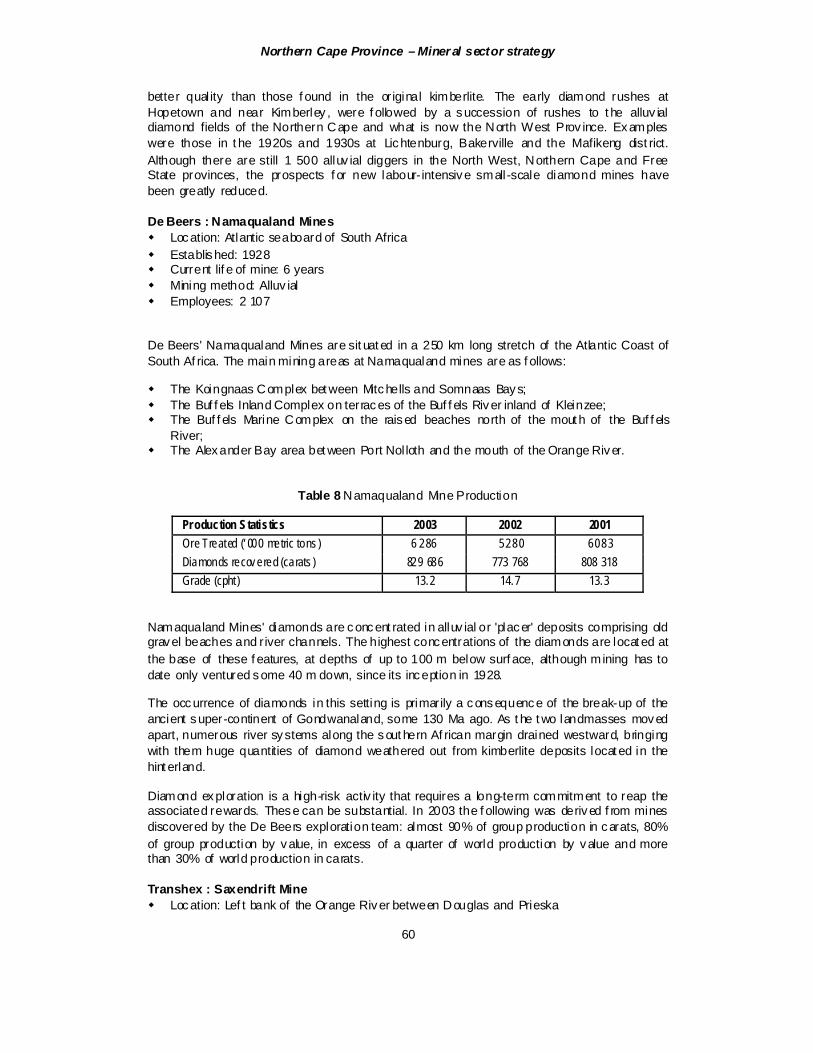
De Beers : Namaqualand Mines Location: Atlantic seaboard of South Africa Established: 1928 Current lif e of mine: 6 years Mining method: Alluv ial Employees: 2 107
De Beers' Namaqualand Mines are sit uat ed in a 250 km long stretch of the Atlantic Coast of South Af rica. The main mining areas at Namaqualand mines are as f ollows:
The Koingnaas Complex bet ween Mitchells and Somnaas Bays; The Buf f els Inland Complex on terraces of the Buf f els River inland of Kleinzee; The Buf f els Marine Complex on the raised beaches north of the mout h of the Buf f els
River; The Alexander Bay area bet ween Port Nol loth and the mouth of the Orange River.
Table 8 Namaqualand Mine Production
Production Statistics 2003 2002 2001 Ore Treated (‘ 000 metric tons ) 6 286 5 280 6 083 Diamonds recov ered (carats ) 829 686 773 768 808 318 Grade (cpht) 13.2 14.7 13.3
Namaqualand Mines' diamonds are concent rated in alluv ial or 'placer' deposits comprising old gravel beaches and r iver channels. The highest concentrations of the diamonds are locat ed at the base of these f eatures, at depths of up to 100 m below surf ace, although mining has to date only ventured some 40 m down, since its inception in 1928.
The occurrence of diamonds in this setting is primarily a consequence of the break-up of the ancient super-continent of Gondwanaland, some 130 Ma ago. As t he t wo landmasses moved apart, numerous river systems along the sout hern Af rican margin drained westward, bringing with them huge quantities of diamond weathered out from kimberlite deposits locat ed in the hint erland.
Diamond exploration is a high-risk activ ity that requires a long-term commitment to reap the associated rewards. These can be substantial. In 2003 the f ollowing was derived f rom mines discovered by the De Beers exploration team: almost 90% of group production in carats, 80% of group production by value, in excess of a quarter of world production by value and more than 30% of world production in carats.
Transhex : Saxendrift Mine Location: Lef t bank of the Orange River between Douglas and Prieska
Northern Cape Province – Miner al sector strategy
61
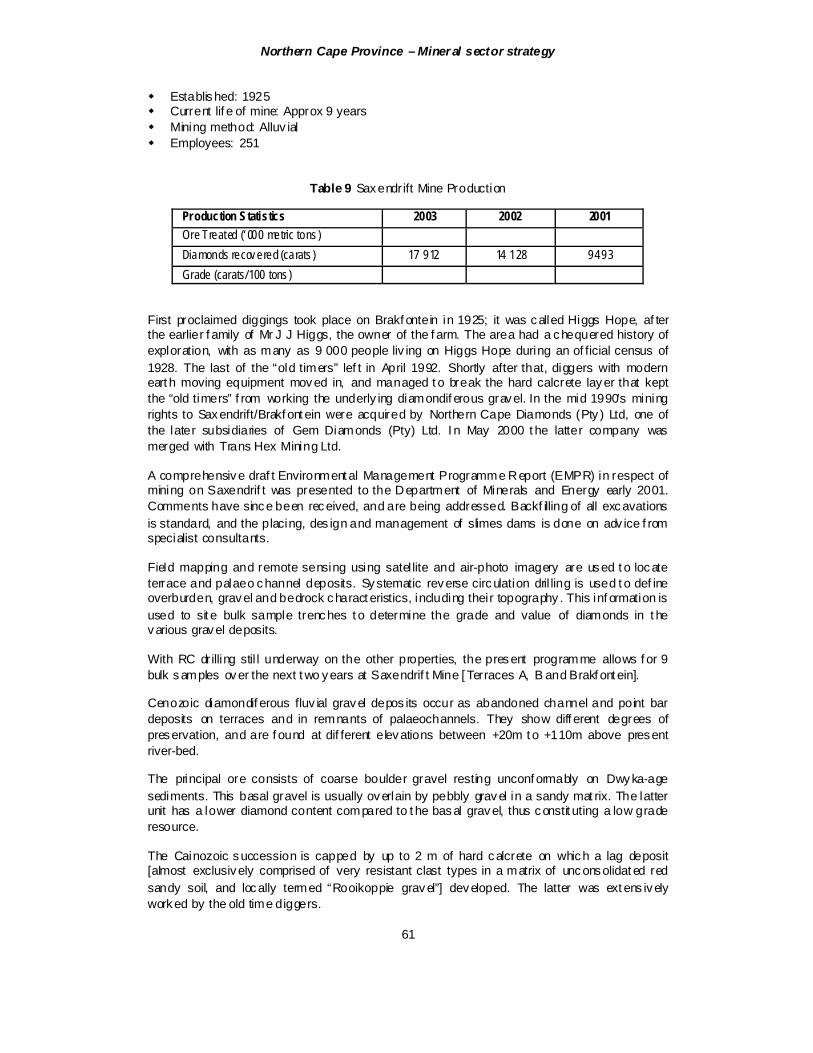
Established: 1925 Current lif e of mine: Approx 9 years Mining method: Alluv ial Employees: 251
Table 9 Saxendrift Mine Production
Production Statistics 2003 2002 2001 Ore Treated (‘ 000 metric tons ) Diamonds recov ered (carats ) 17 912 14 128 9 493 Grade (carats/100 tons )
First proclaimed diggings took place on Brakf ontein in 1925; it was called Higgs Hope, af ter the earlier f amily of Mr J J Higgs, the owner of the f arm. The area had a chequered history of exploration, with as many as 9 000 people liv ing on Higgs Hope during an of ficial census of 1928. The last of the “old timers” lef t in April 1992. Shortly after that, diggers with modern eart h moving equipment moved in, and managed t o break the hard calcrete layer that kept the “old timers” f rom working the underly ing diamondif erous gravel. In the mid 1990’s mining rights to Saxendrift/Brakf ont ein were acquired by Northern Cape Diamonds (Pty ) Ltd, one of the later subsidiaries of Gem Diamonds (Pty) Ltd. I n May 2000 t he latter company was merged with Trans Hex Mining Ltd.
A comprehensive draf t Environment al Management Programme Report (EMPR) in respect of mining on Saxendrif t was presented to the Department of Minerals and Energy early 2001. Comments have since been received, and are being addressed. Backf illing of all excavations is standard, and the placing, des ign and management of slimes dams is done on adv ice f rom specialist consultants.
Field mapping and remote sensing using satel lite and air-photo imagery are used t o locate terrace and palaeo channel deposits. Systematic reverse circulation dril ling is used t o def ine overburden, gravel and bedrock charact eristics, including their topography . This inf ormation is used to sit e bulk sample trenches t o determine the grade and value of diamonds in t he various gravel deposits.
With RC drilling stil l underway on the other properties, the present programme allows f or 9 bulk samples over the next t wo years at Saxendrif t Mine [ Terraces A, B and Brakf ont ein].
Cenozoic diamondif erous fluv ial gravel depos its occur as abandoned channel and point bar deposits on terraces and in remnants of palaeochannels. They show diff erent degrees of preservation, and are f ound at dif ferent elevations between +20m t o +110m above present river-bed.
The principal ore consists of coarse boulder gravel resting unconf ormably on Dwyka-age sediments. This basal gravel is usually overlain by pebbly gravel in a sandy mat rix. The latter unit has a lower diamond content compared to t he basal gravel, thus constit uting a low grade resource.
The Cainozoic succession is capped by up to 2 m of hard calcrete on which a lag deposit [almost exclusively comprised of very resistant clast types in a matrix of unconsolidat ed red sandy soil, and locally termed “Rooikoppie gravel”] developed. The latter was ext ens ively worked by the old time diggers.

Northern Cape Province – Miner al sector strategy
62
Transhex : Baken Mine Location: Lef t bank of the Orange River, 40km upstream f rom Alexander Bay Established: 1970 Current lif e of mine: Approx. 22 years Mining method: Alluv ial Employees: 532
Table 10 Baken Mine Production
Production Statistics 2003 2002 2001 Ore Treated (‘ 000 metric tons ) Diamonds recov ered (carats ) 87 552 76 287 45 038 Grade (carats/100 tons )
Located near the small v illage of Sanddrif on the lef t bank of the Orange River, the Baken Mine encompasses alluv ial diamond deposits at localities known as Xheis, Koeskop and Swart wat er.
Bet ween 1927 and 1962 prospecting f or diamonds on all state land in Namaqualand was prohibited. In the early 1960’s Allied Minerals Limit ed (AML) were granted t he prospecting rights to the Baken concess ion, comprising that portion of the Orange River valley (and adjoining area to the east and south) bet ween Bloeddrif and Arriesdrif t. A Mining Lease was issued during 1969/ 70. In 1972 Trans Hex Mining Ltd, through its operating subsidiary Buf f elsbank Diamant Ltd, purchased all of the assets of Baken Diamante (Pty ) Ltd from Allied Minerals. A small-scale mining operation start ed on 1 April 1972 with a bulk sampling programme. After a short break, f ull-scale mining operations resumed during 1981 and have continued uninterrupt ed to date.
Env ironment al management at Baken is being conducted in line wit h the prov isions of an approved Env ironmental Management Programme (EMP). The EMP was approved in 1995, and is currently being upgraded. As a legal requirement, rehabi litation of disturbed areas takes place concurrent wit h mining, and essentially encompasses t he backf illing of all excavations and the sloping of overburden and waste dumps. Management of all slimes dams receives continued attention. The geometry of sloped overburden dumps has recently been researched by a special ist consulting engineer. Once the recommendations have been approved by the Department of Minerals and Energy it will be implemented throughout the Richtersveld mining lease area.
Together with Bloeddrif , the Baken palaeo-channel off ers the best remaining exploration potential in the R icht ersveld. All four t he sub- areas, i. e. Skilpadsand terrace, Terrace 1, Terrace 2 and t he palaeo-channel itself have been drilled on a 100x1900m grid with openhole percussion dri lling (OHP). Due to t he inef ficiency of this drilling met hod under most ground conditions, large areas in the Baken palaeo-channel has been redrilled using the much more accurate reverse circulation (RC) method.
The gravel clasts in t he terraces and palaeo channels bordering t he Orange River cons ist typically of rounded to subrounded pebbles, cobbles and boulders of various rock types, of which quartzite is the most abundant. Various types of granit e, gneiss, lava and met amorphic rocks are also present. In some cases t he sandy matrix of the gravel is cemented by gypsum and/or calcrete to form irregular lenses of conglomerat e.

Northern Cape Province – Miner al sector strategy
63
The Baken Palaeo Channel is a c lassic oxbow f eatures cut off from the present day valley . Its is f illed with an upward f ining sequence of sediments correlated with t he Arrisdrif t Gravel f ormation, comprising a coarse boulder basal gravel, overlain by of ten lenticular beds of more sandy gravel [locally termed “Suspended gravel”], which in turn is covered by sand and si lt representing the final stages of deposition of the so-called Proto-Orange River. Gravel deposits in the palaeo-channel currently represents 89% of the volume of the Baken proved and probable reserves (including stockpiles). The three terraces contr ibute the remaining 11% by volume.
Transhex : Bloeddrif Mine Location: Lef t bank of the Orange River, 50km upst ream f rom Alexander Bay Established: 1968 Current lif e of mine: Approx. 4 years Mining method: Alluv ial Employees: 47
Northern Cape Province – Miner al sector strategy
64
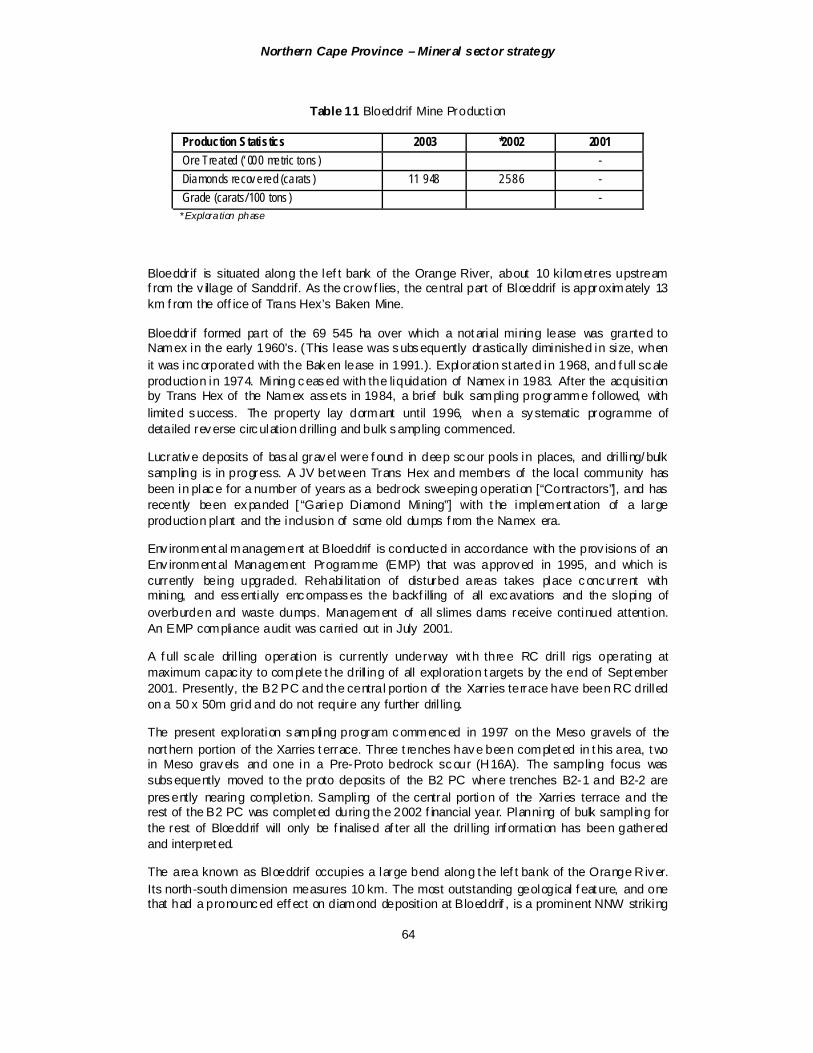
Table 11 Bloeddrif Mine Production
Production Statistics 2003 *2002 2001 Ore Treated (‘ 000 metric tons ) - Diamonds recov ered (carats ) 11 948 2 586 - Grade (carats/100 tons ) - * Exploration phase
Bloeddrif is situated along the lef t bank of the Orange River, about 10 ki lometres upstream f rom the v illage of Sanddrif. As the crow f lies, the central part of Bloeddrif is approximately 13 km f rom the off ice of Trans Hex’s Baken Mine.
Bloeddrif formed part of the 69 545 ha over which a not arial mining lease was granted to Namex in the early 1960’s. (This lease was subsequently drastically diminished in size, when it was incorporated with the Baken lease in 1991.). Exploration st arted in 1968, and f ull scale production in 1974. Mining ceased with the liquidation of Namex in 1983. After the acquisition by Trans Hex of the Namex assets in 1984, a brief bulk sampling programme f ollowed, with limited success. The property lay dormant until 1996, when a systematic programme of detailed reverse circulation drilling and bulk sampling commenced.
Lucrative deposits of basal gravel were f ound in deep scour pools in places, and dri lling/ bulk sampling is in progress. A JV bet ween Trans Hex and members of the local community has been in place for a number of years as a bedrock sweeping operation [“Contractors”], and has recently been expanded [ “Gariep Diamond Mining”] with t he implement ation of a large production plant and the inclusion of some old dumps f rom the Namex era.
Env ironment al management at Bloeddrif is conducted in accordance with the prov isions of an Env ironment al Management Programme (EMP) that was approved in 1995, and which is currently being upgraded. Rehabi litation of disturbed areas takes place concurrent with mining, and essentially encompasses the backf illing of all excavations and the sloping of overburden and waste dumps. Management of all slimes dams receive continued attention. An EMP compliance audit was carried out in July 2001.
A f ull scale dril ling operation is currently underway wit h three RC dri ll rigs operating at maximum capac ity to complete t he drill ing of all exploration t argets by the end of Sept ember 2001. Presently, the B2 PC and the central portion of the Xarries terrace have been RC drilled on a 50 x 50m grid and do not require any further dril ling.
The present exploration sampling program commenced in 1997 on the Meso gravels of the nort hern portion of the Xarries t errace. Three t renches have been complet ed in t his area, t wo in Meso gravels and one in a Pre-Proto bedrock scour (H16A). The sampling focus was subsequently moved to the proto deposits of the B2 PC where trenches B2-1 and B2-2 are presently nearing completion. Sampling of the central portion of the Xarries terrace and the rest of the B2 PC was complet ed during the 2002 f inancial year. Planning of bulk sampling for the rest of Bloeddrif will only be f inalised af ter all the dril ling inf ormation has been gathered and interpret ed.
The area known as Bloeddrif occupies a large bend along t he lef t bank of the Orange R iver. Its north-south dimension measures 10 km. The most outstanding geological f eat ure, and one that had a pronounced eff ect on diamond deposition at Bloeddrif , is a prominent NNW striking

Northern Cape Province – Miner al sector strategy
65
occurrence of dolomitic limestone. The f ollowing sub-areas are recognized, based on diff erent geological and geomorphological f eatures:
Xarries: this comprises a huge plain, roughly 450 ha in extent that forms the northern and nort h-western portion of the property . It is covered by meso-Orange [ and younger] gravel and sand, under which lucrative deposits of proto-Orange and preproto-Orange sediments were preserved in deep scours. A remnant of a proto terrace is present along the north-eastern perimeter of Xarries.
B1 and B2: these are classical oxbows t hat f ormed around hillocks in the dolomitic limest one range. In B2 t wo very deep scour features [ one at the inlet, and one at t he outlet pos itions] had been recognized along the contact between limest one and schist.
Airstr ip Terrace: v irtually the sout hern-most equivalent of Xarries. Recent reconnaissance dril ling revealed the presence of a very large scour f eature along its east ern contact with the limestone ridge, and will be dril led out in detai l pr ior t o bulk sampling.
Numerous dumps f rom t he Namex era now f orms part of a JV between Trans Hex and members of the Richt ersveld community [Gariep Diamond Mining].
Transhex : Hondeklip Mine Location: Nort hern coast of Northern Cape, south of the Orange R iver Established: 1971 Current lif e of mine: Mining method: Alluv ial/Coastal Employees: 69
Table 12 Honde Klip Mine Production
Production Statistics 2003 2002 2001 Ore Treated (‘ 000 metric tons ) Diamonds recov ered (carats ) *32 201 44 847 26 535 Grade (carats/100 tons ) * Mine Closed January 2003
Comprising the western portion of the farm Avontuur A as wel l as the f arm Hondek lip [excluding t he town lands], and its adjoining Admiralty strip out to 31,49 m seaward f rom t he low water mark, Namaqualand, Northern Cape Province.
Mining Lease issued to Brazil Diamante Lt d in 1971 in respect of Hondeklip. Trans Hex Group bought this company in 1974, changed its name to Seeland Mynbou (Pty ) Ltd and ceded all the rights pert aining t o the af orementioned Mining Lease in 1985 to a Joint Venture bet ween Trans Hex Mining Limited and Eland Exploration (Pty ) Ltd (at that time a subsidiary of Cominco of Canada). On 1 April 1983, Seeland obt ained the right to prospect f or and mine diamonds on the western portion of the adjoining f arm Avontuur A, which right was also ceded t o the above Joint Venture. During 1986, Eland Exploration (Pty ) Ltd was bought by Trans Hex Mining Ltd. Mining commenced on a lim ited scale during 1971, reached a peak during the 1980’s and is now continuing at a reduced scale.
The f arms Hondeklip and portion of the adjoining Avontuur are characterised by a series of large excavations and overburden dumps. Many of these were creat ed in the seventies, and are currently being made safe. Presently all newly made excavations are backfilled as a standard rule, and overburden dumps are sloped to enhance stabi lity and sust ainability .
Northern Cape Province – Miner al sector strategy
66
Classic marine sediments (relatively thin – generally about 0,5m thick – diamondiferous gravel) occurring in a series of depressions, palaeo channels and embayments in the gneissic bedrock, and covered by up to 20 m of sandy and clayey overburden. These depressions contain local accumulations of saline ground water.
Firestone : Avontuur Mine The Avontuur Mine has t otal reserves and resources estimated at approximately 885 000 ct with a projected lif e of nine years. Firestone has recently complet ed a major expansion programme at the Avontuur Mine, resulting in the integration of two prev ious ly separate and adjoining operations on the Nova and Gras Kom properties int o a single expanded operation centred on the Avontuur Mine.
Earthmov ing capacity has been more than doubled to over 1 Mtpa, gravel treatment capac ity has been inc reased by 60% to approximately 320 tpd, and exploration drilling capabi lity has been increased ten f old. Recent drilling on the mine has also led to the discovery of a number of new gravel deposits, and while further evaluation of these deposits is required, the Company is conf ident that they will result in an inc rease to the mine's reserves.
Diamonds produced f rom Avontuur average approximat ely 0.2 ct and more than 80 % are of gem quality. The largest diamond recovered to date weighed 1.9 carats. Firest one markets its diamond production independently of the CSO by private tender, and sales are held several times a year in Sout h Af rica. In recent sales prices have averaged between $100 and $110 per carat.
Firestone : Oena Mine Firest one acquired an 87.5% interest in the Oena Mine in February 2000, and is in t he process of re-establishing mining operations at the mine. The Oena mining lease covers an area of 8,800 hectares and extends f or 17 km along the banks of the lower Orange River.
Asam Minerals, Firestone's geological consulting af f iliate, carr ied out the f irst prospecting activ ities on t he lower reaches of the Orange River in the lat e 1960's, and was responsible for the discovery and development of the f irst mines on the lower Orange River at Octha and Baken.
The Oena Mine is locat ed approximately 17 kilometres upstream of Baken. Upstream of Oena, Global Diamond Resources, a US list ed company , is developing a mine at Grasdrif .
Prev ious mining operations at Oena in the early 1990's were smal l scale and f ocused on t wo remnant deposits of high grade Miocene-age gravels, known as proto Orange gravels. Bet ween 1991 and 1995, Oena produced approximately 30 000 ct, worth about $24 million at current prices. The average stone size was approximately 2 ct, and in 1993 production was sold f or an average of $880 per carat. The largest stone recovered was 79 ct. As prices of large, high qual ity stones have inc reased significantly since then, t he current market value of these diamonds is estimat ed to be in t he region of $1,000 per carat. By 1995 the proto Orange gravels at Oena were mined out, f ollowing which mining operations were suspended.
Firest one intends t o re-establish mining operations at the mine to exploit t he substantial resource of more recent gravel terraces, known as meso Orange gravels, which remain on the mine. Geological and topographical mapping, aerial phot o analysis, and drilling have been undertaken on t he meso terraces, on the basis of which the total gravel resource is estimat ed to be approximately 40 Mt.
Sampling on the meso terraces has produced grades bet ween 0.6 and 1.25 cpht, with localised high grade areas of bet ween 5-10 cpht.

Northern Cape Province – Miner al sector strategy
67
Oena has the signif icant advantage that much of the original mine inf rastructure is still in place, allowing production to begin almost immediat ely . Key elements of the inf rastructure include mining equipment, accommodation, office space and workshops, fresh water supply , telephone line, runway, and gravel treatment plant and sorting building.
Firestone : Bonte Koe Mine Location: On the Buf f els River, Namaqualand Established: ~1960 Current lif e of mine: 4 Mining method: Alluv ial Employees: N/A
The Bonte Koe mine is in the Buffels River in the Namaqualand region and lies immediately downstream of De Beers ’ Nuttabooi mine. The Buff els River has been a significant diamond producing area f or the past 40 years. Mining operations in the area have produced an estimat ed tot al of over 3 Mct, with an estimated current value of over $750 million. The Buf f els River area produces diamonds with an average size of approximately 0.4 carats per stone and an estimated value of $200 per carat. Prev ious operations at Bonte Koe have produced approximately 180 000 ct from proto gravel deposits, at an average grade of about 44 cpht.
The Company int ends to re-est ablish mining operations at Bonte Koe t hrough African Star Minerals. It is estimated t hat approximately 1.5 Mt of proto gravels remain at Bonte Koe with an average grade of approximately 10 cpht, giving a resource of approximately 158 000 ct.
Activ ity at Bonte Koe since t he end of the year has been f ocused primarily on the completion of the development and operating plans for the mine. A supplier has been chosen for t he construction of a 100 tph DMS gravel treatment plant at Bont e Koe. A det ailed env ironmental management programme report covering rehabilitation of both historical and planned mining operations has been completed and submitted to t he Department of Minerals & Energy for approval. Planning f or the ref urbishment of accommodation, workshop and of f ice f acilities and the re-establishment of power and water supply is also at an advanced stage, and it is expected that mining operations will commence at Bonte Koe in the f irst half of 2004.
The Company plans t o mine the proto gravels at Bonte Koe over a f our year period, during which time drilling and sampling of the subst antial resource of meso gravels on the property wi ll be carried out to identify additional possible mineable reserves.
Marine Di amond Mining in the Nor thern Cape Signif icant advances in survey ing, sampling and recovery techniques have made the extensive marine deposits accessible. Although the sizes of these diamonds are generally smaller than diamonds produced inland, the quality is unsurpassed. The West Coast has been div ided int o 20 primary mining concessions, ranging f rom the mouth of the Orange River down to Cape Columbine in the south. The concession areas are arranged in numbered 30 km wide coast al perpendicular str ips. Each str ip is sub div ided into f our zones:
The “a” concession (31.49 m seaward of the low water mark t o 1 000 m beyond t he high water mark,
The “b” concession (ranging bet ween 4 – 6 km, based on f ixed co ordinates), The “c” concession (stretching as f ar as the 200 m isobath) and the “d” concession (as deep as the 500 m isobath).
Northern Cape Province – Miner al sector strategy
68
The 'c' and 'd' areas are largely limited to major local and overseas companies. This is because of the water depth and the hostile environment that requires significant f inanc ial and technological resources. Medium-sized and smal ler companies have generally been more active in the ' a' and 'b' areas, where known and proven exploration and mining techniques can be applied.
Until 1996, the northern concession areas attracted t he most attention, but in that year companies became interested in the sea areas in the Cape Canyon region f urther south. The whole area is notorious f or its f oul weather, which can sometimes make it imposs ible for diamond mining ships t o operat e. This k ind of mining has become possible due to modern technological advances which make it poss ible to obt ain reliable inf ormation about the geology of the ocean bed, the presence of diamond-bearing gravel and the extent of the reserves. De Beers, Namco and Trans Hex have acquired most of the available sea concessions.
De Beers has ext ensive marine operations of f the West Coast of South Africa, sout h of Port Nolloth. Here anc ient marine terraces are mined at t he Namaqualand operations (809 000 ct in 2000). De Beers' deepsea operations are operated by De Beers Marine, who are currently f ocused on offshore Namibia, where t he majority of its f leet is working for Namdeb (Namibian subsidiary of De Beers).
However, wit h the advent of new mining legis lation (t he proposed use it or lose it principal), many of the traditional holders of ground along t he West Coast may be f orced t o relinquish all or parts of their concessions. Here, the newly formed Namakwa Diamond Company has been f ormed t o evaluat e marine deposits locat ed along t he Olifants River, 350km nort h of Cape Town. This ground was relinquished by De Beers and has identif ied an inf erred resource of up to 20 Mt grading 0.1 - 0.2 cpt.
South Af rican l isted Gi lboa Properties have rights to mine the Namagroen marine concessions (8a, 9a and 8b) and have begun marine mining over target ed areas in t he Namagroen licenses that has historically produced high quality stones. Gilboa has calculat ed a total resource of 1.98 Mct over concessions 8a and 9a.
Kings Minerals has acquired several shallow marine concessions of f the West Coast, including t he 3(b), 5(a) and 6(a) concession located of f Kleinsee.
Concessions previously belonging to Namibian producer, Namco, have been acquired by Marine Diamond Mining (MDM) a company held by a Lev Lev iev Group company LL Mining. The company has some 1 500 km2 along the Namibian coast with mineable diamond resources of some 12 Mct.
The parastat al diamond producer Alexkor, located at the mouth of the Orange River, has been handed over t o the local community f ollowing a Constitutional Court ruling. The mine was prev iously run by interim managers, Mint ek, but the government has ret urned its stake in Alexkor to t he Richtersveld community , who were dispossessed of the land in 1926.
5.3.5 BARRIERS TO DEVELOPMENT The most critical barrier to development is access to available capital, a theme common to most small and developing companies world-wide. There would appear to be suff icient suitable ground available (obviously in some cases at the r ight price) t hroughout t he main diamond areas f or there to not be a problem with access to the raw resources.

Northern Cape Province – Miner al sector strategy
69
The main hurdle is the start-up capital to purchase plant and mat erial (and poss ibly land) to achieve such a level that the operation is profitable and able t o honour its f inancial, env ironment al and community obligations and commitments.
Another barr ier to eff ective development is the access to suf f icient water. Diamond recovery operations, by their very nature, require and consume a signif icant amount of water, for separating and sorting as well as act ual diamond recovery. This is not to mention the water required to run vehicles, prov ision for accommodation and of f ices, and sanitation among other requirements.
There is a wide gap bet ween the knowledge base of the large operators (De Beers, Transhex etc.) and that of the smaller companies and more inf ormal mining operations. A centralised “junior chamber of commerce” would go a long way top prov iding t he ski lls and knowledge transf er in the region, as well as providing centralised serv ices such as exploration, engineering, geology , recruitment, legal & financial consulting f rom a centre such as Kimberley .
A f urther problem which is severely aff ecting espec ially the alluv ial miners is t he regulation pert aining to the area that can be obtained f or mining under a mining permit. It is too smal l for this type of operation and the miners are f inding the administrative load very burdensome.
The f uel levy paid by miners puts f urther pressure espec ial ly on small miners who are supplying a major part of their energy needs on their m ines by using f uel.
5.3.6 RECOMMENDATIONS The South Af rican Diamond Industry has a long history in South Af rica, and the major players in the industry are well established, with a wealth of internal and external resources with which to continue and expand their operations. The BEE equity transactions involv ing the larger companies will, for the most part, already have been done or are in process, but these would most likely involve the larger established BEE players, and the local communities and SMME’s may well be lef t out of the loop.
Therefore, in order to make t he most of the resources available, a strat egy to promote t he development of new or ex isting SMME’s within t he region would go a long way to retaining a signif icant proportion of the wealt h generated from primary mining activ ities within t he prov ince. This st rategy could incorporate the est ablishment of a junior mining chamber, which would have specif ic branches responsible for overseeing sectors, e. g. diamonds and gemst ones, f errous met als etc. while also being able to co-ordinat e and promot e the prov ision of centralised services to a much wider range of operations which may not have suff icient capit al or cashflow to prov ide those themselves on an ongoing basis.
With regard the problem of small permit areas, the prov ince could lobby with the DME to improve this sit uation. Lobby ing t he appropriate authorities (SARS?) to lower or ideally do away with the fuel levy f or miners could also be eff ective in bringing down costs, especially for the small miner.
Diamond bearing gravels occur all along the Vaal and Harts R ivers near Kimberley as well as closer to the West Coast where al luv ial terraces occur. The areas around Ritchie, and Douglas are also significant targets f or small scale prospecting and diamond mining. Many of these are too small f or the large companies to mine but could be perf ect f or small scale mines. One idea is to t ake out the mining rights f or a large piece of land under which diamonds occur. Around ten small scale miners would then be set up with smal l plants to recover the diamonds while large earthmoving equipment is used to open up the whole area, mine the gravel f or these miners and ass ist them with t he rehabilit ation. This would require

Northern Cape Province – Miner al sector strategy
70
some initial prospecting, legalising the miners and on-going technical assistance. A portion of the prof its would be used to pay back the loan on their equipment.
A further initiative which must be looked at, is the development of a prov incial manuf acturing “hub” for manuf acturers of diamonds, gemstones and semi-precious stones, wit h a strong bias towards the jewellery sector, especially for diamonds. A local jewellery cluster, leveraging off the unique culture and resources of the Nort hern Cape and surrounds, could prov ide not only f or local South Af rican consumption, but if branded and market ed appropriat ely could be of significant int erest to overseas markets.
A spin-off f rom the development of a manuf acturing hub, could be the development of a tourism niche. Some tour companies already provide visits to the main mines in the region, and the museums and hist orical sit es of Kimberley and other t owns are wel l-known tourist destinations. A manufacturing centre, with possibly a museum detailing t he geological, historical and cult ural development of the region could be established wherever t he manufacturing hub is situated.
5.4 IRON ORE
5.4.1 OVERVIEW South Af rica has t he 9th largest iron ore reserve base in the world. It is the 7th biggest producer (30.5 Mt in 2002) and t he 6th biggest exporter (24.3 Mt in 2004) accounting f or 4,7% of world exports. Austral ia and Brazil are the t op t wo exporters and collectively accounted for 67.5% of iron ore exports in 2002. The value of local and export sales of iron ore were R5.31 bn in 2002, putting iron ore at 6th place in the "Top Ten" minerals for earning added-value to South Af rica. (D irect orate: Mineral Economics 2002/2003).
The princ ipal deposits are located in the Northern Cape and they form one of the major iron ore reserves in the world. The Province is a major producer and exporter of iron ore. Kumba operates the large Sishen mine, which is the world's third-largest iron ore mine. It produced 27 Mt in 2004 of which 21.7 Mt were exported through Saldanha Bay v ia the Sishen Saldanha rail line. Assmang, a subsidiary of Patr ice Motsepe’s ARM, operate the much smaller Beeshoek mine, which produces approximately 5 Mt pa most of which is export ed t hrough t he port of Saldanha Bay (Figure 6). Both companies are operating at capacity .
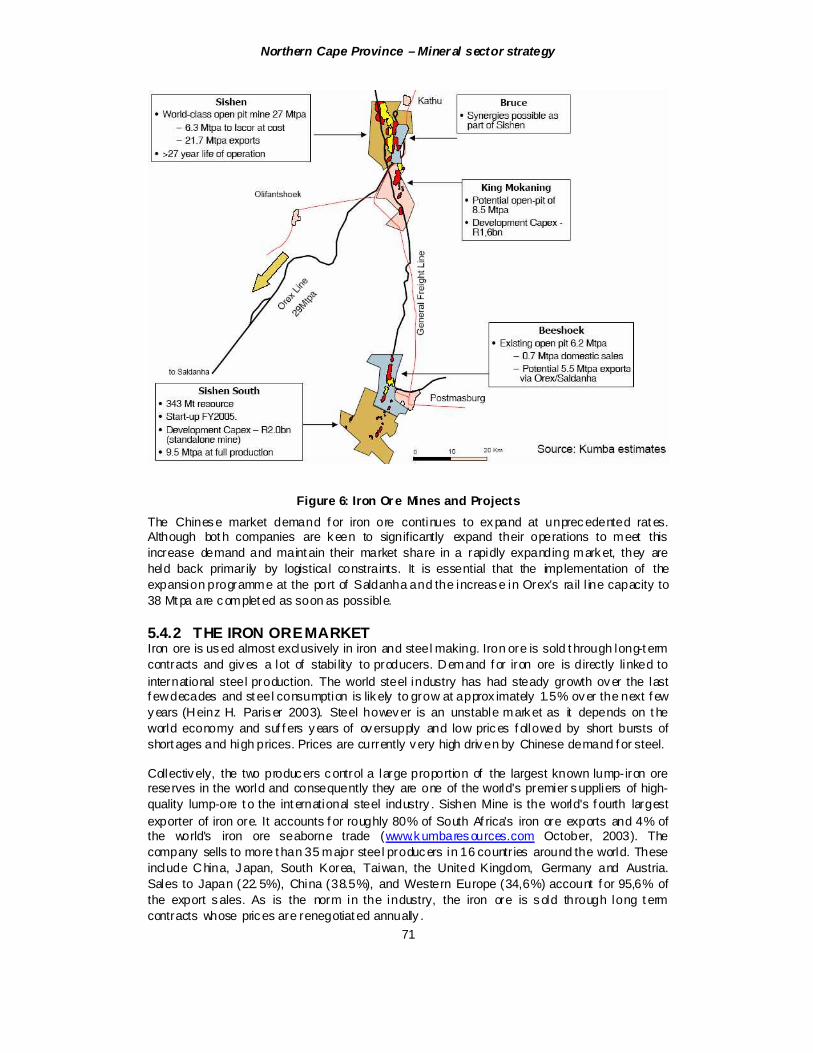
Northern Cape Province – Miner al sector strategy
71
Figure 6: Iron Or e Mines and Projects The Chinese market demand f or iron ore continues to expand at unprecedented rat es. Although bot h companies are keen to significantly expand their operations to meet this increase demand and maint ain their market share in a rapidly expanding market, they are held back primarily by logistical constraints. It is essential that the implementation of the expansion programme at the port of Saldanha and the increase in Orex’s rail l ine capacity to 38 Mt pa are complet ed as soon as possible.
5.4.2 THE IRON ORE MARKET Iron ore is used almost exclusively in iron and steel making. Iron ore is sold t hrough long-t erm contracts and gives a lot of stabi lity to producers. Demand f or iron ore is directly linked to international steel production. The world steel industry has had steady growth over the last f ew decades and st eel consumption is likely to grow at approx imately 1.5% over the next f ew years (Heinz H. Pariser 2003). Steel however is an unstable market as it depends on t he world economy and suf f ers years of oversupply and low prices f ollowed by short bursts of short ages and high prices. Prices are currently very high driven by Chinese demand f or steel.
Collectively, the two producers control a large proportion of the largest known lump-iron ore reserves in the world and consequently they are one of the world's premier suppliers of high-quality lump-ore t o the int ernational steel industry . Sishen Mine is the world's f ourth largest exporter of iron ore. It accounts f or roughly 80% of South Af rica's iron ore exports and 4% of the world's iron ore seaborne trade (www.kumbaresources.com October, 2003). The company sells to more t han 35 major steel producers in 16 countr ies around the world. These include China, Japan, South Korea, Taiwan, the United Kingdom, Germany and Austria. Sales to Japan (22. 5%), China (38.5%), and Western Europe (34,6%) account f or 95,6% of the export sales. As is the norm in the industry, the iron ore is sold through long t erm contracts whose prices are renegotiat ed annually .
Northern Cape Province – Miner al sector strategy
72
Sishen also suppl ies Iscor with iron ore t o supplement supplies from Kumba’s Thabazimbi mine in the North West Prov ince. This amount ed to about 7. 1 Mt in 2002, wit h 5.3 Mt pa supplied t o the Vanderbijlpark and Newcast e steel plants and 1. 8 Mt supplied to Saldanha Steel in Saldanha Bay. The Beeshoek mine also supplies a small quantity of ore to t he local market. This market is unl ikely to change much there are no current projects to increase iron and steel production in Sout h Af rica.
China's phenomenal growt h in recent years has pushed up the prices of iron and st eel products. The average world price of iron ore is usually around $36 /t of iron, but has r isen to $46 /t this year (Metal Bul letin 20 Sept 2004).
5.4.3 CURRENT MINING OPERATIONS Enormous amounts of iron are present in t he banded iron f ormations of the Asbestos Hills subgroup of the Transvaal Supergroup in the Griqualand west sedimentary basin. Economic ore bodies are f ound where the s ignif icant supergene enrichment has taken place increasing the iron cont ent to above 60%. The ore deposits consist of f erruginous conglomerates of the Gamagara Formation, which conf ormably overlay the supergene-enriched banded iron f ormation of the Asbestos Hills Subgroup.
There are two operating mines and t wo potential mines (See Table 13).
Table 13 Operating & Pot ential Iron Ore Mines (see Error! Unknown swi tch argument.))
Min e Comp any Fe grade % Reserves Operating Min es Sishen Kumba >60 2 300 Mt (Proven) Beeshoek Ass mang >60 173 Mt (Prov en) Potential Min es Wel gev onden Deposit (Sishen South) Kumba 66 343 Mt (Esti mated) Bruce & King Mokaning Ass mang 400 Mt
Kumba’s Sishen mine lies at t he nort hern t ermination of the Gamagara Hills in t he Postmasburg District. It has recently completed a US$13.3 M project t o upgrade its c lassif ier to inc rease t he mine's production capacity by 1Mt pa. The mine is currently busy on t he Sishen Expansion project (see Error! Unknown switch argument.).
Assmang’s Beeshoek mine lies at t he sout hern termination of the Gamagara Hil ls in t he Postmasburg District. The deposit is essentially similar to Sishen, occurr ing in the same stratigraphic horizon and probably hav ing a s imilar genesis. The Beeshoek conglomerat e ore of the Gamagara type predominates (Council for Geoscience 1998). Beeshoek South, commiss ioned during 1999, prov ides 70% of the iron ore. The remaining 30% of Assmang's production come f rom the old Beeshoek North operation.
Bot h mines are large-scale opencast operations. The ore is mined f rom various dif ferent pits. This is ideal f or selective mining and in-pit blending to prov ide ore to meet customer specif ications. The ore is crushed, washed and screened.
5.4.4 REVIEW OF INVESTMENT OPPORTUNITIES There are three major investment opport unities:
Expand iron ore mining to supply the export market. Rationalisation of the Industry

Northern Cape Province – Miner al sector strategy
73
Pig i ron smelter and steel slab caster
Expansion of Iron Ore Production There is a strong case t o increase iron ore exports f rom t he Nort hern Cape. The world demand f or steel, particularly from China, has signif icantly increased the demand f or iron ore. Bot h Sishen and Beeshoek mines have plans to expand and t he available iron ore resources. Sishen has the growth potential to expand f rom its current capacity of 27 Mt pa to 47 Mtpa. Assmang has the capacity to double its production f rom 5 Mtpa t o 10 Mt pa by the end of the decade.
There are three potential expansion projects under consideration:
Kumba’s Si shen Expansion Project – This will inc rease the capacity of Sishen B mine by 10Mtpa without shortening the mine's lif e. This wil l be achieved mainly by implementing improved mineral dressing using newly developed jig technology , which will give a higher yield of upgraded product. This will enable lower grade mat erial to be mined thereby increasing the resource base f rom 1 719 Mt to 2 517 Mt and reduce the long t erm stripping ratio f rom 3.0 to 1.9. The feasibility study was scheduled f or completion in August 2004 and the capit al cost is estimated to be US$288 M.
Kumba’s Sishen South Project - This is a high quality resource of 426 Mt (excluding <60% Fe ores) wit h a Fe content of 64,8% and is suit able for open cast mining. The project is located some 70 km south of the Sishen mine next to Assmang’s Beeshoek mine. A f easibil ity study and assoc iated env ironmental study aimed at est ablishing a mining operation have been complet ed. The EMPR and mining authorisation request have been prepared and are ready f or submission. The mine will add 8.5 Mtpa of iron ore to Sishen’s existing production and the capit al, cost is estimated to be US$ 350 M.
Assmang’s Bruce and King-Mokaning Proj ect -Assmang aims to increase its iron ore sales to 10 Mtpa over the next nine years. The company is currently engaged in a f easibility study assessing the viability of sourcing this additional production by opening a mine to exploit t he substantial high-grade haematite iron ore deposits locat ed nort h of Postmasburg on the f arms Bruce and King-Mokaning. These deposits are situat ed adjacent to the current Sishen mine. The new mine will be phased in gradually as Beeshoek reaches the end of its lif e span and is gradually phased out. (www.assmang.co.za/operations/beeshoek.asp October 2004).
Rationalisation of the Industry The opportunity exists f or the two iron ore players to rationalise their operations by means of an asset swap. This would involve:
The merger of Sishen South wit h Assmang’s Beeshoek mine in the south; and The consolidation of Assmang's undeveloped properties (Bruce/ King/ Mokaning) into t he
adjacent Sishen mine in the north.
The consolidation would al low f or the best use of the rail l ine between the north and south areas. Unnecessary rail cross-traff ic would be avoided as Beeshoek and Sishen South production could meet the inland needs of 4,5 Mtpa f or Iscor and 0, 7 Mt pa currently supplied by Assmang to Scaw Metals. The balance of 2,5 Mtpa pot entially produced in the south area would travel nort h to join the export stream f rom Sishen to Saldanha. (At present, Assmang rails 4.8 Mtpa north to Sishen and the Orex l ine f or export, and Kumba rails 4,5 Mt pa south to meet Iscor needs).
Northern Cape Province – Miner al sector strategy
74
Discussions bet ween Kumba and Assmang on a potential asset swap ended with each deciding to go their separate ways, since they could not agree on the relative valuations of the affected properties, alt hough the door was lef t open f or f uture co-operation.
Pig iron smelter and steel slab caster Hatch undertook a pre-f easibil ity study on behalf of Mint ek and f unded by the US Trade and Development Agency (USTDA) to assess the viability of establishing a DRI (Directly reduced iron/Hot briquetted iron) plant to utilise sint er f ines from the Sishen mine. The project concept env isaged pre-reducing the ore us ing natural gas in a Midrex shaf t f urnace t o produce a low-grade Directly Reduced Iron (DRI) product. Hatch concluded t hat piping gas to Sishen would be too expensive.
Instead Hatch suggested that the option of building a smelter should be considered. The iron ore would be smelted at Sishen using coal-based smelting technology (e. g. the Hismelt process) t o make pig iron f or the export market. This coal-based smelting approach avoids the pitfalls of pre-treating the Sishen sinter f ines and allows the production of high quality pig iron ingots, which can be readi ly sold on the world market (Hatch). The Hismelt process is proprietary to Rio Tinto and has only been tested on a pilot scale. The first f ull scale instal lation is currently being built in Aust ralia as part of Rio Tinto’s Kwiana project in Western Australia.
A pig iron smelter can f rom a technical point of v iew, be easily upgraded to become a steel plant producing low-cost steel slab f or f lat-rolled steelmakers worldwide. In the past Latin American countries have fulf illed this need but possible restraints on iron ore supplies could limit slab production in t hat region. Slabs-f or-export projects are becoming popular. The American and European steel producers have high smelting costs due to the importation of raw materials, high energy and labour costs, old plant and env ironmental legislation. The trend is to move away from smelting and inst ead supply a tailor-made product for the customer - particularly the automobile industry . There is theref ore a growing demand f or steel slab f rom t he American and European re-rol lers. A greenf ield slab plant has an estimat ed value of $1.5 bn (Metal Bulletin Monthly, October 2003). Although slabs are at the cheap end of the steel products spectrum, world slab demand has the pot ential to grow f rom some 26 Mt pa at present to 40 Mtpa in 2010.
5.4.5 BARRIERS TO DEVELOPMENT Iron Ore Expansion The major barrier to development is logistical. Inf rastructure expansion is critical to implement the industries growt h plans. The Sishen and Beeshoek expansions both require a signif icant upgrade in the capac ity of both the Orex l ine and the Saldanha harbour f acility . Any delays in the current program to upgrade the system, could serious ly jeopardise the industry ’s ability to maintain its market share in t he current expanding market for iron ore. The f urther expansion above 41 Mt pa is more problematic as it will be capital int ensive and this will aff ect the prof itability of the additional i ron ore production.
Rationalisation of the Industry The major barrier to the concept of rationalis ing are relat ed to t he problem of relative valuations of the various properties and dif fering company objectives.
Pig iron smelter and steel slab caster The major problem is the level of technical r isk as the Hismelt process has not been proven on a full production basis. Market risk is also a problem as t he steel market is very cyclical and the time taken t o construct the plant means t hat it could f ind itself coming int o production just as the market f or steel ent ers a downt urn. Furt hermore, the steel would have to be

Northern Cape Province – Miner al sector strategy
75
exported as South Af rica's ex isting steel plants currently supply most of the domestic requirements.
5.4.6 RECOMMENDATIONS The Northern Cape Government should use its f acilitating and co-ordinating powers to:
Ensure that all stakeholders (national government, Spoornet, and the iron ore producers continue t o work together on a pro-active manner t o ensure that t he upgrading of the Orex inf rastructure progresses
Attract potential investors, in conjunction wit h the dti, t o consider investing in establishing a DRI or steel plant.
Encourage Kumba and Assmang to revisit the concept of rationalising their operations.
5.5 MANGANES E & MANGANES E ALLOYS
5.5.1 OVERVIEW The Northern Cape contains the largest depository of manganese ores in the world. Despite this, South Africa is only the world's second largest producer of ore (18.8%) after China (20. 8%). In addition, Sout h Africa is the world’s number three producer of f erromanganese and f errosilicon-manganese (11. 1%) af ter China (26.3%) and the f ormer USSR (16%). Nevertheless, manganese, with combined sales of R5.3 mil lion f or ore and f erro-alloy, was the number 7 earner f or minerals exports f rom South Africa in 2003
There is 30% smelter overcapacity in the world. Sout h Af rica's capac ity utilisation in 2001 was 71% (Heinz H. Pariser 2003).
The production and marketing of manganese ore and manganese alloys is ef f ectively controlled by a duopoly cons isting of Samancor and Assmang. Samancor is owned by BHP-Bill iton (60%) and Anglo American plc (40%). Assmang is owned by Anglovaal Mining. Samancor and Assmang have f ormed joint ventures. All of the manganese ore is mined in the Northern Cape, but Samancor smelt in Meyerton (near Johannesburg) and Assmang smelt at Cato Ridge, (near Durban).
South Af rican manganese ore production in 2002 was 3 322 kt (with a manganese content of 1 505 kt), of which 46. 0% of the ore was smelted to produce manganese alloys A small amount of ore is used for the production of electroly tic manganese diox ide (22 kt pa), manganese sulphate (10 kt pa) and manganese metal (44 ktpa). The balance of the ore is exported. Clearly , there is scope t o increase the amount of local benef iciation.
5.5.2 MANGANESE MARKETS Manganese is an essential component in the manuf acture of new iron and steel and this accounts for more than 90% of manganese consumption. There is a direct relationship bet ween the demand for manganese alloys and the production of new steel. Minor amounts are used in t he production of batteries and manganese chemicals.
There has been a decrease in the quantity of manganese needed to produce a ton of steel (f rom 15 to 7 kg per tonne) over the last t wo decades, due to new iron and steel making practices, modernisation of the industry and env ironmental legis lation. Because of this, the consumption of manganese has remained st atic over the past decade although t he production of steel has grown. This is now changing. Firstly, steel production is growing strongly , largely because of the tremendous growt h being experienced by the Chinese economy . Secondly , the downward trend in the intens ity of use of manganese in t he
Northern Cape Province – Miner al sector strategy
76
production of steel has bottomed out in the west ern world even though its eff ects will continue f or some time in the rest of the world as those countries modernise their steel industries.
Very little manganese is used for iron production in the blast f urnace, so nearly all manganese ore is smelt ed t o produce f erroalloy additions f or use in the steel industry . (High Carbon Ferromanganese, Silico-manganese, and ref ined (low and medium carbon) Manganese).
Steel consumption is likely to grow at approximately 1.5% over the next f ew years and at some point manganese demand should start growing to satisf y the increasing steel demand (Heinz H. Pariser 2003). The use of manganese by the steel industry is inf lexible - there is no price elasticity . The price of manganese ore has been stagnant f or several years at $2.00 per metric tonne unit, but f or the reasons discussed above the price of ferroalloys has almost tripled in recent mont hs. As an example, f erromanganese has hovered around the $500/t level for the last decade, but this year rose from $485/t in February to $1035/t in March, $1150/t in April and May and $1250/t in June (St ar 2004).
South Af rica's capacity utilisation in 2001 was 71% (Heinz H. Pariser 2003). The smelter industry is marked by intense competition.
The world manganese ore market is largely control led by four majors producers, Samancor, CVRD, Eramet and Assmang. Only f our sustainable deposits of high-grade ore are accessed in the world today . These deposits are exploit ed by Samancor in Australia, CVRD in Brazil, by Eramet in Gabon and by Samancor and Assmang in the Northern Cape. All these operations have the capacity to increase their production signif icantly . The return on capital derived f rom mining and sell ing manganese is signif icantly higher than that obt ained f rom smelting ore to produce manganese alloys.
The production of manganese ore and manganese alloys in South Af rica is effectively a duopoly : Samancor and Assmang runs all but t wo of the mines and both smelters in the country. They regard competition as a disaster since this would destabilise the price.
Nearly half of South Africa's exports of manganese ore are destined f or Japan (706 kt) and a third to Western Europe (516 kt) and a small amount to China (47 kt). The Chinese, the largest producers of f erro-manganese, also import signif icant quantities of ore f rom Gabon. Brazil and South Af rica to blend with its low-grade ores t o obtain a suf ficient Mn:Fe ratio. The South Af rican Ferroal loys are mostly exported to the USA and Japan.
5.5.3 CURRENT MINING OPERATIONS South Af rican manganese deposits are essentially confined to the early Proterozoic Transvaal Supergroup deposits in the in the Northern Cape Prov ince.
The main manganese field is the Kalahari Manganese Field situated nort hwest of Kuruman. It consists of f ive structurally erosional preserved relics of carbonate-rich manganese depos its interbedded wit h banded iron formations, largely covered by unconsolidated sand deposits of the Kalahari Formation. The Mamat wan – Wessels basin (425 km2, 41km long and 5 to 20 km wide) is by f ar the biggest of these remnants. The Mamat wan mine is located at its southern end and the Wessels Mine at its northern end (Figure 7).

Northern Cape Province – Miner al sector strategy
77
Figure 7: The Kalahari Manganese Field (Astrup and Tsikos, 1998)
The ores of the Kalahari Manganese Field belong to t wo principal types.
The Mamatwan/ Gloria type ore – This lower grade ore (39% Mn) is charact erised by a high manganese to iron ratio (7-8). This type of ore contains calcium and magnesium carbonates, t hese impart desirable self -f luxing characteristics to the ore. The ore has a relatively low combined Fe and Mn content of 40-44%, the average ore produced at the Mamatwan mine hav ing 38% Mn and 4.3% Fe.
The Wessels/N’chwaneng type or e - This higher grade ore type has a combined metal content of 58-68%, with Mn vary ing f rom 44-65% and Fe f rom 6-18%. Phosphorous is very low and silica is general ly not high. These ores are f requently bought to blend with ores high in phosphorous f rom other sources. They have lower manganese to iron ratio than t he Mamat wan type ore.
The Hotazel supergr ade type ore – This ore is f ound in the Hotazel and Langdon Annex deposits and represent portions of the KMS that have been downf ault ed into graben structures, where hydrothermal and supergene enrichment has produced an ore wit h a Mn content in excess of 60%. They have been virtually mined out
Bot h the grade and manganese to i ron ratio of the ore can vary significantly within a single ore body . It is theref ore be essential to locat e and delineate such changes wit hin potential deposits bef ore commencing mining in order t o demonstrate their suit abi lity to supply the type of ores required (Theart, 2003)
There are currently seven manganese mines in operation in the North Cape (Table 14 ) and a small manganese mine in Gaut eng. Assmang and Samancor each operate three mines and National Manganese, the only independent manganese ore producer, operate the York mine.

Northern Cape Province – Miner al sector strategy
78
Table 14 Operating Manganese Mines
Min e Comp any Ore Type Min e typ e Black Rock Assmang Ltd Wes sels Opencast Glor ia Mine Assmang Ltd Mamatwan Underground San toy/N’chwan eng Assmang Ltd Wes sels Underground Ho tazel Samancor Ltd Hotaz el Opencast Mamatwan/Smar t Samancor Ltd Mamatwan Opencast Wessels/Dib iag Samancor Ltd Wes sels Underground York Mine National Manganese
Mines (Pty) Ltd Mamatwan Opencast
The Gloria and Mamat wan/ Smart mines both operat e sinter plants to upgrade t heir ore by lowering the carbonate content.
Samancor and Assmang operate smelt ers in Meyert on and Cat o Ridge respectively. The Samancor smelter employs very large and ef ficient f urnaces (up to 82 MVA) and recovers energy by electricity generation. However, despite the considerable progress made with efficiencies at Meyerton, Samancor is still far from the potential eff iciency that can be achieved in this industry . In contrast, the Assmang f acilities at its Cato Ridge smelter are effectively obsolete. The f urnace size range, 11.7 MVA to 24 MVA is generally regarded as too small, particularly for application in the production of high carbon f erro-manganese.
South Af rican manganese ores cont ain 45% manganese on average, but have a relatively low manganese-to-iron ratio. This presents the largest single challenge to ef f icient smelting practice. The ores have to be blended with higher-grade carbonat e ores t o increase t he manganese cont ent of the smelter f eed. For example, Assmang import ore f rom Gabon, which has a high Mn:Fe ratio, and blend it wit h its ore f or smelting at its Cato Ridge smelter. The accepted percentage manganese content is 78% for f erromanganese and approximately 66% f or f erro-si licomanganese.
5.5.4 INVESTMENT OPPORTUNITIES The integrated ref orms to the mining legislation, the implement ation of the mining chart er, and the governments objective of encouraging f urther value adding benef iciation to South Af rica mineral production together with the characteristics of the manganese industry have created a number of signif icant investment opportunities in the Kalahari manganese industry :
The Introduction of a Third (BEE) Player into the local industry – There is an opportunity f or a third player enter the market, ideal ly a BEE company. There has been talk of Bill iton sel ling Samancor to concentrate on its Australian manganese resources, which poses the possibility of them selling to a BEE company .
The Establishment of a New Manganese Smelter in the Northern Cape Province – As seen above the current smelting capacity is not t he most efficient. This is an opportunity to establ ish a world c lass smelting f acility using large eff icient f urnaces and ore preheaters. Central government policy is to increase the amount of benef iciation taking place in South Af rica and is in t he process of establishing policy levers to f acilitate this. In addition many of the European smelters are experiencing diff iculties, not ably prohibitive daytime power costs, the necessity to import al l ore and reduct ants, and high labour costs. In contrast, if a smelter is sit uated in the Northern Cape Prov ince, it can benef it f rom locally sourced ore and reduct ants as well as low power costs.
Northern Cape Province – Miner al sector strategy
79
Two smaller scale investment opportunities warrant investigation:
Treatment o f Tailings & Waste Dumps – The various waste dumps generated by the mining activ ities over the years (an estimated 350 kt of dumped tailings) cont ain signif icant amounts of manganese ore fines. These represent a source of potential revenue and currently constitute an environmental problem. The pot ential exists to process these slimes to produce an upgraded agglomerated product that can be transported and smelted. Mintek is active in this research and is currently carry ing out test work. Such a process would also be used to treat the current aris ing tailings (15 tph). The successf ul implement ation of such a project would provide a good opportunity f or a local BEE company and would generate jobs, as well as addressing an env ironmental problem (D. Van Wyk, 2004).
Smallscale mining – Some areas of the Kalahari Manganese Field contain small pockets of supergene enriched manganese ore (Hotazel type ore). These consist of manganese rubble which has accumulated in palaeo-sinkholes and then been upgraded by supergene enrichment. They are too smal l and irregular t o be economical ly mined by the big mining companies. Their irregularity prevents the use of mechanical equipment but lends itself to labour int ensive mining and hand sorting. The extraction of ore can be undertaken with minimal capital input. Picks, shovels and wheelbarrows can be used perhaps assisted by the use of small front-end loaders. Screening and jigging separates and sizes the rubble ore f or stockpiling and col lection. The coarse ore can be hand sort ed f rom the rubble according to the iron-t o-manganese ratio. Identification of several diff erent rock-types would be v isual (colour, morphology, porosity , texture, etc). Women are f ound more eff ective at this than men due to their superior multi -tasking abil ities. A desk study indicated an attractive return and a more detai led study is recommended (Cal laghan, 2002). An example is t o the north of Beeshoek and Postmasburg where rubble of both iron and manganese ore is available f or small working. At one stage, a smal l scale miner had collected high grade iron ore from the f lat ground below the hills near Beeshoek and sold it to the mine. This should be investigated and reinst ated with the possibility of a small jigging plant to treat the finer particles.
5.5.5 BARRIERS TO DEVELOPMENT Introduction of a Third Player The major barrier to entry by a new player is the Samancor-Assmang duopoly . Driven by their need to maintain their margins in an overtraded market, they may oppose the introduction of a third player.
New Smelter There are a number of signif icant barr iers t o entry by a new smelt er:
Market Entr y- A new smelt er operat or would find market entry diff icult as the f erroalloy market is only growing slowly . It has been estimated that the ferroal loy market can only incorporate a new producer supplying 25 ktpa. Any increase in market would happen at the expense of other producers market share. The new producer would suf f er f rom retal iatory action f rom ot her smelters, most of who are operating well below capacity.
Economi es o f scale – To benef it from economies of scale a new f urnace should produce at least 120 ktpa. This is in excess of current market demand
Access to r aw materials - A new player in t he South African f erroalloy industry would probably require ownership/access of two dif f erent types of manganese mines - a mine producing Wessels type ore and a mine produc ing a Mamat wan type ore - in order to produce an ore blend to give a suf ficiently high Mn:Fe ratio in the f erroalloy and with good smelting properties.
The Economics of Manganese Smelter operations- Given the current structure of the industry and the overcapac ity in the industry, it may be diff icult to justify high capital expenditure and the risk needed to est abl ish a new smelter.
The Assmang-Samancor Duopoly:. The eff ective duopoly in manganese ore production effectively means that the t wo major producers are able to control the market such that

Northern Cape Province – Miner al sector strategy
80
the sale of manganese ore is much more prof itable than the production of manganese alloys. For example, Met alloys (Samancor) do not make any prof it on f erroalloys at $500/t.
Power costs: The looming shortage of power generation capacity in South Af rica will drive up the cost of power in South Af rica and t hus erode one of the countries key competitive strengths in mineral benef iciation. Furthermore, the est ablishment of a smelter in the North Cape may require an expens ive upgrade of the existing transmission system.
Technical advances in manganese smelting however f avour the development of new more efficient capacity . In this regard, a new Sout h Af rican smelter could benef it f rom the experience of the European smelters who, f aced with the high cost of power, labour, and raw materials, have had to become extremely eff icient in order to be competitive.
There is scope f or f urther improvement in smelting f erromanganese al loys by the pre-agglomeration and preheating/partial pre-reduction of manganese ore fines, pellets and lump ore as proposed by Outokumpu. It is now establ ished that sint er and not lumpy ore is t he most eff icient f eedstock. This f orm is stable in the f urnace, whereas mineral ores tend to f ragment at high temperat ures causing a decrease in furnace productiv ity . Energy eff iciency wi ll be the import ant design f eature. This means:
Bui lding large furnaces to give thermal and labour ef f iciency Utilising f urnace off -gas f or ore preheating. Installing t win tap holes f or slag retention Designing the f urnaces to accommodate daytime idling: South Af rica currently has a
surplus of electricity but it is predicted that af ter 2007 there could be a def icit. This could mean that smelters will be encouraged to use "of f -peak" electricity causing furnaces to be idled during "high-demand" periods. Current Sout h Af rican f urnaces are not designed for this mode of operation.
A study of optimum f urnace sizing suggested that the lowest operating cost would be achieved from units of around 45-55MVA. This conc lusion was based on the longer recovery times and increased diff iculty of operation of f urnaces using large diameter electrodes.
The location of possible plants will need to be explored. A number of f actors wil l af f ect decis ions on location, namely location of the manganese ore, sources of reductants (gas or coal), the availabi lity of electricity and the problem of export logistics. The areas in which needs and opportunities appear to lie inc lude: greater use of lower grade and low cost f eed materials, improved product quality , increased process/energy eff iciency , lower emissions, less negative impact on health and saf ety of operations and operator guidance systems to optim ise process perf ormance.
Pre-melting of manganese ore f ines and dusts and the smelting of liquid f eed in a suitable f urnace would pot entially off er signif icant advantages if manganese vapour losses could be limited. Mintek has carried out a prel iminary study on the use of a cyclone pre-melter such as the Voest Alpine Contop reactor combined with a DC arc f urnace. The initial results of the paper study look f avourable. Support is now being sought from the f erro-alloy industry to take the project f orward to the piloting stage over the next couple of years.
Given t he mounting pressures on the European producers, they may become interest ed in entering a joint venture in Sout h Af rica to enable them to close their high cost European operations. Similarly , the availability of new more eff icient technology may encourage

Northern Cape Province – Miner al sector strategy
81
Assmang to build a state-of -the-art f urnace in the Nort hern Cape to replace their ageing, inef f icient furnaces at Cato R idge.
Tailing treatment and Small scale Mining The barriers to t hese type projects are largely relat ed t o the availability of technical and f inancial resources. The nature of the operations are unlikely to be seen as core operations by the major companies yet an investment in developing the relevant skills and technology needs to be made to initiate the process. The Provincial Government could play a major role in co-ordinating t hese attempts through est ablish some f orm of public-private partnership to prov ide the skills transfer and needed research.
5.5.6 RECOMMENDATION The Northern Cape Government should use its f acilitating and co-ordinating powers to:
Ensure that all stakeholders (national government, Spoornet, and t he manganese ore producers ) continue t o work together on a pro-active manner to ensure that the upgrading of the manganese export line inf rastructure progresses.
Ensure that all stakeholders (DME and the manganese ore producers) continue to work toget her on a pro-active manner facilitat e the entry of a third party (BEE) producer into the industry to ensure t hat objectives of the governments transf ormation objectives are met.
Attract potential investors, in conjunction wit h the DME and dti, to cons ider investing in establishing a new manganese smelter in the Prov ince. This needs to be done, where possible in conjunction with the existing producers input.
Attract potential investors, in conjunction wit h the dti, t o consider investing in establishing a further DRI or steel plant.
Work wit h the DME, the mining companies, and local authorities to identify small mining opportunities and to put the supporting inf rastructure in place and organizations.