4. results - information and library network...
TRANSCRIPT

- 50 -
4. RESULTS
4.1 Insecticidal bioassay studies on lab and field populations of H. armigera and
T. chilonis
4.1.1 Insecticide bioassay on field collected (cotton and tomato) and susceptible lab
populations of H. armigera
The results on the toxicity of the test insecticides to third instar larvae of
susceptible lab and field populations of H. armigera on cotton and tomato are presented in
Table 3. The statistical comparison of toxicity and resistant factor shown in Table 4
revealed variations in the responses to field and susceptible populations of H. armigera
larvae on cotton and tomato to the insecticides applied. On cotton, the median lethal
concentration (LC50) for 3rd
instar larvae of H. armigera ranged from 74.09 to 2684.97
ppm for the eight different insecticides, with the larvae exhibiting the highest resistance to
triazophos and the lowest to abamectin (Table 4). Resistance of field populations to
organophosphate compounds compared to the susceptible strain was found to be
significantly higher by 1.26 to 4.11-fold. The resistance factor was highest (4.11) for
malathion and least (1.2) for chlorpyriphos. In contrast to organophosphates, resistance of
field populations of H. armigera to pyrethroid (cypermethrin) was 14.16 compared to the
susceptible populations. The field populations on cotton showed no resistance to
indoxacarb and abamectin and the resistance factor was 4.94 and to spinosad the resistant
factor was 2.49 as compared to susceptible population. The non-overlapping method of
fiducial limits done to observe differences in LC50 values indicated abamectin and
spinosad were on par (P<0.05), and differed significantly from other insecticides
(Figure.1).

- 51 -
On tomato, the median lethal concentrations (LC50) for 3rd
instar larvae of H. armigera
ranged from 46.44 to 2515.37 ppm for the eight insecticides, with the larvae exhibiting the
highest resistance for triazophos and the lowest resistance to abamectin (Table 4). The
resistance factor for organophosphate compounds for larvae collected from tomato was
significantly lower (1.15 to 2.09 fold) compared to the susceptible population. The
resistance factor was highest for cypermethrin (13.9), while indoxacarb showed nil
resistance as compared to the susceptible population. The non-overlapping method of
fiducial limits to test the difference in LC50 values indicated abamectin and spinosad
resistance was at par (P<0.05), and it differed significantly with other insecticides (Figure.
2). The larvae collected on cotton were 1.01 to 1.97-fold more resistant as compared to
tomato.
The insecticide toxicity data was also recorded after 7 days of exposure and their
mortality data was recorded (Table 5) and the LC50 values was derived using probit
analysis (Table 6). Hundred per cent mortality was recorded in the higher three
concentrations in most of the insecticides tested for field and susceptible populations of H.
armigera. From the probit analysis the median lethal concentration was tremendously
decreased and the LC50 values for field cotton populations was found to be 15.58, 243.39,
30.39,. 102.46, 249.96, 296.99, 17.67 and 613.17 ppm respectively, similarly the LC50
values for field tomato populations was found to be 12.49, 208.47, 38.32, 88.25, 303.98,
387.25, 13.67 and 529.12 ppm respectively.
4.1.2 Insecticide bioassay on susceptible lab and field (tomato) populations of T.
chilonis
The results on the toxicity of the test insecticides of field and susceptible
populations of T. chilonis on tomato are presented in Figure. 3 (abamectin, chlorpyriphos,

- 52 -
cypermethrin and indoxacarb) and Figure. 4 (malathion, quinalphos, spinosad and
triazophos) on susceptible populations and Figure. 5 (abamectin, chlorpyriphos,
cypermethrin, indoxacarb, malathion, quinalphos, spinosad and triazophos) on field
populations of T. chilonis (tomato), The statistical comparison of toxicity and resistant
factor is shown in Table 7. The data revealed very minute variations in the responses of
susceptible and field populations of T. chilonis to the insecticides applied. In field
populations, the median lethal concentration (LC50) ranged from 1.03 to 271.13 ppm for
the eight different insecticides, with the adults exhibiting the highest LC50 to quinalphos
and the lowest to malathion (Table 7). In lab populations median lethal concentration
LC50) ranged from 1.05 to 322.47 ppm for the eight different insecticides, with highest
LC50 values obtained for quinalphos and the lowest for malathion (Table 7).
The LC50 of field populations to organophosphate compounds was found to be
highest for quinalphos (271.23) followed by chlorpyriphos (12.93), triazophos (1.33) and
least in malathion (1.03) and in susceptible strain the LC50 organophosphate compounds
was found to be more in quinophos (322 .47) followed by chlorpyriphos (11.34),
triazophos (1.29) and least was in malathion (1.05). The LC50 of indoxacarb was 176.05
and 288.09 in field and susceptible strain populations; similarly LC50 of abamectin was
1.62 and 1.72 in field and susceptible strain. The LC50 of pyrethroid (cypermethrin) was
1.69 and 1.30 in field and susceptible strain. Comparing the LC50 values of all eight
insecticides of field and susceptible populations, it shows that field populations of T.
chilonis have no resistance to the insecticides tested.

- 53 -
Table 3. Toxicities of different insecticides on field (cotton and tomato) and
susceptible lab populations of H. armigera on cotton after 24 h of
exposure
Insecticide
Field (Cotton) Field (Tomato) Susceptible Lab
Dose
PPM n
a r
b M
c
Dose
PPM n
a r
b M
c
Dose
PPM n
a r
b M
c
Abamectin
0
14.25
28.5
57
114
10
10
10
10
10
0
0
2
6
7
0
0
20
60
70
0
14.25
28.5
57
114
10
10
10
10
10
0
0
4
6
10
0
0
40
60
100
0
4.75
9.50
19.0
38.0
10
10
10
10
10
0
1
4
6
10
0
10
40
60
100
Chlorpyriphos
0
300
600
1200
2400
10
10
10
10
10
0
0
2
4
9
0
20
40
90
0
300
600
1200
2400
10
10
10
10
10
0
0
3
5
9
0
0
30
50
90
0
175
350
700
1400
10
10
10
10
10
0
0
1
4
6
0
0
10
40
60
Cypermethrin
0
25
50
100
200
10
10
10
10
10
0
0
0
3
6
0
0
0
30
60
0
25
50
100
200
10
10
10
10
10
0
0
1
3
6
0
0
10
30
60
0
5
10
20
40
10
10
10
10
10
0
2
5
8
10
0
20
50
80
100
Indoxacarb
0
108.75
217.5
435
870
10
10
10
10
10
0
0
5
7
9
0
0
50
70
90
0
108.75
217.5
435
870
10
10
10
10
10
0
0
5
8
10
0
0
50
80
100
0
54.3
108.6
217.2
435
10
10
10
10
10
0
0
0
1
6
0
0
0
10
60
Malathion
0
250
500
1000
2000
10
10
10
10
10
0
0
1
3
6
0
0
10
30
60
0
250
500
1000
2000
10
10
10
10
10
0
0
3
6
10
0
0
30
60
100
0
125
250
500
1000
10
10
10
10
10
0
2
4
6
10
0
20
40
60
100
Quinalphos
0
250
500
1000
2000
10
10
10
10
10
0
0
0
2
6
0
0
0
20
60
0
250
500
1000
2000
10
10
10
10
10
0
0
1
3
6
0
0
10
30
60
0
125
250
500
1000
10
10
10
10
10
0
0
1
2
6
0
0
10
20
60
Spinosad
0
12.5
25
50
100
10
10
10
10
10
0
0
1
3
6
0
0
10
30
60
0
12.5
25
50
100
10
10
10
10
10
0
0
2
3
5
0
0
20
30
50
0
4.75
9.5
19.0
38.0
10
10
10
10
10
0
0
0
2
6
0
0
0
20
60
Triazophos
0
400
800
1600
3200
10
10
10
10
10
0
0
1
3
6
0
0
10
30
60
10
400
800
1600
3200
10
10
10
10
10
0
0
2
4
6
0
0
20
40
60
0
200
400
800
1600
10
10
10
10
10
0
0
1
3
5
0
0
10
30
50 aNumber of larvae used
bNumber of larvae died
cPer cent mortality
- 54 -
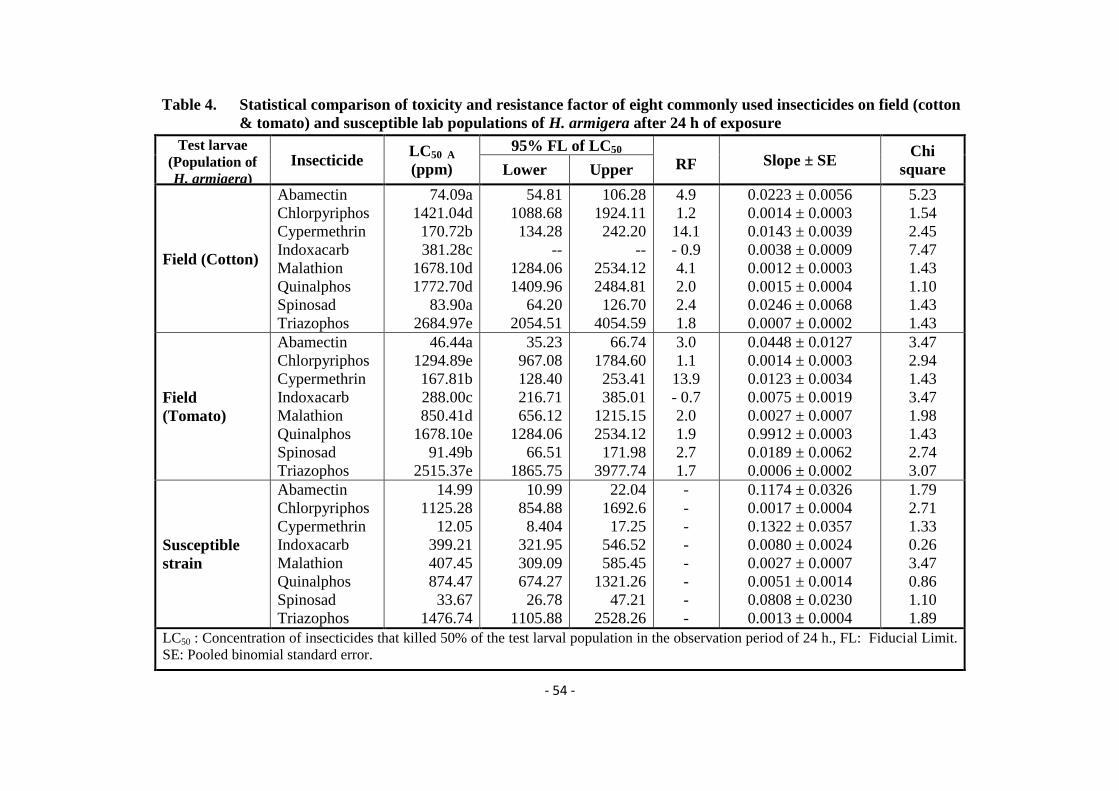
Table 4. Statistical comparison of toxicity and resistance factor of eight commonly used insecticides on field (cotton
& tomato) and susceptible lab populations of H. armigera after 24 h of exposure
Test larvae
(Population of
H. armigera)
Insecticide LC50 A
(ppm)
95% FL of LC50
RF Slope ± SE Chi
square Lower Upper
Field (Cotton)
Abamectin
Chlorpyriphos
Cypermethrin
Indoxacarb
Malathion
Quinalphos
Spinosad
Triazophos
74.09a
1421.04d
170.72b
381.28c
1678.10d
1772.70d
83.90a
2684.97e
54.81
1088.68
134.28
--
1284.06
1409.96
64.20
2054.51
106.28
1924.11
242.20
--
2534.12
2484.81
126.70
4054.59
4.9
1.2
14.1
- 0.9
4.1
2.0
2.4
1.8
0.0223 ± 0.0056
0.0014 ± 0.0003
0.0143 ± 0.0039
0.0038 ± 0.0009
0.0012 ± 0.0003
0.0015 ± 0.0004
0.0246 ± 0.0068
0.0007 ± 0.0002
5.23
1.54
2.45
7.47
1.43
1.10
1.43
1.43
Field
(Tomato)
Abamectin
Chlorpyriphos
Cypermethrin
Indoxacarb
Malathion
Quinalphos
Spinosad
Triazophos
46.44a
1294.89e
167.81b
288.00c
850.41d
1678.10e
91.49b
2515.37e
35.23
967.08
128.40
216.71
656.12
1284.06
66.51
1865.75
66.74
1784.60
253.41
385.01
1215.15
2534.12
171.98
3977.74
3.0
1.1
13.9
- 0.7
2.0
1.9
2.7
1.7
0.0448 ± 0.0127
0.0014 ± 0.0003
0.0123 ± 0.0034
0.0075 ± 0.0019
0.0027 ± 0.0007
0.9912 ± 0.0003
0.0189 ± 0.0062
0.0006 ± 0.0002
3.47
2.94
1.43
3.47
1.98
1.43
2.74
3.07
Susceptible
strain
Abamectin
Chlorpyriphos
Cypermethrin
Indoxacarb
Malathion
Quinalphos
Spinosad
Triazophos
14.99
1125.28
12.05
399.21
407.45
874.47
33.67
1476.74
10.99
854.88
8.404
321.95
309.09
674.27
26.78
1105.88
22.04
1692.6
17.25
546.52
585.45
1321.26
47.21
2528.26
-
-
-
-
-
-
-
-
0.1174 ± 0.0326
0.0017 ± 0.0004
0.1322 ± 0.0357
0.0080 ± 0.0024
0.0027 ± 0.0007
0.0051 ± 0.0014
0.0808 ± 0.0230
0.0013 ± 0.0004
1.79
2.71
1.33
0.26
3.47
0.86
1.10
1.89
LC50 : Concentration of insecticides that killed 50% of the test larval population in the observation period of 24 h., FL: Fiducial Limit.
SE: Pooled binomial standard error.

- 55 -
0
900
1800
2700
3600
4500
Aba
mec
tin
Chlor
pyriph
os
Cyp
ermethr
in
Indo
xaca
rb
Malathion
Qui
nalpho
s
Spinos
ad
Triaz
opho
s
Insecticides
LC
50 (
in p
pm
)
Cotton
Figure 1. LC50 values of third instar larvae of Helicoverpa armigera to
different insecticides (box showing mean value and bar showing
lower and upper fiducial values)
0
900
1800
2700
3600
4500
Aba
mec
tin
Chl
orpy
ripho
s
Cyp
erm
ethr
in
Indo
xaca
rb
Malathi
on
Qui
nalp
hos
Spin
osad
Triazo
phos
Insecticides
LC
50 (
in p
pm
)
Tomato
Figure 2. LC50 values of third instar larvae of Helicoverpa armigera to
different insecticides (box showing mean value and bar showing
lower and upper fiducial values)

- 56 -
Table 5. Toxicities of different insecticides on field (cotton and tomato) and
susceptible lab populations of H. armigera on cotton after 7 days of
exposure
Insecticide
Field (Cotton) Field (Tomato) Susceptible Lab
Dose
PPM n
a r
b M
c
Dose
PPM n
a r
b M
c
Dose
PPM n
a r
b M
c
Abamectin
0
14.25
28.5
57
114
10
10
10
10
10
1
4
9
10
10
10
40
90
100
100
0
14.25
28.5
57
114
10
10
10
10
10
1
5
10
10
10
10
50
100
100
100
0
4.75
9.50
19.0
38.0
10
10
10
10
10
0
6
10
10
10
0
60
100
100
100
Chlorpyriphos
0
300
600
1200
2400
10
10
10
10
10
0
8
10
10
10
0
80
100
100
100
0
300
600
1200
2400
10
10
10
10
10
1
7
10
10
10
10
70
100
100
100
0
175
350
700
1400
10
10
10
10
10
1
8
10
10
10
10
80
100
100
100
Cypermethrin
0
25
50
100
200
10
10
10
10
10
1
4
8
10
10
10
40
80
100
100
0
25
50
100
200
10
10
10
10
10
0
3
7
10
10
0
30
70
100
100
0
5
10
20
40
10
10
10
10
10
0
8
10
10
10
0
80
100
100
100
Indoxacarb
0
108.75
217.5
435
870
10
10
10
10
10
0
7
9
10
10
0
70
90
100
100
0
108.75
217.5
435
870
10
10
10
10
10
1
7
9
10
10
10
70
90
100
100
0
54.3
108.6
217.2
435
10
10
10
10
10
0
9
10
10
10
0
90
100
100
100
Malathion
0
250
500
1000
2000
10
10
10
10
10
1
5
9
10
10
10
50
90
100
100
0
250
500
1000
2000
10
10
10
10
10
1
4
8
10
10
10
40
80
100
100
0
125
250
500
1000
10
10
10
10
10
1
8
10
10
10
10
80
100
100
100
Quinalphos
0
250
500
1000
2000
10
10
10
10
10
1
3
6
10
10
10
30
60
100
100
0
250
500
1000
2000
10
10
10
10
10
1
2
7
10
10
10
20
70
100
100
0
125
250
500
1000
10
10
10
10
10
1
7
9
10
10
10
70
90
100
100
Spinosad
0
12.5
25
50
100
10
10
10
10
10
1
2
8
10
10
10
20
80
100
100
0
12.5
25
50
100
10
10
10
10
10
1
4
9
10
10
10
40
90
100
100
0
4.75
9.5
19.0
38.0
10
10
10
10
10
0
8
9
10
10
0
80
90
100
100
Triazophos
0
400
800
1600
3200
10
10
10
10
10
0
3
7
10
10
0
40
60
100
100
10
400
800
1600
3200
10
10
10
10
10
0
4
8
10
10
0
40
80
100
100
0
200
400
800
1600
10
10
10
10
10
0
8
9
10
10
0
80
90
100
100 aNumber of larvae used
bNumber of larvae died
cPer cent mortality

- 57 -
Table 6. Statistical comparison of toxicity and resistance factor of eight commonly used insecticides on field
(cotton & tomato) and susceptible lab populations of H. armigera after 7 days of exposure
Test larvae
(Population of
H. armigera)
Insecticide LC50 A
(ppm)
95% FL of LC50 Slope ± SE Chi square
Lower Upper
Field (Cotton)
Abamectin
Chlorpyriphos
Cypermethrin
Indoxacarb
Malathion
Quinalphos
Spinosad
Triazophos
15.58
243.39
30.39
102.46
249.96
296.99
17.67
613.17
8.55
--
16.59
50.17
120.58
178.94
11.46
421.91
23.27
--
46.54
146.84
378.78
437.61
26.38
878.86
0.090 ± 0.027
0.015 ± 0.022
0.043 ± 0.013
0.015 ± 0.004
0.005 ± 0.002
0.005 ± 0.002
0.092 ± 0.027
0.003 ± 0.001
0.211
0.002
0.019
2.562
0.001
0.831
1.241
0.477
Field (Tomato)
Abamectin
Chlorpyriphos
Cypermethrin
Indoxacarb
Malathion
Quinalphos
Spinosad
Triazophos
12.49
208.47
38.32
88.25
303.98
387.25
13.67
529.12
6.50
82.92
26.62
26.21
165.96
254.06
7.50
342.27
18.90
333.50
54.92
139.64
465.41
574.69
20.41
735.98
0.119 ± 0.035
0.006 ± 0.002
0.053 ± 0.017
0.012 ± 0.004
0.004 ± 0.001
0.004 ± 0.001
0.103 ± 0.030
0.001 ± 0.004
0.733
0.093
0.477
0.876
0.019
0.803
0.211
0.677
Susceptible strain
Abamectin
Chlorpyriphos
Cypermethrin
Indoxacarb
Malathion
Quinalphos
Spinosad
Triazophos
4.38
105.17
4.01
43.18
74.12
101.44
4.04
170.30
--
34.93
--
--
24.95
30.13
1.69
71.25
--
174.41
--
--
123.86
160.50
5.94
250.45
0.759 ± 0.855
0.012 ± 0.004
0.863 ± 1.080
0.115 ± 2.041
0.017 ± 0.005
0.010 ± 0.003
0.345 ± 0.098
0.008 ± 0.003
0.009
0.015
0.003
0.000
0.015
0.876
4.307
4.307
LC50 : Concentration of insecticides that killed 50% of the test larval population in the observation period of 7 days. FL -
Fiducial Limit. SE: Pooled binomial standard error.

- 58 -
Figure 3. Toxicities of abamectin, chlorpyriphos, cypermethrin and indoxacarb on lab adult populations of T. chilonis after
24 h of exposure

- 59 -
Figure 4. Toxicities of malathion, quinalphos, spinosad and triazophos on lab adult populations of T. chilonis after 24 h of
exposure

- 60 -
Figure 5. Toxicities of abamectin, chlorpyriphos, cypermethrin, indoxacarb, malathion, quinalphos, spinosad and triazophos
on field adult populations of T. chilonis from tomato crop after 24 h of exposure

- 61 -
Table 7. Statistical comparison of toxicity of eight commonly used insecticides on field (tomato) and susceptible
populations of T. chilonis after 4 h of exposure
Test
(Population of
adult T. chilonis
Insecticide
LC50
(ppm)
95% FL of LC50
RF Slope ± SE
Chi
square Lower Upper
Field (Tomato)
Abamectin
Chlorpyriphos
Cypermethrin
Indoxacarb
Malathion
Quinalphos
Spinosad
Triazophos
1.62
12.93
1.69
176.05
1.03
271.23
2.75
1.33
-
-
-
-
-
-
-
-
-
-
-
-
-
-
-
-
0.92
1.14
1.31
0.61
0.91
0.94
0.96
1.03
0.0708 ± 0.1481
0.0914 ± 0.0164
0.6050 ± 0.1428
0.0050 ± 0.0012
0.9386 ± 0.1567
0.5020 ± 0.0006
0.4564 ± 0.0758
0.7521 ± 0.1584
9.90
8.77
11.11
13.50
20.55
22.08
7.98
14.13
Susceptible strain
Abamectin
Chlorpyriphos
Cypermethrin
Indoxacarb
Malathion
Quinalphos
Spinosad
Triazophos
1.72
11.34
1.30
288.09
1.05
322.47
2.86
1.29
-
-
0.80
-
-
-
-
-
-
-
1.95
-
-
-
-
-
-
-
-
-
-
-
-
-
0.6454 ± 0.1442
0.0845 ± 0.0158
0.3719 ± 0.1414
0.0049 ± 0.0013
0.7309 ± 0.1345
0.0017 ± 0.0005
0.4522 ± 0.0825
0.7245 ± 0.1604
10.92
12.52
3.90
8.47
26.84
25.41
4.44
13.14
LC50 : Concentration of insecticide that killed 50% of the adult population in the observation period of 4 h. FL: Fiducial Limit.
SE: Pooled binomial standard error.

- 62 -
4.2 Isolation of gut bacterial flora from field and lab populations of H. armigera
and T. chilonis
4.2.1 Isolation of gut bacterial flora from the insecticide resistance larval
populations of H. armigera collected from tomato.
Gut bacteria was isolated from the gut of insecticide resistant fourth and fifth instar
larvae of H. armigera collected from the tomato fields of Malur, Karnataka, by following
standard microbiological procedures. Isolated colonies on nutrient agar plates from
different dilutions were isolated and sub cultured to obtain pure cultures. The plates of
isolated bacterial colonies have been shown in Plate 4. Eleven randomly isolated bacterial
colonies from the nutrient agar plates were sub cultured to obtain pure colonies and the
plates of eleven isolated bacterial colonies were coded as HT1, HT2, HT3, HT5, HT7,
HT9, HT10, HT12, HT13, HT14 and HT15 (Plate 5). Gram staining of the bacterial
isolates showed that isolates HT2, HT3, HT5, HT9, HT10, HT15 were Gram +ve cocci,
isolates HT1, HT7, HT12, HT13 were Gram –ve rods and isolate HT14 were gram +ve
rods.
4.2.2 Isolation of gut bacterial flora from the insecticide resistance larval
populations collected from cotton and susceptible lab populations of H.
armigera.
Gut bacteria was isolated from the gut of insecticide resistant fourth and fifth instar
larvae of H. armigera collected from the cotton fields of Vikarabad, Andhra Pradesh, by
following standard microbiological procedures. Isolated colonies on nutrient agar plates
from different dilutions were isolated and sub cultured to obtain pure cultures. The plates
of isolated bacterial colonies have been shown in Plate 6. Seven randomly isolated
bacterial colonies from the nutrient agar plates were sub cultured to obtain pure colonies
and the plates of seven isolated bacterial colonies were coded as CL1, CL2, CL3, CL4,

- 63 -
CL5, CL6 and CL7 (Plate 7 ). Gram staining of the bacterial isolates showed that isolates
CL1, CL3 were Gram +ve rods, isolates CL2, CL4, CL6 were Gram + ve cocci and
isolates CL5, CL7 were Gram –ve rods. Gut bacteria was isolated from the gut of
susceptible fourth and fifth instar larvae of H. armigera collected from mass production
unit of NBAII, Bangalore, by following standard microbiological procedures. Isolated
colonies on nutrient agar plates from different dilutions were isolated and sub cultured to
obtain pure cultures. The plates of isolated bacterial colonies have been shown in Plate 8.
Six randomly isolated bacterial colonies from the nutrient agar plates were sub cultured to
obtain pure colonies and the plates of seven isolated bacterial colonies were coded as HL1,
HL2, HL3, HL4, HL5 and HL6 (Plate 9). Gram staining of the bacterial isolates showed
that the isolates HL1, HL3, HL5, HL6 were Gram – ve rods and isolates HL2, HL4 were
Gram +ve rods.
4.2.3 Isolation of gut bacterial flora from the susceptible lab and field adult
populations of T. chilonis.
Gut bacteria was isolated from the gut of susceptible lab (obtained from the mass
production unit of NBAII) and field adult populations of T. chilonis collected from tomato
fields of Malur, Karnataka, by following standard microbiological procedures. Isolated
colonies on nutrient agar plates from different dilutions were isolated and sub cultured to
obtain pure cultures. The plates of isolated bacterial colonies have been shown in Plate 10.
Five randomly isolated bacterial colonies (two from susceptible lab and three from field
population) from the nutrient agar plates were sub cultured to obtain pure colonies and the
sub cultured plates were coded as TF1, TF2 and TF3 for field populations and TL1, TL2
for lab populations (Plate 11). Gram staining of the pure bacterial isolates showed that the
isolates TF1, TF3 were Gram –ve rods and isolate TF2 were Gram +ve rods and isolates
TL1, TL2 were Gram –ve rods.

- 64 -
Plate 4. Plate A-C- Bacterial colonies on nutrient agar isolated from
gut of insecticide resistant larvae of H. armigera collected
from tomato.

- 65 -
================================================================
Plate 5. Pure cultures of bacterial isolate from the gut of insecticides resistant H.
armigera larvae from tomato. Plate P1-P3, P5, P7, P9, P10, P12 – P15 –
Eleven isolates labeled as HT1 – HT15

- 66 -
Plate 6. Bacterial colonies on nutrient agar isolated from gut of
insecticide resistant H. armigera larvae from cotton.

- 67 -
Plate 7. Pure cultures of bacterial isolate from the gut of
insecticides resistant H. armigera larvae from cotton.
Plate P1 – P7 – Seven isolates labeled as CL1– CL7

- 68 -
Plate 8. Bacterial colonies on nutrient agar isolated from gut
of insecticide susceptible H. armigera larvae.

- 69 -
Plate 9. Pure cultures of bacterial isolate from the gut of
insecticide susceptible H. armigera larvae. Plate P1
– P6 – Six isolates labeled as HL1– HL6

- 70 -
A B
C
Plate 10. Bacterial colonies on nutrient agar isolated
from gut of T. chilonis. Plates A and B –
Field (tomato), Plate C – Lab Populations

- 71 -
Plate 11. Pure cultures of bacterial isolate from the gut of
susceptible lab and field populations of T. chilonis Plate
TF1 – TF3 – Field, Plate TL1 – TL2 – Susceptible lab

- 72 -
4.2.4 Isolation of DNA and 16s rRNA PCR amplification of gut bacteria of
insecticide resistant larvae of H. armigera on tomato and cotton
DNA was isolated from eleven bacterial isolates and the presence of genomic
DNA from all the 11 isolates was confirmed on 0.8% agarose gel stained with ethidium
bromide (Figure 6). An intense single band was seen in all the 11 wells along with the
DNA marker. The extracted DNA was used as template for amplification of 16S rRNA
gene. The primers selected were specific. Initial standardisation by many gradient PCR
has facilitated the specific amplification as observed by high intense band. The optimum
annealing temperature was found to be 58ºC. An intense single band of size
approximately 1.5 kb was visible on 1% agarose gel stained with ethidium bromide
(Figure. 7) in all the 11 wells. Similarly DNA was isolated from seven bacterial isolates
and the presence of genomic DNA from all the 7 isolates was confirmed on 0.8% agarose
gel stained with ethidium bromide (Figure 8). An intense single band was seen in all the 7
wells along with the DNA marker. The extracted DNA was used as template for
amplification of 16S rRNA gene. The primers selected were specific. The optimum
annealing temperature was found to be 58ºC. An intense single band of size approximately
1.5 kb was visible on 1% agarose gel stained with ethidium bromide (Figure. 9) in all the 7
wells.
4.2.5 Isolation of DNA and 16s rRNA PCR amplification of gut bacteria of
insecticide susceptible larvae of H. armigera.
DNA was isolated from six bacterial isolates and the presence of genomic DNA
from all the 6 isolates was confirmed on 0.8% agarose gel stained with ethidium bromide
(Figure 10). An intense single band was seen in all the 6 wells along with the DNA
marker. The extracted DNA was used as template for amplification of 16S rRNA gene..

- 73 -
The primers selected were specific. The optimum annealing temperature was found to be
58ºC. An intense single band of size approximately 1.5 kb was visible on 1% agarose gel
stained with ethidium bromide (Figure. 11) in all the 6 wells.
4.2.6 Isolation of DNA and 16s rRNA PCR amplification of gut bacteria of
laboratory and field (tomato) adult populations of T. chilonis
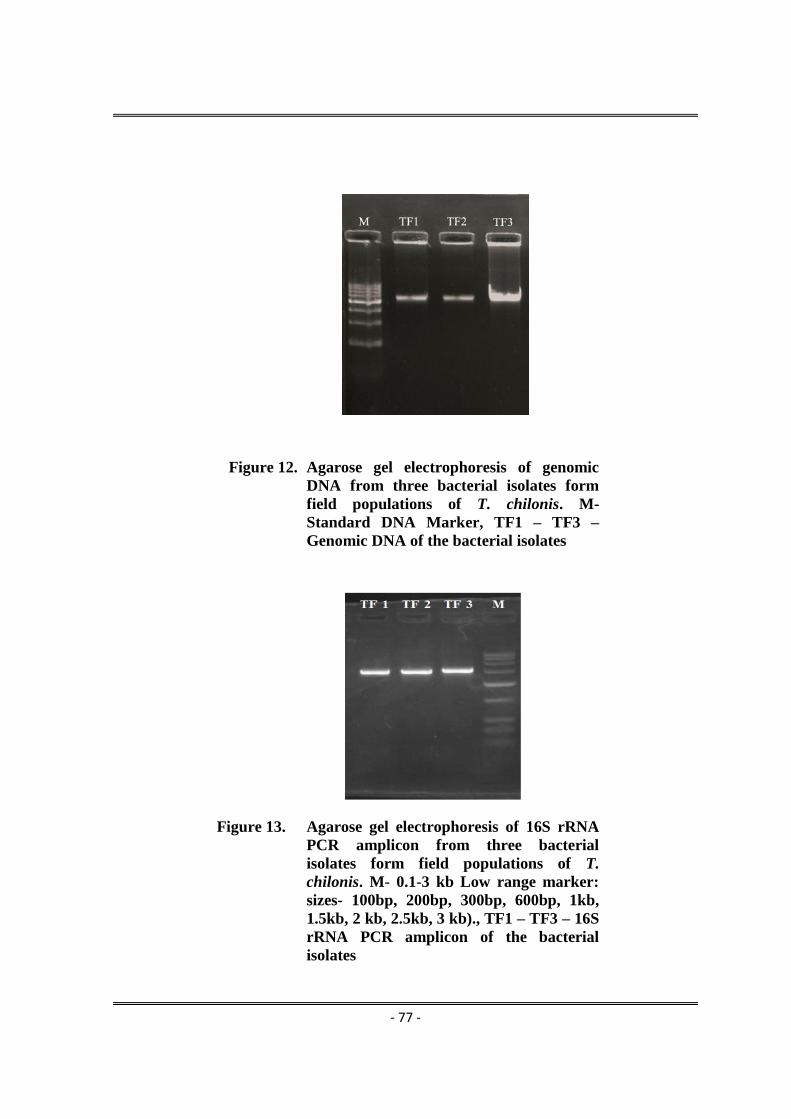
DNA was isolated from three bacterial isolates from field and two bacterial
isolates from laboratory adult populations of T. chilonis and the presence of genomic
DNA from all the bacterial isolates was confirmed on 0.8% agarose gel stained with
ethidium bromide (Figure 12 and 14). An intense single band was seen in all the wells
along with the DNA marker. The extracted DNA was used as template for amplification of
16S rRNA gene. The primers selected were specific. The optimum annealing temperature
was found to be 58ºC. An intense single band of size approximately 1.5 kb was visible on
1% agarose gel stained with ethidium bromide (Figure. 13 and 15) in all the wells
4.2.7 Sequencing and sequence analysis of PCR amplified 16S rRNA gene of the
eleven bacterial isolates from the gut of H. armigera from tomato crop.
The PCR amplified 16S rRNA gene from all the 11 isolates was gel eluted and was
partially sequenced using forward and reverse primers, at sequencing facility of Aristogene
Biosciences (P) Ltd., Bangalore, India. The partial sequence obtained from all the 11
isolates ranged from 852, 621, 616, 810, 681, 676, 840, 658, 706, 625, 834 bp respectively
in length and were analysed in BLASTn (www.ncbi.nlm.nih.gov) and the bacterial genera
and species were determined. The partial 16S rRNAs sequence and the determined
bacterial sp. along with the accession number (HL1-HL15) have been shown in Table 8.
The max identity of the sequence was 99-100%. The nucleotide sequences of 11 isolates
were submitted to NCBI-Gen Bank and the accession numbers were obtained. The
determined bacterial communities were found to be Stenotrophomonas sp. Enterococcus sp

- 74 -
Figure 6. Agarose gel electrophoresis of genomic DNA from
eleven bacterial isolates from the gut of H. armigera
from tomato crop. Lane M –Marker -
Lambda/HindIII digest (sizes-23130, 9416, 6557, 4361,
2322, 2027, 564). Lane 1 – 11 – Genomic DNA from
11 bacterial isolates
Figure 7. Agarose gel electrophoresis of 16S rRNA PCR
amplicon from eleven bacterial isolates form gut of H.
armigera from tomato crop. Lane M - Marker - 0.1-2 k
blow range marker, (sizes-100bp, 200bp, 300bp,
600bp. 1kb, 1.5kb, 2 kb). Lane 1 – 11 – 1.5 kb 16S
rRNA PCR amplicon from fifteen bacterial isolates. 1=HT1, 2=HT2, 3=HT3, 4=HT5, 5=HT7, 6=HT9, 7=HT10,
8=HT12, 9=HT13, 10=HT14, 11=HT15.

- 75 -
Figure 8. Agarose gel electrophoresis of genomic
DNA from seven bacterial isolates form
gut of H. armigera from cotton crop. M-
Standard DNA Marker, CL1 – CL7 –
Genomic DNA of the bacterial isolates
Figure 9. Agarose gel electrophoresis of 16S
rRNA PCR amplicon from seven
bacterial isolates form gut of H.
armigera from cotton crop. M- 0.1-3 kb
Low range marker: sizes- 100bp, 200bp,
300bp, 600bp, 1kb, 1.5kb, 2 kb, 2.5kb, 3
kb)., CL1 – CL7 – 16S rRNA PCR
amplicon of the bacterial isolates

- 76 -
Figure 10. Agarose gel electrophoresis of genomic DNA
from six bacterial isolates from the gut of
larvae of laboratory populations of H.
armigera. Lane M –Marker - Lambda/HindIII
digest (sizes-23130, 9416, 6557, 4361, 2322, 2027,
564). Lane 1 – 6 – Genomic DNA from 6 bacterial
isolates
Figure 11. Agarose gel electrophoresis of 16S rRNA PCR
amplicon from six bacteria isolates from gut of
the larvae of laboratory populations of H.
armigera. Lane M- Marker - 0.1-3 kb Low
range marker: sizes- 100bp, 200bp, 300bp,
600bp, 1kb, 1.5kb, 2 kb, 2.5kb, 3 kb)., Lane -
HL1 – HL6 – 16S rRNA PCR amplicon of the
bacterial isolates, 1=HL1, 2=HL2, 3=HL3,
4=HL4, 5=HL5, 6=HL6.
- 77 -
Figure 12. Agarose gel electrophoresis of genomic
DNA from three bacterial isolates form
field populations of T. chilonis. M-
Standard DNA Marker, TF1 – TF3 –
Genomic DNA of the bacterial isolates
Figure 13. Agarose gel electrophoresis of 16S rRNA
PCR amplicon from three bacterial
isolates form field populations of T.
chilonis. M- 0.1-3 kb Low range marker:
sizes- 100bp, 200bp, 300bp, 600bp, 1kb,
1.5kb, 2 kb, 2.5kb, 3 kb)., TF1 – TF3 – 16S
rRNA PCR amplicon of the bacterial
isolates

- 78 -
Figure 14. Agarose gel electrophoresis of genomic
DNA from two bacterial isolates form lab
populations of T. chilonis. M- Standard
DNA Marker, TL1 – TL2 – Genomic
DNA of the bacterial isolates
Figure 15: Agarose gel electrophoresis of 16S rRNA
PCR amplicon from two bacterial isolates
form lab populations of T. chilonis. M- 0.1-
3 kb Low range marker: sizes- 100bp,
200bp, 300bp, 600bp, 1kb, 1.5kb, 2 kb,
2.5kb, 3 kb)., TL1 – TL2 – 16S rRNA PCR
amplicon of the bacterial isolates

- 79 -
Table 8. Partial 16S rRNA sequence and identified bacterial species with GenBank
accession number of the eleven bacterial isolates from the gut of
insecticide resistance field larval populations of H. armigera collected
from tomato crop
Isolate Partial 16S rRNA gene sequence Size
(bp)
Identified
Bacteria by
BLASTn
GenBank
Accession
Number
HT1
AGTCGAACGGCAGCACAGTAAGAGCTTGCTCTTATGGGTGGCGAGTGGC
GGACGGGTGAGGAATACATCGGAATCTACCTTTTCGTGGGGGATAACGTA
GGGAAACTTACGCTAATACCGCATACGACCTTCGGGTGAAAGCAGGGGA
CCTTCGGGCCTTGCGCGGATAGATGAGCCGATGTCGGATTAGCTAGTTGG
CGGGGTAAAGGCCCACCAAGGCGACGATCCGTAGCTGGTCTGAGAGGAT
GATCAGCCACACTGGAACTGAGACACGGTCCAGACTCCTACGGGAGGCA
GCAGTGGGGAATATTGGACAATGGGCGCAAGCCTGATCCAGCCATACCG
CGTGGGTGAAGAAGGCCTTCGGGTTGTAAAGCCCTTTTGTTGGGAAAGAA
AAGCAGTCGATTAATACTCGGTTGTTCTGACGGTACCCAAAGAATAAGCA
CCGGCTAACTTCGTGCCAGCAGCCGCGGTAATACGAAGGGTGCAAGCGTT
ACTCGGAATTACTGGGCGTAAAGCGTGCGTAGGTGGTTGTTTAAGTCTGT
TGTGAAAGCCCTGGGCTCAACCTGGGAATTGCAGTGGATACTGGGCGACT
AGAGTGTGGTAGAGGGTAGTGGAATTCCCGGTGTAGCAGTGAAATGCGT
AGAGATCGGGAGGAACATCCATGGCGAAGGCAGCTACCTGGACCAACAC
TGACACTGAGGCACGAAAGCGTGGGGAGCAAACAGGATTAGATACCCTG
GTAGTCCACGCCCTAAACGATGCGAACTGGATGTTGGGTGCAATTTGGCA
CGCAGTATCGAAGCTAACGCGTTAAGTTCGCCGCCTGGGGAGTACGGTCG
CAAGACTGAA
852
Stenotrophomonas
sp.
HM446252
HT2
AACGGGTGAGTAACACGTGGGTAACCTGCCCATCAGAAGGGGATAACAC
TTGGAAACAGGTGCTAATACCGTATAACACTATTTTCCGCATGGAAGAAA
GTTGAAAGGCGCTTTTGCGTCACTGATGGATGGACCCGCGGTGCATTAGC
TAGTTGGTGAGGTAACGGCTCACCAAGGCAACGATGCATAGCCGACCTG
AGAGGGTGATCGGCCACACTGGGACTGAGACACGGCCCAGACTCCTACG
GGAGGCAGCAGTAGGGAATCTTCGGCAATGGACGAAAGTCTGACCGAGC
AACGCCGCGTGAGTGAAGAAGGTTTTCGGATCGTAAAACTCTGTTGTTAG
AGAAGAACAAGGATGAGAGTAAAATGTTCATCCCTTGACGGTATCTAAC
CAGAAAGCCACGGCTAACTACGTGCCAGCAGCCGCGGTAATACGTAGGT
GGCAAGCGTTGTCCGGATTTATTGGGCGTAAAGCGAGCGCAGGCGGTTTC
TTAAGTCTGATGTGAAAGCCCCCGGCTCAACCGGGGAGGGTCATTGGAA
ACTGGGAGACTTGAGTGCAGAAGAGGAGAGTGGAATTCCATGTGTAGCG
GTGAAATGCGTAGATATATGGAGGAACAC
621
Enterococcus sp.
HM446253
HT3
TGCAAGTCGAACGCTTTTTCTTTCACCGGAGCTTGCTCCACCGAAAGAAA
AAGAGTGGCGAACGGGTGAGTAACACGTGGGTAACCTGCCCATCAGAAG
GGGATAACACTTGGAAACAGGTGCTAATACCGTATAACACTATTTTCCGC
ATGGAAGAAAGTTGAAAGGCGCTTTTGCGTCACTGATGGATGGACCCGC
GGTGCATTAGCTAGTTGGTGAGGTAACGGCTCACCAAGGCAACGATGCAT
AGCCGACCTGAGAGGGTGATCGGCCACACTGGGACTGAGACACGGCCCA
GACTCCTACGGGAGGCAGCAGTAGGGAATCTTCGGCAATGGACGAAAGT
CTGACCGAGCAACGCCGCGTGAGTGAAGAAGGTTTTCGGATCGTAAAAC
TCTGTTGTTAGAGAAGAACAAGGATGAGAGTAAAATGTTCATCCCTTGAC
GGTATCTAACCAGAAAGCCACGGCTAACTACGTGCCAGCAGCCGCGGTA
ATACGTAGGTGGCAAGCGTTGTCCGGATTTATTGGGCGTAAAGCGAGCGC
AGGCGGTTTCTTAAGTCTGATGTGAAAGCCCCCGGCTCAACCGGGGAGG9
99999999999GTCATTGGAAACTGGGAGACTTG
616
Enterococcus sp.
HM446254
HT5
CCCTTAGAGTTTGATTCCTGGCTGAGGACGAACGCTGGCGGCGTGCCTAA
TACATGCAAGTCGAACGCTTTTTCTTTCACCGGAGCTTGCTCCACCGAAA
GAAAAAGAGTGGCGAACGGGTGAGTAACACGTGGGTAACCTGCCCATCA
GAAGGGGATAACACTTGGAAACAGGTGCTAATACCGTATAACACTATTTT
CCGCATGGAAGAAAGTTGAAAGGCGCTTTTGCGTCACTGATGGATGGACC
CGCGGTGCATTAGCTAGTTGGTGAGGTAACGGCTCACCAAGGCAACGAT
GCATAGCCGACCTGAGAGGGTGATCGGCCACACTGGGACTGAGACACGG
CCCAGACTCCTACGGGAGGCAGCAGTAGGGAATCTTCGGCAATGGACGA
AAGTCTGACCGAGCAACGCCGCGTGAGTGAAGAAGGTTTTCGGATCGTA
AAACTCTGTTGTTAGAGAAGAACAAGGATGAGAGTAAAACGTTCATCCCT
TGACGGTGTCTAACCAGAAAGCCACGGCTAACTACGTGCCAGCAGCCGC
GGTAATACGTAGGTGGCAAGCGTTGTCCGGATTTATTGGGCGTAAAGCGA
GCGCAGGCGGTTTCTTAAGTCTGATGTGAAAGCCCCCGGCTCAACCGGGG
AGGGTCATTGGAAACTGGGAGACTTGAGTGCAGAAGAGGAGAGTGGAAT
TCCATGTGTAGCGGTGAAATGCGTAGATATATGGAGGAACACCAGTGGC
GAAGGCGGCTCTCTGGTCTGTAACTGACGCTGAGGCTCGAAAGCGTGGG
GAGCGAACAGGATTAGATA
810
Enterococcus
gallinarum
HM446256
HT7
TCGAACGGACCCTTCGGGGTTAGTGGCGGACGGGTGAGTAACACGTGGG
AACGTGCCTTTAGGTTCGGAATAGCTCCTGGAAACGGGTGGTAATGCCGA
ATGTGCCCTTCGGGGGAAAGATTTATCGCCTTTAGAGCGGCCCGCGTCTG
ATTAGCTAGTTGGTGAGGTAACGGCTCACCAAGGCGACGATCAGTAGCTG
GTCTGAGAGGATGACCAGCCACACTGGGACTGAGACACGGCCCAGACTC
CTACGGGAGGCAGCAGTGGGGAATCTTGCGCAATGGGCGAGCCTGACGC
AGCCATGCCGCGTGAATGATGAAGGTCTTAGGATTGTAAAATTCTTTCAC
CGGGGACGATAATGACGGTACCCGGAGAAGAAGCCCCGGCTAACTTCGT
GCCAGCAGCCGCGGTAATACGAAGGGGGCTAGCGTTGCTCGGAATTACT
GGGCGTAAAGGGCGCGTAGGCGGATCGTTAAGTCAGAGGTGAAATCCCA
GGGCTCAACCCTGGAACTGCCTTTGATACTGGCGATCTTGAGTATGAGAG
AGGTATGTGGAACTCCGAGTGTAGAGGTGAAATTCGTAGATATTCGGAA
GAACACCAGTGGCGAAGGCGACATACTGGCTCATTACTGACGCTGAGGC
GCGAAAGCGTGGGGAGCAAACAGGATTAGATACCCTG
681
Bravundimonas
diminuta
HM446258
Table Continued…

- 80 -
TGCAAGTCGACGCTTTTTCTTTCACCGGAGCTTGCTCCACCGAAAGAAAA
AGAGTGGCGAACGGGTGAGTAACACGTGGGTACCTGCCCATCAGAAGGG
GATAACACTTGGAAACAGGTGCTAATACCGTATAACACTATTTTCCGCAT
GGAAGAAAGTTGAAAGGCGCTTTTGCGTCACTGATGGATGGACCCGCGG
TGCATTAGCTAGTTGGTGAGGTAACGGCTCACCAAGGCAACGATGCATAG
CCGACCTGAGAGGGTGATCGGCCACACTGGGACTGAGACACGGCCCAGA
CTCCTACGGGAGGCAGCAGTAGGGAATCTTCGGCAATGGACGAAAGTCT
GACCGAGCAACGCCGCGTGAGTGAAGAAGGTTTTCGGATCGTAAAACTC
TGTTGTTAGAGAAGAACAAGGATGAGAGTAAAATGTTCATCCCTTGACGG
TATCTAACCAGAAAGCCACGGCTAACTACGTGCCAGCAGCCGCGGTAAT
ACGTAGGTGGCAAGCGTTGTCCGGATTTATTGGGCGTAAAGCGAGCGCA
GGCGGTTTCTTAAGTCTGATGTGAAAGCCCCCGGCTCAACCGGGGAGGGT
CATTGGAAACTGGGAGACTTGAGTGCAGAAGAGGAGAGTGGAATTCCAT
GTGTAGCGGTGAAATGCGTAGATATATGGAGGAA
676
Enterococcus
faecium
HM446260
HT10
AGAGTTTGATCCTGGCTCAGGATGAACGCTGGCGGCGTGCCTAATACATG
CAAGTCGAGCGAACAGACGAGGAGCTTGCTCCTCTGACGTTAGCGGCGG
ACGGGTGAGTAACACGTGGATAACCTACCTATAAGACTGGGATAACTTCG
GGAAACCGGAGCTAATACCGGATAATATATTGAACCGCATGGTTCAATA
GTGAAAGACGGTTTTGCTGTCACTTATAGATGGATCCGCGCCGCATTAGC
TAGTTGGTAAGGTAACGGCTTACCAAGGCAACGATGCGTAGCCGACCTG
AGAGGGTGATCGGCCACACTGGAACTGAGACACGGTCCAGACTCCTACG
GGAGGCAGCAGTAGGGAATCTTCCGCAATGGGCGAAAGCCTGACGGAGC
AACGCCGCGTGAGTGATGAAGGTCTTCGGATCGTAAAACTCTGTTATTAG
GGAAGAACAAATGTGTAAGTAGCTATGCACGTCTTGACGGTACCTAATCA
GAAAGCCACGGCTAACTACGTGCCAGCAGCCGCGGTAATACGTAGGTGG
CAAGCGTTATCCGGAATTATTGGGCGTAAGGCGCGCGTAGGCGGTTTTTT
AAGTCTGATGTGAAAGCCCACGGCTCAACCGTGGAGGGTCATTGGAAAC
TGGAAAACTTGAGTGCAGAAGAGGAAAGTGGAATTCCATGTGTAGCGGT
GAAATGCGCAGAGATATGGAGGAACACCAGTGGCGAAGGCGACTTTCTG
GTCTGTAACTGACGCTGATGTGCGAAAGCGTGGGGATCAAACAGGATTA
GATACCCTGGTAGTCCACGCCGTAAACGATGAGTGCTAAGTGTTAGGGGG
840
Staphylococcus
sp.
HM446261
HT12
TGCAAGTCGAGCGGATGAAGGGAGCTTGCTCCTGGATTCAGCGGCGGAC
GGGTGAGTAATGCCTAGGAATCTGCCTGGTAGTGGGGGATAACGTCCGG
AAACGGGCGCTAATACCGCATACGTCCTGAGGGAGAAAGTGGGGGATCT
TCGGACCTCACGCTATCAGATGAGCCTAGGTCGGATTAGCTAGTTGGTGG
GGTAAAGGCCTACCAAGGCGACGATCCGTAACTGGTCTGAGAGGATGAT
CAGTCACACTGGAACTGAGACACGGTCCAGACTCCTACGGGAGGCAGCA
GTGGGGAATATTGGACAATGGGCGAAAGCCTGATCCAGCCATGCCGCGT
GTGTGAAGAAGGTCTTCGGATTGTAAAGCACTTTAAGTTGGGAGGAAGG
GCAGTAAGTTAATACCTTGCTGTTTTGACGTTACCAACAGAATAAGCACC
GGCTAACTTCGTGCCAGCAGCCGCGGTAATACGAAGGGTGCAAGCGTTA
ATCGGAATTACTGGGCGTAAAGCGCGCGTAGGTGGTTCAGCAAGTTGGAT
GTGAAATCCCCGGGCTCAACCTGGGAACTGCATCCAAAACTACTGAGCTA
GAGTACGGTAGAGGGTGGTGGAATTTCCTGTGTAGCGGTGAAATGCGTA
GATATAGGAAGGAACAC
658
Pseudomonas
aeruginosa
HM446263
HT13
GTCCTCCTTGCGGTTAGACTACCTACTTCTGGTGCAACAAACTCCCATGGT
GTGACGGGCGGTGTGTACAAGGCCCGGGAACGTATTCACCGCGGCATTCT
GATCCGCGATTACTAGCGATTCCGACTTCATGGAGTCGAGTTGCAGACTC
CAATCCGGACTACGATCGGCTTTTTGAGATTAGCATCCTATCGCTAGGTA
GCAACCCTTTGTACCGACCATTGTAGCACGTGTGTAGCCCTGGCCGTAAG
GGCCATGATGACTTGACGTCGTCCCCGCCTTCCTCCAGTTTGTCACTGGCA
GTATCCTTAAAGTTCCCGACATTACTCGCTGGCAAATAAGGAAAAGGGTT
GCGCTCGTTGCGGGACTTAACCCAACATCTCACGACACGAGCTGACGACA
GCCATGCAGCACCTGTATGTAAGTTCCCGAAGGCACCAATCCATCTCTGG
AAAGTTCTTACTATGTCAAGGCCAGGTAAGGTTCTTCGCGTTGCATCGAA
TTAAACCACATGCTCCACCGCTTGTGCGGGCCCCCGTCAATTCATTTGAGT
TTTAGTCTTGCGACCGTACTCCCCAGGCGGTCTACTTATCGCGTTAGCTGC
GCCACTAAAGCCTCAAAGGCCCCAACGGCTAGTAGACATCGTTTACGGCA
TGGACTACCAGGGTATCTAATCCTGTTTGCTCCCCATGCTTTCGCACCTCA
G
706
Acinetobacter
calcoaceticus
HM446264
HT14
GGCTGGCTCCTAAAAGGTTACCTCACCGACTTCGGGTGTTACAAACTCTC
GTGGTGTGACGGGCGGTGTGTACAAGGCCCGGGAACGTATTCACCGCGG
CATGCTGATCCGCGATTACTAGCGATTCCAGCTTCACGCAGTCGAGTTGC
AGACTGCGATCCGAACTGAGAACAGATTTGTGGGATTGGCTTAACCTCGC
GGTTTCGCTGCCCTTTGTTCTGCCCATTGTAGCACGTGTGTAGCCCAGGTC
ATAAGGGGCATGATGATTTGACGTCATCCCCACCTTCCTCCGGTTTGTCAC
CGGCAGTCACCTTAGAGTGCCCAACTGAATGCTGGCAACTAAGATCAAG
GGTTGCGCTCGTTGCGGGACTTAACCCAACATCTCACGACACGAGCTGAC
GACAACCATGCACCACCTGTCACTCTGCCCCCGAAGGGGACGTCCTATCT
CTAGGATTGTCAGAGGATGTCAAGACCTGGTAAGGTTCTTCGCGTTGCTT
CGAATTAAACCACATGCTCCACCGCTTGTGCGGGCCCCCGTCAATTCCTTT
GAGTTTCAGTCTTGCGACCGTACTCCCCAGGCGGAGTGCTTAATGCGTTA
GCTGCAGCACTAAGGGGCGGAAAC
625
Bacillu subtilis
HM446265
HT15
GGGGTTAGGCCACCGGCTTCGGGTGTTACCGACTTTCATGACGTGACGGG
CGGTGTGTACAAGGCCCGGGAACGTATTCACCGCAGCGTTGCTGATCTGC
GATTACTAGCGACTCCGACTTCACGGGGTCGAGTTGCAGACCCCGATCCG
AACTGAGACCGGCTTTAAGGGATTCGCTCCACCTCACGGTATCGCAGCCC
TCTGTACCGACCATTGTAGCATGTGTGAAGCCCTGGACATAAGGGGCATG
ATGACTTGACGTCGTCCCCACCTTCCTCCGAGTTGACCCCGGCAGTCTCCT
GCGAGTCCCCACCATCACGTGCTGGCAACACAGGACAAGGGTTGCGCTC
GTTGCGGGACTTAACCCAACATCTCACGACACGAGCTGACGACAGCCATG
CACCACCTGTCTACCGGCCACAAGGGAAACCACATCTCTGCAGTCGTCCG
GTACATGTCAAACCCAGGTAAGGTTCTTCGCGTTGCATCGAATTAATCCA
CATGCTCCGCCGCTTGTGCGGGCCCCCGTCAATTCCTTTGAGTTTTAGCCT
TGCGGCCGTACTCCCCAGGCGGGGCGCTTAATGCGTTGGCTACGGCACGG
ATCCCGTGGAAGGAAACCCACACCTAGCGCCCACCGTTTACGGCGTGGAC
TACCAGGGTATCTAATCCTGTTCGCTACCCACGCTTTCGCTCCTCAGCGTC
AGTTACTGCCCAGAGACCCGCCTTCGCCACCGGTGTTCCTCCTGATATCTG
CGCATTTCACCGCTACACCAGGAATTCCAGTCTCCCCTGCAGTACTCGAG
TCTGCCCGTATCGCCTGCAAGCCCGCAGTTG
834
Rhodococcus sp.
HM446266

- 81 -
Enterococcus sp., Enterococcus gallinarum, Bravundimonas diminuta, Enterococcus
faecium, Staphylococcus sp., Pseudomonas aeruginosa, Acinetobacter calcoaceticus,
Bacillus subtilis and Rhodococcus sp., of which genera Enterococcus were found to be
predominant.
4.2.8 Sequencing and sequence analysis of PCR amplified 16S rRNA gene of the
seven bacterial isolates from the gut of H. armigera from cotton ecosystem.
The PCR amplified 16S rRNA gene from all the 7 isolates was gel eluted and was
partially sequenced using forward and reverse primers, at sequencing facility of
Aristogene Biosciences (P) Ltd., Bangalore, India. The partial sequence obtained from all
the 7 isolates ranged from 677, 660, 478, 459, 642, 514. 559 bp respectively in length and
were analysed in BLASTn (www.ncbi.nlm.nih.gov) and the bacterial genera and species
were determined. The partial 16S rRNAs sequence and the determined bacterial sp. along
with the accession number (CL1-CL7) have been shown in Table 9. The max identity of
the sequence was 99-100%. The nucleotide sequences of 7 isolates were submitted to
NCBI-Gen Bank and the accession numbers were obtaind. The determined bacterial
communities were found to be Bacillus pumulis, Enterococcus casseliflavus, Bacillus
subtilis, Rhodococcus sp., Pseudomonas sp., Staphylococcus sp., Pseudomonas
aeruginosa.
4.2.9 Sequencing and sequence analysis of PCR amplified 16S rRNA gene of the six
bacterial isolates from the gut of H. armigera from laboratory populations.
The PCR amplified 16S rRNA gene from all the 6 isolates was gel eluted and was
partially sequenced using forward and reverse primers, at sequencing facility of
Aristogene Biosciences (P) Ltd., Bangalore, India. The partial sequence obtained from all
the 6 isolates ranged from 664, 861, 779, 623, 541, 693 bp, respectively. in length and
were analysed in BLASTn (www.ncbi.nlm.nih.gov) and the bacterial genera and species
- 82 -
were determined. The partial 16S rRNAs sequence and the determined bacterial sp. along
with the accession number (HL1-HL6) have been shown in Table 10. The max identity of
the sequence was 99-100%. The nucleotide sequences of 6 isolates were submitted to
NCBI-Gen Bank and the accession numbers were obtained. The determined bacterial
communities were found to be Proteus vulgaris, Cellulosimicrobium cellulans Klebsiella
oxytoca, Bacillus subtilis, Stenotrophomonas maltophilia, Pseudomonas sp.
4.2.10 Sequencing and sequence analysis of PCR amplified 16S rRNA gene of the
three bacterial isolates from the gut of field populations of T. chilonis and two
bacterial isolates from the gut of laboratory populations of T. chilonis
The PCR amplified 16S rRNA gene from 3 bacterial isolates from field
populations and 2 bacterial isolates from the lab populations of T. chilonis was gel eluted
and was partially sequenced using forward and reverses primers, at sequencing facility of
Aristogene Biosciences (P) Ltd., Bangalore, India. The partial sequence obtained ranged
from 641, 808, 720 bp respectively in length in case of field populations and 675 and 747
bp respectively in case of laboratory populations and all the isolates were analysed in
BLASTn (www.ncbi.nlm.nih.gov) and the bacterial genera and species were determined.
The partial 16S rRNAs sequence and the determined bacterial sp. along with the accession
number (TF1-TF3 and TL1 – TL2) has been shown in Table 11. The max identity of the
sequence was 99-100%. The nucleotide sequences of 5 isolates were submitted to NCBI-
GenBank and the accession numbers were obtained. The determined bacterial
communities were found to be Stenotrophomonas maltophilia, Bacillus sp., Pseudomonas
sp., respectively in case of field populations and Pseudomonas sp., and Stenotrophomonas
sp., in case of laboratory populations of T. chilonis.

- 83 -
Table 9. Partial 16S rRNA sequence and identified bacterial species with GenBank
accession number of the seven bacterial isolates from the gut of insecticide
resistance field larval populations of H. armigera collected from cotton
crop.
Isolate Partial 16S rRNA gene sequence Size
(bp)
Identified
Bacteria By
BLASTn
GenBank
Accession
Number
CL1
GTGCATTGCGGGTGCTATACATGCAAGTCGAGCGGACAGAAGGGAGCTT
GCTCCCGGGTGTTAGCGGCGGACGGGTGAGTAACACGTGGGTAACCTGC
CTGTAAGACTGGGATAACTCCGGGAAACCGGAGCTAATACCGGATAGTT
CCTTGAACCGCATGGTTCAAGGATGAAAGACGGTTTCGGCTGTCACTTAC
AGATGGACCCGCGGCGCATTAGCTAGTTGGTGAGGTAACGGCTCACCAA
GGCGACGATGCGTAGCCGACCTGAGAGGGTGATCGGCCACACTGGGACT
GAGACACGGCCCAGACTCCTACGGGAGGCAGCAGTAGGGAATCTTCCGC
AATGGACGAAAGTCTGACGGAGCAACGCCGCGTGAGTGATGAAGGTTTT
CGGATCGTAAAGCTCTGTTGTTAGGGAAGAACAAGTGCAAGAGTAGCTG
CTTGCACCTTGACGGTACCTAACCAGAAAGCCACGGCTAACTACGTGCCA
GCAGCCGCGGTAATACGTAGGTGGCAAGCGTTGTCCGGAATTATTGGGCG
TAAAGGGCTCGCAGGCGGTTTCTTAAGTCTGATGTGAAAGCCCCCGGCTC
AACCGGGGAGGGTCATTGGAAACTGGAAACTTGATTGCAGAAGAGGAGA
GTGTAATTCCACGTGTAGCGGTGAAATGCGAAAAAA
677
Bacillus pumulis
HQ651050
CL2
GATTATGGCTCAGGACGAACGCTGGCGGCGTGCGTAATACATGCAAGTC
GAACGCTTTTTCTTTCACCGGAGCNTGCTCCANCGNAAGAAAAAGAGTGG
CGAACGGGTGAGTAACACGTGGGTAACCTGCCCATCAGAAGGGGATAAC
ACTTGGAAACAGGTGCTAATACCGTATAACACTATTTTCCGCATGGAAGA
AAGTTGAAAGGCGCTTTTGCGTCACTGATGGATGGACCCGCGGTGCATTA
GCTAGTTGGTGAGGTAACGGCTCACCAAGGCAACGATGCATAGCCGACC
TGAGAGGGTGATCGGCCACACTGGGACTGAGACACGGCCCAGACTCCTA
CGGGAGGCAGCAGTAGGGAATCTTCGGCAATGGACGAAAGTCTGACCGA
GCAACGCCGCGTGAGTGAAGAAGGTTTTCGGATCGTAAAACTCTGTTGTT
AGAGAAGAACAAGGATGAGAGTAAAATGTTCATCCCTTGACGGTATCTA
ACCAGAAAGCCACGGCTAACTACGTGCCAGCAGCCGCGGTAATACGTAG
GTGGCAAGCGTTGTCCGGATTTATTGGGCGTAAAGCGAGCGCAGGCGGT
ATCTTAAGTCTGATGTGAAAGCCCCCGGCTCAACCGGGGAGGGTCATTGG
AAACTGGGAGACTTGAGT
660
Enterococcus
casseliflavus
HQ651051
CL3
TGCAGTCGAGCGGACAGATGGGAGCTTGCTCCCTGATGTTAGCGGCGGAC
GGGTGAGTAACACGTGGGTAACCTGCCTGTAAGACTGGGATAACTCCGG
GAAACCGGGGCTAATACCGGATGGTTGTTTGAACCGCATGGTTCAAACAT
AAAAGGTGGCTTCGGCTACCACTTACAGATGGACCCGCGGCGCATTAGCT
AGTTGGTGAGGTAACGGCTCACCAAGGCAACGATGCGTAGCCGACCTGA
GAGGGTGATCGGCCACACTGGGACTGAGACACGGCCCAGACTCCTACGG
GAGGCAGCAGTAGGGAATCTTCCGCAATGGACGAAAGTCTGACGGAGCA
ACGCCGCGTGAGTGATGAAGGTTTTCGGATCGTAAAGCTCTGTTGTTAGG
GAAGAACAAGTACCGTTCGAATAGGGCGGTACCTTGACGGTACCTAACC
AGAAAGCCACGGCTAACTACGTGCCAGCAGCCG
478 Bacillus subtilis JF266592
CL4
CCCGAAATTGGCGGGTGCTTACACATGCAGTCGAACGATGAAGCCCAGCT
TGCTGGGTGGATTAGTGGCGAACGGGTGAGTAACACGTGGGTGATCTGCC
CTGCACTCTGGGATAAGCCTGGGAAACTGGGTCTAATACCGGATATGACC
TCGGGATGCATGTCCTGGGGTGGAAAGTTTTTCGGTGCAGGATGAGCCCG
CGGCCTATCAGCTTGTTGGTGGGGTAATGGCCTACCAAGGCGACGACGGG
TAGCCGGCCTGAGAGGGCGACCGGCCACACTGGGACTGAGACACGGCCC
AGACTCCTACGGGAGGCAGCAGTGGGGAATATTGCACAATGGGCGCAAG
CCTGATGCAGCGACTCCGCGTGAGGGATGACGGCCTTCTGGTTGTAAACC
TCTTTCCCCCCTGACCAAACGCAAGTGACGGTAGTCGGAAAAAAAGCCCG
GCCCTCTACCT
459 Rhodococcus sp. HQ651052
CL5
GGGCCCGTGGGGGAGGACTACACATGCAAGTCGAGCGGATGAAGGGAGC
TTGCTCCTGGATTCAGCGGCGGACGGGTGAGTAATGCCTAGGAATCTGCC
TGGTAGTGGGGGATAACGTCCGGAAACGGGCGCTAATACCGCATACGTC
CTGAGGGAGAAAGTGGGGGATCTTCGGACCTCACGCTATCAGATGAGCC
TAGGTCGGATTAGCTAGTTGGTGGGGTAAAGGCCTACCAAGGCGACGAT
CCGTAACTGGTCTGAGAGGATGATCAGTCACACTGGAACTGAGACACGG
TCCAGACTCCTACGGGAGGCAGCAGTGGGGAATATTGGACAATGGGCGA
AAGCCTGATCCAGCCATGCCGCGTGTGTGAAGAAGGTCTTCGGATTGTAA
AGCACTTTAAGTTGGGAGGAAGGGCAGTAAGTTAATACCTTGCTGTTTTG
ACGTTACCAACAGAATAAGCACCGGCTAACTTCGTGCCAGCAGCCGCGGT
AATACGAAGGGTGCAAGCGTTAATCGGAATTACTGGGCGTAAAGCGCGC
GTAGGTGGTTCAGCAAGTTGGATGTGAAATCCCCGGGCTCAACCTGGGAA
CTGCATCCCAAAACTACTGAGCTAGAGTACGGTAGAGGGTGGTGGAAAT
642 Pseudomonas sp. HQ651053
CL6
GTCTGCGGCATGCTATACATGCAGTCGAGCGAACAGACGAGGAGCTTGCT
CCTTTGACGTTAGCGGCGGACGGGTGAGTAACACGTAGGTAACCTACCTA
TAAGACTGGGATAACTTCGGGAAACCGGAGCTAATACCGGATAATATTTC
GAACCGCATGGTTCGATAGTGAAAGATGGCTTTGCTATCACTTATAGATG
GACCTGCGCCGTATTAGCTAGTTGGTAAGGTAACGGCTTACCAAGGCAAC
GATACGTAGCCGACCTGAGAGGGTGATCGGCCACACTGGAACTGAGACA
CGGTCCAGACTCCTACGGGAGGCAGCAGTAGGGAATCTTCCGCAATGGG
CGAAAGCCTGACGGAGCAACGCCGCGTGAGTGATGAAGGTCTTCGGATC
GTAAAACTCTGTTATTAGGGAAGAACAAACGTGTAAGTAACTGTGCACGT
CTTGACGGTACCTAATCAGAAAGCCACGGCTAACTACGTGCCAGCAGCCG
CGGTAATACGTAGGTGG
514 Staplylococcus sp. HQ651054
Table Continued…

- 84 -
CL7
CTGTTCTGTCGGCAGCTAGACATGCAAGTCGAGCGGATGAAGGGAG
CTTGCTCCTGGATTCAGCGGCGGACGGGTGAGTAATGCCTAGGAAT
CTGCCTGGTAGTGGGGGATAACGTCCGGAAACGGGCGCTAATACCG
CATACGTCCTGAGGGAGAAAGTGGGGGATCTTCGGACCTCACGCTA
TCAGATGAGCCTAGGTCGGATTAGCTAGTTGGTGGGGTAAAGGCCT
ACCAAGGCGACGATCCGTAACTGGTCTGAGAGGATGATCAGTCACA
CTGGAACTGAGACACGGTCCAGACTCCTACGGGAGGCAGCAGTGG
GGAATATTGGACAATGGGCGAAGCCTTGATCCAGCCATGCCGCGTG
TGTGAAGAAGTCTTCGGATTGTAAACACTTTAAGTTGGGAGAAGGC
AGAAGTTAATACCTTGGTTGTTTTGACGTACCACAGAATAAGCACC
GGCTACTTCTGCCGCAGCCGCGTATACCAAGGTGCAGCGTAATTCG
AATTACTGGCGTAAGCGCGCGAAGGGTTCACAGGTGGAAGGGAAT
CCCCGGCTC
559 Pseudomonas
auerogenosa HQ651055

- 85 -
Table 10. Partial 16S rRNA sequence and identified bacterial species with GenBank
accession number of the six bacterial isolates from the gut of susceptible
laboratory larval populations of H. armigera.
Isolate Partial 16S rRNA gene sequence Size
(bp)
Identified
Bacteria By
BLASTn
GenBank
Accession
Number
HL1
CATGCAGTCGAGCGGTAACAGGAGAAAGCTTGCTTTCTTGCTGACGAGCG
GCGGACGGGTGAGTAATGTATGGGGATCTGCCCGATAGAGGGGGATAAC
TACTGGAAACGGTGGCTAATACCGCATGACGTCTACGGACCAAAGCAGG
GGCTCTTCGGACCTTGCGCTATCGGATGAACCCATATGGGATTAGCTAGT
AGGTGAGGTAATGGCTCACCTAGGCAACGATCTCTAGCTGGTCTGAGAGG
ATGATCAGCCACACTGGGACTGAGACACGGCCCAGACTCCTACGGGAGG
CAGCAGTGGGGAATATTGCACAATGGGCGCAAGCCTGATGCAGCCATGC
CGCGTGTATGAAGAAGGCCTTAGGGTTGTAAAGTACTTTCAGCGGGGAG
GAAGGTGATAAAGTTAATACCTTTGTCAATTGACGTTACCCGCAGAAGAA
GCACCGGCTAACTCCGTGCCAGCAGCCGCGGTAATACGGAGGGTGCAAG
CGTTAATCGGAATTACTGGGCGTAAAGCGCACGCAGGCGGTCAATTAAGT
CAGATGTGAAAGCCCCGAGCTTAACTTGGGAATTGCATCTGAAACTGGTT
GGCTAGAGTCTTGTAGAGGGGGGTAGAATTCCACGTGTAGCGGTGAAAT
GCGTAGAGATGTGAGGAATAC
664
Proteus vulgaris
JF266593
HL2
CATGCAGTCGAACGATGATGCCCAGCTTGCTGGGCGGATTAGTGGCGAAC
GGGTGAGTAACACGTGAGTAACCTGCCCTTGACTTCGGGATAACTCCGGG
AAACCGGGGCTAATACCGGATATGAGCCGCCTTCGCATGGGGGTGGTTG
GAAAGTTTTTCGGTCAGGGATGGGCTCGCGGCCTATCAGCTTGTTGGTGG
GGTGATGGCCTACCAAGGCGACGACGGGTAGCCGGCCTGAGAGGGCGAC
CGGCCACACTGGGACTGAGACACGGCCCAGACTCCTACGGGAGGCAGCA
GTGGGGAATATTGCACAATGGGCGAAAGCCTGATGCAGCGACGCCGCGT
GAGGGATGAAGGCCTTCGGGTTGTAAACCTCTTTCAGCAGGGAAGAAGC
GCAAGTGACGGTACCTGCAGAAGAAGCGCCGGCTAACTACGTGCCAGCA
GCCGCGGTAATACGTAGGGCGCAAGCGTTGTCCGGAATTATTGGGCGTAA
AGAGCTCGTAGGCGGTTTGTCGCGTCTGGTGTGAAAACTCGAGGCTCAAC
CTCGAGCTTGCATCGGGTACGGGCAGACTAGAGTGCGGTAGGGGAGACT
GGATTTCCTGGTGTAGCGGTGGAATGCGCAGATATCAGGAGGAACACCG
ATGGCGAAGGCAGGTCTCTGGGCCGCAACTGACGCTGAGGAGCGAAAGC
ATGGGGAGCGAACAGGATTAGATACCCTGGTTAGTCCATGCCGTAAACGT
TTGGCACTAGGTGTGGGGGC
861
Cellulosimicrobiu
m cellulans
JF266594
HL3
ACGCTGGCGGCAGGCCCTAACACATGCAAGTCGAACGGTGAGCACARAA
GAGCTTGCTCTCGGGTGACGAGTGGCGGACGGGTGAGTAATGTCTGGGA
AACTGCCTGATGGAGGGGGATAACTACTGGAAACGGTAGCTAATACCGC
ATAACGTCGCAAGACCAAAGAGGGGGACCTTCGGGCCTCTTGCCATCAG
ATGTGCCCAGATGGGATTAGCTAGTAGGTGGGGTAACGGCTCACCTAGGC
GACGATCCCTAGCTGGTCTGAGAGGATGACCAGCCACACTGGAACTGAG
ACACGGTCCAGACTCCTACGGGAGGCAGCAGTGGGGAATATTGCACAAT
GGGCGCAAGCCTGATGCAGCCATGCCGCGTGTATGAAGAAGGCCTTCGG
GTTGTAAAGTACTTTCAGCGGGGAGGAAGGCGATAAGGTTAATAACCTTG
TCGATTGACGTTACCCGCAGAAGAAGCACCGGCTAACTCCGTGCCAGCAG
CCGCGGTAATACGGAGGGTGCAAGCGTAATCGGAATTACTGGGCGTAAA
GCGCACGCAGGCGGTCTGTCAAGTCGGATGTGAAATCCCCGGGCTCAACC
TGGGAACTGCATTCGAAACTGGCAGGCTGGAGTCTTGTAGAGGGGGGTA
GAATTCCAGGTGTAGCGGTGAAATGCGTAGAGATCTGGAGGAATACCGG
TGGCGAAGGCGGCCCCCTGGACAAAGACTGACGCTCAGGTGCGAAAGCG
TGGGGAGCAAACAGGATTAGATACCCTGGTAGTCCACGCT
779
Klebsiella oxytoca
JF266595
HL4
TACATGCAGTCGAGCGGACAGATGGGAGCTTGCTCCCTGATGTTAGCGGC
GGACGGGTGAGTAACACGTGGGTAACCTGCCTGTAAGACTGGGATAACT
CCGGGAAACCGGGGCTAATACCGGATGGTTGTTTGAACCGCATGGTTCAA
ACATAAAAGGTGGCTTCGGCTACCACTTACAGATGGACCCGCGGCGCATT
AGCTAGTTGGTGAGGTAACGGCTCACCAAGGCAACGATGCGTAGCCGAC
CTGAGAGGGTGATCGGCCACACTGGGACTGAGACACGGCCCAGACTCCT
ACGGGAGGCAGCAGTAGGGAATCTTCCGCAATGGACGAAAGTCTGACGG
AGCAACGCCGCGTGAGTGATGAAGGTTTTCGGATCGTAAAGCTCTGTTGT
TAGGGAAGAACAAGTACCGTTCGAATAGGGCGGTACCTTGACGGTACCT
AACCAGAAAGCCACGGCTAACTACGTGCCAGCAGCCGCGGTAATACGTA
GGTGGCAAGCGTTGTCCGGAATTATTGGGCGTAAAGGGCTCGCAGGCGG
TTTCTTAAGTCTGATGTGAAAGCCCCCGGCTCAACCGGGGAGGGTCATTG
GAAACTGGGGAACTTGAGTGCAGAAGAGGA
623
Bacillus subtilis
JF266596
HL5
ACATGCAAGTCGAGCGGCAGCACAGGAGAGCTTGCTCTCTGGGTGGCGA
GTGGCGGACGGGTGAGGAATACATCGGAATCTACTCTGTCGTGGGGGAT
AACGTAGGGAAACTTACGCTAATACCGCATACGACCTACGGGTGAAAGC
AGGGGACCTTCGGGCCTTGCGCGATTGAATGAGCCGATGTCGGATTATCT
AGTTGGCGGGGTAAAGGCCCACCAAGGCGACGATCCGTAGCTGGTCTGA
GAGGATGATCAGCCACACTGGAACTGAGACACGGTCCAGACTCCTACGG
GAGGCAGCAGTGGGGAATATTGGACAATGGGCGCAAGCCTGATCCAGCC
ATACCGCGTGGGTGAAGAAGGCCTTCGGGTTGTAAAGCCCTTTTGTTGGG
AAAGAAATCCAGCTGGCTAATACCCGGTTGGGATGACGGTACCCAAAGA
ATAAGCACCGGCTAACTTCGTGCCAGCAGCCGCGGTAATACGAAGGGTG
CAAGCGTTACTCGGAATTACTGGGCGTACAGCGTGCGTAGGTGGTCGTT
549
Stenotrophomonas
maltophilla
JF266597
Table Continued…

- 86 -
HL6
GTCGAGCGGCAGCACGGGTACTTGTACCTGGTGGCGAGCGGCGGAC
GGGTGAGTAATGCCTAGGAATCTGCCTGGTAGTGGGGGATAACGCT
CGGAAACGGACGCTAATACCGCATACGTCCTACGGGAGAAAGCAG
GGGACCTTCGGGCCTTGCGCTATCAGATGAGCCTAGGTCGGATTAG
CTAGTTGGTGAGGTAATGGCTCACCAAGGCGACGATCCGTAACTGG
TCTGAGAGGATGATCAGTCACACTGGAACTGAGACACGGTCCAGAC
TCCTACGGGAGGCAGCAGTGGGGAATATTGGACAATGGGCGAAAG
CCTGATCCAGCCATGCCGCGTGTGTGAAGAAGGTCTTCGGATTGTA
AAGCACTTTAAGTTGGGAGGAAGGGCAGTTACCTAATACGTATCTG
TTTTGACGTTACCGACAGAATAAGCACCGGCTAACTCTGTGCCAGC
AGCCGCGGTAATACAGAGGGTGCAAGCGTTAATCGGAATTACTGGG
CGTAAAGCGCGCGTAGGTGGTTTGTTAAGTTGAATGTGAAATCCCC
GGGCTCAACCTGGGAACTGCATCCAAAACTGGCAGGCTAGAGTATG
GTAGAGGGTGGTGGAATTTCCTGTGTAGCGGTGAAATGCGTAGATA
TAGGAAGGAACACCAGTGGCGAAGGCGACCACCTGGACTGATACT
GACACT
693
Pseudomonas sp.
JF266602

- 87 -
Table 11. Partial 16S rRNA sequence and identified bacterial species with GenBank
accession number of the five bacterial isolates from the gut of field and
lab populations of adult T. chilonis.
Isolate Partial 16S rRNA gene sequence Size
(bp)
Identified
Bacteria By
BLASTn
GenBank
Accession
Number
TF1
ACATGCAAGTCGAGCGGCAGCACAGGAGAGCTTGCTCTCTGGGTGGCGA
GTGGCGGACGGGTGAGGAATACATCGGAATCTACTCTGTCGTGGGGGAT
AACGTAGGGAAACTTACGCTAATACCGCATACGACCTACGGGTGAAAGC
AGGGGACCTTCGGGCCTTGCGCGATTGAATGAGCCGATGTCGGATTATCT
AGTTGGCGGGGTAAAGGCCCACCAAGGCGACGATCCGTAGCTGGTCTGA
GAGGATGATCAGCCACACTGGAACTGAGACACGGTCCAGACTCCTACGG
GAGGCAGCAGTGGGGAATATTGGACAATGGGCGCAAGCCTGATCCAGCC
ATACCGCGTGGGTGAAGAAGGCCTTCGGGTTGTAAAGCCCTTTTGTTGGG
AAAGAAATCCAGCTGGCTAATACCCGGTTGGGATGACGGTACCCAAAGA
ATAAGCACCGGCTAACTTCGTGCCAGCAGCCGCGGTAATACGAAGGGTG
CAAGCGTTACTCGGAATTACTGGGCGTACAGCGTGCGTAGGTGGTCGTTT
AAGTCCGTTGTGAAAGCCCTGGGCTCAACCTGGGAACTGCAGTGGATACT
GGGCGACTATAATGTGGTAGAGGGTAGCGGATTTCCTGGTGTAGCAGTG
641 Stenotrophomonas
maltophilia JF266599
TF2
AGTCGAGCGAATGGATTGAGAGCTTGCTCTCAAGAAGTTAGCGGCGGAC
GGGTGAGTAACACGTGGGTAACCTGCCCATAAGACTGGGATAACTCCGG
GAAACCGGGGCTAATACCGGATAACATTTTGAACTGCATGGTTCGAAATT
GAAAGGCGGCTTCGGCTGTCACTTATGGATGGACCCGCGTCGCATTAGCT
AGTTGGTGAGGTAACGGCTCACCAAGGCAACGATGCGTAGCCGACCTGA
GAGGGTGATCGGCCACACTGGGACTGAGACACGGCCCAGACTCCTACGG
GAGGCAGCAGTAGGGAATCTTCCGCAATGGACGAAAGTCTGACGGAGCA
ACGCCGCGTGAGTGATGAAGGCTTTCGGGTCGTAAAACTCTGTTGTTAGG
GAAGAACAAGTGCTAGTTGAATAAGCTGGCACCTTGACGGTACCTAACC
AGAAAGCCACGGCTAACTACGTGCCAGCAGCCGCGGTAATACGTAGGTG
GCAAGCGTTATCCGGAATTATTGGGCGTAAAGCGCGCGCAGGTGGTTTCT
TAAGTCTGATGTGAAAGCCCACGGCTCAACCGTGGAGGGTCATTGGAAA
CTGGGAGACTTGAGTGCAGAAGAGGAAAGTGGAATTCCATGTGTAGCGG
TGAAATGCGTAGAGATATGGAGGAACACCAGTGGCGAAGGCGACTTTCT
GGTCTGTAACTGACACTGAGGCGCGAAAGCGTGGGGAGCAAACAGGATT
AGATACCCTGGTAGTCCACGCCGTAAACGATGAGTGCTAAGTGTTAGAGG
GTTTCCGCCCTTTAGTGCT
808 Bacillus sp. HQ651056
TF3
TACCATGCAAGTCGAGCGGAGGAGGGAGCTTGCTCCTGGAATCAGCGGC
GGACGGGTGAGTAATGCCTGGGAATCTGCCTGGTAGTGGGGGATAACGT
CTCGAAAGGGACGCTAATACCGCGTACGTCCTACGGGAGAAAGCAGGGG
ATCTTCGGACCTTGCGCTATCAGATGAGCCCAGGCCGGATTAGCTTGTTG
GTGAGGTAATGGCTCACCAAGGCGACGATCCGTAGCTGGTCTGAGAGGA
TGATCAGCCACACTGGGACTGAGACACGGCCCAGACTCCTACGGGAGGC
AGCAGTGGGGAATATTGGACAATGGGCGAAAGCCTGATCCAGCCATGCC
GCGTGTGTGAAGAAGGTCTTCGGATTGTAAAGCACTTTAAGTTGGGAGGA
AGGGGTTGAAGCTAATACCTTCAATCTTTGACGTTACCAACAGAATAAGC
ACCGGCTAACTCTGTGCCAGCAGCCGCGGTAATACAGAGGGTGCAAGCG
TTAATCGGAATTACTGGGCGTAAAGCGCGCGTAGGTGGTTCAGTAAGATG
GAAGTGAAATCCCCGGGCTTAACCTGGGAACTGCTTTCATAACTGCTGAG
CTAGAGTACGGTAGAGGGTAGTGGAATTTCCTGTGTAGCGGTGAAATGCG
TAGATATAGGAAGGAACACCAGTGGCGAAGGCGACTACCTGGACTGATA
CTGACACTGAGGTGCGAAAGCGTGGGGA
720 Pseudomonas sp. JF266598
TL1
TACCATGCAAGTCGAGCGGAGGAGGGAGCTTGCTCCTGGAATCAGCGGC
GGACGGGTGAGTAATGCCTGGGAATCTGCCTGGTAGTGGGGGATAACGT
CTCGAAAGGGACGCTAATACCGCGTACGTCCTACGGGAGAAAGCAGGGG
ATCTTCGGACCTTGCGCTATCAGATGAGCCCAGGCCGGATTAGCTTGTTG
GTGAGGTAATGGCTCACCAAGGCGACGATCCGTAGCTGGTCTGAGAGGA
TGATCAGCCACACTGGGACTGAGACACGGCCCAGACTCCTACGGGAGGC
AGCAGTGGGGAATATTGGACAATGGGCGAAAGCCTGATCCAGCCATGCC
GCGTGTGTGAAGAAGGTCTTCGGATTGTAAAGCACTTTAAGTTGGGAGGA
AGGGGTTGAAGCTAATACCTTCAATCTTTGACGTTACCAACAGAATAAGC
ACCGGCTAACTCTGTGCCAGCAGCCGCGGTAATACAGAGGGTGCAAGCG
TTAATCGGAATTACTGGGCGTAAAGCGCGCGTAGGTGGTTCAGTAAGATG
GAAGTGAAATCCCCGGGCTTAACCTGGGAACTGCTTTCATAACTGCTGAG
CTAGAGTACGGTAGAGGGTAGTGGAATTTCCTGTGTAGCGGTGAAATGCG
TAGATATAGGAAGGAACACCAGTGGCGAAGGC
675 Pseudomonas sp. JF266600
TL2
GTCGAACGGCAGCACAGTAAGAGCTTGCTCTTATGGGTGGCGAGTGGCG
GACGGGTGAGGAATACATCGGAATCTACTTTTTCGTGGGGGATAACGTAG
GGAAACTTACGCTAATACCGCATACGACCTTCGGGTGAAAGCAGGGGAC
CTTCGGGCCTTGCGCGATTGAATGAGCCGATGTCGGATTAGCTAGTTGGC
GGGGTAAAGGCCCACCAAGGCGACGATCCGTAGCTGGTCTGAGAGGATG
ATCAGCCACACTGGAACTGAGACACGGTCCAGACTCCTACGGGAGGCAG
CAGTGGGGAATATTGGACAATGGGCGCAAGCCTGATCCAGCCATACCGC
GTGGGTGAAGAAGGCCTTCGGGTTGTAAAGCCCTTTTGTTGGGAAAGAAA
ACTTGCAGGTTAATACCCAGCAAGTCTGACGGTACCCAAAGAATAAGCA
CCGGCTAACTTCGTGCCAGCAGCCGCGGTAATACGAAGGGTGCAAGCGTT
ACTCGGAATTACTGGGCGTAAAGCGTGCGTAGGTGGTTGTTTAAGTCTGT
TGTGAAAGCCCTGGGCTCAACCTGGGAACTGCAGTGGAAACTGGACAAC
TAGAGTGTGGTAGAGGGTAGCGGAATTCCCGGTGTAGCAGTGAAATGCG
TAGAGATCGGGAGGAACATCCATGGCGAAGGCAGCTACCTGGACCAACA
CTGACACTGAGGCACGAAAGCGTGGGGAGCAAACAGGATTAGATACCCT
GGTAGTC.
747 Stenotrophomonas
sp. JF266601

- 88 -
4.2.11 Phylogeny analysis of the gut bacterial isolates from laboratory and field
populations of H. armigera and adult laboratory and field populations of T.
chilonis
The phylogenetic tree was constructed using Neighbour-Joining Tree MEGA-4
bioinformatics software tool and the genetic relatedness between the isolates were
analysed. The dendogram showing the genetic relatedness among the bacterial isolates
have been shown in Figure 16 (bacterial isolates from the gut of larvae of H. armigera
collected from tomato ecosystem), Figure 17 (bacterial isolates from the gut of larvae of
H. armigera collected from cotton ecosystem), Figure 18 (bacterial isolates from the gut of
larvae of H. armigera from laboratory populations) and Figure 19 (bacterial isolates from
the gut of field and laboratory adult populations of T. chilonis).
4.3 Insecticide bioassay on field (cotton and tomato) populations of H. armigera
after treating with antibiotics.
In order to know whether gut bacteria is having any role in insecticide resistance,
the field collected larvae of H armigera was treated with tetracycline along with diet for
about five generations to cure the gut bacteria and after fifth generation insecticide
bioassay was carried out. The results on the toxicity of the test insecticides to third instar
larvae of field populations of H. armigera on cotton and tomato after treating with
tetracycline are presented in Table 12. The statistical comparison of toxicity and resistant
factor is shown in Table 13. The data revealed variations in the responses of field
populations of H. armigera larvae collected from cotton and tomato to various
insecticides. On cotton, median lethal concentration (LC50) for 3rd
instar larvae of H.
armigera ranged from 67.51 to 1991.48 ppm for the eight different insecticides, with the
larvae exhibiting the highest resistance to triazophos (1991.48 ppm) and the lowest to
abamectin (67.51 ppm). Resistance of field populations to organophosphate

- 89 -
E.casseliflavus
E.gallinarum
Enterococcus sp.
E.faecium
Staphylococcus sp.
Bravundimonas diminuta
Stenotrophomonas sp.
Pseudomonas aeruginosa
Acinetobacter calcoaceticus
Bacillus subtilis
Rhodococcus sp.6
97
94
56
92
66
0.00.51.01.5
Figure 16. Phylogenetic dendrogram of the bacterial isolates from the gut of
larvae of H. armigera from tomato crop.
Bacillus pumilus
Bacillus subtilis
Staphylococcus sp.
Enterococcus casseliflavus
Rhodococcus sp.
Pseudomonas sp.
Pseudomonas aeruginosa99
92
54
99
0.000.050.100.15
Figure 17. Phylogenetic dendrogram of the bacterial isolates from the gut of
larvae of H. armigera from cotton crop.

- 90 -
Proteus vulgaris
Klebsiella oxytoca
Stenotrophomonas maltophilla
Pseudomonas sp.
Cellulosimicrobium cellulans
Bacillus subtilis
100
98
100
0.000.050.100.15
Figure 18. Phylogenetic dendrogram of the bacterial isolates from the gut of
laboratory larvae of H. armigera
Stenotrophomonas maltophilia
Stenotrophomonas sp.
Pseudomonas sp.
Bacillus sp.
100
0.000.050.100.15
Figure 19. Phylogenetic dendrogram of the bacterial isolates from the gut of
adult field and laboratory populations T. chilonis.

- 91 -
Table 12. Toxicities of different insecticides in field populations
of H. armigera after treating with tetracycline on
cotton and tomato after 24 h of exposure
Insecticide
Field (Cotton) Field (Tomato)
Dose
ppm n
a r
b M
c
Dose
ppm n
a r
b M
c
Abamectin
0
14.25
28.5
57
114
10
10
10
10
10
0
0
2
6
8
0
0
20
60
80
0
14.25
28.5
57
114
10
10
10
10
10
0
0
2
5
7
0
0
20
50
70
Chloropyriphos
0
300
600
1200
2400
10
10
10
10
10
0
1
3
6
10
0
10
30
60
100
0
300
600
1200
2400
10
10
10
10
10
0
1
4
6
10
0
10
40
60
100
Cypermethrin
0
25
50
100
200
10
10
10
10
10
0
0
2
4
8
0
0
20
40
80
0
25
50
100
200
10
10
10
10
10
0
0
2
5
7
0
0
20
50
70
Indoxacarb
0
108.75
217.5
435
870
10
10
10
10
10
0
0
2
6
8
0
0
20
60
80
0
108.75
217.5
435
870
10
10
10
10
10
0
2
4
8
10
0
20
40
80
100
Malathion
0
250
500
1000
2000
10
10
10
10
10
0
0
1
3
5
0
0
10
30
50
0
250
500
1000
2000
10
10
10
10
10
0
1
2
4
8
0
10
20
40
80
Quinalphos
0
250
500
1000
2000
10
10
10
10
10
0
0
1
3
7
0
0
10
30
70
0
250
500
1000
2000
10
10
10
10
10
0
1
3
6
8
0
10
30
60
80
Spinosad
0
12.5
25
50
100
10
10
10
10
10
0
0
2
4
8
0
0
20
40
80
0
12.5
25
50
100
10
10
10
10
10
0
0
3
5
8
0
0
30
50
80
Triazophos
0
400
800
1600
3200
10
10
10
10
10
0
0
2
5
8
0
0
20
50
80
0
400
800
1600
3200
10
10
10
10
10
0
1
4
6
8
0
10
40
60
80 aNumber of larvae used bNumber of larvae died cPer cent mortality

- 92 -
Table 13. Statistical comparison of toxicity of eight commonly used insecticides on field (cotton & tomato)
populations of H. armigera after 24 h of exposure after tetracycline antibiotic treatment
Test larvae
(Population of
H. armigera)
Insecticide LC50
(ppm)
95% FL of LC50
RF Slope ± SE Chi
square Lower Upper
Field (Cotton)
Abamectin
Chlorpyriphos
Cypermethrin
Indoxacarb
Malathion
Quinalphos
Spinosad
Triazophos
67.51
992.82
130.64
247.16
1286.13
1539.47
65.32
1991.48
50.42
740.95
99.32
167.33
906.43
1193.04
49.66
1501.35
92.98
1451.36
180.81
353.96
2015.54
2160.64
90.40
2749.53
4.50
0.88
10.8
0.61
3.15
1.76
1.90
1.30
0.0261 ± 0.0061
0.0019 ± 0.0005
0.0146 ± 0.0035
0.0060 ± 0.0016
0.0010 ± 0.0003
0.0014 ± 0.0003
0.0293 ± 0.0070
0.0009 ± 0.0002
4.05
0.78
1.97
2.40
2.59
1.05
1.97
2.72
Field (Tomato)
Abamectin
Chlorpyriphos
Cypermethrin
Indoxacarb
Malathion
Quinalphos
Spinosad
Triazophos
77.78
947.35
133.25
277.30
1271.11
1097.68
59.92
1679.72
58.08
694.51
96.37
198.22
939.49
774.76
44.25
1149.16
112.30
1392.26
202.76
396.79
1835.03
1594.64
84.55
2485.16
5.10
0.84
11.05
0.69
3.11
1.25
1.77
1.13
0.0222 ± 0.0056
0.0018 ± 0.0005
0.0113 ± 0.0030
0.0061 ± 0.0016
0.0013 ± 0.0003
0.0012 ± 0.0003
0.0277 ± 0.0067
0.0007 ± 0.0002
3.56
1.79
2.02
0.80
1.58
2.79
3.71
3.79
LC50 : Concentration of insecticide that killed 50% of the test larval population in the observation period of 24 h. FL:
Fiducial Limit. SE: Pooled binomial standard error.

- 93 -
compounds compared to susceptible strain was found to be significantly higher by 0.88 to
3.15-fold. The resistance factor was highest (3.15) for malathion and least (0.61) for
indoxacarb. In contrast to organophosphates, resistance of field populations of H.
armigera to pyrethroid (cypermethrin) was 10.8 compared to the susceptible populations.
The field populations on cotton showed no resistance to indoxacarb, abamectin and the
resistance factor was 4.50 and to spinosad the resistant factor was 1.90 as compared to
susceptible population.
On tomato, the median lethal concentrations (LC50) for 3rd
instar larvae of H.
armigera after tetracycline treatment ranged from 59.92 to 1679.72 ppm for the eight
insecticides, with the larvae exhibiting the highest resistance for triazophos and the lowest
resistance to spinosad (Table 11). The resistance factor for organophosphate compounds
for larvae collected from tomato was (0.84 to 3.11 fold) compared to the susceptible
population. The resistance factor was highest for cypermethrin (11.05), while indoxacarb
showed nil resistance as compared to the susceptible population. The larvae collected on
cotton were more resistant as compared to tomato. The comparison of the LC50 values of
the 3rd
instar larvae of field populations of H. armigera collected from cotton and tomato
before antibiotic treatment and after antibiotic treatment for five generations showed
significant decrease in the insecticide resistance to the insecticides tested (Figure 20 and
21). The insecticide toxicity data was also recorded after 7 days of exposure and their
mortality data was recorded (Table 14) and the LC50 values was derived using probit
analysis (Table 15). Hundred per cent mortality was recorded in the higher three
concentrations in most of the insecticides tested for field populations of H. armigera,
seven days after treating with tetracycline. From the probit analysis the median lethal
concentration was tremendously decreased and the LC50 values for field cotton population

- 94 -
Figure 20. Comparison of LC50 values before and after tetracycline
treatment on third instar larvae of field populations of H.
armigera collected from cotton crop to different test
insecticides (BTT = before tetracycline treatment ; ATT =
after tetracycline treatment)
Figure 21. Comparison of LC50 values before and after tetracycline
treatment on third instar larvae of field populations of H.
armigera collected from tomato crop to different test
insecticides (BTT = before tetracycline treatment ; ATT
= after tetracycline treatment)

- 95 -
Table 14. Toxicities of different insecticides after treating with
tetracycline in field populations of H. armigera (cotton
and tomato) after 7 days of exposure
Nsecticide
Field (Cotton) Field (Tomato)
Dose
PPM n
a r
b M
c
Dose
PPM n
a r
b M
c
Abamectin
0
14.25
28.5
57
114
10
10
10
10
10
1
8
9
10
10
10
80
90
100
100
0
14.25
28.5
57
114
10
10
10
10
10
1
8
10
10
10
10
80
100
100
100
Chlorpyriphos
0
300
600
1200
2400
10
10
10
10
10
1
8
10
10
10
10
80
100
100
100
0
300
600
1200
2400
10
10
10
10
10
0
9
10
10
10
0
90
100
100
100
Cypermethrin
0
25
50
100
200
10
10
10
10
10
0
8
10
10
10
0
80
100
100
100
0
25
50
100
200
10
10
10
10
10
0
9
10
10
10
0
90
100
100
100
Indoxacarb
0
108.75
217.5
435
870
10
10
10
10
10
1
7
8
10
10
10
70
80
100
100
0
108.75
217.5
435
870
10
10
10
10
10
0
8
9
10
10
0
80
90
100
100
Malathion
0
250
500
1000
2000
10
10
10
10
10
0
7
9
10
10
0
70
90
100
100
0
250
500
1000
2000
10
10
10
10
10
0
8
10
10
10
0
80
100
100
100
Quinalphos
0
250
500
1000
2000
10
10
10
10
10
0
8
9
10
10
0
80
90
100
100
0
250
500
1000
2000
10
10
10
10
10
0
8
9
10
10
0
80
90
100
100
Spinosad
0
12.5
25
50
100
10
10
10
10
10
0
6
8
10
10
0
60
80
100
100
0
12.5
25
50
100
10
10
10
10
10
0
7
9
10
10
0
70
90
100
100
Triazophos
0
400
800
1600
3200
10
10
10
10
10
1
7
8
10
10
10
70
80
100
100
0
400
800
1600
3200
10
10
10
10
10
1
7
9
10
10
10
70
90
100
100 aNumber of larvae used bNumber of larvae died cPer cent mortality

- 96 -
Table 15. Statistical comparison of toxicity of eight commonly used insecticides on field (cotton & tomato)
populations of H. armigera after 7 days of exposure after tetracycline treatment
Test larvae
(Population of
H. armigera)
Insecticide LC50
(ppm)
95% FL of LC50 Slope ± SE
Chi
square Lower Upper
Field (Cotton)
Abamectin
Chlorpyriphos
Cypermethrin
Indoxacarb
Malathion
Quinalphos
Spinosad
Triazophos
10.22
180.30
20.79
99.02
235.56
212.88
15.58
416.88
1.75
59.89
--
23.30
115.35
89.06
8.52
196.05
16.71
297.27
--
160.47
337.58
313.07
23.19
611.07
0.094 ± 0.028
0.007 ± 0.002
0.199 ± 0.721
0.010 ± 0.003
0.007 ± 0.002
0.007 ± 0.002
0.089 ± 0.028
0.003 ± 0.001
2.130
0.015
0.000
1.894
2.56
4.307
3.354
3.830
Field (Tomato)
Abamectin
Chlorpyriphos
Cypermethrin
Indoxacarb
Malathion
Quinalphos
Spinosad
Triazophos
8.56
149.95
19.06
92.60
203.36
216.89
11.78
324.63
2.84
42.04
--
38.74
--
89.07
5.78
96.43
14.12
257.24
--
136.19
--
313.07
16.88
513.63
0.151 ± 0.047
0.009 ± 0.003
0.216 ± 0.673
0.015 ± 0.004
0.018 ± 0.028
0.007 ± 0.002
0.131 ± 0.037
0.003 ± 0.001
0.015
0.001
0.000
4.307
0.002
4.307
2.562
0.876
LC50 : Concentration of insecticide that killed 50% of the test larval population in the observation period of 7
days, FL: Fiducial Limit. SE: Pooled binomial standard error.

- 97 -
was found to be 10.22, 180.30, 20.79, 99.02, 235.55, 212.88, 15.58, and 416.88 ppm
respectively, similarly the LC50 values for field tomato populations was found to be 8.56.
149.95, 19.06, 92.60, 203.36, 216.89, 11.78, and 324.63 ppm respectively. Lower LC50
values were recorded wherever microbial curing was done with antibiotic, though it was
statistically non-significant by non-overlap method of fludicial limits.
4.4 Insecticide degradation studies by the gut microbial isolates from susceptible
lab and field populations of H. armigera and adult lab and field populations of
T. chilonis by minimal media and Gas Chromatography.
All the eight insecticides were selected for the insecticide degradation studies. .All
the bacterial isolates from the gut of lab and field populations of H. armigera and lab and
field adult populations of T. chilonis after sequencing, were tested for their growth on
minimal salt medium (MSM) along with the selected insecticides as per the concentration
mentioned in materials and methods. Growth of the bacterial isolates was recorded after 7
days of incubation at 30ºC and is shown in the Table 16. Total of 24 bacterial isolates
were tested and among them isolate HT3 (Enterococcus sp.) were found to grow on
minimal salt medium (MSM) and with chlorpyriphos and isolate CL2 (Enterococcus
casseliflavus) was able to grow in MSM with chloropyriphos and malathion and no growth
was seen in MSM without insecticide (control). The growth of isolates HT3 and CL2 on
MSM without insecticide (control) and with insecticides is shown in Plate 12. Bacterial
isolates HT3 and CL2 were further grown in MSM broth without and with insecticides and
incubated in shaker at 30ºC for 7 days, after incubation 0.1 ml of the culture was plated on
to sterile nutrient agar plates and were incubated at 30ºC for 48 h and the number of CFU
was calculated along with control and data have been shown Table 17. Further cell free
extract of the MSM broth cultures were analyzed in the Gas Chromatography facility
available at Bangalore Test House, Bangalore, to determine the concentration of the

- 98 -
insecticide. GC graph results have been shown for MSM with insecticides, MSM with
isolate HT3 without insecticide and with chlorpyiphos and MSM with isolate CL2 without
insecticides and with chlorpyriphos and malathion in Figure 22, 23, and 24 respectively.
The concentration of the insecticides in the MSM broth cultures along with the control
have been shown in Table 18. GC graph analysis showed that there was decrease in the
concentrations of the insecticides in msm broth cultures with insecticides when compared
to that of msm broth cultures without insecxticides. The isolate HT3 (Enterococcus sp.)
was able to utilize 43.9% of chlorpyriphos and isolate CL2 (Enterococcus casseliflavus)
was able to utilize 26% of chlorpyriphos and 57.1% of malathion in msm broth cultures
with camparison with the respective control cultures. Findings of the current resukts
suggested that gut bacteria in the field populations of H. armigera is having a role in
insecticide resistance.

- 99 -
Table 16. Growth of bacterial isolates on MSM medium with insecticides from the gut of Helicoverpa armigera (tomato, cotton
and susceptible lab) and T. chilonis (field and lab)
Bacterial
Isolates
Isolate Name MSM MSM +
Abamectin MSM +
Chlorpyriphos
MSM +
Cypermethrin
MSM +
Indoxacarb MSM +
Malathion
MSM +
Quinalphos
MSM +
Spinosad
MSM +
Triazophos
HT1 Stenotrophomonas sp. − − − − − − − − −
HT2 Enterococcus sp. − − − − − − − − −
HT3 Enterococcus sp. -- − ++ − − − -- − −
HT5 Enterococcus gallinarum − − − − − − − − −
HT7 Bravundimonas diminuta − − − − − − − − −
HT9 Enterococcus faecium − − − − − − − − −
HT10 Staphylococcus sp. − − − − − − − − −
HT12 Pseudomonas aeruginosa − − − − − − − − −
HT13 Acinetobacter calcoaceticus − − − − − − − − −
HT14 Bacillu subtillis − − − − − − − − −
HT15 Rhodococcus sp. − − − − − − − − −
CL1 Bacillus pumillis − − − − − − − − −
CL2 Enterococcus casseliflavus -- − ++ − − + -- − −
CL3 Bacillus subtilis − − − − − − − − −
CL4 Rhodococcus sp. − − − − − − − − −
CL5 Pseudomonas sp. − − − − − − − − −
CL6 Staphylococcus sp. − − − − − − − − −
CL7 Pseudomonas aeruginosa − − − − − − − − −
HL1 Proteus vulgaris − − − − − − − − −
HL2 Cellulosimicrobium cellulans − − − − − − − − −
HL3 Klebseilla oxytoca − − − − − − − − −
HL4 Bacillus subtilis − − − − − − − − −
HL5 Stenotrophomonas maltophilla − − − − − − − − −
HL6 Pseudomonas sp. − − − − − − − − −
Table 12 Continued…

- 100 -
TF1 Stenotrophomonas maltophilla − − − − − − − − −
TF2 Bacillus sp. -- − -- − − -- -- − −
TF3 Pseudomonas sp. − − − − − − − − −
TL1 Pseudomonas sp. − − − − − − − − −
TL2 Stenotrophomonas sp. − − − − − − − − −
TF1 Stenotrophomonas maltophilla − − − − − − − − −
MSM: Minimum Salt Medium, +: Good growth, ++: Very good growth, −: No growth
HT1-HT15: Bacterial isolates from the larval gut of insecticide resistant field larvae of H. armigera from tomato.
CL1-CL2: Bacterial isolates from the larval gut of insecticide resistant field larvae of H. armigera from cotton.
HL1-HL2: Bacterial isolates from the larval gut of lab populations of H. armigera.
TF1-TF3: Bacterial isolates from the gut of field adult populations of T. chilonis
TL1 – TL2: Bacterial isolates from the gut of laboratory adult populations of T. chiloni

- 101 -
Plate 12. Growth of bacterial isolate HT3 and CL2 on MSM with insecticides. HT3
– Enterococcus sp. CL2 - Enterococcus casseliflavus. A – Control, B - MSM
with Chlorpyriphos, C – MSM with Malathion

- 102 -
A B
Figure 22. GC analysis of MSM with Chloropyriphos and Malathion, A-
Chlorpyriphos B- Malathion CL2 CL
A B
Figure 23. GC analysis of MSM with Chloropyriphos and bacterial isolate HT3,
A- Chlorpyriphos B- Control

- 103 -
A B
C
Figure 24. GC analysis of MSM with chloropyriphos, malathionwith
bacterial isolate CL2 A- Chlorpyriphos B- Malathion C-
Control

- 104 -
Table 17. Colony forming units of the bacterial
isolates (HT3 and CL2) on nutrient agar
MSM broth
culture CFU/mL
Control 00
MSM + HT3 3 X 10 -4
MSM + HT3 +
Chlorpyriphos 7 X 10
-4
MSM + CL2 1 X 10 -4
MSM + CL2 +
Chlorpyriphos 3 X 10
-4
MSM + CL2 +
Malathion 2 X 10
-4
Table 18. Concentration of Insecticides in MSM
broth Cultures with bacterial isolates HT3
and CL2 analyzed by GC-ECD
MSM broth
culture
Chlorpyriphos
Conc. (µg/ml)
Malathion
Conc. (µg/ml)
Control 00 00
MSM 38.29 112.27
MSM + HT3 16.81 ---
MSM + CL2 10.05 64.13
HT3 – Enterococcus sp. CL2 - Enterococcus casseliflavus