4. flood hazard mitigation analysis draftavailable …
TRANSCRIPT

355310 PWSA City-Wide Green Infrastructure Assessment – Draft Report 11/10/16 4-1
4. FLOOD HAZARD MITIGATION ANALYSIS
PWSA coordinated with the City of Pittsburgh (City) Office of Emergency Management and Homeland Security (OEMHS) to obtain the Hazard Vulnerability Assessment report dated September 2013, which formed the basis for identification of the “top 10”, or the ten most hazardous, hazard locations. These locations are listed in Table 4-1. Field investigations were conducted to better understand each hazard and helped to establish the root cause(s) of the hazard situation in these locations. The root causes are also included in the table. Of the ten hazard locations, the hazard conditions for three, Route 28 and 31st St. Bridge (#4), Mount Washington (#9), and Rear of Eggers Street (#10), appear to be the result of landslides and slope instability, and hence they could not be addressed as part of this study. Locations along Library Road (#2) and Saw Mill Run Road (#3) experience recurring flooding, which can benefit from upstream stormwater reduction measures. Because these two hazard areas are located in the Saw Mill Run (SMR) watershed, they will be addressed during the completion of Integrated Watershed Management (IWM) project being completed by PWSA, and hence were not included in this study. The remaining five locations are flooding related hazard locations elsewhere in the City of Pittsburgh. However, for one of the five, (Becks Run area (#5)), an existing in-stream hydraulic model of the watershed has not been developed and development of a model was beyond the scope of this study; Becks Run flooding will need to be analyzed as part of a future separate study. Therefore, the remaining four hazard locations were analyzed in greater detail and are described herein; they include:
1. Morange Road - located in the Chartiers Creek Basin in the C-25 sewershed 2. Frankstown Avenue - located in the Upper Allegheny Basin in the A-42 sewershed 3. Streets Run - located in the Monongahela Basin in the M-42 sewershed 4. Nine Mile Run - located in the Monongahela Basin in the M-47 sewershed
The flooding at Morange Road and Frankstown Road were found to result from the sewer capacity issues and these areas were analyzed using the existing hydrologic and hydraulic (H&H) collection system model. The flooding at Streets Run and Nine Mile Run were found to result from the stream overtopping a culvert or the stream banks, and these areas were analyzed using available open channel stream models obtained from ALCOSAN.
DRAFT

355310 PWSA City-Wide Green Infrastructure Assessment – Draft Report 11/10/16 4-2
TABLE 4-1 TOP 10 HAZARD LOCATIONS IN THE CITY OF PITTSBURGH
Priority Location Description (Provided
by PWSA & City)
Focus Suspected Root Cause of Hazard
Location General Sewer
Condition (CCTV) Suggested Next Actions
1 Streets Run Recurring flooding
Stream Stream floods due to large rain events
Unknown - No CCTV Impervious area stormwater runoff reduction or upstream stormwater detention necessary to address root cause. Use stream model for further analysis.
2 Library Road
Recurring flooding
Stream Stream floods due to large rain events
Good overall condition Impervious area reduction or upstream stormwater detention necessary to address root cause. To be analyzed as part of SMR IWM project. No further actions as part of this study.
3 Saw Mill Road
Recurring flooding
Stream Stream floods due to large rain events
Sediment and minor joint displacement in pipe (vitrified clay) observed
Impervious area reduction or upstream stormwater detention necessary to address root cause. To be analyzed as part of SMR IWM project. No further actions as part of this study.
4 Route 28 and 31st St. Bridge
Landslides and slope instability
Slope Instability
Steep slope; winter icing issues require road closure by City Public Works
Good overall condition Impervious area reduction will not address root cause. No further actions as part of this study.
5 Becks Run Area
Recurring basement and first floor flooding
Stream Stream floods due to large rain events
Areas of infiltration observed and deposits; fair condition overall
Impervious area reduction or upstream stormwater detention necessary to address root cause. Stream model needs to be created for further analysis. No further actions as part of this study. DRAFT

355310 PWSA City-Wide Green Infrastructure Assessment – Draft Report 11/10/16 4-3
TABLE 4-1 TOP 10 HAZARD LOCATIONS IN THE CITY OF PITTSBURGH
Priority Location Description (Provided
by PWSA & City)
Focus Suspected Root Cause of Hazard
Location General Sewer
Condition (CCTV) Suggested Next Actions
6 Morange Road
Recurring flooding
Level of Service
Sewer surcharges during storm events cause street flooding
Videos are zoom-only; no capacity-related defects evident; entire length of pipe not available
Utilize H&H model to check wet weather sewer capacity. PWSA to perform CCTV inspection.
7 Frankstown Avenue
Recurring flooding and slope instability
Level of Service and Slope Instability
Sewer surcharges during storm events cause street flooding; steep slopes
Partial CCTV video available; PWSA’s follow-up inspections did not indicate any sewer structural problems that could be causing the flooding
Utilize H&H model to check wet weather sewer capacity. PWSA to perform CCTV inspection.
8 Nine Mile Run
Recurring flooding along Commercial Road near culvert
Level of Service and Culvert Size
Insufficient culvert capacity under Commercial Road
No CCTV of culvert; Visual inspection performed. No structural issues observed that could cause the flooding
Increased culvert size, impervious area reduction, or upstream stormwater detention necessary to address root cause. Use stream model for further analysis.
9 Mount Washington
Landslides and slope instability
Slope Instability
Steep slope; landslide prone
No sewers run downslope; two sections of sewer parallel at top of slope; sewer system not a contributor
Impervious area reduction will not address root cause. No further actions as part of this study.
10 Rear of Eggers Street
Landslides and slope instability
Slope Instability
Steep slope; landslide prone
Good overall condition Impervious area reduction will not address root cause. No further actions as part of this study.
DRAFT

355310 PWSA City-Wide Green Infrastructure Assessment – Draft Report 11/10/16 4-4
4.1 Current Level of Service
4.1.1 Morange Road Flooding Hazard Location This hazard location is at the intersection of Morange Road and West Busway in the C-25 sewershed that drains to Chartiers Creek, is located near the Oakwood and East Carnegie neighborhoods of the City of Pittsburgh. There are two trunk sewers at this location: a 24-inch diameter combined sewer conveying flows from the Borough of Crafton, and a PWSA combined sewer, with a size varying between 30 and 36 inches in diameter. The PWSA combined sewer conveys flows from the City of Pittsburgh, and also conveys sanitary flows from upstream areas in Green Tree Borough. Figure 4-1 shows the general area around the Morange Road flooding location, and Figure 4-2 shows a photograph of the reported flooding area just upstream of the busway culvert along Morange Road. Although hard to see in the photograph, there are several catch basins connected to the PWSA storm sewer. The storm sewer flow is routed to the PWSA combined sewer about 500 feet downstream of the flooding location. During wet weather events, the capacity of this sewer is exceeded, causing flooding at this location as well as multiple upstream manholes along the combined sewer.
Figure 4-1: Morange Road Flooding Area
DRAFT

355310 PWSA City-Wide Green Infrastructure Assessment – Draft Report 11/10/16 4-5
Figure 4-2: Culvert at the Morange Road Flooding Location (Multiple Inlets Near Underpass)
To establish the current level of protection of the sewer system against flooding (level of service), the existing conditions SWMM hydrologic and hydraulic (H&H) systemwide model was simulated for the typical year wet weather conditions using the EPA SWMM5 engine Version 5.0.013. The flooding at this location results from a combination of limited capacity in the combined sewer and large peak flows conveyed from the upstream areas, which results in backflow from the combined sewer into the storm sewer, and then flow exiting the inlets in Morange Road. It appears that multiple inlets have been constructed in the flooding location area, which actually exacerbates the flooding because the inlets allow more flow to escape from the sewer system. The model simulation results were analyzed to identify the wet weather events in the typical year for which the depth of flow (for the manholes in which flooding was indicated in the model), does not rise high enough to cause street flooding. For the manholes in the Morange Road area, the largest event in the typical year that does not result in flooding was the storm that occurred on July 22, 2003. This event had a maximum intensity of 0.96 inches per hour and rainfall volume of 1.158 inches over 19 hours. Both the maximum intensity and rainfall volume for this event have a return period less than one year; therefore, the current level of service to protect against surface flooding from the existing sewer system is less than a one year storm event, meaning the model results indicate that annual flooding likely occurs at this location.
4.1.2 Frankstown Avenue Hazard Flooding Location This location is along Frankstown Avenue in the A-42 sewershed, eventually draining to Allegheny River, in the 13th Ward near the Homewood area of the City of Pittsburgh. In the existing conditions H&H model, the sewers along Frankstown Avenue were not included. To simulate the flooding for this Assessment, the model was modified by adding the 15-inch diameter sewer along Frankstown Avenue between Standard Avenue and Angora Way, and adjusting the model subcatchments used to represent the
DRAFT

355310 PWSA City-Wide Green Infrastructure Assessment – Draft Report 11/10/16 4-6
hydrologic characteristics of the area. Figure 4-3 shows the general area around the Frankstown Avenue flooding location, along with the 15-inch diameter trunk sewer that was added to the model, and Figure 4-4 shows a photograph of the stretch of Frankstown Avenue that experiences flooding.
Figure 4-3: General Area around the Frankstown Avenue Flooding Location DRAFT

355310 PWSA City-Wide Green Infrastructure Assessment – Draft Report 11/10/16 4-7
Figure 4-4: Frankstown Avenue Flooding Area
To establish the current level of service within the existing combined sewer, the modified existing conditions systemwide H&H model was used to simulate wet weather conditions for the typical year using the EPA SWMM5 engine version 5.0.013. The flooding at this location results from the introduction of significant peak flows from areas upstream of a stretch of flat-sloped pipes. The model simulation results were analyzed to identify the wet weather events in the typical year for which the depth of flow (for the manholes in which flooding was indicated in the model), does not rise high enough to cause street flooding. For the manholes in the Frankstown Avenue area, the largest event in the typical year that does not result in flooding occurred on December 10, 2003. This event has a maximum intensity of 0.58 inches per hour and rainfall volume of 1.353 inches over 19.5 hours. Both the maximum intensity and rainfall volume for this event have a return period less than one year; therefore, the current level of service provided by the existing collection system to prevent flooding is less than a one year storm event, meaning the model results indicate that annual flooding likely occurs at this location. 4.1.3 Streets Run Hazard Flooding Location Streets Run is a 5.2-mile-long tributary to the Monongahela River; the downstream portion of the stream is in the Hays neighborhood of the City of Pittsburgh. The tributary area of this urban stream includes portions of Pittsburgh and the boroughs of Baldwin, Brentwood, West Mifflin, and Whitehall. Streets Run is located in the M-42 sewershed. There are two locations along Streets Run that were evaluated for flooding concerns. One of the flooding locations is at the GalvTech Building along Baldwin Road, upstream of the point where the Streets Run stream enters a culvert. The streamflow in the culvert eventually discharges to the Monongahela River. Figure 4-5 illustrates the locations of the sanitary sewers, the open stream, and the stream culvert near the GalvTech Building, and Figure 4-6 shows Streets Run just upstream of the GalvTech Building along Baldwin Road.
DRAFT

355310 PWSA City-Wide Green Infrastructure Assessment – Draft Report 11/10/16 4-8
The second Streets Run flooding location, upstream of the GalvTech flooding location, is at Calera Street where the stream makes two 90 degree bends while crossing under a small bridge. Figure 4-7 shows the general area of the Calera Street flooding location, and Figure 4-8 shows the bridge over Streets Run at Calera Street.
Figure 4-5: The GalvTech Building Flooding Location Area
DRAFT

355310 PWSA City-Wide Green Infrastructure Assessment – Draft Report 11/10/16 4-9
Figure 4-6: Streets Run Just Upstream of the GalvTech Building To establish the current level of service for this hazard location, the Streets Run stream water quality model was obtained from ALCOSAN and was simulated for the typical year wet weather conditions using the EPA SWMM5 version 5.0.013. The flood level elevation at the GalvTech Building was established using the information included in the model, and for the Calera Street location the flood elevation was determined through field investigations. The flood level at the GalvTech Building was determined to be 11.5 feet, and for Calera Street it was determined to be 5.5 feet above the bottom of the stream. For the channel nodes included in the model to represent these stream locations, the model simulation results were analyzed to identify the largest wet weather event in the typical year for which the depth of flow at any of these nodes does not exceed the flood level. For both of these flooding locations along Streets Run, it was determined that the largest event in the typical year that does not exceed the flood levels occurred on June 20, 2003. This event has a maximum intensity of approximately 1.06 inches per hour and rainfall volume of 1.7 inches over 18.25 hours. Both the maximum intensity and rainfall volume for this event have a return period less than one year; therefore, the current level of service to prevent flooding is less than a one year storm event, meaning the model results indicate that annual flooding likely occurs at this location. DRAFT

355310 PWSA City-Wide Green Infrastructure Assessment – Draft Report 11/10/16 4-10
Figure 4-7: Calera Street Flooding Area
DRAFT

355310 PWSA City-Wide Green Infrastructure Assessment – Draft Report 11/10/16 4-11
Figure 4-8: Calera Street Bridge Over Streets Run 4.1.4 Nine Mile Run The Nine Mile Run watershed is an urban watershed located in Pittsburgh’s East End, and the stream is a tributary to the Monongahela River. Nine Mile Run is in the M-47 sewershed and flows to the Monongahela River. The stream receives overflows from seven combined sewer diversion structures located in Pittsburgh, and three sanitary sewer diversion structures located in Edgewood Borough. The flood prone location along Nine Mile Run that was evaluated in this study is the culvert crossing at Commercial Street, near the southern end of Frick Park in the City of Pittsburgh. The water quality model for Nine Mile Run as received from ALCOSAN did not include the culvert at the flooding location. The culvert dimensions were measured in the field and the culvert was added to the model. Figure 4-9 illustrates the general area around the Commercial Street flooding location, and Figure 4-10 shows the upstream side of the culvert that floods during significant wet weather events. DRAFT

355310 PWSA City-Wide Green Infrastructure Assessment – Draft Report 11/10/16 4-12
Figure 4-9: General Area of the Commercial Street Flooding Location along Nine Mile Run
DRAFT
355310 PWSA City-Wide Green Infrastructure Assessment – Draft Report 11/10/16 4-13
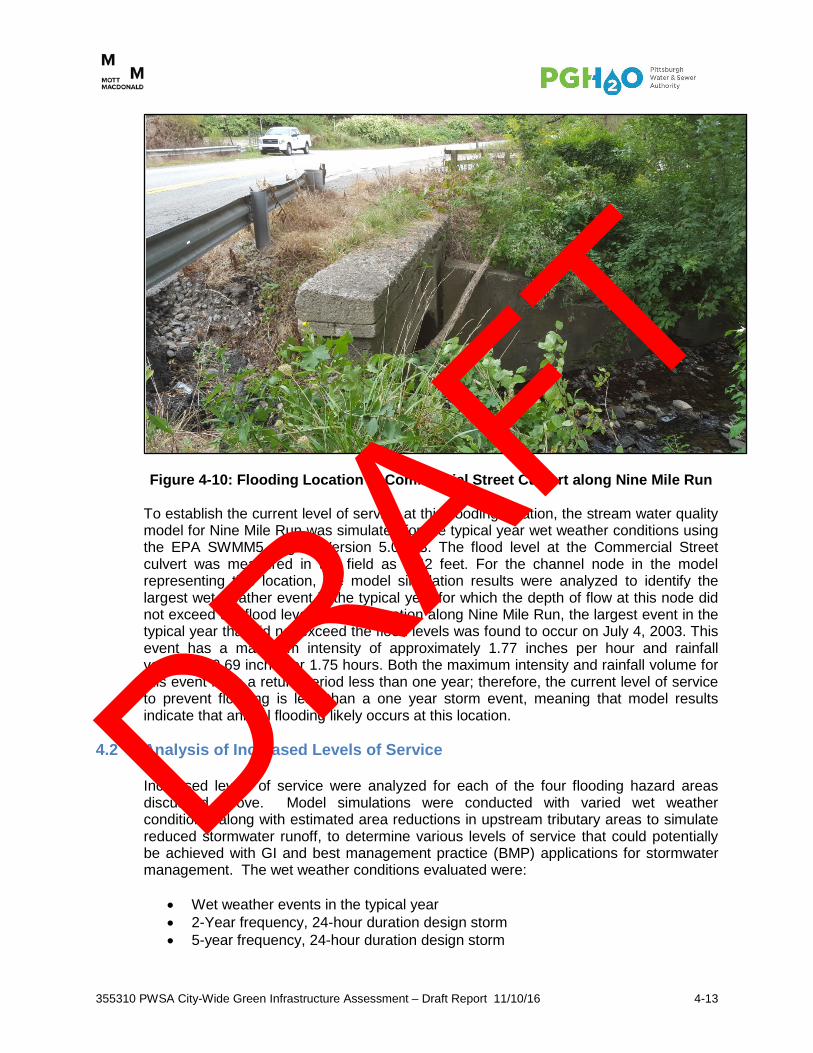
Figure 4-10: Flooding Location at Commercial Street Culvert along Nine Mile Run To establish the current level of service at this flooding location, the stream water quality model for Nine Mile Run was simulated for the typical year wet weather conditions using the EPA SWMM5 engine Version 5.0.013. The flood level at the Commercial Street culvert was measured in the field as 8.42 feet. For the channel node in the model representing this location, the model simulation results were analyzed to identify the largest wet weather event in the typical year for which the depth of flow at this node did not exceed the flood level. For this location along Nine Mile Run, the largest event in the typical year that did not exceed the flood levels was found to occur on July 4, 2003. This event has a maximum intensity of approximately 1.77 inches per hour and rainfall volume of 0.69 inch over 1.75 hours. Both the maximum intensity and rainfall volume for this event have a return period less than one year; therefore, the current level of service to prevent flooding is less than a one year storm event, meaning that model results indicate that annual flooding likely occurs at this location.
4.2 Analysis of Increased Levels of Service
Increased levels of service were analyzed for each of the four flooding hazard areas discussed above. Model simulations were conducted with varied wet weather conditions, along with estimated area reductions in upstream tributary areas to simulate reduced stormwater runoff, to determine various levels of service that could potentially be achieved with GI and best management practice (BMP) applications for stormwater management. The wet weather conditions evaluated were:
• Wet weather events in the typical year • 2-Year frequency, 24-hour duration design storm • 5-year frequency, 24-hour duration design storm
DRAFT

355310 PWSA City-Wide Green Infrastructure Assessment – Draft Report 11/10/16 4-14
• 10-year frequency, 24-hour design storm; • 25-year frequency, 24-hour design storm; • August 31, 2014 storm - In PWSA’s A-22 sewershed study to address flooding
issues in the Shadyside area of Pittsburgh, the August 31, 2014 storm was assumed as a flooding level of protection in the analysis. This was the most recent wet weather event that resulted in flooding in the Shadyside area. This storm had a rainfall intensity of 1.05 inches in 15 minutes, and a rainfall volume of 2.25 inches in 10 hours. This rainfall intensity has occurred in 4 of the last 6 years (through 2015).
The results for evaluating increases in level of service for each flooding area are described as follows.
4.2.1 Morange Road The flooding at the intersection of Morange Road and the West Busway is mostly attributed to large amounts of stormwater entering the combined sewer system such that the conveyance capacity of the combined sewer system is exceeded, resulting in flow backing up through the connected storm sewers and localized flooding occurring along Morange Road. But the location of this flooding is such that it impacts the sewers from two municipalities, Crafton Borough and the City of Pittsburgh. The sewer surcharge conditions exist for some distance upstream of this location, causing multiple manholes to flood along the 24-inch diameter Crafton sewer and the 30-inch and 36-inch diameter segments of the PWSA sewer. Figure 4-11 shows the existing conditions hydraulic grade line (HGL) profile along the PWSA sewer during a wet weather event on August 29, 2003. The August 29, 2003 event was found to be the most severe storm in this sewershed in the typical year. In Figure 4-11, flooding is indicated where the wastewater flow level (in blue) reaches the tops of the manholes; this occurs at four manholes for this wet weather event. Since most of the flooding results from significant peak flows entering the collection system during wet weather, a reduction in the peak flow is the desired solution. This may be achieved by reducing the surface runoff from the combined areas upstream of the flooded manholes. As previously mentioned, the current level of service provided by the existing collection system is less than a 1-year recurrence storm event. Increased level of service was evaluated for various wet weather conditions: the typical year, the 2-year, 5-year, 10-year, and 25-year frequency 24-hour duration design storms, and the August 31, 2014 event. The systemwide model was used to simulate the system response to these rainfall events, and to vary levels of impervious area reductions (to simulate reductions in stormwater runoff with GI, best management practices (BMPs), or similar) to estimate the amount of impervious area reduction that would reduce the flooding at the manholes in this area. The impervious area reduction was implemented in the model simulations by removing areas from the model so that no wet weather contribution was generated in these areas. This represents the impervious area to be managed by GI and BMPs to reduce stormwater runoff in these impervious areas.
DRAFT

355310 PWSA City-Wide Green Infrastructure Assessment – Draft Report 11/10/16 4-15
Figure 4-11: Existing Conditions HGL Profile along the Morange Road PWSA Sewer for the Wet Weather Event on 8/29/2003
The Crafton trunk sewer receives runoff from combined sewersheds within C-24. The C-24 subcatchment area upstream of the flooding location is composed of 8.65 acres of impervious area and 32.13 acres of pervious area, for a total of 40.78 acres. Table 4-2 shows the percentage of impervious area that would need to be managed with GI BMPs to mitigate the flooding at the manholes along the Crafton trunk sewer.
The August 31, 2014 storm was analyzed because it was found to be severe and caused flooding in several areas of the City.
Morange Road flooding area
DRAFT

355310 PWSA City-Wide Green Infrastructure Assessment – Draft Report 11/10/16 4-16
TABLE 4-2 IMPERVIOUS AREA MANAGEMENT PERCENTAGES IN THE CRAFTON
AREAS OF MORANGE ROAD
Level of Service (Wet Weather
Condition)
Impervious Area Management (%) Tributary to the Crafton
Trunk Sewer (C-24) % of Total Area
Typical Year 30 6.4%
2 Year 10 2.1%
5 Year 40 8.5%
10 Year 50 10.6%
25 Year 70 14.8%
Aug. 31, 2014 Storm 50 10.6%
Most of the area contributing runoff to the flooding at Morange Road is in sewershed C-25 within the City of Pittsburgh, and also includes wastewater flows from Green Tree Borough. Figure 4-12 shows the tributary area in the C-25 sewershed. Table 4-3 lists the distribution of tributary combined area for the C-25 sewershed.
TABLE 4-3 TRIBUTARY COMBINED AREA IN C-25 SEWERSHED
Area (acres) Impervious Pervious Total
C-25 Area Upstream of Morange Rd 80.25 236.79 317.04
C-25 Area Downstream of Morange Rd 19.32 93.65 112.97
C-25 Total Sewershed Area 99.57 330.44 430.01
DRAFT

355310 PWSA City-Wide Green Infrastructure Assessment – Draft Report 11/10/16 4-17
Figure 4-12: Tributary Area in the C-25 Sewershed To analyze how to mitigate the flooding at manholes along the PWSA sewer, simulations were conducted to represent impervious area reduction in the areas upstream of the Morange Road flooding location. This did not result in elimination of flooding for the higher magnitude storms. Then, a simulation was conducted in which the impervious area was reduced for the entire C-25 sewershed, incorporating an additional 19.3 acres of impervious area downstream of the Morange Road flooding location. This did not eliminate the flooding for the higher magnitude storms. In an attempt to increase the amount of runoff control, subsequent simulations included area reductions for both impervious and pervious areas for the entire C-25 sewershed. Figure 4-13 shows the HGL profile along the PWSA combined sewer for the August 29, 2003 event in the typical year, with a simulation incorporating a 30 percent area reduction. Table 4-4 shows the percentage of area that would need to be removed in the City of Pittsburgh areas of C-25 to mitigate the flooding at the manholes along the PWSA trunk sewer.
DRAFT

355310 PWSA City-Wide Green Infrastructure Assessment – Draft Report 11/10/16 4-18
Figure 4-13: HGL Profile Along PWSA Sewer in the Morange Road area with 30% Area Reduction
Table 4-4 shows that a significant reduction of stormwater runoff entering the Pittsburgh combined sewer from both impervious and pervious areas would be needed to achieve a level of service to reduce the flood frequency under more severe storm conditions than the typical year events. For example, a 50% reduction in stormwater runoff would be needed for a 2-year frequency level of control, and a 60% reduction in stormwater runoff would be needed for a 5-year frequency storm and the August 31, 2014 event level of control.
Morange Road flooding area
DRAFT
355310 PWSA City-Wide Green Infrastructure Assessment – Draft Report 11/10/16 4-19
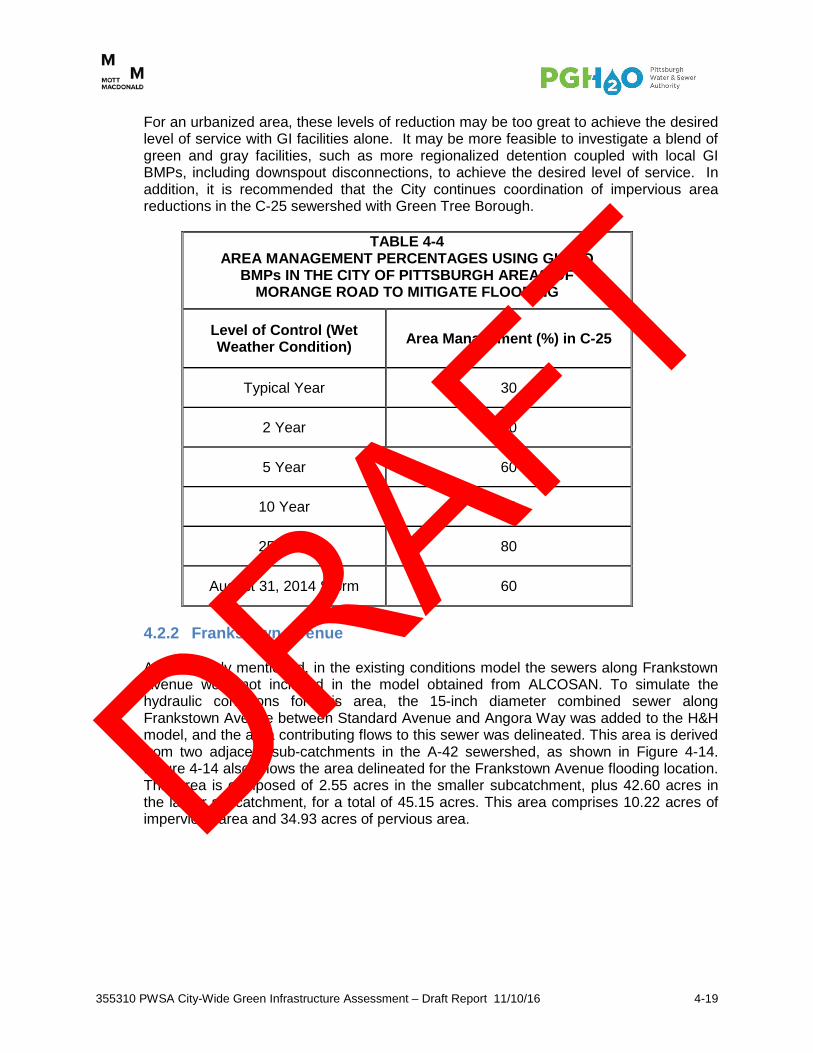
For an urbanized area, these levels of reduction may be too great to achieve the desired level of service with GI facilities alone. It may be more feasible to investigate a blend of green and gray facilities, such as more regionalized detention coupled with local GI BMPs, including downspout disconnections, to achieve the desired level of service. In addition, it is recommended that the City continues coordination of impervious area reductions in the C-25 sewershed with Green Tree Borough.
TABLE 4-4 AREA MANAGEMENT PERCENTAGES USING GI AND
BMPs IN THE CITY OF PITTSBURGH AREAS OF MORANGE ROAD TO MITIGATE FLOODING
Level of Control (Wet Weather Condition) Area Management (%) in C-25
Typical Year 30
2 Year 50
5 Year 60
10 Year 70
25 Year 80
August 31, 2014 Storm 60
4.2.2 Frankstown Avenue As previously mentioned, in the existing conditions model the sewers along Frankstown Avenue were not included in the model obtained from ALCOSAN. To simulate the hydraulic conditions for this area, the 15-inch diameter combined sewer along Frankstown Avenue between Standard Avenue and Angora Way was added to the H&H model, and the area contributing flows to this sewer was delineated. This area is derived from two adjacent sub-catchments in the A-42 sewershed, as shown in Figure 4-14. Figure 4-14 also shows the area delineated for the Frankstown Avenue flooding location. This area is composed of 2.55 acres in the smaller subcatchment, plus 42.60 acres in the larger subcatchment, for a total of 45.15 acres. This area comprises 10.22 acres of impervious area and 34.93 acres of pervious area. DRAFT

355310 PWSA City-Wide Green Infrastructure Assessment – Draft Report 11/10/16 4-20
Figure 4-14: Areas Contributing Flows along Frankstown Avenue The flooding along Frankstown Avenue is mostly attributed to peak flows entering the combined sewer system just upstream of a stretch of flat pipe, causing the conveyance capacity of the combined sewer system to be exceeded. These existing conditions result in localized flooding. Figure 4-15 shows the existing conditions HGL profile in the 15-inch diameter sewer along Frankstown Avenue during a wet weather event (August 29, 2003) in the typical year. The results show that flooding at one manhole would occur for this storm condition. DRAFT

355310 PWSA City-Wide Green Infrastructure Assessment – Draft Report 11/10/16 4-21
Figure 4-15: Existing Conditions HGL Profile in the 15-inch Diameter Sewer Along Frankstown Avenue
To simulate various ways to mitigate the flooding at this location, the entire impervious area of 10.22 acres was removed to simulate stormwater runoff management with GI. This was not effective for eliminating flooding for the design storm conditions. Furthermore, simulating removal of both the impervious and pervious areas indicated that this was not effective in eliminating the flooding. After determining that reduction of the stormwater runoff alone cannot mitigate the flooding, it was deemed necessary to consider improvements to the existing conveyance system. Improving the conveyance of the existing system was simulated by increasing the diameter of the trunk sewer along Frankstown Avenue from 15 inches to 30 inches, while maintaining the existing slope of the pipes. In the upsized pipe scenario simulations, the impervious area was reduced to
DRAFT

355310 PWSA City-Wide Green Infrastructure Assessment – Draft Report 11/10/16 4-22
the degree needed to mitigate flooding. Thus, the model results indicate that both green and gray solutions are likely necessary to mitigate flooding at this hazard location. Figure 4-16 shows the HGL profile of the upsized 30-inch diameter sewer during the August 29, 2003 event in the typical year. This illustrates that there is no flooding expected for this event, with an upsized pipe diameter of 30 inches and with zero impervious areas removed. Table 4-5 shows the percentage of impervious area that would need to be removed to mitigate the flooding at the manholes of the upsized trunk sewer along the Frankstown Avenue for various wet weather scenarios.
Figure 4-16: HGL Profile for the Upsized 30-inch Diameter Sewer (Gray) Scenario Along Frankstown Avenue
Table 4-5 shows that with an upsized pipe and no reduction in impervious area, flooding is mitigated in the typical year and for the 2-year frequency storm. However, for more severe
DRAFT

355310 PWSA City-Wide Green Infrastructure Assessment – Draft Report 11/10/16 4-23
storms, even with the combined sewer pipe upsized to 30 inches in diameter, a significant amount of impervious area management would be needed to achieve greater levels of service to mitigate flooding. For storms analyzed that are more severe than a 2-year frequency storm, management of at least 80% impervious area would need to be employed to mitigate flooding for these storm conditions. For an urbanized area, management of 80% impervious area may be too great to achieve the desired level of service with GI facilities alone. It may be more feasible to investigate an increase in pipe size beyond 30 inches in diameter, a different pipe slope configuration, or a combination thereof, with a lower percentage of impervious area management, to achieve the desired level of service.
TABLE 4-5 IMPERVIOUS AREA MANAGEMENT PERCENTAGES FOR
THE UPSIZED SEWER SCENARIO TO MITIGATE FLOODING ALONG FRANKSTOWN AVENUE
Level of Service (Wet Weather Condition) Impervious Area Reduction (%)
Typical Year 0
2 Year 0
5 Year 80 (after allowing for backwater)
10 Year 100 (after allowing for backwater)
25 Year >100
August 31, 2014 Storm 80 (after allowing for backwater)
4.2.3 Streets Run There are two locations along the Streets Run stream that were evaluated for flooding concerns, the upstream location at Calera Street and the downstream location at the GalvTech Building. Flooding has been reported at the Calera Street location, and to determine the degree that GI may improve existing conditions, stream model simulations were conducted using area reduction analysis for the areas upstream of this location. There are 4,299 acres upstream of the Calera Street flooding location, of which 409 acres are impervious and 3,890 acres are pervious. Figure 4-17 shows the area tributary to the Calera Street flooding location. The impervious area is less than 10 percent of the total area upstream of the flooding location, which, managed alone, does not substantially reduce flooding. Thus, the model simulation included removal of both impervious and pervious areas to simulate reductions in stormwater runoff through GI BMPs to various levels to mitigate
DRAFT

355310 PWSA City-Wide Green Infrastructure Assessment – Draft Report 11/10/16 4-24
flooding for the typical year wet weather conditions, selected design storms, and the August 31, 2014 event. The stream baseflow is generated in the Streets Run stream model, and to analyze higher depths of flow, the rainfall intensities for the various rainfall events were simulated with the peak baseflow condition that occurred during the typical year. Using the Streets Run stream model for wet weather events in the typical year, the results showed that the maximum depth at the Calera Street Bridge is projected to be 6.3 feet. This exceeds the flood threshold of 5.5 feet, and the model confirmed that this location experiences flooding during the typical year conditions. Figure 4-18 illustrates the flooding extent for the 8/31/14 storm event, as determined from the modeling simulations.
Figure 4-17: Areas Contributing Flows to the Calera Street Flooding Location DRAFT

355310 PWSA City-Wide Green Infrastructure Assessment – Draft Report 11/10/16 4-25
Figure 4-18: Calera Street Area Flooding for August 31, 2014 Event, Modeled Results
Table 4-6 shows the percentage of tributary area that would need to be managed to mitigate the flooding at Calera Street and the GalvTech Building. The table shows that a significant amount of area would need to be managed to mitigate flooding. For example, for the typical year events, 50 percent of the area (impervious and pervious) would need to be managed upstream of the Calera Street location to reduce the maximum depth at the Calera Street Bridge to a depth less than the flood threshold of 5.5 feet. For the more severe design storms, a significant amount of both impervious and pervious area management would be needed to achieve a level of service to mitigate flooding. For storms analyzed that are more severe than a 2-year frequency storm, at least 70% of the area would need to be managed to mitigate flooding for these storm conditions. Model simulations of the storm event on August 31, 2014 (rainfall intensity of 1.05 inches of rain in 15 minutes) show that managing stormwater runoff from 30% of the area upstream of Calera Street would mitigate the flooding. The reason the impervious area runoff management is 70% at the GalvTech Building is the existing stream is narrowed as it enters the culvert pipe along the building. This culvert pipe is severely undersized for these large events, resulting in flooding. For a highly developed area, 70% area
DRAFT

355310 PWSA City-Wide Green Infrastructure Assessment – Draft Report 11/10/16 4-26
management may be too great to achieve the desired level of service with GI facilities alone, and it is likely that a blend of gray and green facilities would be more feasible to achieve the desired level of service. However, for the Calera Street location, achieving 30% reduction of stormwater runoff from the upstream areas is more manageable, and a combination of regional detention, local GI BMPs, and targeted downspout disconnection could be feasible. Future analysis of the Streets Run flooding should focus on the Calera Street location, because it is the most upstream location, and managing stormwater upstream will also reduce flooding at the GalvTech Building. Future projects to reduce flooding at the GalvTech Building could then be considered after the stormwater management work upstream of Calera Street is completed.
TABLE 4-6
AREA MANAGEMENT PERCENTAGES REQUIRED TO CONTROL STREETS RUN FLOODING
Level of Service (Wet Weather Conditions)
Impervious and Pervious Area Management (%)
GalvTech Building Calera Street
Typical Year 50 50
2-year, 24-Hour 40 0
5-year, 24-Hour 80 50
10-year, 24-Hour >100 60
25-year, 24-Hour >100 70
August 31, 2014 Storm 70 30
As shown in Figure 4-17, several municipalities contribute stormwater runoff and storm flows to storm sewers in this area. In addition to Pittsburgh, other municipalities contributing flows are Baldwin Borough, Brentwood Borough, Whitehall Borough, and West Mifflin. It is recommended that a solution should be coordinated together among these municipalities. 4.2.4 Nine Mile Run
The flood-prone location along Nine Mile Run that was evaluated in this study is the culvert crossing at Commercial Street. In the Nine Mile Run stream model there are 2,589 acres upstream of the culvert, of which 388 acres are impervious and 2,201 acres are pervious. Figure 4-19 shows the areas within the M-47 sewershed that are tributary to the Commercial Street flooding location. The impervious area is less than 15 percent of the total area upstream of the flooding location, which is not enough area of potential management to mitigate the flooding. In the model simulations, both impervious and pervious areas were removed to simulate reductions in stormwater runoff to various levels to mitigate flooding for the typical year wet weather events, design storms, and the
DRAFT

355310 PWSA City-Wide Green Infrastructure Assessment – Draft Report 11/10/16 4-27
August 31, 2014 event. Figure 4-20 illustrates the flooding area for the 8/31/14 storm event, as determined from the modeling simulations.
Figure 4-19: Areas Contributing Flows to the Commercial Street Culvert Flooding Location
DRAFT

355310 PWSA City-Wide Green Infrastructure Assessment – Draft Report 11/10/16 4-28
Figure 4-20: Commercial Street Area Flooding for August 31, 2014 Event, Modeled Results
The Nine Mile Run stream baseflow is generated in the stream model, and to analyze higher depths of flow, the rainfall intensities for the various rainfall events were simulated with the peak baseflow condition that occurred for the typical year. Table 4-7 shows the percentage of area, both impervious and pervious, that would need to be managed to mitigate the flooding at the Commercial Street culvert. The model results show that to reduce the stream level to at or below the flood threshold level of 8.42 feet for more severe conditions than the typical year events and the 2-year frequency event, a significant amount of area management, 70% or greater, would need to be employed. This degree of area management may not be feasible in a highly developed urban area, and perhaps a blend of green and gray facilities should be investigated to achieve the desired level of service. As shown in Figure 4-19, several municipalities contribute flows to the combined and storm sewers in this area. In addition to Pittsburgh, other municipalities contributing flows are Wilkinsburg, Edgewood, Swissvale, Braddock Hills, and Penn Hills. It is recommended that a solution is coordinated together among these municipalities.
DRAFT

355310 PWSA City-Wide Green Infrastructure Assessment – Draft Report 11/10/16 4-29
TABLE 4-7
AREA MANAGEMENT PERCENTAGES REQUIRED TO CONTROL FLOODING AT THE COMMERCIAL STREET CULVERT
Level of Service (Wet Weather Conditions)
Impervious and Pervious Area
Management (%)
Typical Year 0
2-year, 24-Hour 30
5-year, 24-Hour 70
10-year, 24-Hour 80
25-year, 24-Hour 90
August 31, 2014 Storm 70
4.3 Establish Target GI Implementation Level
To evaluate the degree of GI and BMP facilities that could be established to mitigate flooding in the four flooding hazard areas, model simulations were conducted for a specific wet weather event to develop a target area for stormwater runoff management with GI BMPs. The wet weather condition evaluated was the August 31, 2014 storm. For PWSA’s A-22 Sewershed study to address flooding issues in the Shadyside area of Pittsburgh, the August 31, 2014 storm was selected for the level of service because it was a recent extreme rain event that resulted in flooding in the Shadyside area. This event had a peak intensity of 1.05 inches in 15 minutes and a rainfall volume of 2.26 inches over 10 hours. For the four flood hazard locations evaluated in this GI Assessment study, it was assumed that this same level of service was also considered appropriate. The A-22 Sewershed study and this GI Assessment study determined for the August 31, 2014 event condition that detaining and slowly releasing the first 1.5 inches of runoff entering the sewer system could mitigate surface flooding and basement sewage backups while also reducing combined sewer overflows. This design criteria was selected for the four flood hazard areas. The results of the target GI implementation analysis for the four flooding areas are described as follows.
DRAFT

355310 PWSA City-Wide Green Infrastructure Assessment – Draft Report 11/10/16 4-30
4.3.1 Morange Road For this area, manhole flooding in the Pittsburgh trunk sewer that results in flooding along Morange Road was observed in the model results for the 30 and 36-inch diameter portions of the PWSA trunk sewer. The 30-inch and 36-inch diameter PWSA sewer experiences significant surcharge and manhole flooding, and to mitigate the flooding for the August 31, 2014 event conditions, the amount of runoff that needs to be managed cannot be achieved from only the Pittsburgh area upstream of Morange Road. Stormwater runoff from both impervious and pervious areas needs to be managed in the entire C-25 sewershed. As indicated in Table 4-4, to mitigate the flooding for the August 31, 2014 event, 60 percent of the area in the C-25 sewershed would require stormwater runoff management. The C-25 sewershed includes 99.6 acres of impervious area and 330.5 acres of pervious area for a total of 430.0 acres. To mitigate the flooding for the August 31, 2014 event condition, stormwater runoff from 59.7 acres of impervious area and 198.3 acres of pervious area (total 258 acres) would need to be managed, to detain and slowly release the first 1.5 inches of runoff to the combined sewer. Figure 4-21 shows the HGL profile along the PWSA trunk sewer with the stormwater runoff in upstream areas managed.
Figure 4-21: HGL Profile for the PWSA Trunk Sewer along Morange Road, with Stormwater Runoff Managed from 60% Area in the C-25 Sewershed, 8/31/2014
Event
DRAFT

355310 PWSA City-Wide Green Infrastructure Assessment – Draft Report 11/10/16 4-31
4.3.2 Frankstown Avenue For this area, upsizing the sewer along Frankstown Avenue from 15 inches to 30 inches in diameter was sufficient to control the flooding during the typical year wet weather events. As indicated in Table 4-5, to mitigate the flooding for the August 31, 2014 event, 80 percent of the impervious area would need to be removed. In Figure 4-16, which shows the HGL profile for the upsized 30-inch diameter sewer along Frankstown Avenue, the upstream manhole floods, but this flooding results from the backwater in the downstream trunk sewer, and not from the runoff generated in the Frankstown Avenue contributing areas. The PWSA subcatchments upstream of the flooding location include 10.2 acres of impervious area and 34.9 acres of pervious area, for a total of 45.1 acres. To mitigate flooding for the August 31, 2014 event condition along the upsized 30-inch diameter trunk sewer, stormwater runoff from 8.17 acres of impervious area would need to be managed to detain and slowly release the first 1.5 inches of runoff to the combined sewer. Figure 4-22 shows the HGL profile along the upsized 30-inch diameter PWSA trunk sewer along Frankstown Avenue with this impervious area managed. It should be noted that the flooding along the upstream reaches of the profile would be addressed with this scenario, but for this larger event, manholes in the downstream reaches of the profile become flooded due to downstream conveyance limitations.
Figure 4-22: HGL Profile for the Upsized 30-inch Diameter PWSA Trunk Sewer along Frankstown Avenue, with Stormwater Runoff from 80% Impervious Area
Managed, 8/31/2014 Event
DRAFT

355310 PWSA City-Wide Green Infrastructure Assessment – Draft Report 11/10/16 4-32
4.3.3 Streets Run For this location, the primary flooding concern is at the Calera Street Bridge. As indicated in Table 4-6, to mitigate the flooding for the August 31, 2014 event, 30 percent of the area upstream of this location will require stormwater runoff management. The subcatchments upstream of this flooding location include 409 acres of impervious area and 3,890 acres of pervious area, for a total of 4,299 acres. To mitigate flooding at the Calera Street Bridge for the August 31, 2014 event condition, stormwater runoff from123 acres of impervious area and 1,167 acres of pervious area (total of 1,290 acres) would need to be managed, to detain and slowly release the first 1.5 inches of runoff to the stream. Model simulations show that with stormwater runoff managed in this total area, the stream depth at the Calera Street Bridge would be reduced to 5.4 feet, less than the flood threshold of 5.5 feet, to address flooding for the August 31, 2014 event condition.
4.3.4 Nine Mile Run For this location, the flooding concern is at the culvert along Commercial Street. As indicated in Table 4-7, to mitigate the flooding for the August 31, 2014 event, stormwater runoff from 70 percent of the upstream area would need to be managed. The subcatchments upstream of the flooding location include 388 acres of impervious area and 2,201 acres of pervious area, for a total of 2,589 acres. To mitigate flooding at the Commercial Street culvert for the August 31, 2014 event condition, stormwater runoff from 272 acres of impervious area and 1,541 acres of pervious area (total of 1,813 acres) would need to be managed, to detain and slowly release the first 1.5 inches of runoff to the stream. The model simulations show that the stream depth at the culvert would be reduced to 7.48 feet, less than the flood threshold of 8.42 feet, to mitigate flooding for the August 31, 2014 event condition.
4.4 Flood Hazard Results Summary
4.4.1 Target GI Implementation Level Using the results in Section 4.3, Table 4-8 provides a summary of the amount of area requiring stormwater management to mitigate the flooding for the August 31, 2014 event condition at the four hazard locations within Pittsburgh that were part of this evaluation.
DRAFT

355310 PWSA City-Wide Green Infrastructure Assessment – Draft Report 11/10/16 4-33
TABLE 4-8
TARGET AREA STORMWATER MANAGEMENT TO MITIGATE FLOODING AT PITTSBURGH HAZARD LOCATIONS, 8/31/2014
WET WEATHER CONDITIONS
Location Stormwater Area Management
(acres) Impervious Pervious Total
Morange Road (City of Pittsburgh) 59.7 198.3 258.0
Frankstown Avenue1 (City of Pittsburgh) 8.2 0 8.2
Calera Street Bridge (Streets Run) 123.0 1,167.0 1,290
Commercial Street Culvert (Nine Mile Run) 272.0 1,541.0 1,813.0
1 Also requires upsizing a portion of the Frankstown Avenue sewer along the flat section from 15 inches to 30 inches in diameter.
4.4.2 Collection System Benefits The primary objective of this evaluation was to identify measures to address flooding during large rain events at the hazard locations within Pittsburgh, primarily through stormwater management using GI BMPs. By managing the stormwater, additional benefits in terms of reducing flows entering the collection system and reduction of untreated overflow volume were also observed in the modeling. To quantify the overflow reductions at the outfalls impacted by the stormwater runoff managed areas, the collection system for these areas was simulated with the system wide model, and the reduction in overflow volumes for the typical year were quantified.
4.4.2.1 Morange Road To quantify the overflow reduction benefits, system wide model simulations were conducted for the typical year, reflecting implementation of 60 percent area reduction in all combined subcatchments of the C-25 sewershed only. In addition to the main diversion chamber at the bottom of the sewershed where it ties into the Chartiers Creek interceptor, there are several municipal diversion structures. Table 4-9 presents the typical year overflow volume for these diversion structures and compares the existing conditions with the scenario of 60 percent combined sewer area stormwater runoff managed with GI BMPs for the C-25 sewershed. At the C-25 diversion structure, the typical year overflow volume was reduced from 60.5 million gallons (MG) to 26.7 MG, for a 56 percent reduction. The percent capture (as defined in the EPA CSO Policy, and described in Section 2 of this report) of combined sewage would increase from 59% under existing conditions to 82%, if the target GI level was implemented. For the entire C-25 sewershed, which includes all the upstream overflow and diversion structures, the typical year overflow volume was reduced from 84.1 MG to 34.2 MG, representing a 59 percent reduction.
DRAFT

355310 PWSA City-Wide Green Infrastructure Assessment – Draft Report 11/10/16 4-34
TABLE 4-9 TYPICAL YEAR CSO VOLUME FOR C-25 DIVERSION
STRUCTURES, WITH 60% AREA STORMWATER RUNOFF MANAGEMENT
WITH GI IN COMBINED SEWER SUBCATCHMENTS OF C-25 SEWERSHED (MORANGE ROAD AREA)
CSO Volume (MG)
Diversion Structure
Existing Conditions
Target GI Scenario: 60% Combined
Area Reduction in C-25
DC039L001 1 0.20 0
DC039M001 1 17.10 6.21
DC039M002 1 2.39 0.48
DC040R001 1 0.06 0.01
DC040R002 1 0.01 0
CSO-039K001 18.09 5.97
DC068H001 0.41 0.10
DC068H002 4.92 1.45
DC039E001 0.05 0
DC039J001 0.12 0.03
C-25-Weir 60.48 26.68
Total for C-25 84.06 34.23
1 These diversion structures, listed above CSO-039K001, share the same outfall, CSO-039K001. DRAFT

355310 PWSA City-Wide Green Infrastructure Assessment – Draft Report 11/10/16 4-35
4.4.2.2 Frankstown Avenue The Frankstown Avenue area is part of a broader green infrastructure and urban planning evaluation for the Negley Run (A-42) sewershed, therefore, the proposed target area stormwater management with GI would be addressed as part of this work. See Sections 3 and 6.5 of this report for further details. In addition, a portion of wet weather flow from this area is diverted through the Rosedale diversion chamber to an overflow that discharges into Nine Mile Run. Green infrastructure work within the Frankstown Avenue area of A-42 will provide additional benefit to the Nine Mile Run stream.
4.4.2.3 Streets Run and Nine Mile Run Both Streets Run and Nine Mile Run experience flooding from excessive amounts of stormwater runoff, primarily coming from the separate sewer systems. The majority of the acreage requiring stormwater management is located in the separate sewer systems. If excessive amounts of stormwater are entering the storm sewers and then the streams during rain events, it is likely that portions of the stormwater are also entering the separate sanitary sewers. Stormwater can enter sanitary sewers through multiple locations in the public sewers as well as the private property lateral (sewer from a building to the main public sewer). Stormwater can enter through structural defects and leaks in the public sanitary sewers, cross-connections between the sanitary sewers and storm sewers, defects or leaks in the public storm sewers, as well as downspouts or other storm drain connections from private property improperly connected to the sanitary sewer lateral. Separate sanitary sewers were not designed to carry stormwater; only sewage. In both Streets Run and Nine Mile Run, the separate sewer systems ultimately enter the downstream combined sewer systems. Therefore, stormwater is not only causing flooding in the streams, but also likely contributing to both downstream sanitary sewer and combined sewer overflows. Projects to address the flooding in both Streets Run and Nine Mile Run should be developed to holistically address the stormwater problems at their sources and manage the stormwater entering both the storm sewers and the sanitary sewers. Holistic projects addressing both issues may be more cost-effective and provide more local community benefits by addressing the root causes of the flooding and overflows – excessive amounts of stormwater entering the respective sewer systems. These projects will also allow investment into the existing sanitary and storm systems to address the defects in the systems already constructed rather than building new systems and then having to come back and spend more to address the failing existing systems. To understand how much stormwater enters the sanitary sewers, the R-values were reviewed in the separate sewer areas within the collection system model. An “R-value” is the amount of rainfall that enters sanitary sewers during and after a wet weather event, usually expressed as a percent of rainfall. Reduction of R-values can be accomplished by removal of rainfall-dependent infiltration and inflow (RDII) entering the sanitary sewer system. These RDII removal projects can then be coordinated and constructed with stormwater management projects designed to address the flooding so the stormwater ultimately is connected to the right detention and conveyance systems and properly managed to address both overflows and flooding. Figures 4-27 and 4-29 provide the sanitary sewer system R-values in the Streets Run and Nine Mile Run watersheds as represented in the ALCOSAN SWMM models, and based on 2008-2009 flow monitoring
DRAFT

355310 PWSA City-Wide Green Infrastructure Assessment – Draft Report 11/10/16 4-36
conducted by ALCOSAN and 3RWW. An R-value of greater than 5 is considered to be excessive indicating that too much stormwater is entering the sanitary sewer system. As can be seen in both figures, the majority of the area within each watershed is characterized by excessive amounts of stormwater entering the sanitary sewer system. The areas with high R-values therefore present an opportunity to prioritize the management of the stormwater both within the storm sewer system (to address the flooding) and within the sanitary sewer system (to address the SSOs and CSOs). The next steps in the analysis therefore focused on the areas with the highest R-values by acreage to target the impervious and pervious areas (2,150 acres for Streets Run area; 1,813 acres for Nine Mile Run area) for stormwater management to address both flooding and overflow volume reductions. Streets Run and Nine Mile Run are both located in the Upper Monongahela Basin. To quantify the overflow reduction benefits that could be addressed with projects that also reduce the flooding, the Upper Monongahela Basin system model was simulated for the typical year wet weather conditions using EPA SWMM 5.0.013 engine. Two scenarios were evaluated, with R-values compared between the scenarios. The first scenario included managing the stormwater in 50% of the combined sewer area with GI BMPs and the R values in the separate sewer area reduced by 25 percent to simulate RDII reduction. The second scenario was the same as the first scenario for the combined sewer area but included a 50% reduction in the R values in the separate sewer area to simulate RDII reduction. Figure 4-27 shows the existing condition maximum R-value distribution by model subcatchment in the separate sewer areas of the Streets Run sewershed (M-42). R-values range from 3% to 29% in the sanitary sewersheds. These R values are the maximum computed among the wet weather events monitored by ALCOSAN and 3RWW in 2008-2009. The red and dark orange areas in Figure 4-27 indicate the areas that should be targeted first for R-value reduction because these are the subcatchments with the highest R-values, ranging from 16% to 29%. These would also be the target areas for stormwater management for flooding reduction as shown in Figure 4-28 (1,290 acres). These target subcatchments are located primarily in Brentwood, Baldwin, and Whitehall Boroughs, with a relatively small area in Pittsburgh, which indicates that PWSA would need to coordinate closely with these boroughs to obtain any recent flow monitoring data and information about any recent RDII reduction measures, and to collaborate in developing flooding reduction solutions. Table 4-10 provides the estimated overflow reductions for the Streets Run sewershed for the two evaluated scenarios. DRAFT

355310 PWSA City-Wide Green Infrastructure Assessment – Draft Report 11/10/16 4-37
Figure 4-23: Maximum R-Values for the Sanitary Sewer Subcatchment Areas of Streets Run (M-42) Sewershed, Existing Conditions
DRAFT

355310 PWSA City-Wide Green Infrastructure Assessment – Draft Report 11/10/16 4-38
Figure 4-24: Target R-Value Reduction Areas in Streets Run Sewershed to Estimate Overflow Reduction Benefits
Figure 4-29 shows the maximum R-value distribution by model subcatchment in the separate sewer areas of Nine Mile Run (M-47). R-values range from 3% to 32% in the sanitary sewersheds. These R values are the maximum computed among the wet weather events monitored by ALCOSAN and 3RWW in 2008-2009. The red and dark orange areas in Figure 4-29 indicate the areas that should be targeted for R-value reduction because these are the subcatchments with the highest R-values, ranging from 16% to 32%. These would also be the target areas for stormwater management for flooding reduction as shown in Figure 4-30 (1,408 acres). These target subcatchments are located primarily in Wilkinsburg, Edgewood, and Swissvale Boroughs, with a relatively small area in Pittsburgh, which indicates that PWSA would need to collaborate and coordinate closely with these boroughs to implement RDII reduction measures. Table 4-10 provides the estimated overflow reductions for the Nine Mile Run sewershed for the two evaluated scenarios.
DRAFT

355310 PWSA City-Wide Green Infrastructure Assessment – Draft Report 11/10/16 4-39
Figure 4-25: Maximum R-Values for the Sanitary Sewer Subcatchment Areas of Nine Mile Run (M-47) Sewershed, Existing Conditions
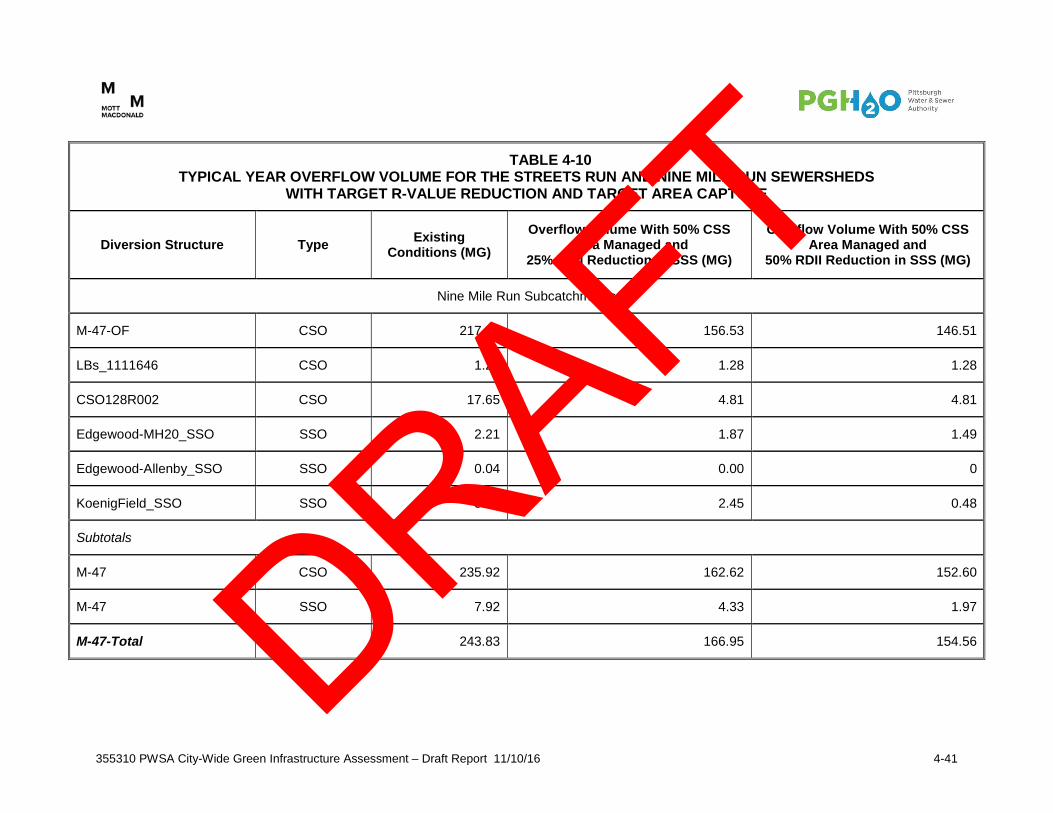
Table 4-10 also compares the typical year overflow volumes for the two evaluated scenarios for the outfalls within the M-42 (Streets Run) and M-47 (Nine Mile Run) sewersheds. For the M-47 sewershed, in which Nine Mile Run is present, in the first scenario, the typical year overflow would be reduced by 77 MG (32 percent reduction), and in the second scenario the overflow would be reduced by 89 MG (37 percent reduction). Under existing conditions, the CSO percent capture for M-47 is 71.5%, which is expected to increase to 76.7% for the first scenario and increase to 78.2% for the second scenario. The typical year SSO volume would be reduced by 75%. For the M-42 sewershed in which Streets Run is present, in the first scenario the typical year overflow would be reduced by 13 MG (8 percent reduction), and in the second scenario the overflow would be reduced by 27 MG (17 percent reduction). The existing conditions CSO percent capture for M-42 is 85.5%, which is expected to increase to 86.8% for the first scenario and increase to 88.1% for the second scenario. The typical year SSO volume would be reduced by 100%. In addition, these scenarios result in approximately 7 MG reduction in overflow volume during the typical year at the M-59 interceptor relief overflow, which is upstream of M-47.
DRAFT
355310 PWSA City-Wide Green Infrastructure Assessment – Draft Report 11/10/16 4-40
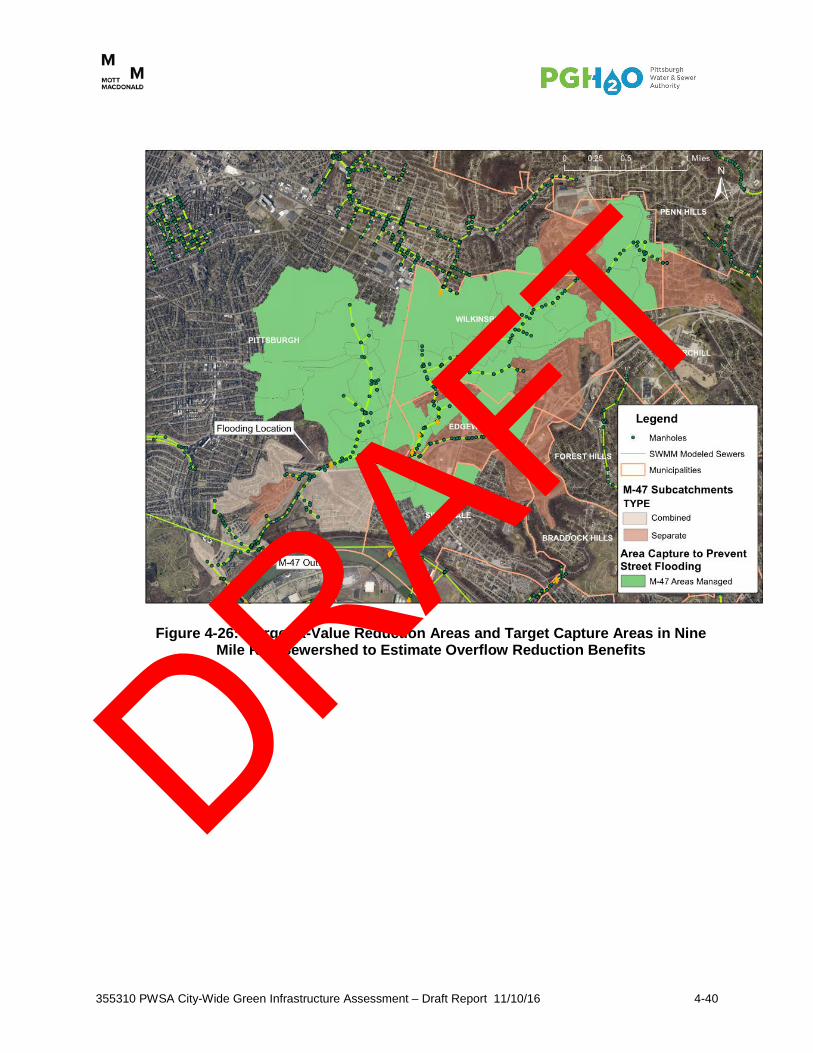
Figure 4-26: Target R-Value Reduction Areas and Target Capture Areas in Nine Mile Run Sewershed to Estimate Overflow Reduction Benefits
DRAFT
355310 PWSA City-Wide Green Infrastructure Assessment – Draft Report 11/10/16 4-41
TABLE 4-10 TYPICAL YEAR OVERFLOW VOLUME FOR THE STREETS RUN AND NINE MILE RUN SEWERSHEDS
WITH TARGET R-VALUE REDUCTION AND TARGET AREA CAPTURE
Diversion Structure Type Existing Conditions (MG)
Overflow Volume With 50% CSS Area Managed and
25% RDII Reduction in SSS (MG)
Overflow Volume With 50% CSS Area Managed and
50% RDII Reduction in SSS (MG)
Nine Mile Run Subcatchments
M-47-OF CSO 217.00 156.53 146.51
LBs_1111646 CSO 1.27 1.28 1.28
CSO128R002 CSO 17.65 4.81 4.81
Edgewood-MH20_SSO SSO 2.21 1.87 1.49
Edgewood-Allenby_SSO SSO 0.04 0.00 0
KoenigField_SSO SSO 5.67 2.45 0.48
Subtotals
M-47 CSO 235.92 162.62 152.60
M-47 SSO 7.92 4.33 1.97
M-47-Total 243.83 166.95 154.56 DRAFT

355310 PWSA City-Wide Green Infrastructure Assessment – Draft Report 11/10/16 4-42
TABLE 4-10 TYPICAL YEAR OVERFLOW VOLUME FOR THE STREETS RUN AND NINE MILE RUN SEWERSHEDS
WITH TARGET R-VALUE REDUCTION AND TARGET AREA CAPTURE
Diversion Structure Type Existing Conditions (MG)
Overflow Volume With 50% CSS Area Managed and
25% RDII Reduction in SSS (MG)
Overflow Volume With 50% CSS Area Managed and
50% RDII Reduction in SSS (MG)
Streets Run Subcatchments
Baldwin_SSO SSO 0.19 0.04 0
CSO_184E001 CSO 0 1.45 1.45
CSO_185H001 CSO 2.17 2.03 2.03
CSO_134A001 CSO 0.60 0.60 0.60
M-42-OFWEIR CSO 152.16 137.93 124.21
Subtotals
M-42 CSO 154.93 142.00 128.29
M-42 SSO 0.19 0.04 0
M-42-Total 155.12 142.05 128.29
DRAFT

355310 PWSA City-Wide Green Infrastructure Assessment – Draft Report 11/10/16 4-43
4.5 Capital Costs
Planning level capital costs were developed for all four flood hazard locations and are presented below, except for the Frankstown Road location. Because the stormwater management for the Frankstown Road flood hazard area aligned with high yield drainage areas for GI BMP installations, the cost was included in the high yield drainage area GI BMP costs for the A-42 sewershed and is discussed in Sections 6 and 9 of this report. The cost to upsize the flat section of pipe from 15-inch to 30-inch diameter was considered minor and should be addressed as part of PWSA’s ongoing sewer asset management program. The capital costs were developed to mitigate flooding up to the August 31, 2014 event condition, with a peak rainfall intensity of 1.05 inches of rain in 15 minutes, and a rainfall volume of 2.26 inches in 10 hours. Rain events that exceed this particular event could still create flooding at these locations. However, the August 31, 2014 event was considered to be an extreme event and a reasonable level of protection from flooding. In preparing the estimates of capital costs, the cost criteria, such as GI costs per impervious acre, are described in Section 7. With GI and BMP applications, it was assumed that the first 1.5 inches of stormwater runoff would be detained and slowly released to the combined or storm sewer system. 4.5.1 Morange Road
As discussed in Section 4.1.1, Morange Road floods because of a combination of limited capacity in the combined sewer and large peak flows conveyed from the upstream areas, which results in backflow from the combined sewer into the storm sewer, and then flow exiting at the stormwater inlets. To reduce flooding, the stormwater runoff from a total of 258 acres would need to be managed with GI BMPs (detain and slowly release the first 1.5 inches of runoff). The 258 total acres were reviewed and converted to an equivalent number of impervious acres based on the amount of runoff from the previous surfaces as quantified by the collection system model. The estimated capital cost to manage the stormwater and mitigate flooding for the August 31, 2014 event conditions is estimated to be $33,010,000, as shown in Table 4-11. In addition to mitigating flooding for events up to the August 31, 2014 event condition, this strategy also results in reduction of 50 million gallons of overflow volume.
DRAFT

355310 PWSA City-Wide Green Infrastructure Assessment – Draft Report 11/10/16 4-44
TABLE 4-11 PLANNING LEVEL COST ESTIMATE FOR FLOOD HAZARD
MITIGATION (UP TO THE AUGUST 31, 2014 EVENT CONDITION)
Commercial Street - Nine Mile Run (M-47)
Capital Cost to Address Flooding1
(Commercial Street) $243,000,000
Sewer Asset Management and RDII Reduction Cost $85,700,000
RDII Private Source Reduction Cost $39,600,000
Calera Street - Streets Run (M-42) Capital Cost to Address Flooding1 (Calera Street) $29,800,000
Sewer Asset Management and RDII Reduction Cost $43,500,000
RDII Private Source Reduction Cost $20,800,000
Morange Road - Chartiers Creek (C-25)
Capital Cost to Address Flooding $33,010,000
1 Average of regional detention and distributed BMP costs. If regional detention can be performed, costs could be lower. Additional evaluation, including storm sewer system surveying, is beyond the scope of this project, and is required to develop a complete opinion of probable construction cost.
4.5.2 Streets Run and Nine Mile Run
Stormwater runoff management across a total of 1,813 acres is required to mitigate flooding at Commercial Street in the Nine Mile Run sewershed up to the August 31, 2014 event conditions. This equates to 1,408 acres (490 impervious acres) in the separate sewer system and 405 acres in the combined sewer system. A total of 1,291 acres (123 impervious acres) of stormwater runoff management, all in the separate sewer system, is required to mitigate flooding at Calera Street in the Streets Run sewershed for the August 31, 2014 event conditions. To develop a planning level cost estimate to manage the stormwater in the separate sewer system in both Nine Mile Run and Streets Run sewersheds, the existing storm sewer mapping available in GIS was reviewed and opportunities for regional detention were examined. The available storm sewer data is limited in GIS and no invert elevation information is currently available. There may be opportunities available for regional detention based on the current locations of the storm sewers, although without accurate
DRAFT

355310 PWSA City-Wide Green Infrastructure Assessment – Draft Report 11/10/16 4-45
invert elevations of the existing storm sewer network, it was not possible to develop accurate costs for regional detention. To develop an overall order of magnitude cost for stormwater management to address flooding, a regional detention cost was developed assuming a maximum depth of the detention structure of 8 feet. A second cost assuming the use of distributed GI BMPs across the 1,408 acres in the Nine Mile Run sewershed (490 impervious acres) and the 1,291 acres in the Streets Run sewershed (123 impervious acres) was also determined. The two costs were then averaged to determine an order of magnitude cost to manage the stormwater runoff in the separate sewer areas. The estimate for the Nine Mile Run sewershed also included 405 acres of impervious area runoff in the combined sewer system managed with GI BMPs. For the GI BMPs in the combined sewer area, the cost per impervious acre was developed and described in Section 7. The capital costs to address flooding in the Nine Mile Run and Streets Run locations are shown in Table 4-11. If regional detention can be performed in lieu of distributed GI BMPs, costs may be lower. Additional evaluation, including storm sewer system surveying, is beyond the scope of this project and is required to develop a complete opinion of probable construction cost for both Nine Mile Run and Streets Run flooding locations. The stormwater management to address the flooding is optimized when addressed in the same areas that have the highest RDII entering the sanitary sewer system. Also, given the very high levels of RDII observed from the flow monitoring and modeling, there is a high need for asset management to renew the condition of the existing sewer system in the tributary areas to the flooding locations in Nine Mile Run and Streets Run. With careful attention to the performance of the needed asset management, the sewer system could be renewed to address not only the structural and maintenance condition of the existing sewers, but to also reduce RDII. To develop capital costs for the asset management and RDII reduction, a cost estimate was developed, with components to renew the existing sanitary sewers primarily with cured-in-place pipe (CIPP) lining, and grouting of 75% of the manholes. A total unit cost of $239 per linear feet (LF) of mainline sewer was estimated. Point repairs were assumed every 50 feet of sewer, in addition to the CIPP lining. Based on GIS maps, a total of 359,000 LF of local 8-inch to 12-inch diameter sanitary sewers were estimated to be located within the target separate sewer areas of the Nine Mile Run (M-47) sewershed, and 182,000 LF of sanitary sewers were estimated within the target separate sewer areas of the Streets Run (M-42) sewershed. To develop costs for private source disconnections, including downspouts, sump pumps, and targeted area drains removal, a planning level cost estimate was developed. The cost estimate also included lining the first 10 feet of the private sewer lateral from the mainline. Details of how the cost estimate was derived are described in Section 7 of this report. A total cost per property of $9,900 for private source disconnections was estimated, and it was assumed that 50% of the properties would require private source disconnections. It is important to note that the public and private source RDII removal costs assume a target of 50% of the RDII would be removed. The costs do not include addressing foundation drains, because these improvements are typically not cost-effective. The costs for the public and private source asset management and RDII removal are provided in Table 4-11.
In addition to addressing flooding for events up to the August 31, 2014 event condition, this strategy also results in reduction of 123 million gallons of overflow volume from the M-42 and M-47 sewersheds.
DRAFT

355310 PWSA City-Wide Green Infrastructure Assessment – Draft Report 11/10/16 4-46
As provided in Table 4-10, in addition to addressing flooding up to the August 31, 2014 event, the M-47 sewershed (Nine Mile Run) combined sewage percent capture is predicted by the model to increase from 71.5% to 78.2% with this work. The typical year SSO volume in this sewershed would be reduced by 75%. For the M-42 sewershed (Streets Run), the combined sewage percent capture is predicted by the model to increase from 85.5% to 88.1% with this work. The typical year SSO volume in this sewershed would be reduced by 100%, essentially eliminating SSOs for the typical year. It is highly recommended that RDII removal and source reduction be included in cost estimates for alternatives analysis. The Water Environment Federation (WEF) addressed the issue of cost effectiveness in the 2013 Guide for Municipal Wet Weather Strategies Publication (pages 67 - 70). The WEF Guide recommends that all costs be included when comparing conveyance and treatment versus RDII removal with reduced conveyance and treatment solutions, including the ongoing asset management costs for the existing sanitary and storm sewer systems, including flooding reduction. These costs can be substantial, as illustrated in the cases of Nine Mile Run and Streets Run. The majority of the costs provided in Table 4-11 would still be required to be added to any regional conveyance and treatment solution focused only on CSO and SSO control. It could be argued that the private source RDII removal costs would not be required under a conveyance and treatment solution, and that the costs for asset renewal could be less because pipes and manholes would only be fixed to address structural and maintenance defects and not for RDII removal. To illustrate this comparison, Table 4-12 was developed to compare conveyance and treatment and RDII removal on a relative cost per gallon basis for the areas tributary to the Commercial Street and Calera Street flooding locations. Because the RDII removal may provide both asset renewal and overflow volume reduction for the same investment, the relative cost per gallon of overflow reduced is lower with the RDII removal solution ($3.76 versus $5.82, or a 35% lower cost). This cost may be offset with a reduction in ongoing treatment costs that the RDII solution offers (not calculated for this comparison). Given that the regulatory agencies have requested that municipalities in the region evaluate source reduction, the results of this analysis provide compelling support for stormwater management and RDII removal demonstration projects to be conducted to confirm the modeled results. Recommendations for solutions for the Morange Road and Frankstown Road flooding hazard areas were carried forward to the GI Assessment recommendations. For the Streets Run and Nine Mile Run flooding areas, regardless of the type of overflow reduction solution selected in these areas, additional costs to address flooding and asset management of the existing sewer system are required, and demonstration projects to holistically address the stormwater are recommended. Section 9 of this report provides the cost for a Green First solution and its total cost and cost per gallon of overflow reduced.
DRAFT

355310 PWSA City-Wide Green Infrastructure Assessment – Draft Report 11/10/16 4-47
TABLE 4-12 CONVEY AND TREAT VERSUS RDII REMOVAL RELATIVE COST
COMPARISON
RDII Removal Solution
Conveyance and Treatment Based
Solution Commercial Street - Nine Mile Run (M-47)
Capital Cost to Address Flooding1 (Commercial Street) $243,000,000 $243,000,000
Sewer Asset Management Cost $85,700,000 $55,700,0002
RDII Private Source Reduction Cost $39,600,000 Convey & Treat. No
RDII removal.
Calera Street - Streets Run (M-42) Capital Cost to Address Flooding1 (Calera Street) $29,800,000 $29,800,000
Sewer Asset Management Cost $43,500,000 $32,600,000
RDII Private Source Reduction Cost $20,800,000 Convey & Treat. No
RDII removal.
Total Cost $462,400,000 $361,100,0002
Overflow Volume Reduction (MG) 123 623
Cost Per Gallon of Overflow Reduced $3.76 $5.82
1 Average of regional detention and distributed GI/BMP costs. If regional detention can be performed, costs may be lower. Additional evaluation, including storm sewer system surveying, is beyond the scope of this project and is required to develop a complete opinion of probable construction cost. 2 65% applied to asset management cost for convey and treat to account for lower cost due to only addressing structural and maintenance defects over time and not I/I related defects. 3 Only about a 50% reduction in overflow volume may be achieved because RDII removal is not performed.
DRAFT