4 april 2011 asia equities daily focus periodicalimg.jrjimg.cn/2011/04/20110404151414415.pdfasia...
TRANSCRIPT

Asia Pan-Asia Strategy
4 April 2011
Asia Equities Daily Focus Today's research headlines Asian Edition
Deutsche Bank AG/Hong Kong
All prices are those current at the end of the previous trading session unless otherwise indicated. Prices are sourced from local exchanges via Reuters, Bloomberg and other vendors. Data is sourced from Deutsche Bank and subject companies. Deutsche Bank does and seeks to do business with companies covered in its research reports. Thus, investors should be aware that the firm may have a conflict of interest that could affect the objectivity of this report. Investors should consider this report as only a single factor in making their investment decision. DISCLOSURES AND ANALYST CERTIFICATIONS ARE LOCATED IN APPENDIX 1. MICA(P) 007/05/2010
Periodical
Asian Index Closings EQUITIES Close 1D Chg %Chg
SHSZ300 3272.73 1.53 4.62 HSCEI 13451.48 1.02 5.98 HSI 23801.90 1.17 3.33 TWSE 8705.13 0.25 -2.98 KOSPI 2121.01 0.68 3.41 FSSTI 3120.47 0.47 -2.18 KLCI 1555.38 0.66 2.40 SENSEX 19420.39 -0.13 -5.31 NIFTY 5826.05 -0.13 -5.03 SET 1064.35 1.61 3.06 JCI 3707.49 0.78 0.11 PCOMP 4129.54 1.84 -1.70 ASX200 4861.80 0.49 2.46 FOREX (vs US$) Close 1D Chg YTD %Chg Rmb 6.55 0.01 0.91 HK$ 7.78 0.01 -0.06 NT$ 29.27 0.48 0.12 Won 1091.20 0.53 3.19 S$ 1.26 0.03 1.85 M$ 3.03 -0.01 1.26 Rupee 44.59 0.38 0.27 Baht 30.24 0.13 -0.60 Rupiah 8696.00 0.14 3.45 Peso 43.36 -0.01 1.01 A$ 1.04 0.46 1.40
Source: Bloomberg Finance LP
Latest Commodity Prices COMMODITIES Close 1D %Chg YTD %Chg West Texas 107.59 0.82 17.74 Brent 118.67 1.21 25.84 CRB 360.89 0.41 8.44 Copper 425.15 -1.13 -4.24 Gold (Spot) 1427.78 -0.32 0.49 Alum. (LME) 2648.00 0.72 7.21 Baltic Dry 1530.00 -0.97 -13.71
Source: Bloomberg Finance LP
DB CORPORATE ACCESS DB Access Indonesia Small Cap Corporate Day - SG 4/5 - 6 DB Access Asia Conference 2011 - Singapore 5/23 - 26 DB Access Taiwan Conference 2011 - Taipei 11/7 - 8 DB Access Korea Conference 2011 - Seoul 11/10 - 11 DB Access Indonesia Conference 2011 - Jakarta 11/29 - 12/1
Research Team
Carissa Szeto Equity Focus (+852) 2203 6171 [email protected] Ching-Li Teo, CFA Equity Focus (+852) 2203 6206 [email protected]
Co
mp
any
Glo
bal
Mar
kets
Res
earc
h
Nodita_ 1. 2.
TOP STORIES MSCI China Strategy Update Positive earnings momentum Hui Miao Page 5
China State Construction (3311.HK),HKD7.47 Buy Price Target HKD10.03
A fast-growing public housing developer; Initiate with Buy Tony Tsang Page 6
China Merchants Bank-H (3968.HK),HKD20.95 Buy Price Target HKD25.06
Valuation reflects superior quality, down to Hold Tracy Yu Page 7
China Macro Strategy PMI confirms positive macro trend Jun MaPage 8
RECOMMENDATION CHANGES
Acer Inc (2353.TW),TWD57.10 Hold Price Target TWD58.00
Downgrading to Hold on business model transition
Kc Kao
Page 9
ESTIMATE & TARGET PRICE CHANGES
Beijing Enterprises (0392.HK),HKD42.30 Buy Price Target HKD59.50
Growth to accelerate; Buy Eric ChengPage 10
LG Display (034220.KS),KRW35,450.00 Buy Price Target KRW43,000.00
Upside potential outweighs downsiderisk
Sc BaePage 11
Ascendas Real Estate (AEMN.SI),SGD2.00 Buy Price Target SGD2.28
Positioning for growth Gregory LuiPage 12
STRATEGY/ECONOMICS
US Equity Strategy Q1 2011 Earnings Preview Binky ChadhaPage 13
Exchange Rate Perspectives FX Intervention Can Brake, Not Break,
a Trend John Horner
Page 14
Asia Economics Special SBV raises the 7-day repo rate Juliana LeePage 15
Asia Economics Daily High but stable inflation in Asia Michael Spencer Page 16
Asia Rates Strategy Taking stock of issuance Sameer Goel Page 20

4 April 2011 Strategy Asia Equities Daily Focus
Page 2 Deutsche Bank AG/Hong Kong
Asia Local Markets Weekly Pick up in inflows Sameer Goel Page 21
Asia Credit Weekly A brief review of 1Q 2011 Gene Cheon Page 22
US Daily Economic Notes Solid employment growth to begetwage inflation
Joseph
LaVorgnePage 23
US Economics Weekly Jobs and prices to put the Fed in play Joseph
LaVorgnaPage 24
Global Commodities Daily Oil dynamics Adam
SieminskiPage 26
India Economics Weekly Understated WPI, Oct-Dec BOP, coreinfra sector growth
Taimur BaigPage 28
ADDITIONAL RESEARCH
China TMT Daily East meets west: Digital ads; also BIDU, GOOG
Alan Hellawell III Page 29
Tech Earnings Revisions Capitulation time for the bulls? Kishore Suratkal Page 30
Angang Steel (0347.HK),HKD10.64 Buy Price Target HKD15.00
On the improvement track; maintaining Buy
James KanPage 31
China CITIC Bank (0998.HK),HKD5.54 Buy Price Target HKD6.43
2010 NPAT up 50% YoY, boost by lower than expected costs
Tracy YuPage 32
China Mengniu Dairy (2319.HK),HKD20.10 Buy Price Target HKD27.00
Earnings growth to accelerate in 2011; maintaining Buy
Mabel WongPage 33
Dongfeng Motor (0489.HK),HKD12.78 Buy Price Target HKD17.80
Key takeaways from analyst briefing - Staying positive
Vincent HaPage 34
Guangdong Investment (0270.HK),HKD4.03 Buy Price Target HKD5.00
Positive surprise on dividend payout; Buy
Eric ChengPage 35
Shandong Weigao (1066.HK),HKD21.70 Buy Price Target HKD24.00
Unlocking value for JW Medical Jack HuPage 36
Weichai Power (2338.HK),HKD49.15 Hold Price Target HKD51.70
Normalizing growth; maintaining Hold Vincent HaPage 37
Taiwan Financials Pulse Money supply, rate hike, asset quality, Polaris merger
Nora HouPage 38
Automobiles & Components March US auto sales best ever for
Hyundai and Kia Sanjeev Rana
Page 39
Korean autos Carmakers' domestic sales up 8%, global sales up 11% YoY
Sanjeev RanaPage 40
Mapletree Logistics Trust (MAPL.SI),SGD0.90 Buy Price Target SGD1.06
Acquisition momentum continues Elaine KhooPage 41
Property Home prices slow in 1Q as measures take effect
Elaine KhooPage 42
DB CONFERENCE/CORPORATE DAY DB Access Indonesia Small Cap Corporate Day - SG 4/5 - 6 DB Access Asia Conference 2011 - Singapore 5/23 - 26 DB Access Taiwan Conference 2011 - Taipei 11/7 - 8 DB Access Korea Conference 2011 - Seoul 11/10 - 11 DB Access Indonesia Conference 2011 - Jakarta 11/29 - 12/1
NDRs PT Nippon Indosari Corpindo (ROTI IJ) - HK 4/4 Evergrande Real Estate Group (3333 HK) - SG 4/5, SZX 4/6, PEK 4/8 PT Gajah Tunggal Tbk (GJTL IJ) - HK 4/7 - 8 NEW: China Railway Group (390 HK) - SG 4/11 - 12 New Oriental Education & Technology Group (EDU US) - HK 4/28 HTC Corporation (2498 TT) - SG 6/21 - 22, HK 6/23 - 24
DB ANALYST/SALES ROADSHOWS Tracy Yu & Sophia Lee: Regional Financial Strategy & HK Banks - HK 3/14 - 15, SG 3/16 - 18 Ajay Kapurd: Asia: Underperformance to continue? - HK 3/16 - 18 Rachman Koeswanto: Building Materials/Cement/Construction - SG 3/14 - 16, HK 3/17 - 18 Sc Bae: Korean Technology - SG 3/14 - 15, HK 3/16 - 18Taimur Baig: Economic outlook in India/Indonesia/Philippines - SG 3/17 - 18 Sanghi Han: Korea Construction and LS Corp./Utilities - HK 3/28 - 29, SG 3/30 - 31 Srinivas Rao: Telecom & Automotive - SG 3/28 - 29, HK 3/30 & 4/1 Christopher Wane: CROCI Global - HK 3/31 & 4/1, SEL 4/4, SG 4/5 - 6, PEK 4/7 John Kim: Korea Telecom - HK 4/1
DB INTERNATIONAL PRODUCT ROADSHOWS
Continental AG (CON GR) - HK 4/8 Lloyds Banking Group (LLOY LN) - PEK 4/13, HK 4/14, SG 4/15 Rod Lache: US Auto Industry - PEK 4/11, HK 4/14, SG 4/15 Marc Geall: European Software & IT - SG 4/12, HK 4/13 Torsten Slok, Chief International Economist: Global Economics - SEL 4/12, PEK 4/13, SG 4/14 China Shipping Container Liner (2866 HK): Metals & Mining - SG 4/12, HK 4/13, PEK 4/14 Fedex Corp. (FDX US) - HK 5/5, SG 5/6 Diageo (DGE LN) - HK 5/9, SG 5/10, PEK 5/11
Maxis (MXSC.KL),MYR5.39 Hold Price Target MYR4.60
Entering fixed-line market with launch of "Home Services"
Wei-Shi WuPage 43
Construction Materials Pent-up demand helps cement consumption grow at c7-8% in Mar
Chockalingam Narayanan Page 44
HUL (HLL.BO),INR284.05 Hold Price Target INR266.00
Mean reversion Harrish ZaveriPage 45
Mahindra & Mahindra (MAHM.BO),INR710.10 Buy Price Target INR820.00
March-11 volumes: robust tractor volumes; UVs lag
Srinivas Rao
Page 46
Maruti Suzuki Limited (MRTI.BO),INR1,274.35 Hold Price Target INR1,500.00
March-11 volumes:strong numbers; maintain Hold
Srinivas Rao
Page 47
Tata Motors Ltd (TAMO.BO),INR1,242.90 Buy Price Target INR1,465.00
March-11 volumes: in line nos; maintain as top pick
Srinivas Rao
Page 48
TVS Motor (TVSM.BO),INR61.75 Buy Price Target INR92.00
March-11 volumes: strong momentum; maintain Buy
Amyn PiraniPage 49
Bank Mandiri (BMRI.JK),IDR6,850.00 Buy Price Target IDR8,000.00
More light on FY10 results Raymond Kosasih Page 50
Bumi (BUMI.JK),IDR3,325.00 Hold NA
First take on FY10 - NP up by 63% YoY
Cherie KhoengPage 51
United Tractors (UNTR.JK),IDR21,450.00 Buy Price Target IDR30,000.00
Encouraging update on Komatsu's supply
Rachman Koeswanto Page 52
Kasikornbank (KBAN.BK),THB130.50 Buy Price Target THB164.00
Looking for solid 1Q11 earnings Worawat Saisuphatphol Page 53
Siam Cement (SCC.BK),THB353.00 Buy Price Target THB434.00
Takeaways from SCC Reverse Roadshow
Sansanee Srijamjuree Page 54
The notes and reports contained in this Daily are all excerpts of previously published documents. Please refer to the published notes on our web site for details on risks, valuations and earnings changes
4 April 2011 Strategy Asia Equities Daily Focus
Page 4 Deutsche Bank AG/Hong Kong
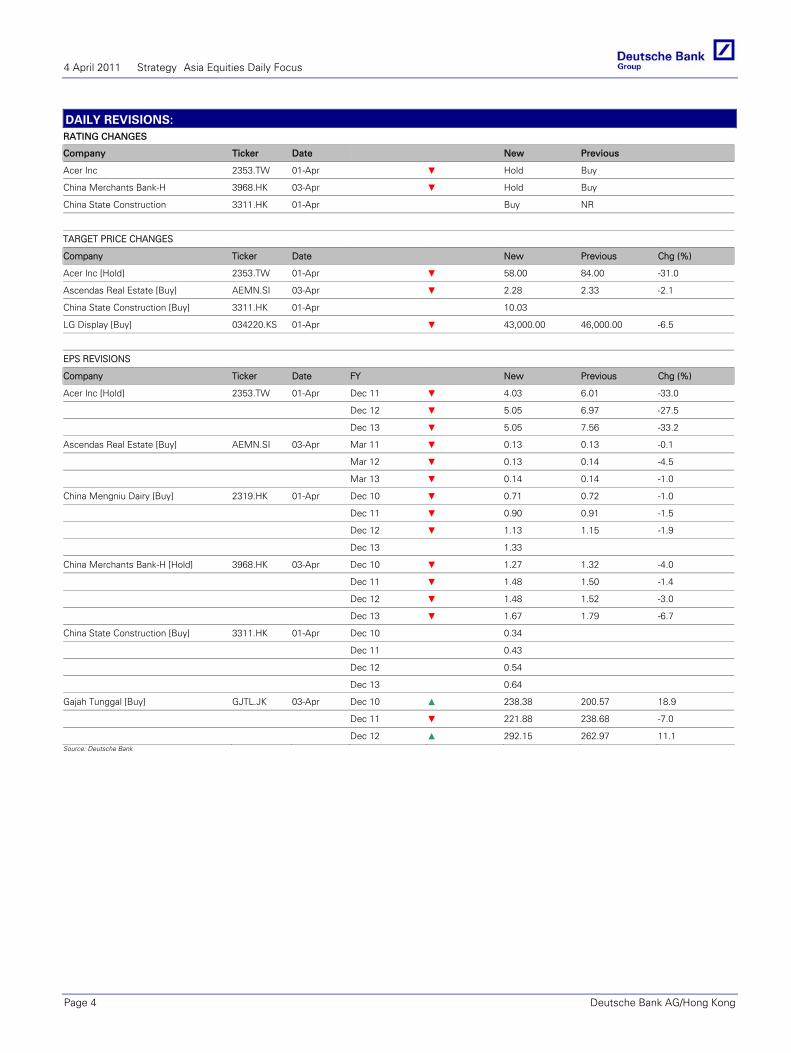
DAILY REVISIONS: RATING CHANGES
Company Ticker Date New Previous
Acer Inc 2353.TW 01-Apr ▼ Hold Buy
China Merchants Bank-H 3968.HK 03-Apr ▼ Hold Buy
China State Construction 3311.HK 01-Apr Buy NR
TARGET PRICE CHANGES
Company Ticker Date New Previous Chg (%)
Acer Inc [Hold] 2353.TW 01-Apr ▼ 58.00 84.00 -31.0
Ascendas Real Estate [Buy] AEMN.SI 03-Apr ▼ 2.28 2.33 -2.1
China State Construction [Buy] 3311.HK 01-Apr 10.03
LG Display [Buy] 034220.KS 01-Apr ▼ 43,000.00 46,000.00 -6.5
EPS REVISIONS
Company Ticker Date FY New Previous Chg (%)
Acer Inc [Hold] 2353.TW 01-Apr Dec 11 ▼ 4.03 6.01 -33.0
Dec 12 ▼ 5.05 6.97 -27.5
Dec 13 ▼ 5.05 7.56 -33.2
Ascendas Real Estate [Buy] AEMN.SI 03-Apr Mar 11 ▼ 0.13 0.13 -0.1
Mar 12 ▼ 0.13 0.14 -4.5
Mar 13 ▼ 0.14 0.14 -1.0
China Mengniu Dairy [Buy] 2319.HK 01-Apr Dec 10 ▼ 0.71 0.72 -1.0
Dec 11 ▼ 0.90 0.91 -1.5
Dec 12 ▼ 1.13 1.15 -1.9
Dec 13 1.33
China Merchants Bank-H [Hold] 3968.HK 03-Apr Dec 10 ▼ 1.27 1.32 -4.0
Dec 11 ▼ 1.48 1.50 -1.4
Dec 12 ▼ 1.48 1.52 -3.0
Dec 13 ▼ 1.67 1.79 -6.7
China State Construction [Buy] 3311.HK 01-Apr Dec 10 0.34
Dec 11 0.43
Dec 12 0.54
Dec 13 0.64
Gajah Tunggal [Buy] GJTL.JK 03-Apr Dec 10 ▲ 238.38 200.57 18.9
Dec 11 ▼ 221.88 238.68 -7.0
Dec 12 ▲ 292.15 262.97 11.1 Source: Deutsche Bank
Asia Hong Kong Strategy Update
1 April 2011
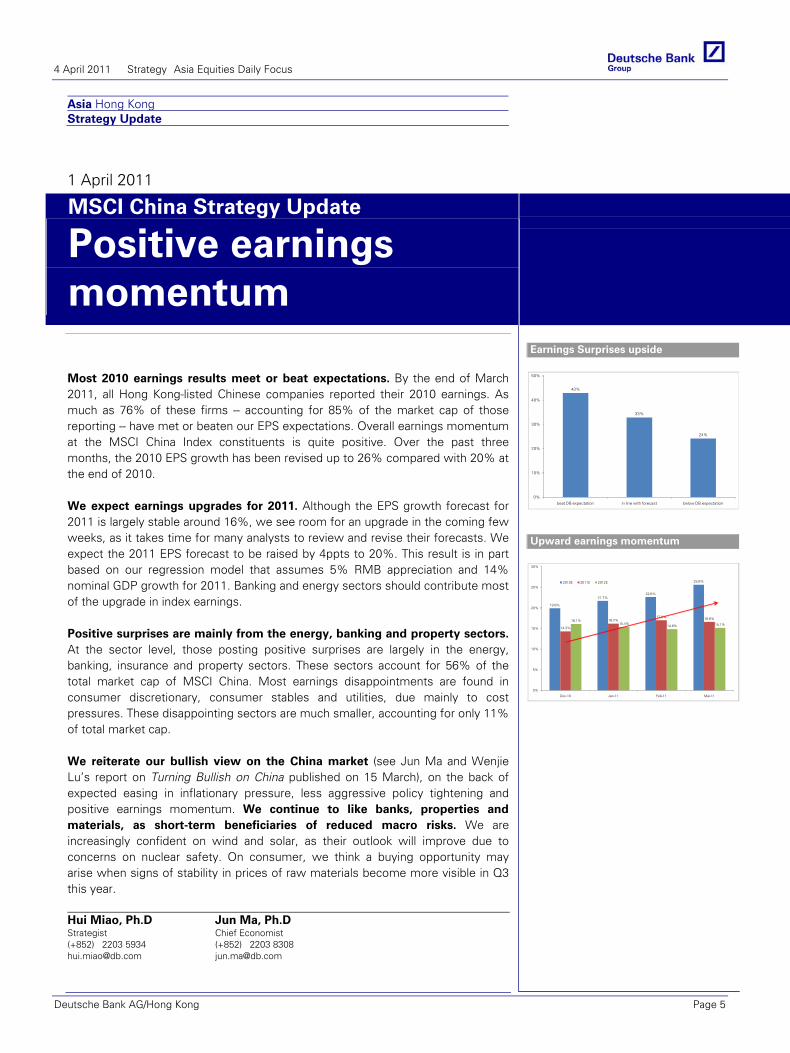
MSCI China Strategy Update
Positive earnings momentum
Hui Miao, Ph.D Strategist (+852) 2203 5934 [email protected]
Jun Ma, Ph.D Chief Economist (+852) 2203 8308 [email protected]
Earnings Surprises upside
43%
33%
24%
0%
10%
20%
30%
40%
50%
beat DB expectation in line with forecast below DB expectation
Upward earnings momentum
19.9%
21.7%22.6%
25.6%
14.3%
16.2%17.0% 16.6%16.1%
15.4%14.8% 15.1%
0%
5%
10%
15%
20%
25%
30%
Dec-10 Jan-11 Feb-11 Mar-11
2010E 2011E 2012E
Most 2010 earnings results meet or beat expectations. By the end of March 2011, all Hong Kong-listed Chinese companies reported their 2010 earnings. As much as 76% of these firms -- accounting for 85% of the market cap of those reporting -- have met or beaten our EPS expectations. Overall earnings momentum at the MSCI China Index constituents is quite positive. Over the past three months, the 2010 EPS growth has been revised up to 26% compared with 20% at the end of 2010.
We expect earnings upgrades for 2011. Although the EPS growth forecast for 2011 is largely stable around 16%, we see room for an upgrade in the coming few weeks, as it takes time for many analysts to review and revise their forecasts. We expect the 2011 EPS forecast to be raised by 4ppts to 20%. This result is in part based on our regression model that assumes 5% RMB appreciation and 14% nominal GDP growth for 2011. Banking and energy sectors should contribute most of the upgrade in index earnings.
Positive surprises are mainly from the energy, banking and property sectors. At the sector level, those posting positive surprises are largely in the energy, banking, insurance and property sectors. These sectors account for 56% of the total market cap of MSCI China. Most earnings disappointments are found in consumer discretionary, consumer stables and utilities, due mainly to cost pressures. These disappointing sectors are much smaller, accounting for only 11% of total market cap.
We reiterate our bullish view on the China market (see Jun Ma and Wenjie Lu’s report on Turning Bullish on China published on 15 March), on the back of expected easing in inflationary pressure, less aggressive policy tightening and positive earnings momentum. We continue to like banks, properties and materials, as short-term beneficiaries of reduced macro risks. We are increasingly confident on wind and solar, as their outlook will improve due to concerns on nuclear safety. On consumer, we think a buying opportunity may arise when signs of stability in prices of raw materials become more visible in Q3 this year.
4 April 2011 Strategy Asia Equities Daily Focus
Deutsche Bank AG/Hong Kong Page 5

Asia China Property Property
1 April 2011
China State Construction Reuters: 3311.HK Bloomberg: 3311 HK Exchange: HSI Ticker: 3311
A fast-growing public housing developer; Initiate with BuyTony Tsang Research Analyst (+852) 2203 6256 [email protected]
Jason Ching, CFA Research Analyst (+852) 2203 6205 [email protected]
Venant Chiang Research Analyst (+852) 2203 6183 [email protected]
Initiate with Buy, TP HK$10.03; strong upside from public housing The public housing system is now a priority of the central government. Through the provision of two value-added services – 1) public housing construction with good design, quality, safety and environmental protection, and 2) financing – to local governments, CSCI enjoys unique advantages over other contractors and developers when participating in China’s massive public housing development. This should present strong and sustainable long-term earnings growth for CSCI.
Forecasts and ratios
Year End Dec 31 2009A 2010A 2011E 2012E 2013E
Sales (HKDm) 9,706.1 11,982.9 16,726.1 25,873.2 30,268.3
EBITDA(HKDm) 535.3 1,003.4 1,520.0 2,341.6 2,824.5
Reported NPAT(HKDm) 674.1 1,036.3 1,488.5 1,990.4 2,355.9
DB EPS FD (HKD) 0.24 0.34 0.43 0.54 0.64
DB EPS growth (%) 32.3 41.6 26.1 26.5 18.4
PER (x) 10.7 11.6 16.5 13.1 11.0
EV/EBITDA (x) 9.6 13.1 15.6 9.5 7.2
Yield (net) (%) 2.8 2.8 1.7 1.8 2.0Source: Deutsche Bank estimates, company data
1 DB EPS is fully diluted and excludes non-recurring items 2 Multiples and yields calculations use average historical prices for past years and spot prices for current and future years, except P/B which uses the year end close
Coverage Change
Buy Price at 31 Mar 2011 (HKD) 7.10Price target - 12mth (HKD) 10.0352-week range (HKD) 8.48 - 2.26HANG SENG INDEX 23,528
Price/price relative
0
23
5
6
8
9
4/09 7/09 10/09 1/10 4/10 7/10 10/10 1/11China State Construc
HANG SENG INDEX (Rebased)
Performance (%) 1m 3m 12mAbsolute -0.8 -3.3 134.3HANG SENG INDEX 0.8 2.1 10.8
Stock data
Market cap (HKDm) 25,448Market cap (USDm) 3,272Shares outstanding (m) 3,584.2Major shareholders –Free float (%) 36Avg daily value traded (USDm) 0.0
Key indicators (FY1)
ROE (%) 21.4Net debt/equity (%) -13.8Book value/share (HKD) 2.59Price/book (x) 2.7Net interest cover(x) –Operating profit margin (%) 8.4
Huge growth potential from government’s 36mn public housing units target The determination of the government in building up a public housing system in China is firm and clear, and the planned 36mn public housing units target opens up a new segment in the China property market with deep volume and huge market potential. The target is aggressive, as is the required funding (about RMB5.5tn on our estimates) and the big potential funding shortfalls of about RMB3-4tn that need to be filled partly by other enterprises – like CSCI – which could deliver quality public housing products to local governments and at the same time help resolve their financing challenges, and with these CSCI can enjoy higher margins.
CSCI is well positioned to expand its market share in public housing With its strong record in construction and civil engineering (>35 years’ experience), strong management team, strong financing capabilities (net cash now), and strong backing from parent CSCEC (the largest state-owned construction company), CSCI should enjoy unique advantages in grabbing market share in public housing via the BT model. Within a short time (July 2010-Jan 2011), CSCI has already obtained 3 large-scale public housing projects. CSCI’s target is a 1% market share in public housing in 2011-15, and if achieved, should allow for a net profit CAGR of about 30% for 2011-15. A higher achieved market share may present further upside.
Our DCF-based target price implies 41% potential upside Our HK$10.03 TP is based on our DCF analysis which factors in CSCI’s achieving a 1% market share in public housing in 2011-15, and various margin assumptions resulting in overall net margins of 8-9% in 2011-15. Key company-specific risks include the potential failure of CSCI to achieve its market share target and any weaker-than-expected implementation of public housing plans by local governments.
4 April 2011 Strategy Asia Equities Daily Focus
Page 6 Deutsche Bank AG/Hong Kong

Asia Hong Kong Banking/Finance Banks
3 April 2011
China Merchants Bank-H Reuters: 3968.HK Bloomberg: 3968 HK Exchange: HKG Ticker: 3968
Valuation reflects superior quality, down to HoldTracy Yu Research Analyst (+852) 2203 6191 [email protected]
Judy Zhang Research Analyst (+852) 2203 6193 [email protected]
Slowing growth poses risks to premium valuation; Downgraded to Hold We downgrade our rating on CMB to Hold from Buy and lower our TP to HK$22.5 which represents 12.7x 2012E P/E (sector P/E: 8x) as CMB might not be able to sustain the 20-30% valuation premium without growing faster than its peers. Our earnings forecasts, which assume high NIM of 2.9-3%, falling CIR and credit costs of below 50bps, should grow at a CAGR of 18% from 2010-2013E. Incorporating Rmb35bn of new capital, CMB's EPS CARG will be 13%. We take CMB out from our top picks and replace it with CCB, alongside with ICBC and ABC.
Forecasts and ratios
Year End Dec 31 2009A 2010A 2011E 2012E 2013E
Pre-prov profit (CNYm) 25,286.0 38,780.0 52,512.3 56,565.2 64,781.9
Net profit (CNYm) 18,235.0 25,769.0 34,595.3 37,045.4 41,862.1
EPS (CNY) 1.08 1.27 1.48 1.48 1.67
PER (x) 12.7 13.7 11.9 11.9 10.6
Price/book (x) 3.70 2.75 2.26 1.97 1.72
DPS (net) (CNY) 0.21 0.29 0.30 0.32 0.37
Yield (net) (%) 1.5 1.7 1.7 1.8 2.1
ROE (%) 21.1 22.7 21.0 17.6 17.4Source: Deutsche Bank estimates, company data
1 DB EPS is fully diluted and excludes non-recurring items 2 Multiples and yields calculations use average historical prices for past years and spot prices for current and future years, except P/B which uses the year end close
Recommendation Change
Hold Price at 1 Apr 2011 (HKD) 20.95Price target - 12mth (HKD) 22.5952-week range (HKD) 23.50 - 17.06HANG SENG INDEX 23,802
Key changes
Rating Buy to Hold Price target 25.06 to 22.59 -9.9%Provisioning (FYE) 7,792.3 to 7,072.2 -9.2%Net int margin (FYE) 2.87 to 3.00 4.6%Net profit (FYE) 34,588.5 to 34,595.3 0.0%
Price/price relative
8
12
16
20
24
4/09 7/09 10/09 1/10 4/10 7/10 10/10 1/11China Merchants Bank
HANG SENG INDEX (Rebased)
Performance (%) 1m 3m 12mAbsolute 9.7 6.8 -2.8HANG SENG INDEX 1.7 3.3 10.5
Stock data
Market cap (HKDm) 525,370Market cap (USDm) 67,535Shares outstanding (m) 21,577.0Major shareholders China Merchants Group (12.11%)Free float (%) 67Avg daily value traded (USDm) 58.8
Key indicators (FY1)
ROE (%) 21.0Loan/deposit ratio (%) 75.6Book value/share (CNY) 7.80Price/book (x) 2.3NPL/total loans (%) 0.7Net int margin (%) 3.00Adjusted ROE (%) 0.0
In line results for FY2010; Management outlook remains positive CMB reported net profit of Rmb25.8bn in 2010, up 41% yoy. We attribute the Rmb862m (or 9.8% qoq) increase in the NPL balance in 4Q 2010 to both tighter classification standards on LGFV loans (Rmb224m downgraded), mortgage (Rmb86m) and credit card loans (Rmb70m) and a significant reduction in write-offs, of almost Rmb1bn yoy, rather than a deterioration in asset quality. Management guidance on the outlook for 2011 was positive, expecting higher NIM, sustainable fee income growth and falling CIR and stable credit costs, to meet the provision coverage ratio of 2.5% of loans by 2014.
CMB to raise capital; waiting for a better window CMB has obtained a general mandate to increase 20% of its capital. Given that CMB’s tier 1 ratio of 8.04% is lower than its peers’, we expect the bank to raise Rmb35bn of capital this year by issuing 3.5bn new shares at Rmb9.86/shr. Our new target price of HK$22.59/shr incorporates the increase in new capital.
Fair valuation, CMB’s A-share price reflects a more sustainable premium We consider CMB’s valuation, at 12.9x 2011E P/E and 2.3x 2011E P/B (ROAE for 2012E: 17.6%), to be fair and its A-share price, which trades at around a 20% discount to its H-shares, reflects a more sustainable premium of 10-20% to its peers. We value CMB based on a three-stage GGM with a near-term and terminal ROAE of 18% and 16-17% and COE of 11%. Key downside risks include a larger-than-expected equity raising at a lower price, asset quality deterioration, asymmetric rate hikes and an increase in demand deposit rates. Upside risks include stronger-than-expected NIM expansion on higher rates.
4 April 2011 Strategy Asia Equities Daily Focus
Deutsche Bank AG/Hong Kong Page 7
Asia Hong Kong Strategy Update
1 April 2011
China Macro Strategy
PMI confirms positive macro trend
Jun Ma, Ph.D Chief Economist (+852) 2203 8308 [email protected]
Wenjie Lu Research Analyst (+852) 2203 6187 [email protected]
China’s official manufacturing PMI released today (1 April) confirms the positive macro trend depicted by the HSBC PMI reported about a week ago that the growth momentum is strengthening and the inflationary pressure is easing. Specifically, the PMI rose to 53.4 in March, up 1.2ppts from February. The sub-indices of new orders and new export orders rose 0.9ppt and 1.6ppts respectively to 55.2 and 52.5. The production sub-index also recovered by 1.9ppts to 55.7. At the same time, the input price sub-index fell 1.8ppts to 68.3, indicating a slowing trend of cost inflation. Inventories of both raw materials and final products rose in March. At the macro level, these data points are supportive of our projection that yoy inflation will peak by the middle of the year and sequential (qoq, saar) GDP growth will recover to around 9% yoy in 2H, up from a relatively weaker 2Q (at around 8%). On inflation, the recent increase in inventories suggest that restocking-led PPI pressure will subside and should likely help contain CPI inflation in the second half of this year. The sectors that posted the strongest headline PMI readings are non-ferrous metal (58.6), machinery and equipment (56-58), metal products (56.1) and tobacco (56.4). The weaker sectors include paper and sports articles (46.9), petroleum processing (46.0) and ferrous metal (46.2). Looking into the details from the new orders and new export orders report, we see positive momentum for the following sectors: 1) Furniture, garment and electric machinery. Export orders sub-index for the three sectors rose by 25.1ppts (furniture), 22.6 ppts (electric machinery), and 7.2ppts (garment) in March from weak February levels which were distorted by CNY holidays. As these sectors account for about 30% of total merchandise exports, overall export growth should improve in the coming months. 2) Automobile. The new orders index for the transport sector (mainly auto) increased by a significant 4.6ppts to 59.2. This reading is now higher than the past five-year average of 58.5, indicating that the market concern of a sharp slowdown in auto demand may be overdone. 3) Machinery and equipment. Five sectors in this broad category posted their new orders index in the solid range of 55-67, with the export orders index in the range of 54-60. These numbers suggest machinery and equipment are well supported by strong domestic demand and rising export competitiveness.
4 April 2011 Strategy Asia Equities Daily Focus
Page 8 Deutsche Bank AG/Hong Kong

Asia Taiwan Technology Hardware & Equipment
1 April 2011
Acer Inc Reuters: 2353.TW Bloomberg: 2353 TT Exchange: TAI
Ticker: 2353
Downgrading to Hold on business model transitionKc Kao, MBA Research Analyst (+886) 2 2192 2831 [email protected]
Ivy Lee Research Associate (+886) 2 2192 2834 [email protected]
CEO change signals business model transitions Acer has announced that its CEO, Mr. Gianfranco Lanci, has resigned and that its Chairman, Mr. JT Wang, will assume the CEO position. We believe this signals major changes in the company’s business model and uncertainty over growth in the medium term. As a result, we are downgrading the stock to Hold and reducing our price target to NT$58. We are cutting our 2011-12E EPS by 33% and 28% respectively to reflect the transition.
Forecasts and ratios
Year End Dec 31 2009A 2010A 2011E 2012E 2013E
Sales (TWDm) 573,843.1 629,657.2 608,355.5 672,560.0 686,011.2
EBIT (TWDm) 15,341.4 18,200.8 14,053.8 17,674.9 17,652.3
Reported NPAT (TWDm) 11,354.6 15,074.4 11,403.0 14,299.9 14,297.9
DB EPS FD(TWD) 4.31 5.42 4.03 5.05 5.05
OLD DB EPS FD(TWD) 4.31 5.42 6.01 6.97 7.56
% Change 0.0% 0.0% -33.0% -27.5% -33.2%
DB EPS growth (%) -8.4 25.6 -25.6 25.4 -0.0
Yield (net) (%) 4.7 3.8 4.2 5.3 5.3
PER (x) 15.2 16.0 14.2 11.3 11.3Source: Deutsche Bank estimates, company data
1 DB EPS is fully diluted and excludes non-recurring items 2 Multiples and yields calculations use average historical prices for past years and spot prices for current and future years, except P/B which uses the year end close
Recommendation Change
Hold Price at 1 Apr 2011 (TWD) 57.10Price target - 12mth (TWD) 58.0052-week range (TWD) 98.10 - 57.10TWSE 8,705
Key changes
Rating Buy to Hold Price target 84.00 to 58.00 -31.0%Sales (FYE) 681,266 to 608,356 -10.7%Op prof margin (FYE) 3.1 to 2.3 -25.3%Net profit (FYE) 17,016.8 to 11,403.0 -33.0%
Price/price relative
50
6070
80
90
100
110
4/09 7/09 10/09 1/10 4/10 7/10 10/10 1/11Acer Inc
TWSE (Rebased)
Performance (%) 1m 3m 12mAbsolute -22.1 -36.6 -38.9TWSE -0.3 -3.0 8.6
Stock data
Market cap (TWDm) 161,623Market cap (USDm) 5,496Shares outstanding (m) 2,830.5Major shareholders Stan Shih & Family (5.4%)Free float (%) 94Avg daily value traded (USDm) 53.2
Key indicators (FY1)
ROE (%) 11.1Net debt/equity (%) -37.6Book value/share (TWD) 37.68Price/book (x) 1.52Net interest cover (x) –Operating profit margin (%) 2.3
Transitions likely lead to slower growth We believe the catalyst for Lanci’s resignation was the divergence of his views on the business model from those of other board members. Under the leadership of Lanci, Acer has focused on driving volume market share through competitive pricing. We think board members are taking the view that the business model has reached its limits (Acer has missed its guidance for two consecutive quarters). The company needs to modify its business model (e.g. invest more in R&D) to adapt to the new competitive environment (brought about by iPad). We view this as a major change which could lead to slower market share momentum and higher expenses during the transition.
Lower estimates to reflect business transition We lower our EPS to NT$4.03 for 11E (previously NT$6.01) and NT$5.05 for 12E (previously NT$6.97) as we apply more conservative assumptions to market share and OM. We now assume that Acer’s NB market share will remain flattish at 15.5-15.6% for 11E-12E and its OM will decline to 2.3%-2.6% in 11E-12E (from 2.9% in 10). We also do not factor in contributions from its new tablet PC, as we await actual sell-through data to better assess this new product.
Lowering price target to NT$58; risks: tablet PC/China business development We lower our price target to NT$58 (from NT$84) on lower earnings estimates and target P/E multiples (to reflect the company’s business transition in the medium term). Our NT$58 price target is based on 12x target P/E (mid-point of mid cycle and trough P/E) and 2H11E-1H12E EPS of NT$4.87. Key upside/downside risks are better-/worse-than-expected tablet PC developments and operations in China.
4 April 2011 Strategy Asia Equities Daily Focus
Deutsche Bank AG/Hong Kong Page 9
Asia China Utilities Utilities
1 April 2011
Beijing Enterprises Reuters: 0392.HK Bloomberg: 392 HK Exchange: HKG Ticker: 0392
Growth to accelerate; Buy
Eric Cheng, CFA Research Analyst (+852) 2203 6202 [email protected]
Michael Tong, CFA Research Analyst (+852) 2203 6167 [email protected]
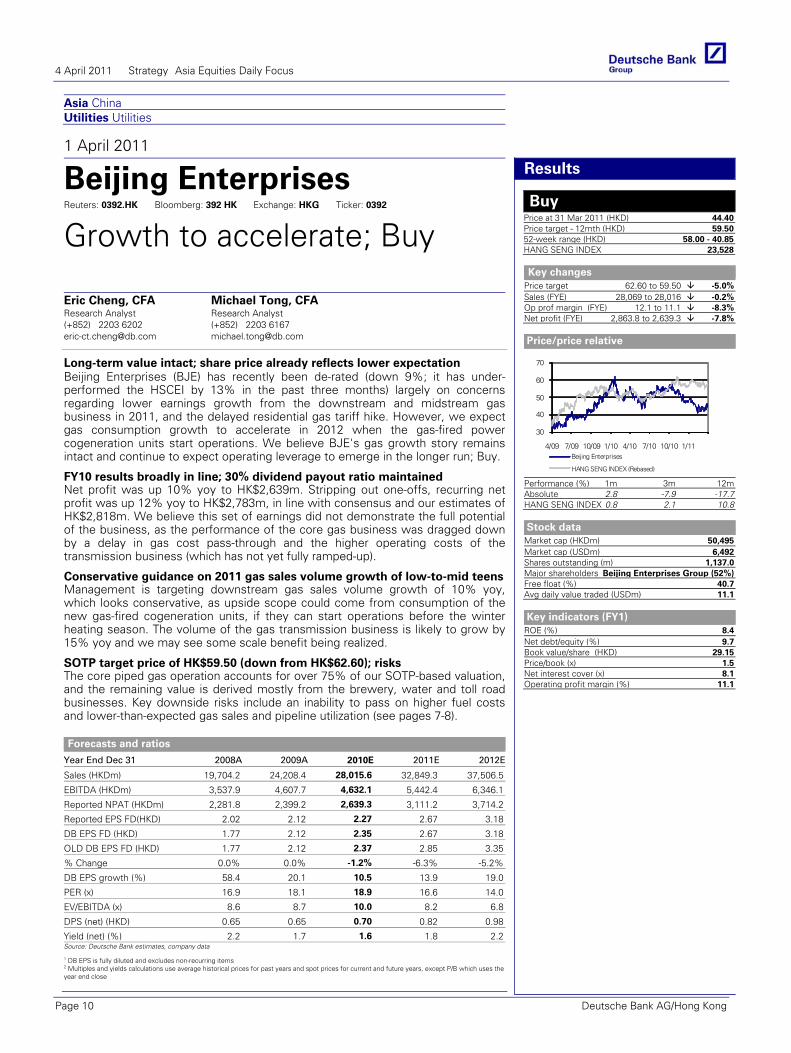
Long-term value intact; share price already reflects lower expectation Beijing Enterprises (BJE) has recently been de-rated (down 9%; it has under-performed the HSCEI by 13% in the past three months) largely on concerns regarding lower earnings growth from the downstream and midstream gas business in 2011, and the delayed residential gas tariff hike. However, we expect gas consumption growth to accelerate in 2012 when the gas-fired power cogeneration units start operations. We believe BJE's gas growth story remains intact and continue to expect operating leverage to emerge in the longer run; Buy.
Forecasts and ratios
Year End Dec 31 2008A 2009A 2010E 2011E 2012E
Sales (HKDm) 19,704.2 24,208.4 28,015.6 32,849.3 37,506.5
EBITDA (HKDm) 3,537.9 4,607.7 4,632.1 5,442.4 6,346.1
Reported NPAT (HKDm) 2,281.8 2,399.2 2,639.3 3,111.2 3,714.2
Reported EPS FD(HKD) 2.02 2.12 2.27 2.67 3.18
DB EPS FD (HKD) 1.77 2.12 2.35 2.67 3.18
OLD DB EPS FD (HKD) 1.77 2.12 2.37 2.85 3.35
% Change 0.0% 0.0% -1.2% -6.3% -5.2%
DB EPS growth (%) 58.4 20.1 10.5 13.9 19.0
PER (x) 16.9 18.1 18.9 16.6 14.0
EV/EBITDA (x) 8.6 8.7 10.0 8.2 6.8
DPS (net) (HKD) 0.65 0.65 0.70 0.82 0.98
Yield (net) (%) 2.2 1.7 1.6 1.8 2.2Source: Deutsche Bank estimates, company data
1 DB EPS is fully diluted and excludes non-recurring items 2 Multiples and yields calculations use average historical prices for past years and spot prices for current and future years, except P/B which uses the year end close
Results
Buy Price at 31 Mar 2011 (HKD) 44.40Price target - 12mth (HKD) 59.5052-week range (HKD) 58.00 - 40.85HANG SENG INDEX 23,528
Key changes
Price target 62.60 to 59.50 -5.0%Sales (FYE) 28,069 to 28,016 -0.2%Op prof margin (FYE) 12.1 to 11.1 -8.3%Net profit (FYE) 2,863.8 to 2,639.3 -7.8%
Price/price relative
30
40
50
60
70
4/09 7/09 10/09 1/10 4/10 7/10 10/10 1/11Beijing Enterprises
HANG SENG INDEX (Rebased)
Performance (%) 1m 3m 12mAbsolute 2.8 -7.9 -17.7HANG SENG INDEX 0.8 2.1 10.8
Stock data
Market cap (HKDm) 50,495Market cap (USDm) 6,492Shares outstanding (m) 1,137.0Major shareholders Beijing Enterprises Group (52%)Free float (%) 40.7Avg daily value traded (USDm) 11.1
Key indicators (FY1)
ROE (%) 8.4Net debt/equity (%) 9.7Book value/share (HKD) 29.15Price/book (x) 1.5Net interest cover (x) 8.1Operating profit margin (%) 11.1
FY10 results broadly in line; 30% dividend payout ratio maintained Net profit was up 10% yoy to HK$2,639m. Stripping out one-offs, recurring net profit was up 12% yoy to HK$2,783m, in line with consensus and our estimates of HK$2,818m. We believe this set of earnings did not demonstrate the full potential of the business, as the performance of the core gas business was dragged down by a delay in gas cost pass-through and the higher operating costs of the transmission business (which has not yet fully ramped-up).
Conservative guidance on 2011 gas sales volume growth of low-to-mid teens Management is targeting downstream gas sales volume growth of 10% yoy, which looks conservative, as upside scope could come from consumption of the new gas-fired cogeneration units, if they can start operations before the winter heating season. The volume of the gas transmission business is likely to grow by 15% yoy and we may see some scale benefit being realized.
SOTP target price of HK$59.50 (down from HK$62.60); risks The core piped gas operation accounts for over 75% of our SOTP-based valuation, and the remaining value is derived mostly from the brewery, water and toll road businesses. Key downside risks include an inability to pass on higher fuel costs and lower-than-expected gas sales and pipeline utilization (see pages 7-8).
4 April 2011 Strategy Asia Equities Daily Focus
Page 10 Deutsche Bank AG/Hong Kong

Asia Korea, Republic of Technology Hardware & Equipment
1 April 2011
LG Display Reuters: 034220.KS Bloomberg: 034220 KS Exchange: KSC Ticker: 034220
Upside potential outweighs downside risk Sc Bae Research Analyst (+82) 2 316 8907 [email protected]
Hoyer Jeong Research Associate (+82) 2 316 8912 [email protected]
Lowering target price on earnings cut; reiterating Buy on weakness We lower our target price for LGD by 7% to W43,000 on an earnings cut due to delayed demand recovery and rising concerns on cost cuts due to the Japan earthquake. However, we reiterate Buy believing that upside outweighs downside: 1) bottoming out LCD cycle in the long term due to TV demand price elasticity and potential capex cuts at the panel makers; 2) rising earnings contribution from non-commodity panels, mainly for Apple, 3) potential M/S gains in TV leveraging FPR technology, and 4) attractive valuations with 1.1x P/B vs. historical average of 1.6x.
Forecasts and ratios
Year End Dec 31 2008A 2009A 2010E 2011E 2012E
Sales (KRWbn) 16,264 20,614 25,512 26,005 27,410
EBIT (KRWbn) 1,246.8 982.7 1,310.5 1,190.9 2,006.5
EBITDA (KRWbn) 3,788 3,821 4,236 4,795 6,027
Reported NPAT (KRWbn) 1,086.9 1,027.5 1,156.3 1,140.5 1,864.4
DB EPS FD(KRW) 3,038 2,872 3,232 3,187 5,210
Price/BV (x) 0.81 1.39 1.15 1.06 0.93
ROE (%) 12.4 10.6 10.9 9.9 14.6
PER (x) 11.5 11.0 11.0 11.1 6.8Source: Deutsche Bank estimates, company data
1 DB EPS is fully diluted and excludes non-recurring items 2 Multiples and yields calculations use average historical prices for past years and spot prices for current and future years, except P/B which uses the year end close
Forecast Change
Buy Price at 1 Apr 2011 (KRW) 35,450Price target - 12mth (KRW) 43,00052-week range (KRW) 47,900 - 33,250KOSPI 2,121.01
Key changes
Price target 46,000.00 to 43,000.00 -6.5%Sales (FYE) 25,511 to 25,512 0.0%Op prof margin (FYE) 5.1 to 5.1 0.0%Net profit (FYE) 1,155.9 to 1,156.3 0.0%
Price/price relative
2400028000320003600040000440004800052000
4/09 7/09 10/09 1/10 4/10 7/10 10/10 1/11LG Display
KOSPI (Rebased)
Performance (%) 1m 3m 12mAbsolute -1.0 -10.9 -15.0KOSPI 9.4 3.4 23.4
Stock data
Market cap (KRWbn) 12,685Market cap (USDm) 11,563Shares outstanding (m) 357.8Major shareholders LG Electronics (37.9%)Free float (%) 65Avg daily value traded (USDm) 91.049
Key indicators (FY1)
ROE (%) 10.9Net debt/equity (%) 18.5Book value/share (KRW) 30,843Price/book (x) 1.15Net interest cover (x) 155.0Operating profit margin (%) 5.1
Earnings cut on delayed recovery and uncertainties regarding earthquake Our latest channel check suggests that despite some recent early signs of US TV demand recovery, the chance of meaningful panel price recovery in 2Q11 is weakening as set-makers and channels remain conservative about inventory management due to the lack of confidence in the demand. On the cost side, we are concerned that potential disruption in key components from Japan might weaken the bargaining power of panel makers vs. component makers in the near term. Reflecting these, we lower 2011/12E EPS by 29% and 11%, respectively.
Panel cycle is bottoming, two specific positives to drive distinctive recovery On the mid-to-longer term basis, we believe that the global panel industry is passing through the bottom, given: 1) panel makers are turning more conservative about capex plans and; 2) potential demand pickup in the US and emerging markets on LCD TV replacement cycle and price elasticity. In addition, we believe two company-specific positive catalysts such as FPR 3D panel and IPS based high-resolution IT panels should drive distinctive earnings recovery from 3Q11.
1.4x P/B on 2011E BVPS, risks In valuation, we continue to use a cyclical context historical P/B method where we apply 1.4x of P/B, which is a 20% discount to the historical mid-cycle multiple of 1.7x. We apply 20% discount reflecting lowered ROE profile due to slower demand growth than before. Weaker-than-expected TV demand in the US and irrational utilization rates by panel makers would be the major risks.
4 April 2011 Strategy Asia Equities Daily Focus
Deutsche Bank AG/Hong Kong Page 11

Asia ASEAN Singapore Property Property Trust
2 April 2011
Ascendas Real Estate Reuters: AEMN.SI Bloomberg: AREIT SP Exchange: SES Ticker: AEMN
Positioning for growth
Gregory Lui, CFA Strategist (+65) 6423 5958 [email protected]
Elaine Khoo, CFA Research Analyst (+65) 6423 6435 [email protected]
Look beyond near term dilution; balance sheet primed for more acquisitions AREIT's recent equity raising signals an improving outlook for acquisitions and BTS opportunities which could enhance its steady growth profile. While the time lag in the completion of asset enhancements, BTS and recent China acquisition results in near term DPU dilution, further capital deployment given its sub-optimised balance sheet could boost medium term growth. We have reduced our TP by 2% to reflect the dilution and new cost of equity assumption; maintain Buy.
Forecasts and ratios
Year End Mar 31 2009A 2010A 2011E 2012E 2013E
Sales (SGDm) 396.5 413.7 449.4 475.9 511.9
Reported NPAT (SGDm) 94.4 148.0 600.5 269.9 293.8
Reported EPS FD(SGD) 0.06 0.08 0.32 0.13 0.14
PER (x) 33.1 22.1 6.2 15.5 14.3
DPU (SGD) 0.15 0.13 0.14 0.13 0.14
Yield (%) 8.2 7.5 6.8 6.6 7.2Source: Deutsche Bank estimates, company data
1 DB EPS is fully diluted and excludes non-recurring items 2 Multiples and yields calculations use average historical prices for past years and spot prices for current and future years, except P/B which uses the year end close
Company Update
Buy Price at 1 Apr 2011 (SGD) 2.00Price target - 12mth (SGD) 2.2852-week range (SGD) 2.29 - 1.82Straits Times Index 3,120
Key changes
Price target 2.33 to 2.28 -2.1%Sales(FYE) 450 to 449 -0.0%Op prof margin (FYE) 70.3 to 70.2 -0.3%Net profit(FYE) 292.8 to 600.5 105.1%
Price/price relative
1.2
1.6
2.0
2.4
2.8
4/09 7/09 10/09 1/10 4/10 7/10 10/10 1/11Ascendas Real Estate
Straits Times Index (Rebased)
Performance (%) 1m 3m 12mAbsolute -1.0 -3.4 3.1Straits Times Index 1.7 -2.2 6.0
Stock data
Market cap (SGDm) 3,753Market cap (USDm) 2,973Shares outstanding (m) 1,875.0Major shareholders Ascendas (20.6%)Free float (%) 65Avg daily value traded (USDm) 7.3
Key indicators (FY1)
ROE (%) 19.2Net debt/equity (%) 51.4Book value/share (SGD) 1.76Price/book (x) 1.1Net interest cover (x) 4.8Operating profit margin (%) 70.2
Acquisition of Neuros & Immunos and private placement completed The private placement was 2.55x oversubscribed at an issue price of S$1.94 (S$1.91-1.96 price range) or a 5.3% disc to the VWAP. Out of net proceeds of S$393.3m, S$126.2m will be used to repay ST borrowings used to fund the acquisition of Neuros & Immunos, S$35.9m for AREIT’s 11th BTS project, S$97m for ongoing AEIs, and S$117.6m for the forward purchase of the China business park property and the remainder for general working capital. We estimate a blended weighted average NPI yield on cost of around 7.5% for these projects compared to the implied cost of equity of c.7% based on the placement price.
Revising down FY12e DPU by 4%; conservative balance sheet position This reflects the dilution from the placement and staggered timing of income contribution from the various initiatives (from 1QFY12 to 2QFY13). AREIT announced a revaluation gain of S$307.6m (+6.3%) which together with the EFR brings gearing down from 34.7% to 30.1% accounting for all committed capex which is among the lowest vs. peers and should give it the flexibility and competitive edge in acquisitions. Mgmt is in discussion on a potential acquisition of a portfolio of properties of around S$200m (this brings gearing to 34%) which may be completed in the next 3-6 months. We have assumed a 7.0% acquisition yield in our forecast; additional acquisitions could provide a further boost to DPU.
Maintain Buy with revised TP of S$2.28; risks We revise our DDM-pegged target price from S$2.33 to S$2.28 (-2%) reflecting our revisions to earnings and Cost of Equity assumption (7.0% to 7.25%). AREIT is trading at 1.13x P/B (LT avg of 1.33x) and offering FY11e and FY12e yield of 6.8% and 6.6% respectively implying a 410bps spread for FY12. Risks: reversal of growth trends affecting leasing demand, credit risk from tenants on long sale & leaseback, development risk and acquisition risk.
4 April 2011 Strategy Asia Equities Daily Focus
Page 12 Deutsche Bank AG/Hong Kong

North America United States Strategy Update
31 March 2011
US Equity Strategy
Q1 2011 Earnings Preview
Binky Chadha Chief Strategist (+1) 212 250-4776 [email protected]
Keith Parker Strategist (+1) 212 250-7448 [email protected]
Parag Thatte Strategist (+1) 212 250-6605 [email protected]
Ju Wang Strategist (+1) 212 250-7911 [email protected]
What is Expected for Q1? ................................ Page 02Undemanding Bar for Q1 ................................. Page 03Risks Appear Priced In?.................................... Page 09What to Buy?.................................................... Page 11Views & Strategy Summary ............................. Page 22
Bar for Q1 earnings is low
121314151617181920212223
Q2
09
Q3
09
Q4
09
Q1
10
Q2
10
Q3
10
Q4
10
Q1
11
121314151617181920212223
Surprise
Consensus EPS
S&P 500 Quarterly Operating EPS ($)
Sales growth taking over from margins
-50%-40%-30%-20%-10%
0%10%20%30%40%50%
Dec
-97
Dec
-99
Dec
-01
Dec
-03
Dec
-05
Dec
-07
Dec
-09
Dec
-11
-50%-40%-30%-20%-10%0%10%20%30%40%50%
Recessions Sales MarginsS&P 500 ex Financials sales and margins yoy
Q1 margins look low given seasonality
-250 -150 -50 50 150
Materials Utilities
Telecom Healthcare Financials
Energy Cons Disc
Ex-FinancialsS&P 500
Cons Stap Industrials
Info Tech
-250 -150 -50 50 150
Q1 2011 Consensus
Historical Median
Q1 2011 Op EPS margin qoq consensus vs historical median for Q1 (since 1997, bps)
Q1 earnings should beat again (4%); affirmation of 2011 outlooks the key Already skeptical of sales & margin prospects, investors are looking to Q1 earnings to gauge whether the costs of the recent shocks (Middle East & Japan) can be absorbed by the recovery. We think Q1 earnings will beat again, but by a smaller amount: higher oil/commodity prices and costs of supply disruptions should be offset by already low margin expectations and other drivers of margins which remain supportive (improving pricing power, trailing labor costs & operating leverage). Additionally, we expect greater variation in results across sectors/stocks as micro continues to take over from macro. Guidance will remain conservative but we think 2011 earnings will be reaffirmed in the aggregate and CEO outlooks stay upbeat. We note that on current multiples, 2011 estimates imply 1480 for the S&P 500 by YE. Prior to the Middle East and Japan events, the multiple had been rising back toward fair value (16.4x) and this would add another 70 points.
Undemanding bar should offset higher oil/commodity price & Japan supply The consensus expects S&P 500 EPS to fall 3.4% qoq in a seasonally weak Q1. Sales growth appears reasonable, in-line with nominal GDP. Margin expectations are low once again. Consensus has predicted declines in margins for the last 6 quarters that have not materialized; margins are expected to decline 22bps in Q1 when they typically rise by 20bps. Top-down margin drivers point to modest upside. We estimate that rising pricing power (+40bps), declining ULC (+25bps), operating leverage (+15bps) will be sufficient to offset higher energy and material costs (-60 bps). The impact of Japan should be limited and industry specific. Across sectors, Financials could beat big given flat rates/better FICC in Q1 and low expectations. Tech estimates look low even with supply chain issues while Telecom and Utilities look high.
Expect continued conservative guidance, risks appear to be priced in Guidance/charges related to higher oil/commodity prices and Japan/supply issues could pose headline risk. However, the P/E is 20% below pre-recession levels at a stage of the recovery by which it typically has recovered fully.
Buy growth, sales upside, sector pairs, quality, payouts Earnings growth tends to remain above trend through this part of the cycle, with sales taking over from margins as the driver of growth. Heading into Q1 earnings, we reiterate our sector pair trades (Financials/Staples, Industrials/Utilities, Tech/ Telecom, Energy/Materials) which: (i) are up YTD; (ii) outperformed through last 4 earnings seasons; (iii) are positioned for the biggest sales upside; and (iv) hedge against oil/commodity price moves. Across stocks, high quality and firms doing big buybacks beat estimates the most in 2010 (buy DBUSQLTE and DBUSPAYE baskets). Growth stocks have been rewarded the most on beats; we highlight our Growth (DBUSGROW) basket. All 3 baskets outperformed notably in March.
4 April 2011 Strategy Asia Equities Daily Focus
Deutsche Bank AG/Hong Kong Page 13

Global
31 March 2011
Exchange Rate Perspectives
FX Intervention Can Brake, Not Break, a Trend
Special Report
Research Team
John Horner Strategist (+61) 2 8258 2130 [email protected]
Mirza Baig Strategist (+65) 64235930 [email protected]
Fore
ign
Exc
han
ge
4 April 2011 Strategy Asia Equities Daily Focus
Page 14 Deutsche Bank AG/Hong Kong

Asia
01 Apr 2011 - 04:15:18 PM HKT
ASIA ECONOMICS SPECIAL EconomicsSBV raises the 7-day repo rate
The State Bank of Vietnam (SBV) raised its 7-day repo rate to 13% from12%, effective today. The rate was last hiked in late February, to 12% from11%, along with the refinancing and discount rates. In our view, today's ratehike highlights the SBV's commitment to curbing inflation, despite its neg-ative impact on growth. GDP growth slowed more than expected in Q12011, to 5.4% from 7.2% in Q4 2010, while headline CPI inflation continuedto head higher, to 13.9% in March from 12.3% in February. We expectinflation to head higher, at least well into the summer, as commodity andoil prices remain high. Note that the authorities raised prices of petrol,diesel, kerosene, fuel oil by 10%, 15% and 14% and 14%, respectively, thisweek. On the fiscal front, the authorties are preparing a list of none-coreinvestment projects to be cut, to achieve balanced growth. The governmentaims to bring down the 2011 budget deficit to below 5% of GDP from the5.3% aimed earlier. We think a more aggressive, concrete fiscal consolida-tion plan would go a long way in curbing inflationary expectations andfurther building public's confidence in the dong. While we are more confi-dent about the government's commitment to reducing budget deficit -- firsttime that the National Assembly identified inflation as the policy prioritywithout any reference to growth -- there are some concerns with respectto the pace of implementation due to the timing of ministerial reshuffling,which is scheduled to take place in mid-year. Until then, much of the burdenof macro-economic policy tightening may remain with the SBV.
Juliana LeeSenior Economist(+852) 2203 [email protected]
4 April 2011 Strategy Asia Equities Daily Focus
Deutsche Bank AG/Hong Kong Page 15

Asia
1 April 2011
Asia Economics Daily
High but stable inflation in Asia
Michael Spencer, Ph.D Chief Economist, Asia (+852) 2203 8303 [email protected]
Jun Ma, Ph.D Chief Economist, Greater China (+852) 2203 8308 [email protected]
Taimur Baig, Ph.D Chief Economist, India (+65) 6423 8681 [email protected]
Juliana Lee Senior Economist (+852) 2203 8312 [email protected]
Kaushik Das Economist (+91) 22 6658 4909 [email protected]
Eco
no
mic
s
HIGHLIGHTS
China – Official PMI confirms positive macro trend India – Exports growth accelerates sharply in February Indonesia – Inflation remains high but stable; Trade surplus widens in February, to USD2.4bn South Korea – March inflation reach 4.7%yoy, breaching central bank target; Trade activities remain strong during March Thailand – Inflation rises to 3.1%yoy in March, in line with consensus
NEWS IN BRIEF
CHINA PMI (Mar). China’s official manufacturing PMI released today confirms the positive macro trend depicted by the HSBC PMI reported about a week ago: growth momentum is strengthening while inflationary pressure is easing. Specifically, the PMI rose to 53.4 in March, up 1.2ppts from February. The sub-indices of new orders and new export orders rose 0.9ppt and 1.6ppts respectively to 55.2 and 52.5. The production sub-index also recovered by 1.9ppts to 55.7. At the same time, the input price sub-index fell 1.8ppts to 68.3, indicating a slowing trend of cost inflation. Inventories of both raw materials and final products rose in March.
At the macro level, these data points are supportive of our projection that yoy inflation will peak by the middle of the year and sequential (qoq, saar) GDP growth will recover to around 9% yoy in H2, up from a relatively weaker Q2 (at around 8%). On inflation, the recent increase in inventories suggest that restocking-led PPI pressure will subside and should thus help contain CPI inflation in the second half of this year.
The sectors that posted the strongest headline PMI readings are non-ferrous metal (58.6), machinery and equipment (56-58), metal products (56.1) and tobacco (56.4). The weaker sectors include paper and sports articles (46.9), petroleum processing (46.0), and ferrous metal (46.2).
Looking into the details from the new orders and new export orders report, we see positive momentum for the following sectors:
1) Furniture, garment and electric machinery. These three sectors saw their export orders sub-index rising by 25.1ppts (furniture), 22.6 ppts (electric machinery), and 7.2ppts (garment) in March, from the weak Feb levels which were distorted by the CNY holiday. As these sectors account about 30% of total merchandise exports, overall export growth should improve in the coming months.
4 April 2011 Strategy Asia Equities Daily Focus
Page 16 Deutsche Bank AG/Hong Kong

2) Automobiles. The new orders index for the transport sector (mainly autos) increased by a significant 4.6ppts to 59.2. This reading is now higher the past 5 years’ average of 58.5. This indicates that market concerns of a sharp slowdown in auto demand may be overdone.
3) Machinery and equipment sectors. Five sectors in this broad category posted their new orders index in the very impressive range of 55-67, with the export orders index in the range of 54-60. These numbers suggest the machinery and equipment are well supported by strong domestic demand as well as rising export competitiveness.
In sum, we continue to believe that China’s macro outlook is improving as the reduced inflation pressure will lead to less aggressive policy tightening. At the sector level, in addition to property, banking, and materials that should benefit from the receding macro risks in the coming months, today’s PMI report also suggests that exporters, autos, and machinery will likely perform better than market expectations.
INDIA External trade (Feb). Exports rose by 49.7%yoy in February, following 32.4% rise in January. Imports rose by 21.2% in February as compared to 13.1% in January. Within the segment, non-oil imports surged by 31.0% in February, higher than 23.8% growth reported in January, reflecting firm domestic demand. Meanwhile, oil imports fell at a much slower pace of 0.3% in February vs. 7.8% decline reported in January. As a result of both strong exports and imports growth, the trade deficit stood almost stable at USD8.1bn (-USD8.0bn) in the month. Exports in absolute terms reached USD209bn in the first eleven months of FY2010/11, surpassing government’s target of USD200bn. Looking ahead, we expect strong exports growth to continue led by robust demand from US/Euro land as well as from regional partners.
INDONESIA CPI inflation (Mar). Thanks to sharply declining food prices (-1.9%mom, +13.6%yoy), Indonesia’s elevated inflation trajectory witnessed a mild relief in March, with headline inflation easing to 6.7%yoy, 0.1% lower than the previous month. Other than food prices easing, the remaining items in the CPI showed continued, moderate, upward movement (notably processed food, +0.3%mom, +5.6%yoy, and clothing, +0.4%mom, +7.7%yoy). Core inflation edged up to 4.5%.
Today’s data show that inflation remains high but stable in Indonesia for now, as administrative prices remain frozen. When and as petrol, LPG, electricity, toll, and transportation tariffs are adjusted, inflation would rise by another 200bps, on our estimates. This risk, combined with historically strong demand side pressure, should keep Bank Indonesia concerned. But we have seen ample indication from the central bank this year that it would act only after a sudden outbreak of inflation. Hence we expect no movement on monetary policy this month.
External trade (Feb). Exports rose by 28.9%yoy in February, up from 26.0% (revised) reported in January. By category, both oil and non-oil exports growth improved to 17.6% and 31.7% respectively in February, from 11.5% and 29.6% in January. With imports rising at a slower pace of 26.3% in February vs. 32.3% in January, the trade surplus widened from USD2.0bn to USD2.4bn in the same period. During the first two months of the year exports were up by 27.5% quite similar to the 28.6% average growth reported in H2. We expect strong exports growth to continue in the period ahead supported by robust demand from US and other emerging markets.
SOUTH KOREA CPI inflation (Mar). Inflation rose to a 29-month high of 4.7%yoy in March, up from 4.5% in February. By category, this was largely led by transport, inflation of which rose to 7.9% in March up from 6.6% in February, resulting from higher prices of the gasoline. Also, housing inflation rose at a faster pace of 4.1% in March, as compared to 3.7% in February. Meanwhile, food inflation still remained at elevated level, rising by 10.9% in March, albeit lower than 12.2% reported in February. Core inflation, which excludes volatile food and energy components rose further in March, to 3.3% from 3.1% in February, suggesting resilient domestic demand. Given the sharply rising international energy/commodity prices, we expect CPI inflation to remain above 4% for some time (averaging 4% in 2011), and thereby keeping the BoK on the path of monetary tightening, especially as housing prices in Seoul continue to recover.
External trade (Mar). Exports rose by 30.3%yoy in March, compared to 16.9% (revised down from 17.9%) in February. This was led by volatile vessel exports, which rose by 18.2% in March sharply reversing from 10.0% decline reported in February. On the other hand, both petroleum (56.7% in Mar vs. 58.2% in Feb) and steel (36.1% vs. 37.7%) witnessed stable export growth in the month. However, exports of electric and electronic goods plunged by 2.3% in March, against 5.5% growth in
4 April 2011 Strategy Asia Equities Daily Focus
Deutsche Bank AG/Hong Kong Page 17
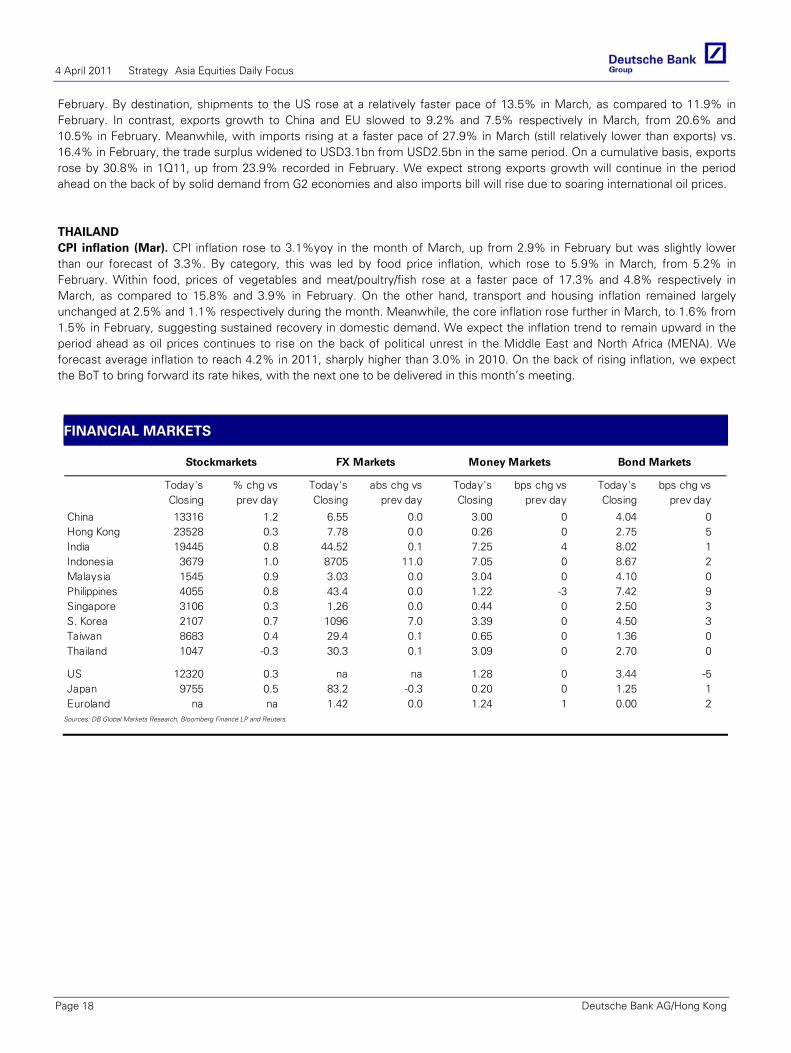
February. By destination, shipments to the US rose at a relatively faster pace of 13.5% in March, as compared to 11.9% in February. In contrast, exports growth to China and EU slowed to 9.2% and 7.5% respectively in March, from 20.6% and 10.5% in February. Meanwhile, with imports rising at a faster pace of 27.9% in March (still relatively lower than exports) vs. 16.4% in February, the trade surplus widened to USD3.1bn from USD2.5bn in the same period. On a cumulative basis, exports rose by 30.8% in 1Q11, up from 23.9% recorded in February. We expect strong exports growth will continue in the period ahead on the back of by solid demand from G2 economies and also imports bill will rise due to soaring international oil prices.
THAILAND CPI inflation (Mar). CPI inflation rose to 3.1%yoy in the month of March, up from 2.9% in February but was slightly lower than our forecast of 3.3%. By category, this was led by food price inflation, which rose to 5.9% in March, from 5.2% in February. Within food, prices of vegetables and meat/poultry/fish rose at a faster pace of 17.3% and 4.8% respectively in March, as compared to 15.8% and 3.9% in February. On the other hand, transport and housing inflation remained largely unchanged at 2.5% and 1.1% respectively during the month. Meanwhile, the core inflation rose further in March, to 1.6% from 1.5% in February, suggesting sustained recovery in domestic demand. We expect the inflation trend to remain upward in the period ahead as oil prices continues to rise on the back of political unrest in the Middle East and North Africa (MENA). We forecast average inflation to reach 4.2% in 2011, sharply higher than 3.0% in 2010. On the back of rising inflation, we expect the BoT to bring forward its rate hikes, with the next one to be delivered in this month’s meeting.
FINANCIAL MARKETS
Today's % chg vs Today's abs chg vs Today's bps chg vs Today's bps chg vsClosing prev day Closing prev day Closing prev day Closing prev day
China 13316 1.2 6.55 0.0 3.00 0 4.04 0Hong Kong 23528 0.3 7.78 0.0 0.26 0 2.75 5India 19445 0.8 44.52 0.1 7.25 4 8.02 1Indonesia 3679 1.0 8705 11.0 7.05 0 8.67 2Malaysia 1545 0.9 3.03 0.0 3.04 0 4.10 0Philippines 4055 0.8 43.4 0.0 1.22 -3 7.42 9Singapore 3106 0.3 1.26 0.0 0.44 0 2.50 3S. Korea 2107 0.7 1096 7.0 3.39 0 4.50 3Taiwan 8683 0.4 29.4 0.1 0.65 0 1.36 0Thailand 1047 -0.3 30.3 0.1 3.09 0 2.70 0
US 12320 0.3 na na 1.28 0 3.44 -5Japan 9755 0.5 83.2 -0.3 0.20 0 1.25 1Euroland na na 1.42 0.0 1.24 1 0.00 2
Stockmarkets FX Markets Money Markets Bond Markets
Sources: DB Global Markets Research, Bloomberg Finance LP and Reuters
4 April 2011 Strategy Asia Equities Daily Focus
Page 18 Deutsche Bank AG/Hong Kong

ECONOMIC DIARY Country Release Period DB Expected Consensus Actual Previous
Monday, Mar 28Taiwan Leading Indicator Feb-MoM 0.2% NA 0.0% 0.1%Thailand Manufacturing Production Feb-YoY 1.8% 3.8% -3.4% 4.1%Vietnam Exports (ytd) Mar-YoY 43.9% NA 33.7% 40.3%
Imports (ytd) Mar-YoY 26.8% NA 23.8% 26.8%Trade Balance (ytd) Mar -USD2.4bn NA -USD3.1bn -USD1.8bn
Tuesday, Mar 29Philippines Industrial Production (Vol) Jan-YoY NA 25.8% 15.3%South Korea Current Account Balance Feb USD1.0bn NA USD1.2bn USD0.2bnVietnam GDP Q1-YoY 6.3% NA 5.4% 7.2%
Industrial Production (ytd) Mar-YoY 15.0% NA 14.1% 14.6%Retail Sales (ytd) Mar-YoY 24.0% NA 22.6% 23.7%
Wednesday, Mar 30Sri Lanka GDP Q4-YoY 7.7% 8.0% 8.6% 8.0%
Thursday, Mar 31Hong Kong Retail Sales (Value) Feb-YoY 6.6% 18.5% 8.6% 28.1%
Retail Sales (Volume) Feb-YoY 3.1% 13.8% 5.1% 23.6%Singapore Bank Credit Feb-YoY 16.3% NA 17.3% 16.1%South Korea Industrial production Feb-YoY 14.8% 9.6% 9.1% 13.4%
Service Industry Output Feb-YoY 3.9% NA 0.2% 4.6%Sri Lanka CPI Mar-YoY 8.9% 8.9% 8.6% 7.8%
Exports Jan-YoY 40.8% NA 72.4% 33.9%Imports Jan-YoY 11.6% NA 21.3% 30.8%Trade Balance Jan -USD0.6bn NA -USD0.7bn -USD0.5bn
Thailand Current Account Balance Feb USD1.2bn USD2.9bn USD3.8bn USD1.1bnEvents and Meeting:Taiwan:CBC Meeting (rate hike by 12.5bps to 1.75%)
Friday, Apr 1India Exports Feb-YoY 50.0% NA 49.7% 32.4%
Imports Feb-YoY 21.0% NA 21.2% 13.1%Trade Balance Feb -USD8.1bn NA -USD8.1bn -USD8.0bnCurrent Account Balance Q4 -USD7.0bn -USD9.2bn -USD9.7bn -USD16.8bn
Indonesia CPI Mar-YoY 7.0% 7.0% 6.7% 6.8%Exports Feb-YoY 25.0% 26.8% 28.9% 26.0%Imports Feb-YoY 30.0% 33.5% 26.3% 32.3%Trade Balance Feb USD1.6bn USD1.7bn USD2.4bn USD2.0bn
South Korea CPI Mar-YoY 4.8% 4.8% 4.7% 4.5%Core CPI Mar-YoY 3.5% NA 3.3% 3.1%Exports Mar-YoY 18.0% 20.1% 30.3% 16.9%Imports Mar-YoY 18.0% 21.5% 27.9% 16.4%Trade Balance Mar USD2.1bn USD1.9bn USD3.1bn USD2.5bn
Thailand CPI Mar-YoY 3.3% 3.1% 3.1% 2.9%Core CPI Mar-YoY 1.9% 1.5% 1.6% 1.5%FX Reserves Mar USD181.5bn USD179.2bn
Monday, Apr 4Indonesia FX Reserves Mar USD99.6bnSouth Korea FX Reserves Mar USD297.7bnTaiwan FX Reserves Mar USD390.7bn
Tuesday, Apr 5Malaysia Exports Feb-YoY 0.8% 5.0% 3.0%
Imports Feb-YoY 4.0% 14.4% 13.5%Trade Balance Feb MYR10.6bn MYR8.9bn MYR9.2bn
Philippines CPI Mar-YoY 4.5% 4.5% 4.3%Core CPI Mar-YoY 3.7% NA 3.5%
Events and Meeting:Australia:RBA Meeting
Wednesday, Apr 6Taiwan CPI Mar-YoY 2.1% 1.7% 1.3%
Core CPI Mar-YoY 1.3% NA 0.8%
Thursday, Apr 7Malaysia FX Reserves Mar USD109.8bnPhilippines Gross International Reserves Mar USD64.0bnSingapore FX Reserves Mar USD230.9bnEvents and Meeting:Japan:BoJ Meeting
Friday, Apr 8No major data release
Sources: DB Global Markets Research, Bloomberg Finance LP and Reuters
4 April 2011 Strategy Asia Equities Daily Focus
Deutsche Bank AG/Hong Kong Page 19

Asia
1 April 2011
Asia Rates Strategy Taking stock of issuance
Market Update
Research Team
Sameer Goel Strategist (+65 ) 64236973 [email protected]
Linan Liu Strategist (+852) 2203 8709 [email protected]
Arjun Shetty Strategist (+65) 6423 5925 [email protected]
2011 local currency government bond
issuance – year/year change
-40%
-20%
0%
20%
40%
60%
THB TWD INR CNY KRW SGD HKD PHP IDR MYR
Gross Net
Source: Deutsche Bank, CEIC, Bloomberg Finance LP
*Calendar 2011 for all countries except HK and India (Apr11 to Mar12) and Thailand (Oct10-Sep11)
Offshore purchases of local currency
bonds in Asia-5*
-20
-15
-10
-5
0
5
10
15
20
F-07 J-07 O-07 F-08 J-08 O-08 F-09 J-09 O-09 F-10 J-10 O-10 F-11
USD bn
Source: Deutsche Bank, CEIC, BNM, FSS, SEBI, Bank Indonesia
*India, Indonesia, Korea, Malaysia, Thailand. Includes corporate bonds in IN, KR and MY.
As we enter the second quarter for the year, we take a stock check of the issuance scenario year to date for local currency government bonds in Asia, and put forth our projections for supply of duration in Q2. A few observations at the outset:
Inspite of a challenging interest rate environment, government debt managers in Asia have by and large kept to their issuance plans, and have met what is in several cases a front loaded target for supply.
After a period of some reversal and uncertainty towards the end of 2010, offshore purchases of local currency bonds have picked up again this year, though still running at only around 60% of the pace from Q3 2010. This is particularly striking because data on dedicated EM index driven funds suggests one of the weakest quarters for inflows in the past 9 years.
In several markets in the region (most notably Malaysia), supply pressures will get more acute this quarter, as issuers try lengthening their maturity profile and taking advantage of relatively flat curves.
2011 LOCAL CURRENCY Government Bond Issuance Tally
Source: Deutsche Bank, CEIC, Bloomberg Finance LP
*Corresponding period in 2010 **Fiscal year starting April 2011 ***Fiscal year starting October 2010
Notes: (1) China includes CGBs, local government bonds and savings bonds. (2) HK includes Exchange Fund Notes and government bonds, excludes EF bills (3) India includes central government bonds only. (4) Indonesia includes FR, VR, T-bills, ORI, sukuks and private placements. Maturities include buybacks. (5) Korea includes KTB and KTBi, excludes MSBs. (6) Malaysia includes MGS, GII and syariah savings bonds. (7) Philippines includes T-bonds and retail bonds only. Excludes multi currency OFW bonds. (8) Singapore includes SGS and 1Y T-bills. (9) Taiwan includes TGBs, excludes T-bills. (10) Thailand includes loan bonds only.
2011 Full Year Gross Issuance Year to Date
Gross Maturities Net YTD As of % YTD % YTD 2010*
China CNY bn 1478 578 900 266 1-Apr 18% 12%
HK** HKD bn 37.5 20.5 17.0 0.0 1-Apr
India** INR tn 4.17 0.74 3.43 0.0 1-Apr
Indonesia IDR tn 173.7 74.0 99.7 56.1 1-Apr 32% 36%
Korea KRW tn 82.4 46.3 36.1 21.9 1-Apr 27% 34%
Malaysia MYR bn 91.9 45.3 46.6 24.5 1-Apr 27% 31%
Philippines PHP bn 597.3 306.0 287.3 29.7 31-Jan 5% 14%
Singapore SGD bn 22.8 18.7 4.1 7.4 1-Apr 32% 27%
Taiwan TWD bn 580.0 298.0 282.0 185.0 1-Apr 32% 36%
Thailand*** THB bn 400.0 161.0 239.0 171.4 1-Apr 43% 49%
4 April 2011 Strategy Asia Equities Daily Focus
Page 20 Deutsche Bank AG/Hong Kong

Asia
1 April 2011
Asia Local Markets Weekly Pick up in inflows
Strategy Update
Table of Contents Summary Market Views ................................... Page 02Economics........................................................ Page 03Fixed Income Strategy ..................................... Page 04Foreign Exchange Strategy .............................. Page 13Economic Diary ................................................ Page 15Bond Supply Monitor ....................................... Page 16Monetary Policy Monitor.................................. Page 17Local Markets Analytics ................................... Page 18Asian Economic Indicators ............................... Page 23
Research Team
Sameer Goel Strategist (+65 ) 64236973 [email protected]
Mirza Baig Strategist (+65) 64235930 [email protected]
Linan Liu Strategist (+852) 2203 8709 [email protected]
Arjun Shetty Strategist (+65) 6423 5925 [email protected]
Michael Spencer, Ph.D Chief Economist (++852) 22038303 [email protected]
Dennis Tan Strategist (+65) 6 423-5347 [email protected]
Str
ateg
y
Economics: Asian exports appear to be growing much more quickly in Q1 than they were in Q4 2010 – measured on a QoQ(saar) basis. Investors who look only at YoY growth rates may fail to recognize that the external impetus to growth is almost as strong as it was during the peak of the recovery from the global recession in 2009. We also update our Taylor Rule models for Asia.
Asia bond supply: As we enter the second quarter for the year, we take a stock check of the issuance scenario year to date for local currency government bonds in Asia, and put forth our projections for supply of duration in Q2. A few observations at the outset
In spite of a challenging interest rate environment, government debt managers in Asia have by and large kept to their issuance plans, and have met what is in several cases a front loaded target for supply.
After a period of some reversal and uncertainty towards the end of 2010, offshore purchases of local currency bonds have picked up again this year, though still running at only around 60% of the pace from Q3 2010. This is particularly striking because data on dedicated EM index driven funds suggests one of the weakest quarters for inflows in the past 9 years.
In several markets in the region (most notably Malaysia), supply pressures will get more acute this quarter, as issuers try lengthening their maturity profile and taking advantage of relatively flat curves
FX: Equity inflows to Asia are turning up; USD/KRW range has broken down and central banks' "lines in sand" elsewhere are likely to come under pressure in coming days. We add short USD/THB to our list of Asia FX recommendations.
4 April 2011 Strategy Asia Equities Daily Focus
Deutsche Bank AG/Hong Kong Page 21

Asia Corporate Credit
1 April 2011
Asia Credit Weekly
A brief review of 1Q 2011
Market Update
Table of Contents Credit opinion & top movers ........................... Page 2-3Key research & news ....................................... Page 04New issue monitor ........................................... Page 07Research catalogue .......................................... Page 10
Research Team
Gene Cheon Research Analyst (+65) 64236967 [email protected]
Jacphanie Cheung Research Analyst (+852) 2203 5930 [email protected]
Devinda Paranathanthri Research Analyst (+65) 64235718 [email protected]
Mathura Yogarajah Research Analyst (+65) 6 423-5721 [email protected]
Marie-Anne Garcia Research Analyst (+65) 6 423 5726 [email protected]
Weekly top-movers (IG)
11
9
8
6
6
-12
-13
-14
-18
-19
POHANG 4.25 '20
PETMK 7.88 '22
ICICI 6.63 '12
KORELE 5.25 '12
KORGAS 4.25 '20
KDB 4.38 '15
NOBLSP 8.50 '13
PETMK 4.25 '14
AXSBIN 4.75 '16
WOORIB 7.00 '15
Change in ASW (bp)
Weekly top-movers (HY)
3.5
3.5
2.3
2.1
2.0
-0.5
-0.6
-1.0
-1.0
-1.5
RNHEF 13.00 '16
RNHEF 11.75 '15
ROADKG 9.50 '15
EVERRE 13.00 '15
KAISAG 13.50 '15
PLNIJ 7.75 '20
STATSP 7.50 '15
PLNIJ 8.00 '19
BTELIJ 11.50 '15
CHINSC 10.50 '16
Change in mid-price
Source : Deutsche Bank
Co
rpo
rate
Cre
dit
As we come to the end of the first quarter, we take a minute to recap on the performance of the Asia ex-Japan credit. For most of 1Q, Asia has underperformed the spread movement globally and to a large extent this has been driven by the high yield market. Technical factors may have played a major role driving the movement. As of year-to-date, the cumulative inflows to EM debt funds stand at just 0.06% of AUM. With the exception of 2009, this represents the weakest start of any year in the past nine years. Additionally, there has been no slowdown in issuance this year, with total year-to-date issuance reaching US$20.4bn. However, despite the geo-political tensions in the MENA region and the Japan earthquake, credit markets overall have been resilient supported by strong liquidity in the market. We have not seen a knee-jerk reaction in Asia as a result of these events. On the fundamental side, full year results have shown strong improvement in-line with our expectations.
Going into the specifics, much of the movement in HY is attributable to the China property sector. Ongoing concerns relating to supply and policy concerns continue to be an overhang on the sector in the near term. Therefore, the sector has underperformed other bonds year-to-date (see figure 2). The key outperformers in HY have mostly been the Indonesian corporates. Asia IG has performed relatively better compared to HY. One reason could be the fact that issuance in the space has been somewhat slow in the first quarter, particularly in the banking sector. On the back of this, performance in IG has been driven by the banks.
This week has been dominated by various results announcements. In the property space, our top-pick Evergrande reported strong results with revenue growing more than 8x. This should reassure investors on its ability to deliver projects. In the Indon space, results from Gajah, Bumi and Indika are also in line with our expectations. The pipeline of new issues has built up over the past week. In the high yield space, Fufeng, Winsway and Uniflora have announced new issues. In the IG space, Franshion, POSCO, Hana and Woori are looking to come to the market.
This week’s highlights: West China Cement: Initiating with a CreditHold recommendation
Indika Energy: Maintain CreditHold on INDYIJ’12 and INDYIJ’16
Gajah Tunggal : FY10 results-managing volatile raw material prices
True Move Ltd : Right on track for 3G expansion
4 April 2011 Strategy Asia Equities Daily Focus
Page 22 Deutsche Bank AG/Hong Kong

North America United States
1 April 2011
US Daily Economic Notes
Solid employment growth to beget wage inflation 4
Eco
no
mic
s
Economic ResearchResearch TeamJoseph A. LaVorgna Chief US Economist 212 250-7329 [email protected]
Carl J. Riccadonna Senior US Economist 212-250-0186 [email protected]
Brett Ryan Economist 212-250-6294 [email protected]
Policy Speeches
9:05 am Atlanta Fed President Lockhart (non-voter) speaks on the U.S. economy in West Palm Beach, FL 9:30 am Chicago Fed President Evans (voter) speaks on the role of government in financial literacy at Money Smart Week in Chicago, IL 3:15 pm Chicago Fed President Evans (voter) speaks with Maria Bartiromo on CNBC about the economy and monetary policy in Chicago, IL 7:15 pm Fed Chairman Bernanke speaks on clearinghouses and financial stability at the Atlanta Fed’s 2011 financial markets conference in Stone Mountain, GA
Year End TargetsReal GDP growth: +4.1% Q4/Q4 Core PCE deflator: +2.1% Q4/Q4 Unemployment rate: 7.8% Fed Funds: 0.50%
Fed Policy
We expect fed funds to be range-bound between 0-25 bps through Q3 2011. The Fed is projected to hike rates to 0.50% in Q4 2011.
Post Employment Conference Call Replay # : (800) 642-1687 or (706) 645-9291 Int’l Conference ID: 29101415
150
Monday Release Forecast Previous Consensus There are no major economic data releases scheduled for today Source: Deutsche Bank, Bloomberg Finance LP
Commentary for Monday: March payrolls rose 216k compared to 194k in February, while the unemployment rate fell another tenth to 8.8%. Private sector hiring once again outperformed the headline rising 230k vs. 240k (revised up from 222k) previously. Thus, private sector job growth in the first quarter of the year was the strongest since Q1 2006. Goods producing employment rose 31k as manufacturing rose 17k (vs. 32k previously); and the service sector logged a gain of 199k (vs. 167k previously). Unsurprisingly, construction employment remained soft (-1k), and government layoffs (-14k) continued entirely as a result of layoffs at the local level (-15k). The length of the workweek was unchanged (at 34.3 hrs) following an upward revision to February. While some analysts may cite the one-tenth decline in the manufacturing workweek (to 40.5 hrs) as reason for concern, this sector added the most jobs in Q1 since the mid-1990s, so we are inclined to believe that this merely reflects a normalization of the number of hours for the existing workforce as new employees are being added. Case in point, aggregate hours in the manufacturing sector are up 4.5% annualized over Q4 2010. Average hourly earnings were flat for the second month in a row and stand just 1.7% above year ago levels. We are not overly concerned by the soft average hourly earnings figures, because wage inflation is a lagging indicator of the labor market—hence, we are unlikely to see much growth in hourly earnings until the employment recovery drives the unemployment rate lower. For example, in each of the business cycles since the early 1980s private payroll gains were deep into positive territory before wage inflation reaccelerated.
The decline in the unemployment rate (8.8% vs. 8.9%) is significant, because it caps off four consecutive months of decline (recall that it was 9.8% in November 2010). The drop was the result of strong employment in the household sector (291k vs. 250k previously.) The labor force participation rate held steady at 64.2% for the third month in a row, so this may be a sign the participation rate is bottoming. If it begins to drift higher, which would not be a surprise as the economy improves, this will make the hurdle marginally higher for the number of jobs needed to lower the unemployment rate (UR). However, since the pace of private sector hiring is accelerating (+1.6% y/y March vs. 0.9% in Q4), we remain confident the UR will continue to move meaningfully lower. –JL & CR
Wage and salary inflation is a lagging indicator of the labor market
-6
-4
-2
0
2
4
86 90 94 98 02 06 10
% y/y
1.5
2.0
2.5
3.0
3.5
4.0
4.5
% y/yAll employees: total pvt industries (ls)
Avg hourly earning in prod & nonsupervisory: total pvt industries (rs)
Source: BLS & DB Global Markets Research
4 April 2011 Strategy Asia Equities Daily Focus
Deutsche Bank AG/Hong Kong Page 23
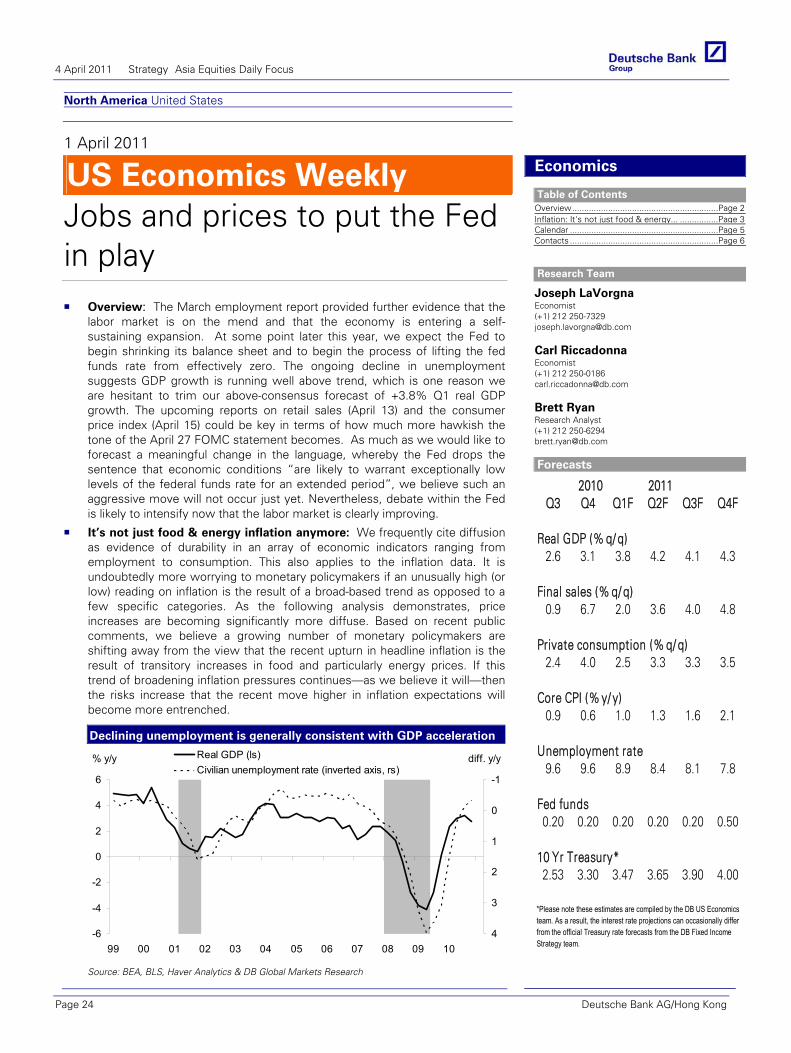
North America United States
1 April 2011
US Economics Weekly Jobs and prices to put the Fed in play
Economics
Table of Contents Overview.............................................................Page 2Inflation: It's not just food & energy... ................Page 3Calendar ..............................................................Page 5Contacts ..............................................................Page 6
Research Team
Joseph LaVorgna Economist (+1) 212 250-7329 [email protected]
Carl Riccadonna Economist (+1) 212 250-0186 [email protected]
Brett Ryan Research Analyst (+1) 212 250-6294 [email protected]
Forecasts
2010 2011Q3 Q4 Q1F Q2F Q3F Q4F
Real GDP (% q/ q)2.6 3.1 3.8 4.2 4.1 4.3
Final sales (% q/ q)0.9 6.7 2.0 3.6 4.0 4.8
Private consumption (% q/ q)2.4 4.0 2.5 3.3 3.3 3.5
Core CPI (% y/ y)0.9 0.6 1.0 1.3 1.6 2.1
Unemployment rate9.6 9.6 8.9 8.4 8.1 7.8
Fed funds0.20 0.20 0.20 0.20 0.20 0.50
10 Yr Treasury*2.53 3.30 3.47 3.65 3.90 4.00
*Please note these estimates are compiled by the DB US Economics team. As a result, the interest rate projections can occasionally differ from the official Treasury rate forecasts from the DB Fixed Income Strategy team.
Eco
no
mic
s
Overview: The March employment report provided further evidence that the labor market is on the mend and that the economy is entering a self-sustaining expansion. At some point later this year, we expect the Fed to begin shrinking its balance sheet and to begin the process of lifting the fed funds rate from effectively zero. The ongoing decline in unemployment suggests GDP growth is running well above trend, which is one reason we are hesitant to trim our above-consensus forecast of +3.8% Q1 real GDP growth. The upcoming reports on retail sales (April 13) and the consumer price index (April 15) could be key in terms of how much more hawkish the tone of the April 27 FOMC statement becomes. As much as we would like to forecast a meaningful change in the language, whereby the Fed drops the sentence that economic conditions “are likely to warrant exceptionally low levels of the federal funds rate for an extended period”, we believe such an aggressive move will not occur just yet. Nevertheless, debate within the Fed is likely to intensify now that the labor market is clearly improving.
It’s not just food & energy inflation anymore: We frequently cite diffusion as evidence of durability in an array of economic indicators ranging from employment to consumption. This also applies to the inflation data. It is undoubtedly more worrying to monetary policymakers if an unusually high (or low) reading on inflation is the result of a broad-based trend as opposed to a few specific categories. As the following analysis demonstrates, price increases are becoming significantly more diffuse. Based on recent public comments, we believe a growing number of monetary policymakers are shifting away from the view that the recent upturn in headline inflation is the result of transitory increases in food and particularly energy prices. If this trend of broadening inflation pressures continues—as we believe it will—then the risks increase that the recent move higher in inflation expectations will become more entrenched.
Declining unemployment is generally consistent with GDP acceleration
-6
-4
-2
0
2
4
6
99 00 01 02 03 04 05 06 07 08 09 10
% y/y
-1
0
1
2
3
4
diff. y/yReal GDP (ls)Civilian unemployment rate (inverted axis, rs)
Source: BEA, BLS, Haver Analytics & DB Global Markets Research
4 April 2011 Strategy Asia Equities Daily Focus
Page 24 Deutsche Bank AG/Hong Kong

OverviewSummary: The March employment report provided further evidence that the labor market is on the mend and that the economy is entering a self-sustaining expansion. At some point later this year, we expect the Fed to begin shrinking its balance sheet and to begin the process of lifting the fed funds rate from effectively zero. The ongoing decline in the unemployment rate suggests that GDP growth is running well above trend, which is one reason we are hesitant to trim our above-consensus forecast of +3.8% Q1 real GDP growth. The upcoming reports on retail sales (April 13) and the consumer price index (April 15) could be key in terms of how much more hawkish the tone of the April 27 FOMC statement becomes. As much as we would like to forecast a meaningful change in the language, whereby the Fed drops the sentence that economic conditions “are likely to warrant exceptionally low levels of the federal funds rate for an extended period”, we believe such an aggressive move will not occur just yet. Nevertheless, debate within the Fed is likely to intensify now that the labor market is clearly improving. Employment momentum continues to build. Nonfarm payrolls advanced +216k compared to +194k in February, while the unemployment rate declined another tenth to 8.8%. Private sector hiring once again outperformed the headline rising +230k vs. +240k (revised up from +222k) previously. Thus, private sector job growth in the first quarter of the year was the strongest since Q1 2006. Goods producing employment rose +31k as manufacturing rose +17k (vs. +32k previously); and the service sector logged a gain of +199k (vs. +167k previously). Unsurprisingly, construction employment remained soft (-1k), and government layoffs continued (-14k)—entirely as a result of layoffs at the local level (-15k).
The length of the workweek was unchanged (at 34.3 hrs) following an upward revision to February. While some analysts may cite the one-tenth decline in the manufacturing workweek (to 40.5 hrs) as reason for concern, this sector added the most jobs in Q1 since the mid-1990s, so we are inclined to believe that this merely reflects a normalization of the number of hours for the existing workforce as new employees are being added. Case in point, aggregate hours in the manufacturing sector are up 4.5% annualized over Q4 2010. Average hourly earnings were flat for the second month in a row and stand just 1.7% above year ago levels. We are not overly concerned by the soft average hourly earnings figures, because wage inflation is a lagging indicator of the labor market—hence, we are unlikely to see much growth in hourly earnings until the labor recovery drives the unemployment rate lower. In
fact, in each of the business cycles since the early 1980s private payroll gains were deep into positive territory before wage inflation reaccelerated.
The decline in the unemployment rate (8.8% vs. 8.9%) is significant, because it caps off four consecutive months of decline (recall that it was 9.8% in November 2010). The drop was the result of strong employment in the household sector (+291k vs. +250k previously.) The labor force participation rate held steady at 64.2% for the third month in a row, so this may be a sign that the participation rate is bottoming. As we have noted previously, if it begins to drift higher (which would not be a surprise as the economy improves), this will make the hurdle marginally higher for the number of jobs needed to lower the unemployment rate (UR). However, given that the pace of private sector hiring is accelerating (+1.6% year-over-year in March versus 0.9% in Q4), we remain confident the unemployment rate will continue to move meaningfully lower. While we are maintaining our yearend UR target of 7.8%, history suggests it could be closer to 7%.
The rate confirms above trend growth. In 2010, real GDP grew 2.8%, and the unemployment rate averaged 9.6%. The sharp drop to 8.8% in March suggests output growth is running well above last year’s pace. The inverse relationship between changes in the UR and real GDP can be seen in the chart below. History shows that when unemployment declines, real GDP growth tends to accelerate. While the unemployment rate is still high, the recent downtrend is encouraging. Now that the labor market is showing significant traction, we hope monetary policymakers will be sufficiently forward-looking in terms of recalibrating interest rates from emergency levels.
When unemployment declines, it is generally consistent with an acceleration in real GDP
-6
-4
-2
0
2
4
6
99 00 01 02 03 04 05 06 07 08 09 10
% y/y
-1
0
1
2
3
4
diff. y/yReal GDP (ls)
Civilian unemployment rate (inverted axis, rs)
Source: BEA, BLS, Haver Analytics & DB Global Markets Research
Joseph A. LaVorgna (212) 250-7329 Carl J. Riccadonna (212) 250-0186
4 April 2011 Strategy Asia Equities Daily Focus
Deutsche Bank AG/Hong Kong Page 25

Global
1 April 2011
Global Commodities DailyOil dynamics
Co
mm
od
itie
s
The Day Ahead
Time(EST) Country Event Previous Market View
03:00 Germany Trade balance s.a. (Jan) €11.8B
03:55 Germany PMI manufacturing (Mar) (MoM) 62.7 60.9
04:00 EZ PMI manufacturing (Mar) (MoM) 59.0 57.7
04:30 UK PMI manufacturing (Mar) (MoM) 61.5 60.9
05:00 EZ Unemployment rate (Feb) (MoM) 9.9% 9.9%
08:30 US Unemployment rate (Mar) (MoM) 8.9% 8.9%
08:30 US Nonfarm payrolls (Mar) (MoM) 192K 190K
10:00 US ISM manufacturing (Mar) (MoM) 61.4 61
Overview Brent crude oil surged to close over USD117/bbl Thursday. Hopes that some Libyan oil exports might make it back into the market were crushed as loyalist forces recaptured the oil port of Ras Lanuf from rebels in eastern Libya. In our view, Libyan oil is unlikely to make a swift reappearance in the global markets. But there are other forces converging to push oil higher. The global economic outlook remains robust and this, in turn, supports oil demand. Demand may be intensified by renewed filling of strategic reserves in China and the need for oil to replace nuclear power in Japan. We believe that non-OPEC oil supplies are likely to plateau over the period 2012-15 at near 54mmb/d. As demand grows, particularly in the emerging market nations, the need for OPEC oil will rise, but capacity growth in OPEC to 2015 is dependent on elusive stability in Iraq and elsewhere in the MENA region. Financial factors such as a weak US dollar may also offer support to oil prices.
Crude oil and refined products dynamics could support each other in a symbiotic bond. Our downstream premise at the start of this year was that the 2011global refining balance would be tighter than it’s been in the past two years, leaving less room for surprises. In our view, the catastrophic earthquake and tsunami in Japan have served to tighten the refining balance from both a supply and demand perspective, leaving markets with even less surplus capacity, which implies a better margin environment for 2011 than we initially expected at the start of this year. The loss of the very light, sweet crude from Libya should be a highly supportive factor for light products in Europe.
Looking at the calendar, the key statistics today likely will be the US ISM and payroll reports. Our US economics team expects the March employment report to show continued improvement in the rate of job growth (+200k vs. +192k) and another drop in the unemployment rate (8.8% vs. 8.9%). This news should make investors more emboldened about US growth prospects and mitigate some of the concern over elevated oil price — another interesting dynamic suggesting that the economy can handle higher oil prices.
Commodities & Global Markets
Commodities News In Brief
• Indonesia’s March crude oil output rose to 788,497 b/d from 785,234 b/d in February, the country’s oil and gas regulator BPMigas said.
• China, the world's largest coal producer, may see its output of coking coal to reach 513 mn tonnes in 2011, the China Securities Journal reported.
• Most of the aluminum-production capacity in China that was halted on power curbs last year has been restarted, according to researcher CRU International Ltd.,boosting output in the world’s largest consumer of the metal. About 1 mn tonnes of annual smelting capacity has resumed output and a further 200,000 tonnes may return soon.
• Japan’s crude oil imports for Feb fell by 12.6% to 17.3 mn kiloliters compared to 19.79 mn kiloliters in Jan, according to the Ministry of Economy, Trade and Industry
• United Co. Rusal, the world’s largest aluminum maker, more than tripled profit last year on higher sales volumes and a rise in the price of its products. Net income was $2.87 bn, or 19 cents a share, from $821 million, or 6 cents, a year earlier, the company said.
Global Markets News In Brief
• US initial jobless claims claims fell 6000 to 388000, a bit above consensus forecast.
• US Chicago PMI (Mar) fell slightly to 70.6.
• US factory orders (Feb) fell 0.1%against a consensus for a 0.5% increase.
• Australian AiG performance of mfg index (Mar) declined to 47.9 from 51.1.
• China PMI manufacturing increased to 53.4 in Mar from 52.2
• China HSBC manufacturing PMI up to 51.8 in Mar from 51.7.
Event Risks
• China non manufacturing PMI on Apr 2
• EZ Sentix investor confidence on Apr 4
• RBA interest rate decision on Apr 4
• Germany PMI services on Apr 5
• UK PMI services on Apr 5
• US ISM non-manufacturing on Apr 5
Research Team Adam Sieminski Soozhana Choi Research Analyst Research Analyst (1) 202 662 1624 (65) 6423 5261 [email protected] [email protected]
4 April 2011 Strategy Asia Equities Daily Focus
Page 26 Deutsche Bank AG/Hong Kong

Figure 1: US ISM Index Figure 2: US Nonfarm Employment (M-o-M change)
30
35
40
45
50
55
60
65
Jan-01 Jan-03 Jan-05 Jan-07 Jan-09 Jan-11
-1000
-800
-600
-400
-200
0
200
400
600
Jan-01 Jan-03 Jan-05 Jan-07 Jan-09 Jan-11
Source: Bloomberg Finance LP, Deutsche Bank Source: Bloomberg Finance LP, Deutsche Bank
Commodity Price Summary
Energy WTI (bbl) Brent (bbl) Nat Gas (mmBtu) RBOB Gas (g) Heating Oil (g) API 4 (t)
Close (USD) 106.72 117.36 4.39 3.11 3.09 119.25 Daily price change 2.3% 1.9% 0.8% 1.4% 1.7% 0.0% YTD price change 16.8% 23.9% -0.4% 26.7% 21.5% 3.1%
Precious Metals & FX Comex Gold Comex Silver Nymex Platinum Nymex
Palladium EURUSD USDJPY
Close (USD/oz) (level) 1438.90 37.89 1779.30 767.90 1.42 83.13 Daily price change 1.1% 1.0% 0.4% 1.3% 0.2% 0.3% YTD price change 1.3% 22.6% 0.1% -4.4% 5.8% 2.3% Industrial Metals Aluminium Copper Lead Nickel Tin Zinc LME close 3M (USD/t) 2648 9428 2695 26095 31800 2362
LME close 3M (USc/lb) 120.1 427.6 122.2 1183.7 1442.4 107.1
Daily price change 0.7% 0.5% 1.5% 0.2% 1.8% 1.0%
YTD price change 7.2% -1.8% 5.7% 5.4% 18.2% -3.7% LME Stocks (t) 4,595,375 439,850 281,300 123,696 18,285 736,675
Daily change (t) -3,550 125 -1,125 -462 135 -300
Agriculture & Livestock Corn (bsh) Cotton (lb) Live Cattle (lb) Soybeans (bsh) Sugar (lb) Wheat (bsh) NY close (USc) 693.25 200.23 121.55 1410.25 27.11 763.25 Daily price change 4.5% 3.4% 0.8% 2.8% -0.4% 5.0%
YTD price change 10.2% 38.3% 12.7% 1.2% -15.6% -3.9%
Other prices Baltic Dry Index
Iron Ore Steel US HRC Ethanol EUA (CO2)
Dec12 (Euro) U3O8 USD/lb
Close (level) 1530 172.4 889 2.66 18.12 59.00 Daily change -1.0% 2.3% 0.0% 7.3% 2.0% 0.0% YTD change -13.7% 1.4% 30.7% 11.7% 23.9% -5.0%
Indices DBLCI-OY DBLCI-MRE DB Harvest SPGSCI DJUBS SPWCI NY close (level) 1427 451 287 5515 341 420 Daily change 2.4% 1.7% 0.1% 2.0% 1.8% 1.5% YTD change 11.5% 5.2% 1.6% 11.6% 4.4% 17.6%
Source: Reuters, Bloomberg Finance LP, UxC, Metals Bulletin, Deutsche Bank
4 April 2011 Strategy Asia Equities Daily Focus
Deutsche Bank AG/Hong Kong Page 27

Asia India
1 April 2011
India Economics Weekly Understated WPI, Oct-Dec BOP, core infra sector growth
Economics
Research Team
Taimur Baig, Ph.D Chief Economist (+65) 64238681 [email protected]
Kaushik Das Economist (+91) 22 6658-4909 [email protected]
Key forecasts Year ending 31 March FY09/10 FY10/11F FY11/12F FY12/13FReal GDP (YoY %) 7.5 8.5 8.5 8.5Consolidated fiscal deficit, % of GDP
-9.7 -7.7 -7.4 -6.8
WPI (YoY%) avg 3.6 9.2 7.5 6.8WPI (YoY%) eop 10.2 8.0 6.3 7.1Current account balance, % of GDP
-2.9 -2.9 -3.0 -3.0
2009 2010F 2011F 2012FTrade balance, % of GDP -8.6 -8.7 -8.7 -8.4Current account balance, % of GDP
-2.2 -2.6 -3.0 -3.0
INR/USD, eop 46.7 44.8 43.5 42.5
Source: CEIC, Deutsche Bank
Understated WPI. We show that WPI inflation is understated as many items in the index have not been updated for a while and most of those items are likely to be updated on the high side. Indeed, 114 indices (9.2% of the index) have not been updated since August 2010. Since the data update of these various items will likely take place at different points of time, this may result in increased volatility in the inflation outcome.
WPI items not updated yet compared with world prices Item No. of Weight WPI World items in WPI % yoy % yoy
Beverages 6 1.0 7.9 32Textiles 9 1.1 11.7 140Wood & Wood Products 3 0.1 2.7 14Leather & Leather Products 2 0.04 -1.1 27Rubber & Plastic 9 0.6 8.3 84Chemicals & Chemical Products 21 1.7 5.4 40Basic Metals, Alloys and Metal Products 10 0.9 8.6 10Total 60 5.5Source: CEIC, Deutsche Bank. World prices denote liquid futures market data for relevant items
Balance of Payments (Oct-Dec’10). The current account deficit eased to USD9.7bn in Oct-Dec’10 (2.1% of GDP), down from a record high USD16.8bn (4.3% of GDP) in July-Sep’10 quarter, lending support to our long-standing view that India’s balance of payments related risks are not substantial. The quarterly trend of the data is in line to achieve our full year current account deficit forecast of 2.6% for FY10/11. We expect the current account deficit to reach 3.0% of GDP in FY11/12, mainly reflecting higher global oil prices. Our forecast is based on an assumption of USD100-105/bbl average crude oil price for FY11/12. If oil prices sustain at higher levels (USD115-125/bbl) through the course of the year, the CAD could deteriorate by a quarter to half percent of GDP.
BOP snapshot - quarterly trend in 2010 (USDbn) Apr-June July-Sept Oct-Dec Apr-Dec1. Exports 55.3 51.8 66.0 173.02. Imports 88.0 89.6 97.5 275.13. Trade Balance (1-2) -32.8 -37.8 -31.6 -102.14. Invisibles, net 20.3 21.0 21.9 63.25. Current Account Balance -12.5 -16.8 -9.7 -38.96. Capital Account Balance* 16.2 20.1 13.7 50.07. Change in Reserves 3.7 3.3 4.0 11.0Source: RBI, Deutsche Bank. Note:* Capital account balance includes error and omissions
Our recent publications on India 2011Living with 100 dollar oil 21-Jan
2010Debt and deficit of India's states 16-Nov
RBI hikes, signals a (temporary) pause 2-Nov
Fiscal impact of the Food Security Act 28-Oct
Rupee and capital controls 21-Oct
India's heterogeneous states 21-Sep
India's food prices: high and sticky 31-Aug
India's population dynamic 13-Jul
Fuel price reform: a potential game changer 28-Jun
Food subsidies: a new fiscal risk 29-Apr
India's changing trade dynamic 12-Apr
India's Budget review 26-Feb
Implementing the GST 28-Jan
2009Privatization outlook 23-Dec
India's debt problem 17-Dec
Surging food prices: drivers & implications 10-Dec
Asian EM currencies: still tied to the Dollar 20-Nov
Assessing monetary stance in India 9-Oct
Education and the private sector 7-Oct
4 April 2011 Strategy Asia Equities Daily Focus
Page 28 Deutsche Bank AG/Hong Kong

Asia China Technology
1 April 2011
China TMT Daily East meets west: Digital ads; also BIDU, GOOG
(Please click through to the .pdf version of this document for a full overview of today’s
news and views.)
Periodical
TOP CHINA TMT PICKS Company Rating Target Price AsiaInfo-Linkage Buy USD 24.75 China Telecom Buy HKD 5.40 ZTE Buy HKD 42.78
CHINA TMT STOCKS Company Rating Close Price 1D% 3M%
TELCOS as on 31/03China Comm Service Hold 4.7 -15.5 2.2China Mobile Hold 71.7 -0.3 -7.2China Telecom Buy 4.8 1.1 16.7China Unicom Hold 12.9 2.2 16.2 INTERNET/ONLINE GAMING Alibaba.com Hold 13.3 -1.9 -4.3Baidu Buy 137.8 1.0 42.8Ctrip.com Int'l Hold 41.5 1.6 2.6Netease.com Buy 49.5 1.0 37.0Shanda Sell 42.0 -1.1 5.9Shanda Games Hold 6.4 0.3 -1.1Sina Corp Sell 107.0 -1.0 55.5Sohu.com Hold 89.4 2.6 40.7Tencent Buy 189.5 -2.9 12.2 TECHNOLOGY AsiaInfo-Linkage Buy 21.7 5.7 30.7Foxconn Int'l Hldgs Hold 4.7 -4.5 -14.0HiSoft Buy 18.7 -1.5 -38.0Lenovo Group Hold 4.4 2.8 -11.0Longtop Buy 31.4 0.7 -13.2Synnex Technology Hold 68.6 0.0 -12.8ZTE Buy 36.2 3.3 17.2 Indices Close 1D% 3M% as on 31/03HSI 23527.5 0.3 2.1HSCEI 13315.8 1.2 4.9Nasdaq 2781.1 0.2 4.8Sources: DB, Bloomberg Finance LP
CALENDAR OF EVENTS
Research Team
Alan Hellawell III Research Analyst (+852) 2203 6240 [email protected]
Eva Leung, CFA Research Associate (+852) 2203 6190 [email protected]
FEATURE:
Even the US still playing catch-up in digital ad spending We recently came across broadly encouraging research from eMarketer. The firm forecasts that online advertising will increase its share of US major media ad spending by more than 10 percentage points between 2009 and 2015. As part of this survey, eMarketer discovered that spending on digital, including internet and mobile, has not yet risen to match consumption patterns. Unsurprisingly, across the major media categories; namely, television, internet, radio, mobile, newspaper and magazine; US adults still spend the most time each day with TV. eMarketer estimates that adults watched television for 42.9% of the total time they spent reviewing media in 2010, and ad dollars mapped to that closely, at 42.7%. The internet, by contrast, took up 25.2% of adults’ daily media time in 2010, but received just 18.7% of US ad spending. There is therefore a gap of 6.5 percentage points between time spent on the internet and ad dollars spent there.
Playing catch-up – let the re-balancing begin! According to eMarketer, newspaper represented only 4.9% of time spent but was still a massive 16.5% of ad spend, while magazines showed a similar gap (3.3% versus 10.6%). Mobile, still in its infancy, and largely still communications-focused, was 8.1% of user time, but only 0.5% of ad budget in 2010. Processing the data a bit further, if we look at major media ad spending per hour spent on each media by adult, we saw an astonishing USD0.53 spent in advertising per hour spent reading newspaper, USD0.51 on magazines, and USD0.16 on TV. Internet saw only USD0.12 and mobile USD0.01. As eMarketer states, “Digital media have a long way to go before dollars match up with eyeballs.”
The opportunity in China We find the same situation in China, which indicates ample room for the online ad market in the next several years. Overall, we believe that a mere 11-12% of advertising in China is spent on digital. Nielsen estimates that people spend 150 hours and 50 minutes on TV per month vs. 22 hours and 27 minutes on Internet and 16 hours 48 minutes on mobile video. In addition, media reach rates in China on newspaper, magazine, radio, TV, outdoor and Internet were 66.8%, 32.6%, 13.9%, 91.6%, 66.8% and 44.6% in 2010, respectively.
How to play digital ad spend growth – Buy Baidu, Tencent, Soufun The names that are significantly exposed to digital ad spend, or will benefit from its growth going forward, include search leader Baidu, Tencent (with a small but high-growth banner ad business) and Soufun. We envision 3-year EPS CAGRs of 49%, 30% and 19%, respectively between 2010 and 2013 for these three names.
4 April 2011 Strategy Asia Equities Daily Focus
Deutsche Bank AG/Hong Kong Page 29

Asia Technology
31 March 2011
Tech Earnings Revisions Capitulation time for the bulls?
Kishore Suratkal Research Analyst (+852) 2203 6150 [email protected]
Earnings risk is rising; expecting to see a new downward revisions cycle Global tech earnings revisions are starting to look increasingly shaky. US semis and hardware earnings revisions have peaked. Asian tech earnings revisions are accelerating to the downside. 2Q11 could be the wash out quarter where earnings capitulation occurs. We wait to the end of 2Q11 before we commit to buying the sector. Hardware is significantly closer to the lows than semis and going into 2H11, this would be our preferred sector as we see rising risks of order reductions at semiconductor companies in 2Q11.
Industry Update
Top picks Hon Hai Precision (2317.TW),TWD106.00 BuySynnex Technology (2347.TW),TWD70.50 HoldSEC (005930.KS),KRW940,000.00 BuyHynix (000660.KS),KRW31,600.00 HoldPowertech (6239.TW),TWD94.90 Buy
Companies featured
Hon Hai Precision (2317.TW),TWD106.00 Buy2009A 2010E 2011E
P/E (x) 12.9 14.5 12.2EV/EBITDA (x) 6.8 6.5 5.6Price/book (x) 3.3 2.3 2.0Synnex Technology (2347.TW),TWD70.50 Hold
2009A 2010E 2011EP/E (x) 17.1 18.4 14.9EV/EBITDA (x) 21.3 19.6 15.2Price/book (x) 3.3 3.1 2.9SEC (005930.KS),KRW940,000.00 Buy
2009A 2010E 2011EP/E (x) 11.4 10.0 9.7EV/EBITDA (x) 4.9 5.3 4.6Price/book (x) 2.03 1.88 1.59Powertech (6239.TW),TWD94.90 Buy
2010A 2011E 2012EP/E (x) 9.6 8.2 6.6EV/EBITDA (x) 4.4 3.4 2.8Price/book (x) 2.1 1.8 1.5Siliconware Precision (2325.TW),TWD36.40 Buy
2010A 2011E 2012EP/E (x) 19.1 16.1 10.2EV/EBITDA (x) 6.6 5.9 4.3Price/book (x) 1.8 1.8 1.6
Risk of downside to earnings estimates in 2Q11 Downside to earnings estimates are rising for 2Q11. A combination of a significant mismatch between production and shipment estimates for tablets and smartphones, excess inventory, and a perceived risk of component shortages due to the Japanese earthquake has raised the risk that 2Q11 estimates across the tech food chain will miss estimates. We expect tech analysts to start cutting estimates for 2011 as the reality of this situation starts to sink in. In our view, June earnings revisions would most likely show the capitulation bottom that we are looking for, similar to the one seen in Sep 2004. That’s the bottom we would be buying into for what we think should be a better 2H11for tech stocks.
DRAM still stays resilient; hardware is now closer to the lows A significant cut to estimates by Acer, followed by the knock on effect on the PC ODM and OEM food chain has now brought Asian PC hardware earnings estimates closer to capitulation. In contrast Asian semi earnings revisions have only now started to come off, and we are a long way away from where we see upside risks start to emerge. DRAM prices staying firm through 1Q has helped DRAM earnings revisions to hold up better than the rest of tech. Display sector earnings, which were looking promising have failed to sustain and look set to start a new downtrend.
Biased towards Korean Tech over Taiwan Tech; at least for 2Q11 Earnings revisions by country still show a positive bias toward Korean tech v/s Taiwan tech. However, we would also like to highlight from fig 9 and fig 10 below that March has also seen Korean tech earnings revisions take a negative turn. However, given the higher risk to earnings forecasts in the hardware heavy Taiwan tech sector, we continue to maintain our bias to using Taiwan tech as a source of funds in 2Q11. We would expect to reverse this stance as we see both Taiwan tech stocks and earnings revisions correct to levels where we see capitulation.
US Tech earnings revisions extremely lofty relative to Asian tech Comparing earnings revisions across global tech, we see US tech earnings coming off from what we think are extremely lofty and risky levels relative to Asian tech. While consensus estimates to US GDP are optimistic, and hopes of a macro recovery in the US remain rosy, earnings revisions in US tech show that this is now most likely priced into US analysts’ earnings models. As we have seen in Asia, an increasingly cautious view on the PC, ODM, and assembly food chain would start to impact analysts’ estimates of the non-Apple supplier food chain in the US. The risk we see is that while estimates for Apple both in notebooks and tablets keep rising, the non-Apple camp looks increasingly likely to start lowering production and shipment targets.
4 April 2011 Strategy Asia Equities Daily Focus
Page 30 Deutsche Bank AG/Hong Kong

Asia China Resources Metals & Mining
1 April 2011
Angang Steel Reuters: 0347.HK Bloomberg: 347 HK Exchange: HKG Ticker: 0347
On the improvement track; maintaining Buy James Kan Research Analyst (+852) 2203 6146 [email protected]
Yvonne Tsai Research Analyst (+886) 2 2192 2824 [email protected]
Attractive risk-reward; maintaining Buy While both share some similar demand drivers, the cement sector outperformed the steel sector by over 30% YTD. We note that the status of industry concentration varies between the cement and steel sectors, but we do not believe the large divergence of equity performance should be sustainable. As Angang guided for sequential quarterly profitability improvement during the analyst meeting, we believe upward earnings revisions should start soon. We maintain our HK$15 target price, with 40% upside potential, and our Buy rating.
Forecasts and ratios
Year End Dec 31 2008A 2009A 2010E 2011E 2012E
Sales (CNYm) 78,037.0 69,874.0 89,757.4 108,208.9 113,565.3
EBITDA (CNYm) 9,375.0 8,053.0 9,618.5 13,201.0 15,749.8
EBIT(CNYm) 4,461 1,641 3,391 6,837 9,296
Reported NPAT (CNYm) 2,993.0 752.0 1,887.3 4,376.3 6,127.8
DB EPS growth (%) -63.1 -74.9 151.0 131.9 40.0
DB EPS FD(CNY) 0.41 0.10 0.26 0.60 0.85
PER (x) 29.3 107.0 34.5 14.9 10.6
EV/EBITDA (x) 12.3 14.3 10.7 7.6 6.0Source: Deutsche Bank estimates, company data
1 DB EPS is fully diluted and excludes non-recurring items 2 Multiples and yields calculations use average historical prices for past years and spot prices for current and future years, except P/B which uses the year end close
Results
Buy Price at 31 Mar 2011 (HKD) 10.68Price target - 12mth (HKD) 15.0052-week range (HKD) 15.10 - 9.08HANG SENG INDEX 23,528
Price/price relative
4
8
12
16
20
4/09 7/09 10/09 1/10 4/10 7/10 10/10 1/11Angang Steel
HANG SENG INDEX (Rebased)
Performance (%) 1m 3m 12mAbsolute -0.4 -10.3 -25.0HANG SENG INDEX 0.8 2.1 10.8
Stock data
Market cap (HKDm) 77,270Market cap (USDm) 9,934Shares outstanding (m) 7,235.0Major shareholders Angang Holding (44.55%)Avg daily value traded (USDm) 19.5Free float(%) 33
Key indicators (FY1)
ROE (%) 3.6Net debt/equity (%) 66.8Book value/share (CNY) 7.43Price/book (x) 1.2Net interest cover (x) 2.9Operating profit margin (%) 3.8
Company guides for profitability improvement during analyst meeting During Angang’s analyst meeting, management guided for the company’s sequential QoQ bottom-line improvement since 4Q10 to continue until at least 2Q11. Management also explained that the poor 4Q10 margins were partially contributed by the inventory loss provisioning, which could possibly be reverted in later quarters when the steel price rises again. Both of these statements should be positive for the company’s earnings momentum.
Near-term industry sentiment supports management optimism The recent steel spread (steel price minus input costs) is widening, supporting management’s view of improving profitability. Meanwhile, the traders’ inventory declined for four consecutive weeks. Lower inventory levels should help support steel spreads in 2Q/3Q. We continue to believe the profitability of Chinese steel mills should improve in 3Q11 as public housing demand kicks in. Though our FY11 earnings forecast is ~10% above consensus, we see further upside potential.
Cheap valuation, investors should position at the bottom; maintaining Buy With this earnings momentum, we are starting to see potential for the earnings revision cycle to bottom out. The stock now trades at 1.14x 2011E BVPS and 7.6x 2011E EV/EBITDA, both well below historical averages and similar to the trough of mid-2010 (when the industry over-capacity situation was worse). We believe investors should take a position in Angang so as to ride with the profitability improvement. We maintain our Buy and HK$15 target price (1.6x 2011E BVPS), implying 40% upside potential. Major risk: further tightening policy from the Chinese government may put off end demand for steel. (See pp. 7-8 for details.)
4 April 2011 Strategy Asia Equities Daily Focus
Deutsche Bank AG/Hong Kong Page 31

Asia ChinaBanking/Finance
01 Apr 2011 - 09:04:46 AM HKT
COMPANY ALERT Results
China CITIC Bank Buy
2010 NPAT up 50% YoY, boost by lower than expectedcosts
Reuters:0998.HK Exchange:HKG Ticker:0998
Price (HKD) 5.66
Price target (HKD) 6.43
52-week range (HKD) 6.24 - 4.19
Market cap (USDm) 34,615
Shares outstanding (m) 43,326.6
NPL/total loans (%) 0.9
Book value/share (CNY) 3.06
FYE 12/31 2009A 2010E 2011E
Provisioning(CNYm)
2,619.0 7,040.4 13,985.0
Pre-provprofit(CNYm)
21,883 33,001 45,081
EPS (CNY) 0.37 0.45 0.50
PER (x) 11.0 10.5 9.6
Yield (net)(%)
2.2 2.4 2.6
CNCB reported net profit of Rmb21.5bn or up 50% yoy in FY10, in line withthe preannouncement. The strong headline growth was primarily driven bylower than expected cost growth of 18% yoy with a CIR of 40.1% from46.6% in 2009. In 4Q 2010, operating costs rose by 4.6% yoy only, resultingin a significant reduction in CIR to 49% (same period last year: 64%). NIMonly increased by 9bps qoq (vs. 5-17bps for H-shr sector average) mainlydragged down by its fast growth of interbank liabilities (+30% qoq). Loangrew by 5.3% qoq at similar pace with deposit growth of 5.7% leading toLDR largely unchanged at 73%. Fee income growth trend remains healthywith fee income growth of 36% yoy by leveraging the bank's diversifiedfinancial platform. Credit cost was reported as 58bps (up 33bps qoq and41bps yoy) despite continued asset quality improvements evidenced byNPL balance down by 12.6% qoq with NPL ratio down from 0.81% in 3Qto 0.67% in 4Q and NPL coverage ratio up from 176% in 3Q to 214%.For the full year, pre-provision profit rose by 54% yoy. Essentially, net in-terest income rose by 33.8% yoy with NIM up 12bps to 2.63% and RWAup 25% yoy. Fee income rose by 35% yoy. Operating costs were up 18%with CIR of 40.1% (FY2009:46.6%). Credit costs rose to 36bps (vs.FY09:27bps). ROAA and ROAE improved to 1.12% and 19.3%, respectively, witha tier 1 of 8.45% and CAR of 11.31%. The banks didn't announce cashdividends and will soon launch the planned rights issue of 2.2 for every 10shares to raise no more than Rmb26bn. This compares to our net profitforecast of Rmb 23.7bn in FY11E, which represents 10% growth of netprofit in FY10. We plan to review after the call. CNCB is trading on 9.7x2011E P/E (ROAE: 15.3%) and 1.4x 2011E P/B based on our current fore-casts. CNCB will host an analyst briefing at 11am (1 April) today, and wewill seek more details during the analyst briefing.
CNCB 4Q10 results table
Source: Deutsche Bank, company data
Tracy YuResearch Analyst(+852) 2203 [email protected]
Judy ZhangResearch Analyst(+852) 2203 [email protected]
4 April 2011 Strategy Asia Equities Daily Focus
Page 32 Deutsche Bank AG/Hong Kong

Asia China Consumer Food & Beverage
1 April 2011
China Mengniu Dairy Reuters: 2319.HK Bloomberg: 2319 HK Exchange: HKG Ticker: 2319
Earnings growth to accelerate in 2011; maintaining BuyMabel Wong, CFA Research Analyst (+852) 2203 6178 [email protected]
2010 results in line with our forecasts We maintain Buy on Mengniu Dairy as it is a beneficiary of the current industry shakeup that may phase out c.20% of substandard producers, and trades on undemanding valuations. 2010 NPAT rose 11% to Rmb1,237m, in line with our estimates. We expect 2011 NPAT growth to accelerate to 28% yoy on decent sales growth, GM expansion and lower SG&A ratio. We fine-tune our 2011-12 NPAT by 2%. Our target price is HKD27 (25.7x 2011 P/E and 20x 2012 P/E).
Forecasts and ratios
Year End Dec 31 2009A 2010A 2011E 2012E 2013E
Sales (CNYm) 25,710.5 30,265.4 35,819.6 41,722.5 46,793.7
EBITDA (CNYm) 1,897.3 1,974.4 2,556.0 3,233.3 3,821.0
Reported NPAT (CNYm) 1,115.3 1,237.3 1,596.9 2,028.5 2,415.0
Reported EPS FD(CNY) 0.69 0.71 0.90 1.13 1.33
DB EPS FD (CNY) 0.69 0.71 0.90 1.13 1.33
OLD DB EPS FD (CNY) 0.69 0.72 0.91 1.15 –
% Change -0.0% -1.0% -1.5% -1.9% –
DB EPS growth (%) – 4.0 26.2 25.0 17.9
PER (x) 22.2 29.0 18.8 15.0 12.8
EV/EBITDA (x) 10.1 15.1 8.7 6.3 4.7
DPS (net) (CNY) 0.14 0.16 0.21 0.26 0.31
Yield (net) (%) 0.9 0.8 1.2 1.6 1.8Source: Deutsche Bank estimates, company data
1 DB EPS is fully diluted and excludes non-recurring items 2 Multiples and yields calculations use average historical prices for past years and spot prices for current and future years, except P/B which uses the year end close
Results
Buy Price at 1 Apr 2011 (HKD) 20.10Price target - 12mth (HKD) 27.0052-week range (HKD) 26.60 - 19.66HANG SENG INDEX 23,528
Key changes
Sales (FYE) 35,665 to 35,820 0.4%Op prof margin (FYE) 5.1 to 4.9 -3.7%Net profit (FYE) 1,620.8 to 1,596.9 -1.5%
Price/price relative
8
1216
20
24
28
32
4/09 7/09 10/09 1/10 4/10 7/10 10/10 1/11China Mengniu Dairy
HANG SENG INDEX (Rebased)
Performance (%) 1m 3m 12mAbsolute -4.7 -2.4 -14.8HANG SENG INDEX 0.6 2.1 9.2
Stock data
Market cap (HKDm) 34,918Market cap (USDm) 4,489Shares outstanding (m) 1,737.2Major shareholders COFCO/Hopu (20.03%)Free float (%) 68Avg daily value traded (USDm) 15.1
Key indicators (FY1)
ROE (%) 16.6Net debt/equity (%) -59.8Book value/share (CNY) 6.33Price/book (x) 2.7Net interest cover (x) –Operating profit margin (%) 4.9
2010 results in line with our forecast 2010 NPAT rose 11% yoy to Rmb1,237m, in line with our Rmb1,249m estimate vs. consensus (Reuters: Rmb1,268m; Bloomberg Finance LP: Rmb1,295m). Notably, NPAT growth rebounded from -6.5% yoy in 1H10 to 36% yoy in 2H10 on lower selling expense ratio. Despite higher raw-milk prices (40-50% of COGS), it is positive to see Mengniu’s gross margin only dipped 1ppt yoy, thanks to a positive mix shift. This is better than other beverages plays, whose gross margins dropped 3-8ppt yoy. Mengniu’s cash flow stayed healthy and it had c.Rmb6bn net cash.
2011 outlook: gross margin stable or up; lower SG&A ratio; higher tax rate For 2011, we forecast Mengniu’s sales growth to be 18%, faster than industry’s growth of low to mid-teens (our estimate). Management expects raw milk price to remain stable. A continual mix upgrade can buffer against input costs hikes and bodes well for gross margin. We expect their admin expense ratio to be stable, and its selling expense ratio to drop as there are cost savings from the internal consolidation of its sales team. This can offset a 1ppt yoy rise in effective tax rate.
Forecasts fine-tuned; maintaining Buy and target price We fine-tune our 2011-12 NPAT forecasts by 1-2% to reflect a higher capex, lower SG&A ratio and a higher tax rate. Our target price is HKD27, which is a blended average of DCF (10.12% WACC and 2% TGR) and PE/G. Key risks: competition, product-quality issues, higher A&P spend and input cost volatility.
4 April 2011 Strategy Asia Equities Daily Focus
Deutsche Bank AG/Hong Kong Page 33

Asia ChinaAutomobiles & Components
01 Apr 2011 - 08:28:11 PM HKT
COMPANY ALERT Company Update
Dongfeng Motor Buy
Key takeaways from analyst briefing - Staying positive
Reuters:0489.HK Exchange:HKG Ticker:0489
Price (HKD) 12.78
Price target (HKD) 17.80
52-week range (HKD) 18.26 - 7.73
Market cap (USDm) 14,157
Shares outstanding (m) 8,616.1
Net debt/equity (%) -83.0
Book value/share (CNY) 5.48
Price/book (x) 2.0
FYE 12/31 2010A 2011E 2012E
Sales(CNYm)
122,395 133,041 149,251
Net Profit(CNYm)
10,981.0 11,584.8 13,481.4
DB EPS(CNY)
1.27 1.34 1.56
PER (x) 8.4 8.0 6.9
Yield (net)(%)
1.7 2.0 2.6
FY11 targets: Dongfeng targets to sell 2.16m units of vehicles (up 11%YoY, including 1.65m units of passenger vehicles (PV) and 510,300 units ofcommercial vehicles (CV)). PV sales growth is to be supported by 8 newmodel launches while the company prudently expects a 3% YoY declineafter a strong FY10 performance. According to the company, total FY11vehicle production capacity is to grow to 1.93m units (FY10: 1.72m units).This implies that Dongfeng's capacity utilization is likely to stay high.
12th Five Year Plan: By 2015, Dongfeng plans to grow capacity to 3.64munits and sales to 3.60m units (i.e. 13% CAGR). This will be supported bymore than 40 new model launches. The company plans to spend RMB 3bnin 2011-15 to develop and commercialize its new energy vehicles.
Usage of increasing net cash: When asked if Dongfeng will utilize its cashfor M&A activities (including overseas targets), the management mentionedthat it regularly studies opportunities which could enhance Dongfeng's automanufacturing value chain. The management, however, did not commenton recent Bloomberg news report that it is considering an investment inGerman transmission manufacturer GETRAG.
Impacts of Japan auto part supply disruption: From now until the endof April, Dongfeng does not expect material impacts on production. Inmedium term, the company is still analyzing the situation but thinks thatmassive production disruption is unlikely.
Risk of more Tier 1 cities adopting auto sales restriction measures:Even if that happens, Dongfeng is not concerned about its growth prospectgiven that 1) current China auto sales growth is driven by Tier 2/3/4 citieswhose auto penetration is still low and 2) increasing demand in Tier 1 citieswill be driven by replacement.
DB's view: Dongfeng's FY11 target and its view on near-term productioncontinuity is in line with our expectations. In the long run, we still like thecompany on its high production utilization and economies of scale. Wetherefore maintain Buy and suggest accumulating shares on weakness inour view due to overstated market concerns on auto part supply and salesrestriction. Key near-term risk is worsening situation on auto part supply.Vincent Ha, CFAResearch Analyst(+852) 2203 [email protected]
4 April 2011 Strategy Asia Equities Daily Focus
Page 34 Deutsche Bank AG/Hong Kong

Asia China Utilities Utilities
31 March 2011
Guangdong Investment Reuters: 0270.HK Bloomberg: 270 HK Exchange: HKG Ticker: 0270
Positive surprise on dividend payout; BuyEric Cheng, CFA Research Analyst (+852) 2203 6202 [email protected]
Michael Tong, CFA Research Analyst (+852) 2203 6167 [email protected]
Kai-Ting Wong Research Associate (+852) 2203 6235 [email protected]
Transforming into a yield play While Guangdong Investment (GDI) reported in-line FY10 results, the market is likely to react positively to the higher dividend payout ratio of 42% (from 33% in FY09). We see scope for this ratio to increase further given continual strong cash flow generation and a reduction in the gearing ratio. The likely increase in the HK water supply revenue from 2012-14, which should be finalized in the coming months, would also be a catalyst. The stock looks attractively valued at 10x 2011E P/E, even without factoring in any acquisition upside; we reiterate Buy.
Forecasts and ratios
Year End Dec 31 2008A 2009A 2010E 2011E 2012E
Sales (HKDm) 5,913.2 5,915.8 6,164.5 6,471.3 6,261.8
EBITDA (HKDm) 4,322.1 4,055.9 4,261.3 4,515.0 4,588.4
Reported NPAT (HKDm) 1,876.7 2,044.3 2,263.1 2,427.8 2,580.6
Reported EPS FD(HKD) 0.30 0.33 0.36 0.38 0.40
DB EPS FD (HKD) 0.31 0.33 0.36 0.38 0.40
DB EPS growth (%) 21.5 9.0 7.9 6.4 5.4
PER (x) 10.3 11.3 10.9 10.3 9.7
EV/EBITDA (x) 6.1 7.1 6.5 6.1 6.0
DPS (net) (HKD) 0.10 0.11 0.15 0.16 0.17
Yield (net) (%) 3.2 2.9 3.8 4.1 4.3Source: Deutsche Bank estimates, company data
1 DB EPS is fully diluted and excludes non-recurring items 2 Multiples and yields calculations use average historical prices for past years and spot prices for current and future years, except P/B which uses the year end close
Results
Buy Price at 31 Mar 2011 (HKD) 3.93Price target - 12mth (HKD) 5.0052-week range (HKD) 4.50 - 3.33HANG SENG INDEX 23,528
Key changes
Net profit (FYE) 2,251.6 to 2,263.1 0.5%
Price/price relative
3.0
4.0
5.0
6.0
4/09 7/09 10/09 1/10 4/10 7/10 10/10 1/11Guangdong Investment
HANG SENG INDEX (Rebased)
Performance (%) 1m 3m 12mAbsolute -0.3 -1.8 -6.4HANG SENG INDEX 0.8 2.1 10.8
Stock data
Market cap (HKDm) 24,419Market cap (USDm) 3,139Shares outstanding (m) 6,239.5Major shareholders GDH Limited (62%)Free float (%) 38.2Avg daily value traded (USDm) 3.5
Key indicators (FY1)
ROE (%) 12.8Net debt/equity (%) 10.8Book value/share (HKD) 2.95Price/book (x) 1.3Net interest cover (x) 41.4Operating profit margin (%) 53.2
FY10 recurring earnings up 9% yoy, in-line with our expectation Reported net profit was up 18% yoy to HK$2,420m. Excluding one-off items, recurring earnings were up 9% yoy to HK$2,254m, in line with our and consensus estimates. The increase in earnings was mainly driven by a 6% yoy increase in HK water supply revenue and a lower finance cost. DPS was HK$0.15, up 36% yoy, which represents a 3.8% dividend yield.
Plenty of acquisition war chest under the rule of the new chairman With a vastly improved balance sheet (10% net debt to equity at end-FY10), GDI has the resources to undertake several sizeable deals. We believe the new chairman is likely to be more active in business expansion, which could include more water projects in Guangdong province from the parent company or even the Guangdong government. However, if there are no significant investment opportunities, we expect GDI to pay out more dividends.
DCF-based target price HK$5.0/share; risks We derive our DCF-based target price using a WACC of 9.5% (3.3% risk-free rate, 6.2% equity risk premium, 1.2x beta, 4.5% after-tax cost of debt and 20% debt-to-total capital ratio). Key downside risks include lower-than-expected tariffs and volume from the Mainland water supply business, and lower-than-expected rental yields for GDI’s investment properties (see page 7).
4 April 2011 Strategy Asia Equities Daily Focus
Deutsche Bank AG/Hong Kong Page 35

Asia ChinaHealth Care Health Care
03 Apr 2011 - 10:19:31 PM HKT
COMPANY ALERT Company Update
Shandong Weigao Buy
Unlocking value for JW Medical
Reuters:1066.HK Exchange:HSI Ticker:1066
Price (HKD) 22.95
Price target (HKD) 24.00
52-week range (HKD) 24.20 - 14.82
Market cap (USDm) 6,344
Shares outstanding (m) 2,152.6
Net debt/equity (%) -18.0
Book value/share (CNY) 2.16
Price/book (x) 8.9
FYE 12/31 2010A 2011E 2012E
Sales(CNYm)
2,463 3,338 4,534
Net Profit(CNYm)
799.7 1,054.0 1,455.1
DB EPS(CNY)
0.37 0.49 0.68
PER (x) 41.8 39.5 28.6
Yield (net)(%)
0.3 0.1 0.1
Most likely scenario: Weigao acquires 100% JW medical and takesstake in BiosensorsWe met with Biosensors management recently and discussed various sce-narios. Currently, we think the most likely scenario is that Weigao (1099.hk)acquires the remaining 50% of the JW medical (JWMS) stake owned byBiosensors (SIN: B20, not covered). It also makes sense that Weigao ac-quires a controlling stake of Biosensors in our opinion.
Biosensors' strategic value to WeigaoJWMS is a joint venture established in 2003 and owned 50:50 by Weigaoand Biosensors, the term of this JV lasts 10 years till August 2013. Weigaolicensed stent technology from Biosensors and started marketing the prod-uct under the name of Excel. Terumo (TYO: 4543, not covered) also licensedthis technology and is currently marketing its stent under the brand nameof Nobori in Europe, with Japan approval expected in 2011. We have learnedthat Biosensors applied for sFDA approval in 2007 and has not gained ap-proval yet. However, Weigao does not have its own stent technology either.Biosensors generated USD$116m revenue and $34m operating profit inFY09 (CY2Q09-1Q10). Of $34m operating profit, JWMS contributed$14.9m.
Unlocking value for JWMSJWMS' value to Weigao is manifested by the fact that Weigao's corporategross margin remains 55%, but stent business achieved an estimated GMof 85%-88%, and contributed to 17% of the total profit before tax. Strate-gically, Weigao also need new products for domestic market, as well asinternational expansion. As such, we believe it makes perfect sense forWeigao to acquire Biosensors or take a controlling stake. The three otheralternatives are unlikely in our opinion, including 1) Biosensors acquiringWeigao's 50% ownership, but Biosensors cash position is anemic and reg-ulatory obstacle remains insurmountable; 2) dissolving JWMS, but thisleads to a lose-lose situation; or 3) extending terms, which is less desirablevs. acquiring Biosensors based on aforementioned reasons.
Jack Hu, Ph.DResearch Analyst(+852) 2203 [email protected]
4 April 2011 Strategy Asia Equities Daily Focus
Page 36 Deutsche Bank AG/Hong Kong

Asia China Automobiles & Components
1 April 2011
Weichai Power Reuters: 2338.HK Bloomberg: 2338 HK Exchange: HKG Ticker: 2338
Normalizing growth; maintaining Hold Vincent Ha, CFA Research Analyst (+852) 2203 6247 [email protected]
Industry headwind to damper Weichai's otherwise strong prospects After achieving a better-than-expected set of FY10 results, Weichai has been experiencing muted engine and heavy-duty truck (HDT) sales YTD. This is in line with our view that China's HDT and construction machinery demand growth will stay sluggish in FY11E, given slowing FAI and export activities. However, we think Weichai is better positioned during this downturn due to its market share gains and effort to expand into newer engine segments to mitigate HDT demand volatility. We maintain Hold.
Forecasts and ratios
Year End Dec 31 2009A 2010A 2011E 2012E 2013E
Sales (CNYm) 35,260.9 62,665.5 68,441.4 77,059.4 85,184.4
Reported NPAT (CNYm) 3,406.9 6,780.9 7,155.6 8,257.8 9,084.8
DB EPS FD (CNY) 2.04 4.07 4.29 4.96 5.45
OLD DB EPS FD (CNY) 2.04 3.80 4.00 4.23 –
% Change 0.0% 7.0% 7.3% 17.1% –
DB EPS growth (%) 76.6 99.0 5.5 15.4 10.0
PER (x) 14.4 14.0 9.3 8.0 7.3
EV/EBITDA (x) 9.2 8.5 5.2 4.0 3.3
Yield (net) (%) 0.8 0.8 1.6 2.5 2.7Source: Deutsche Bank estimates, company data
1 DB EPS is fully diluted and excludes non-recurring items 2 Multiples and yields calculations use average historical prices for past years and spot prices for current and future years, except P/B which uses the year end close
Forecast Change
Hold Price at 31 Mar 2011 (HKD) 47.25Price target - 12mth (HKD) 51.7052-week range (HKD) 109.90 - 45.40HANG SENG INDEX 23,528
Key changes
Sales (FYE) 63,353 to 68,441 8.0%Op prof margin (FYE) 15.0 to 14.4 -3.6%Net profit (FYE) 6,671.0 to 7,155.6 7.3%
Price/price relative
0
2040
60
80
100
120
4/09 7/09 10/09 1/10 4/10 7/10 10/10 1/11Weichai Power
HANG SENG INDEX (Rebased)
Performance (%) 1m 3m 12mAbsolute -8.8 -1.3 -27.3HANG SENG INDEX 0.8 2.1 10.8
Stock data
Market cap (HKDm) 78,723Market cap (USDm) 10,121Shares outstanding (m) 1,666.1Major shareholders Weichai Gp (14.9%)Free float (%) 20Avg daily value traded (USDm) 17.3
Key indicators (FY1)
ROE (%) 32.9Net debt/equity (%) -36.5Book value/share (CNY) 14.98Price/book (x) 2.7Net interest cover (x) –Operating profit margin (%) 14.4
Stronger-than-expected FY10 results but signs of weakness YTD Weichai’s FY10 earnings surged 99% YoY to RMB6.8bn on a 77% YoY increase in revenue, in a good year for the HDT segment. This is slightly ahead of our estimate. An operating margin expansion of 1.3ppt was helped by improved product mix and well-managed cost control. In January-February, however, the company only recorded 5.6% YoY growth in sales of HDT engines, roughly in line with slowing China HDT sales volume growth of 7.1% YoY.
New products to secure above-industry growth Although we expect Weichai’s FY11E sales growth to be much slower than that in FY10, it likely will be supported by a widening product range of smaller and larger diesel engines. As a result, we think Weichai will outgrow its peers via new product sales and market share gain. Furthermore, with the implementation of China IV Emission Standard starting in 2012E, there could be upside risk in demand towards yearend 2011E on last-minute purchases of cheaper China III engines.
More prudent target price amid higher certainty over slowdown We raised our FY11-12 forecast for Weichai to reflect its pricing and margin resilience as shown in FY10. Yet, as we still expect FY11E EPS growth to be subdued amid more realistic concerns on HDT demand slowdown, we repegged our target valuation at 10x FY11E P/E (from 11x), in line with Weichai’s long-term average. Within the China auto sector, our top pick is Dongfeng Motor (0489.HK, Buy). Risks: strong rebound in HDT demand (upside); further slowdown in HDT sales and failure to grow the new business (downside).
4 April 2011 Strategy Asia Equities Daily Focus
Deutsche Bank AG/Hong Kong Page 37
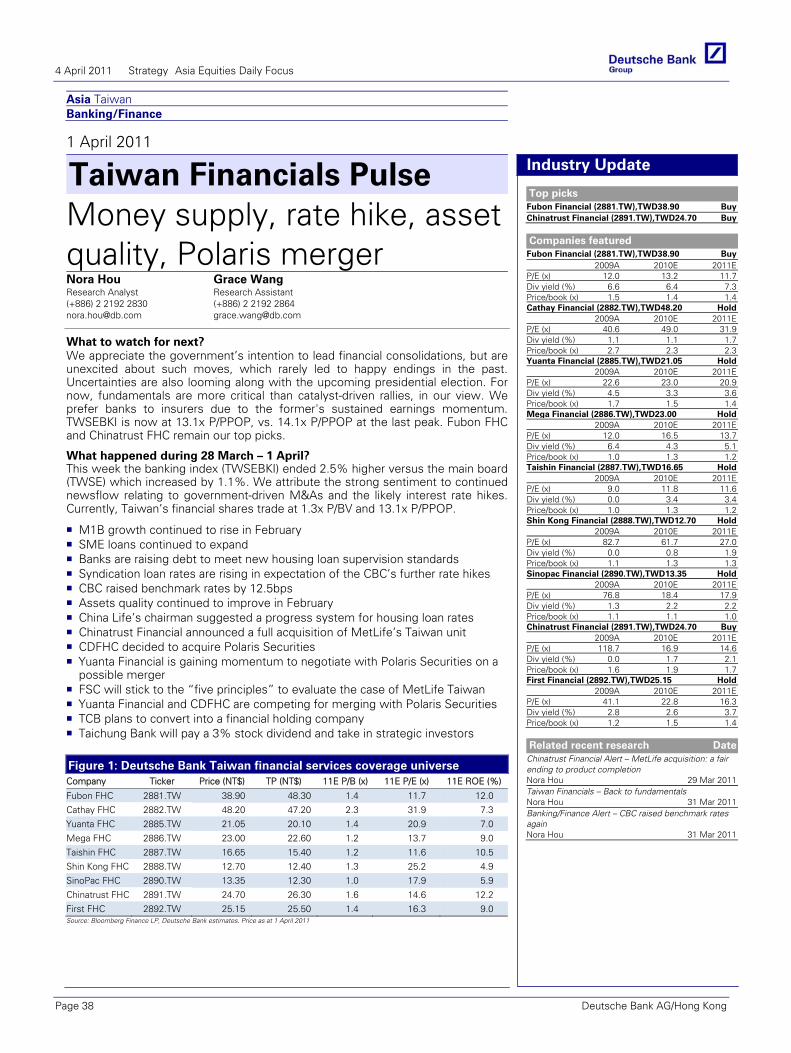
Asia Taiwan Banking/Finance
1 April 2011
Taiwan Financials Pulse Money supply, rate hike, asset quality, Polaris mergerNora Hou Research Analyst (+886) 2 2192 2830 [email protected]
Grace Wang Research Assistant (+886) 2 2192 2864 [email protected]
What to watch for next? We appreciate the government’s intention to lead financial consolidations, but are unexcited about such moves, which rarely led to happy endings in the past. Uncertainties are also looming along with the upcoming presidential election. For now, fundamentals are more critical than catalyst-driven rallies, in our view. We prefer banks to insurers due to the former's sustained earnings momentum. TWSEBKI is now at 13.1x P/PPOP, vs. 14.1x P/PPOP at the last peak. Fubon FHC and Chinatrust FHC remain our top picks.
Industry Update
Top picks Fubon Financial (2881.TW),TWD38.90 BuyChinatrust Financial (2891.TW),TWD24.70 Buy
Companies featured
Fubon Financial (2881.TW),TWD38.90 Buy2009A 2010E 2011E
P/E (x) 12.0 13.2 11.7Div yield (%) 6.6 6.4 7.3Price/book (x) 1.5 1.4 1.4Cathay Financial (2882.TW),TWD48.20 Hold
2009A 2010E 2011EP/E (x) 40.6 49.0 31.9Div yield (%) 1.1 1.1 1.7Price/book (x) 2.7 2.3 2.3Yuanta Financial (2885.TW),TWD21.05 Hold
2009A 2010E 2011EP/E (x) 22.6 23.0 20.9Div yield (%) 4.5 3.3 3.6Price/book (x) 1.7 1.5 1.4Mega Financial (2886.TW),TWD23.00 Hold
2009A 2010E 2011EP/E (x) 12.0 16.5 13.7Div yield (%) 6.4 4.3 5.1Price/book (x) 1.0 1.3 1.2Taishin Financial (2887.TW),TWD16.65 Hold
2009A 2010E 2011EP/E (x) 9.0 11.8 11.6Div yield (%) 0.0 3.4 3.4Price/book (x) 1.0 1.3 1.2Shin Kong Financial (2888.TW),TWD12.70 Hold
2009A 2010E 2011EP/E (x) 82.7 61.7 27.0Div yield (%) 0.0 0.8 1.9Price/book (x) 1.1 1.3 1.3Sinopac Financial (2890.TW),TWD13.35 Hold
2009A 2010E 2011EP/E (x) 76.8 18.4 17.9Div yield (%) 1.3 2.2 2.2Price/book (x) 1.1 1.1 1.0Chinatrust Financial (2891.TW),TWD24.70 Buy
2009A 2010E 2011EP/E (x) 118.7 16.9 14.6Div yield (%) 0.0 1.7 2.1Price/book (x) 1.6 1.9 1.7First Financial (2892.TW),TWD25.15 Hold
2009A 2010E 2011EP/E (x) 41.1 22.8 16.3Div yield (%) 2.8 2.6 3.7Price/book (x) 1.2 1.5 1.4
Related recent research Date
Chinatrust Financial Alert – MetLife acquisition: a fair ending to product completion Nora Hou 29 Mar 2011Taiwan Financials – Back to fundamentals Nora Hou 31 Mar 2011Banking/Finance Alert – CBC raised benchmark rates again Nora Hou 31 Mar 2011
What happened during 28 March – 1 April? This week the banking index (TWSEBKI) ended 2.5% higher versus the main board (TWSE) which increased by 1.1%. We attribute the strong sentiment to continued newsflow relating to government-driven M&As and the likely interest rate hikes. Currently, Taiwan’s financial shares trade at 1.3x P/BV and 13.1x P/PPOP.
M1B growth continued to rise in February SME loans continued to expand Banks are raising debt to meet new housing loan supervision standards Syndication loan rates are rising in expectation of the CBC’s further rate hikes CBC raised benchmark rates by 12.5bps Assets quality continued to improve in February China Life’s chairman suggested a progress system for housing loan rates Chinatrust Financial announced a full acquisition of MetLife’s Taiwan unit CDFHC decided to acquire Polaris Securities Yuanta Financial is gaining momentum to negotiate with Polaris Securities on a possible merger
FSC will stick to the “five principles” to evaluate the case of MetLife Taiwan Yuanta Financial and CDFHC are competing for merging with Polaris Securities TCB plans to convert into a financial holding company Taichung Bank will pay a 3% stock dividend and take in strategic investors
Figure 1: Deutsche Bank Taiwan financial services coverage universe Company Ticker Price (NT$) TP (NT$) 11E P/B (x) 11E P/E (x) 11E ROE (%)
Fubon FHC 2881.TW 38.90 48.30 1.4 11.7 12.0
Cathay FHC 2882.TW 48.20 47.20 2.3 31.9 7.3
Yuanta FHC 2885.TW 21.05 20.10 1.4 20.9 7.0
Mega FHC 2886.TW 23.00 22.60 1.2 13.7 9.0
Taishin FHC 2887.TW 16.65 15.40 1.2 11.6 10.5
Shin Kong FHC 2888.TW 12.70 12.40 1.3 25.2 4.9
SinoPac FHC 2890.TW 13.35 12.30 1.0 17.9 5.9
Chinatrust FHC 2891.TW 24.70 26.30 1.6 14.6 12.2
First FHC 2892.TW 25.15 25.50 1.4 16.3 9.0 Source: Bloomberg Finance LP, Deutsche Bank estimates. Price as at 1 April 2011
4 April 2011 Strategy Asia Equities Daily Focus
Page 38 Deutsche Bank AG/Hong Kong

Asia Korea, Republic ofAutomobiles & Components
03 Apr 2011 - 02:30:15 PM GMT
INDUSTRY ALERT Industry UpdateAutomobiles & Compo‐nents
March US auto sales best ever for Hyundai and Kia
Focus stocksHyundai Motor(005380.KS),KRW203,500.00 Buy,Price Target KRW270,000.00
Kia Motors(000270.KS),KRW68,700.00 Buy,Price Target KRW72,500.00
US auto demand up 17% YoY: US auto demand for the month of Marchwas up 17% YoY (26% MoM) and it was the seventh straight month forindustry demand to recover 10% or more. The industry SAAR of 13.1M unitswas highest since August 2009 when demand was boosted by “cash forclunkers" program. Industry demand YTD is up 20% YoY and our US autosteam now believes that 2011 U.S. SAAR could reach ~13.9M units; wellahead of its 13.0M units forecast. While availability of parts from Japancould affect the industry sales in the near term we believe that overall de‐mand recovery will continue in 2011.
Hyundai and Kia posted all time high sales: Korean automakers postedtheir best ever monthly sales performance in March. Hyundai and Kia's saleswere up 32% and 45% YoY respectively (42% and 35% MoM respectively).Hyundai's market share rose to 5% compared to 4.4% a year ago and inFebruary. Kia's market share improved to 3.6% compared to 2.9% a yearago (3.3% in February) and was its highest ever. Its popular models suchas Soul, Optima and Sorrento registered sales growth of 96%, 90% and20% YoY respectively. Hyundai's YTD sales to fleet are down 31% YTD(13% of the total sales versus 20% historically).
Customer incentives continue to decline: According to TrueCar.com av‐erage incentives per vehicle were down 6% MoM and 15% YoY to US$2,432. Although we are yet to receive customer incentive data for the lastmonth for Hyundai and Kia we estimate that their incentives were 55% and42% below the industry average respectively. This bodes very well for their1Q profitability. We believe that industry pricing may continue to improveover the next few months offsetting any industry sales mix shift due to highgasoline prices. We re‐iterate our bullish view on Hyundai and Kia Motors.
HMC/Kia monthly lgith vehicle m/s in US
Source: Company data, Bloomberg Finance LP
Sanjeev RanaResearch Analyst(+82) 2 316 8910sanjeev‐[email protected]
Jeremy KimResearch Associate(+82) 2 316 [email protected]
4 April 2011 Strategy Asia Equities Daily Focus
Deutsche Bank AG/Hong Kong Page 39

Asia Korea, Republic of Automobiles & Components
1 April 2011
Korean autos Carmakers' domestic sales up 8%, global sales up 11% YoYSanjeev Rana Research Analyst (+82) 2 316 8910 [email protected]
Jeremy Kim Research Associate (+82) 2 316 8902 [email protected]
Korean automakers' domestic car sales up 8%, global sales up 11% YoY Domestic sales of Korean automakers were up 8% YoY in March, aided by rising popularity of new models. In terms of YoY growth, Kia posted the best results—domestic sales up 21%. GM Daewoo and Ssangyong also did well on the back of new model launches. Exports did well too (+12% YoY), and global sales of Korea’s five automakers were up 11% YoY. Overall, despite 2010’s high base, we expect domestic auto demand to remain stable this year (-1% YoY) due to strong replacement demand and attractive new model launches.
Industry Update
Top picks Hyundai Motor (005380.KS),KRW203,500.00 BuyKia Motors (000270.KS),KRW68,700.00 Buy
Companies featured
Hyundai Motor (005380.KS),KRW203,500.00 Buy2009A 2010E 2011E
P/E (x) 5.9 8.3 7.4EV/EBITDA (x) 0.4 8.3 7.3Price/book (x) 1.21 1.66 1.39Kia Motors (000270.KS),KRW68,700.00 Buy
2009A 2010E 2011EP/E (x) 3.6 12.0 9.4EV/EBITDA (x) 4.3 11.9 10.2Price/book (x) 1.06 2.75 2.16
Mar domestic auto sales up 8% YoY
(50)
(25)
0
25
50
75
100
0
35
70
105
140
175
Jan-09 Jan-10 Jan-11
Total Domestic Market (LHS)YoY growth (RHS)
'000 %
Hyundai Motor: domestic +5% YoY, exports +1% YoY, overall +2% YoY Hyundai recorded domestic sales growth of 5% YoY (+26% MoM), aided by strong demand for its new models such as Avante and Grandeur: the New Avante was the best-selling model in Korea, registering 65% MoM growth, while the New Grandeur also maintained its strong sales momentum at over 11K units. As a result, Hyundai’s market share inched up 0.3ppt to 46.5% (vs. 46.2% last month and 48.1% a year ago). However, growth in export shipments was sluggish due to labor issues at its Ulsan plant, which affected the production of its recently launched Veloster and Accent models. Sales at overseas plants remained resilient (+8%YoY), with plants in Turkey and the US showing strong growth. Sales in China (-3.4% YoY) were affected by disruptions in tire supply from Kumho Tire following labor unrest at the tiremaker. On an absolute basis, total sales of 324,959 units in March were the highest in Hyundai’s history.
Kia Motors: domestic +21% YoY, exports +32% YoY, overall 30% YoY Kia Motors recorded strong sales growth in both domestic and overseas markets. In the domestic market, sales rose 21% YoY (+18% MoM). Sales of new Morning were strong again (+22% YoY) and it became the second best-selling model in Korea in March. On the other hand, the popularity of Hyundai’s Grandeur continues to affect sales of K7 (-38% YoY). Kia’s market share slid -1.9ppt to 34.6% (vs. 36.5% last month and 30.8% a year ago). Export shipments were up 32% YoY, helped by strong demand across all regions for its fuel-efficient small car model Morning (+222% MoM) and K5 model (+75% MoM). Its overseas plants in the US, China and Slovakia posted production growth of 90%, 17% and 28% YoY respectively.
Ssangyong, GM strong in the domestic market; Renault-Samsung slumped Ssangyong and GM posted strong growth in the domestic market (+83% and +30% YoY respectively) driven by the success of new models (Korando C for Ssangyong and Spark for GM). Combined market share of the two automakers touched 12.7% versus 10.0% last month and 9.9% a year ago. On the other hand, Renault-Samsung’s domestic sales slumped 41% YoY due to the declining popularity of its ageing SM3 and SM5 models and a shortage of parts from Japan after the earthquake. Separately, Renault-Samsung also announced a 20% production cut for April.
Maintaining Buy on Hyundai and Kia on strong sales growth and new models We expect Hyundai’s and Kia’s 2011E global sales to grow 10% YoY and 15% YoY respectively. We reaffirm our Buy ratings on both companies, with a target price of KRW270,000 for Hyundai and KRW72,500 for Kia. Key risks include faster-than-expected appreciation of the KRW and lower-than-expected demand.
4 April 2011 Strategy Asia Equities Daily Focus
Page 40 Deutsche Bank AG/Hong Kong

Asia ASEAN SingaporeProperty Property Trust
03 Apr 2011 - 02:26:44 PM GMT
COMPANY ALERT Company Update
Mapletree Logistics Trust Buy
Acquisition momentum continues
Reuters:MAPL.SI Exchange:SES Ticker:MAPL
Price (SGD) 0.90
Price target (SGD) 1.06
52-week range (SGD) 1.00 - 0.76
Market cap (USDm) 1,739
Shares outstanding (m) 2,426.3
Net debt/equity (%) 59.6
Book value/share (SGD) 0.86
Price/book (x) 1.1
FYE 12/31 2010A 2011E 2012E
Sales(SGDm)
219 250 255
Net Profit(SGDm)
163.1 153.7 156.2
DB EPS(SGD)
0.08 0.06 0.06
PER (x) 11.2 14.3 14.1
Yield(%) 7.1 7.0 7.1
Details of acquisitions from Dec 09 todate
Source: Deutsche Bank, MLT
MLT has announced its second acquisition this year, Jian Huang Building at15A Tuas Ave 18 for S$24.5m. This is a 5-storey well-specified warehousecum office building with total GFA of 15,400 sqm and remaining land leaseof 27 years located in the west of Singapore. The acquisition will be fundedusing proceed from planned divestments and will be financed with debt inthe interim which will increase gearing temporarily to around 40%. Uponcompletion of divestments, proceeds will be used to pare down debt. RecallMLT also previously divested 9 Tampines St 92 for S$12.5m end last year.
Enhancing stability of portfolio and domestic exposure. Under the sale-and-leaseback agreement, the property will be leased to the vendor, JianHuang Group for a 7-year period with built-in rental escalation of 2% pa andan option to extend for a further 7 years. Jian Huang is one of the contractorsof Sponsor Mapletree and has businesses in the construction and marineindustries in Singapore, Malaysia, China and Vietnam. Following this acqui-sition, MLT's total portfolio will increase to 98 properties valued at S$3.6bnwith average lease duration of 6 years. The share of gross revenue fromSingapore will increase slightly to 48.6%.
Yield accretive; more active portfolio management a positive. With anattractive NPI yield of 8.2% (on par with acquisition yields of 7.8%-8.7%achieved last year), we estimate a small 0.5% and 0.7% accretion to FY11and FY12 DPU respectively taking this acquisition in isolation. This wouldstill be DPU accretive assuming asset(s) are divested at a lower yield; as acomparison, the Singapore assets are yielding 6.6% on average based onthe latest book value. We view mgmt's proactive approach to asset man-agement and capital recycling positively which enables it to enhance thequality of its portfolio and sustain growth without relying solely on additionalequity raising. We continue to like MLT's steady distributions and defensive,well-diversified portfolio and maintain Buy with valuations attractive at 7.0%FY11e yield with potential upside from acquisitions.
Elaine Khoo, CFAResearch Analyst(+65) 6423 [email protected]
Gregory Lui, CFAStrategist(+65) 6423 [email protected]
4 April 2011 Strategy Asia Equities Daily Focus
Deutsche Bank AG/Hong Kong Page 41

Asia ASEAN SingaporeProperty Property
03 Apr 2011 - 02:09:19 PM GMT
INDUSTRY ALERT Industry UpdateProperty Home prices slow in 1Q as measures take effect
Focus stocksAllgreen Properties(AGRN.SI),SGD1.08 Hold, Price Tar‐get SGD1.12
CapitaLand Ltd (CATL.SI),SGD3.34Buy, Price Target SGD4.87
City Developments(CTDM.SI),SGD11.58 Sell, PriceTarget SGD10.67
Suntec REIT (SUNT.SI),SGD1.54Buy, Price Target SGD1.75
Wing Tai Hldgs (WTHS.SI),SGD1.54Hold, Price Target SGD1.81
CapitaCommercial Trust(CACT.SI),SGD1.40 Buy, Price Tar‐get SGD1.63
Keppel Land (KLAN.SI),SGD4.52Buy, Price Target SGD5.08
Private Property Price Index (PPI) and %QoQ
Source: URA, Deutsche Bank
The latest 1Q11 flash PPI from URA revealed a 2.1% QoQ (+13.6% YoY)increase in private home prices, a slight moderation from the 2.7% recordedlast quarter and marks the 6th consecutive quarter of deceleration. Pricesare now around 10% above the previous 1996 peak. In comparison, HDBresale prices rose a smaller 1.6% compared to 2.5% growth in 4Q.
Larger impact on the high-end segment from latest measures. Unlike4Q where prices accelerated in the Core Central Region, this trend reversedin 1Q with prices relatively flat (+0.9% vs +2.2% in 4Q). In contrast, pricesaccelerated 3.1% (vs +2.1% in 4Q) in Outside Central Region (encompass‐ing suburban mass market projects) supported by benchmark prices in newlaunches eg. Lakefront Residences, Jurong (S$1,075psf) and The Tennery,Choa Chu Kang (S$1,118psf). Prices in Rest of Central Region also rose afaster 2.2% (vs 1.9% in 4Q) on continued downsizing of units (eg. Spottis‐woode 18). This trend highlights the disproportionate impact of the latestround of measures on investment demand in the high‐end segment com‐pared to the more resilient demand in the low‐end segment driven by firsttime buyers who are unaffected by the measures.
Rising activity in HDB resale market. Major agencies have started to seea rise in HDB resale transactions in 1Q by 5‐8% QoQ as buyers (includingPRs) are increasingly priced out of the private housing market due to esca‐lating low‐end prices and as COVs stabilize at around S$18‐20,000 onaverage compared to S$23,000 in 4Q. Based on lodged caveats, HDB up‐graders account for around 37% of all private transactions down from a highof 60% in 1Q09 as the pricing gap expands. Demand for new launches couldbe affected if this trend persists, in our view.
Supply pipeline rising, cautious on residential. The tightness in the HDBand private mass market segment is reversing with the record supply in‐jection with an estimated total unsold inventory of c.47,000 units or 9%above LT avg. HDB has also increased the supply of new flats significantlyand will offer 22,000 new BTO flats this year if demand is sustained, inaddition to c.15,000 EC and DBSS units. We expect a continued decelera‐tion in private sales volume in the coming quarters with prices likely toflatten out. With rising downside risk, we remain cautious on residential andcontinue to prefer the commercial players and REITs. Top office picks Ke‐pLand, CCT and Suntec.
Elaine Khoo, CFAResearch Analyst(+65) 6423 [email protected]
Gregory Lui, CFAStrategist(+65) 6423 [email protected]
4 April 2011 Strategy Asia Equities Daily Focus
Page 42 Deutsche Bank AG/Hong Kong

Asia ASEAN Malaysia Telecommunications Wireless
1 April 2011
Maxis Reuters: MXSC.KL Bloomberg: MAXIS MK Exchange: KLS Ticker: MXSC
Entering fixed-line market with launch of “Home Services”Wei-Shi Wu Research Analyst (+65) 6423 4114 [email protected]
William Bratton Research Analyst (+852) 2203 6186 [email protected]
Entering potentially margin-dilutive fixed-line with “Home Services” launch Maxis’ recent “Home Services” launch marks its transition into an integrated service provider, with the ability to offer fixed-voice, broadband, mobile and IPTV services. But we are concerned Maxis’ fixed-line entry will increase competition and operational risks for the company while the fixed-line business is expected to be near-term margin-dilutive. Furthermore, related FTTH capex could compromise the company’s ability/willingness to accelerate shareholder returns going forward. But despite our cautious outlook, maintain Hold given limited downside to our TP.
Forecasts and ratios
Year End Dec 31 2009A 2010A 2011E 2012E 2013E
Sales (MYRm) 7,611.0 8,869.0 9,137.4 9,464.1 9,786.5
EBITDA (MYRm) 2,623.3 4,416.0 4,388.9 4,436.9 4,502.8
Reported NPAT (MYRm) 1,578.0 2,295.0 2,271.4 2,316.0 2,362.4
Reported EPS FD(MYR) 0.27 0.31 0.30 0.31 0.31
PER (x) 19.7 17.4 17.8 17.4 17.1
DPS (net) (MYR) 0.15 0.40 0.27 0.28 0.28
Yield (net) (%) 2.8 7.5 5.1 5.2 5.3Source: Deutsche Bank estimates, company data
1 DB EPS is fully diluted and excludes non-recurring items 2 Multiples and yields calculations use average historical prices for past years and spot prices for current and future years, except P/B which uses the year end close
Company Update
Hold Price at 31 Mar 2011 (MYR) 5.38Price target - 12mth (MYR) 4.6052-week range (MYR) 5.53 - 5.12KLSE COMPOSITE 1,545
Price/price relative
4.8
5.2
5.6
6.0
6.4
6.8
11/09 2/10 5/10 8/10 11/10 2/11Maxis
KLSE COMPOSITE (Rebased)
Performance (%) 1m 3m 12mAbsolute -0.9 1.5 0.7KLSE COMPOSITE 3.6 1.7 17.0
Stock data
Market cap (MYRm) 40,350Market cap (USDm) 13,322Shares outstanding (m) 7,500.0Major shareholders Maxis Communications (70%)Free float (%) 30Avg daily value traded (USDm) 5.4
Key indicators (FY1)
ROE (%) 25.7Net debt/equity (%) 52.0Book value/share (MYR) 1.20Price/book (x) 4.5Net interest cover (x) 14.3Operating profit margin (%) 35.6
Comparatives
Telekom Malaysia (TLMM.KL),MYR4.04 Sell2010A 2011E 2012E
P/E (x) 22.2 26.8 26.3EV/EBITDA (x) 4.8 5.9 5.9Price/book (x) 1.6 2.1 2.1
Related recent research Date
Growing signs of competition risks in broadband Wei-Shi Wu 23 Mar 2011Buy DiGi, Sell TM post 2010; key trends to watch in 2011 Wei-Shi Wu 07 Mar 2011FY10 results in-line; 40 sen/share total div payout Wei-Shi Wu 28 Feb 2011
Competitive pricing but (very) limited content line-up Maxis has launched its fibre-enabled “Home Services”, with three price plans offering bundled fixed-voice, broadband, mobile and IPTV services. The key differentiating factor from TM’s Uni-Fi product is mobile, which TM does not currently offer. Pricing is competitive with Maxis’ plans at a 12-20% discount vs TM’s “Uni-Fi” offerings. Maxis’ packages include a relatively generous amount of free VoIP minutes and a 3-month IPTV trial (although at 5 channels, content is currently limited and less attractive than TM’s IPTV channel line-up). There are plans to launch a full suite of services by 3Q11. According to press reports, 10k subs have expressed interest in the service, representing 0.3% of Maxis’ post-paid base. See p.3 for comparison of Maxis’ and TM’s integrated service bundles.
Concerns around FTTH capex and margin-dilutive fixed business Service delivery is supported by a combination of HSBB wholesale access from TM and Maxis’ own FTTH network deployment. Despite management’s previous indication they could maintain FY11e dividend payout at similar levels to FY10a, we remain concerned lofty FTTH capex could reduce Maxis’ ability/willingness to accelerate shareholder returns going forward. For reference, we currently project RM1.4bn annual capex over the next few years. Furthermore, we expect the fixed-line business will be margin-dilutive over the near term.
DCF-derived RM4.60 target price; key risks include competition and capex Our target price for Maxis is derived using DCF analysis based on 7.4% WACC (2.4% risk free rate and 6.6% equity risk premium) and 1% terminal growth rate to reflect the long-term potential of the Malaysian mobile market. Key risks include competition and capex (see p.4 for details).
4 April 2011 Strategy Asia Equities Daily Focus
Deutsche Bank AG/Hong Kong Page 43
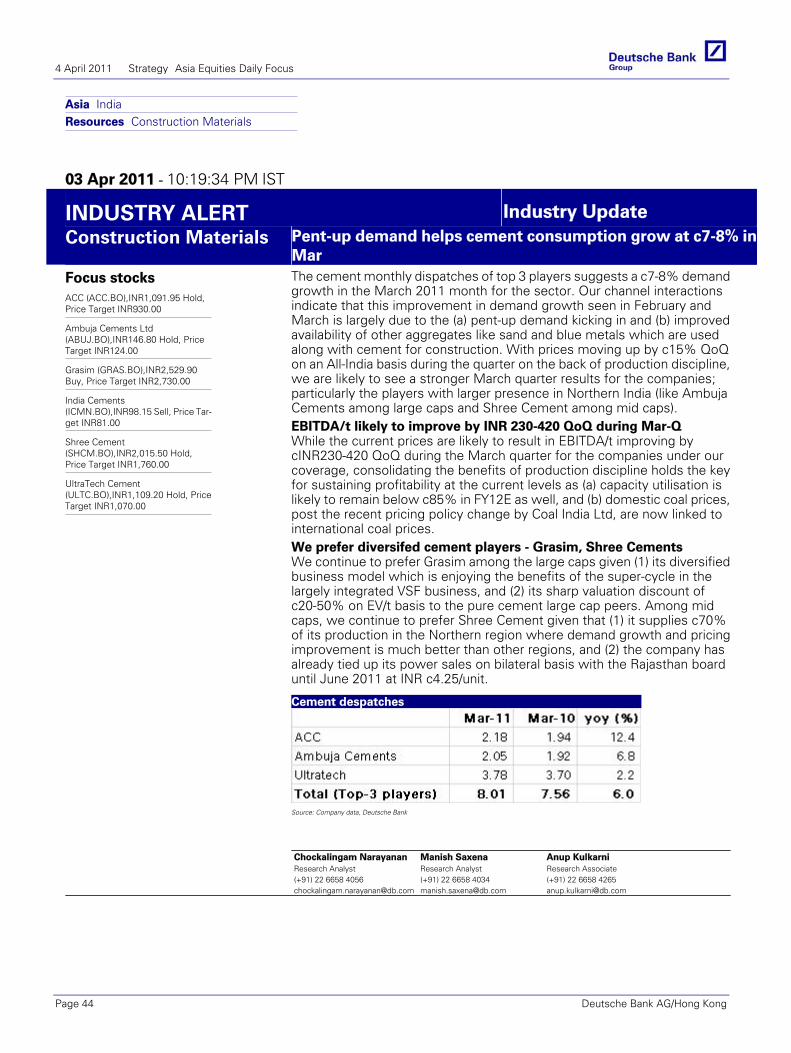
Asia IndiaResources Construction Materials
03 Apr 2011 - 10:19:34 PM IST
INDUSTRY ALERT Industry UpdateConstruction Materials Pent-up demand helps cement consumption grow at c7-8% in
MarFocus stocksACC (ACC.BO),INR1,091.95 Hold,Price Target INR930.00
Ambuja Cements Ltd(ABUJ.BO),INR146.80 Hold, PriceTarget INR124.00
Grasim (GRAS.BO),INR2,529.90Buy, Price Target INR2,730.00
India Cements(ICMN.BO),INR98.15 Sell, Price Tar‐get INR81.00
Shree Cement(SHCM.BO),INR2,015.50 Hold,Price Target INR1,760.00
UltraTech Cement(ULTC.BO),INR1,109.20 Hold, PriceTarget INR1,070.00
The cement monthly dispatches of top 3 players suggests a c7‐8% demandgrowth in the March 2011 month for the sector. Our channel interactionsindicate that this improvement in demand growth seen in February andMarch is largely due to the (a) pent‐up demand kicking in and (b) improvedavailability of other aggregates like sand and blue metals which are usedalong with cement for construction. With prices moving up by c15% QoQon an All‐India basis during the quarter on the back of production discipline,we are likely to see a stronger March quarter results for the companies;particularly the players with larger presence in Northern India (like AmbujaCements among large caps and Shree Cement among mid caps).EBITDA/t likely to improve by INR 230-420 QoQ during Mar-QWhile the current prices are likely to result in EBITDA/t improving bycINR230‐420 QoQ during the March quarter for the companies under ourcoverage, consolidating the benefits of production discipline holds the keyfor sustaining profitability at the current levels as (a) capacity utilisation islikely to remain below c85% in FY12E as well, and (b) domestic coal prices,post the recent pricing policy change by Coal India Ltd, are now linked tointernational coal prices.We prefer diversifed cement players - Grasim, Shree CementsWe continue to prefer Grasim among the large caps given (1) its diversifiedbusiness model which is enjoying the benefits of the super‐cycle in thelargely integrated VSF business, and (2) its sharp valuation discount ofc20‐50% on EV/t basis to the pure cement large cap peers. Among midcaps, we continue to prefer Shree Cement given that (1) it supplies c70%of its production in the Northern region where demand growth and pricingimprovement is much better than other regions, and (2) the company hasalready tied up its power sales on bilateral basis with the Rajasthan boarduntil June 2011 at INR c4.25/unit.
Cement despatches
Source: Company data, Deutsche Bank
Chockalingam NarayananResearch Analyst(+91) 22 6658 [email protected]
Manish SaxenaResearch Analyst(+91) 22 6658 [email protected]
Anup KulkarniResearch Associate(+91) 22 6658 [email protected]
4 April 2011 Strategy Asia Equities Daily Focus
Page 44 Deutsche Bank AG/Hong Kong

Asia IndiaConsumer
01 Apr 2011 - 03:44:05 PM IST
COMPANY ALERT Breaking News
HUL Hold
Mean reversion.
Reuters:HLL.BO Exchange:BSE Ticker:HLL
Price (INR) 284.60
Price target (INR) 266.00
52-week range (INR) 325.65 -221.30
Market cap (USDm) 13,923
Shares outstanding (m) 2,181.7
Net debt/equity (%) -91.9
Book value/share (INR) 13.76
Price/book (x) 20.7
FYE 3/31 2010A 2011E 2012E
Sales (INRm) 175,238 192,532 216,959
Net Profit(INRm)
22,020.3 21,889.0 26,370.0
DB EPS(INR)
9.64 10.03 12.09
PER (x) 26.7 28.4 23.5
Yield (net)(%)
2.5 2.5 3.0
Proctor and Gamble has cut shampoo (Pantene) prices by 15%. We believethat the company despite its weaker distribution power will still impactHUL's shampoo brand "Clear Plus" and "Dove". Clear Plus is an approx INR6 bn brand with 60% of its sales coming from sachets and Dove is an approxINR 5 bn brand (soaps and shampoos put together) and is the fastest grow-ing brand for HUL. HUL has an approximately 45% market share in sham-poos and we believe that it will respond to maintain its market share.Ironically, this battleground has opened the day HUL announced an upwardreveision in detergent prices by 2-9%. Call this reversion to the mean!!!Additionally, the company is facing tremendous pressure on the raw mate-rial front esp palm oil (up 56% YoY, 15% QoQ).Maintain EPS of INR 10 per share in FY11and INR 12 per share in FY12.Maintian hold (TP Rs266).
Source: Deutsche Bank
Harrish ZaveriResearch Analyst(+91) 22 6658 [email protected]
Gaurav BhatiaResearch Associate(+91) 22 6658 [email protected]
4 April 2011 Strategy Asia Equities Daily Focus
Deutsche Bank AG/Hong Kong Page 45

Asia IndiaAutomobiles & Components
03 Apr 2011 - 11:46:35 PM IST
COMPANY ALERT Breaking News
Mahindra & Mahindra Buy
March-11 volumes: robust tractor volumes; UVs lag
Reuters:MAHM.BO Exchange:BSE Ticker:MAHM
Price (INR) 698.60
Price target (INR) 820.00
52-week range (INR) 813.05 -502.65
Market cap (USDm) 8,736
Shares outstanding (m) 578.4
Net debt/equity (%) 9.0
Book value/share (INR) 168.83
Price/book (x) 4.1
FYE 3/31 2010A 2011E 2012E
Sales (INRm) 180,248 222,504 269,930
Net Profit(INRm)
20,877.5 26,003.5 29,216.1
DB EPS(INR)
35.34 43.54 48.92
PER (x) 12.3 16.0 14.3
Yield (net)(%)
2.2 1.4 1.7
M&M's March-11 domestic tractor volumes (18,729, +25% YoY) continuedto be robust whereas the growth in utility vehicles (16,302, +14% YoY)continued to lag our expectations. For FY11, tractor volumes at 201,786(+22% YoY) came ahead our estimate of 12% growth whereas utility vehi-cles (UV) at 169,166 (+12% YoY) were below our estimates (DB est at 20%).Management commentary indicates that they are facing component short-ages in UVs and are unable to meet the demand. Our FY12E/13E growthestimates for UVs are 20%/ 18% and for tractors are 12%/10% respective-ly.We maintain our Buy rating on the stock with a target price of Rs 820. Thestock currently trades at 12.5xFY12E core EPS.
Key highlights (see table below):* 4-wheeler pick-up volumes were at 11,520 units (+15% YoY) and 3-wheel-er volumes were 5,769 units (+32% YoY) for March-2011.* For FY11, 4W pick-up volumes at 105,626 (+39% YoY) were in line withour estimates and 3W volumes at 62,142 (+40% YoY) came in a shadeabove our estimates.
Mahindra: monthly volume trends
Source: Company, Deutsche Bank
Srinivas Rao, CFAResearch Analyst(+91) 22 6658 [email protected]
Amyn PiraniResearch Analyst(+91) 22 6658 [email protected]
4 April 2011 Strategy Asia Equities Daily Focus
Page 46 Deutsche Bank AG/Hong Kong

Asia IndiaAutomobiles & Components
03 Apr 2011 - 09:12:58 PM IST
COMPANY ALERT Breaking News
Maruti Suzuki Limited Hold
March-11 volumes:strong numbers; maintain Hold
Reuters:MRTI.BO Exchange:BSE Ticker:MRTI
Price (INR) 1,263.55
Price target (INR) 1,500.00
52-week range (INR) 1,562.85 -1,131.35
Market cap (USDm) 8,188
Shares outstanding (m) 289.0
Net debt/equity (%) -51.8
Book value/share (INR) 480.45
Price/book (x) 2.6
FYE 3/31 2010A 2011E 2012E
Sales (INRm) 289,585 356,342 441,206
Net Profit(INRm)
24,976.0 22,935.7 28,810.0
DB EPS(INR)
86.89 79.36 99.69
PER (x) 15.2 15.9 12.7
Yield (net)(%)
0.5 0.5 0.6
Maruti's March 2011 volumes at 121,952 units (+28% YoY) continue to bestrong and came in ahead of market expectations. The company had beenaveraging a monthly run-rate of 110K over the last six months since theyde-bottlenecked their capacity. We do note that both management com-mentary and channel checks suggested that discounts were higher inMarch compared to the preceding few months. Overall, FY11 volumes forMaruti came a shade ahead of our estimates at 1.27mn (25% YoY, DB estat 1.26mn). We forecast FY12E/13E volumes at 1.51mn/1.75mn.Maruti has managed to claw back some of the market share it had lost inthe compact car segment at the beginning of the year due to productionconstraints. The combined marketshare of the challengers - Ford, Volkswa-gen, GM, Nissan - has stagnated at 12% since May-10. However, Maruti'sdominance (c45% share) in the Indian four wheeler market may face a threatfrom Toyota's Etios (launched in November). Toyota and Honda are alsoexpected to launch their new compact cars by 2HFY12.We maintain our Hold rating on the stock with a target price of Rs 1500. Thestock trades at 14.5xFY12E core EPS (Rs 69). The key issue for Maruti is theimpact of increased competitive intensity on its margins.
Key Highlights (see table below):* Domestic volumes were at 110,424 units (+39% YoY) and exports at11,528 (-26% YoY).* Continued strength in A2 (compact car) volumes (78,460units, +43% YoY)and C segment (Omni + Eeco) volumes (14,416 units, +33% YoY).
Maruti - monthly volume trends
Source: Company, Deutsche BankSrinivas Rao, CFAResearch Analyst(+91) 22 6658 [email protected]
Amyn PiraniResearch Analyst(+91) 22 6658 [email protected]
4 April 2011 Strategy Asia Equities Daily Focus
Deutsche Bank AG/Hong Kong Page 47

Asia IndiaAutomobiles & Components
03 Apr 2011 - 10:07:42 PM IST
COMPANY ALERT Breaking News
Tata Motors Ltd Buy
March-11 volumes: in line nos; maintain as top pick
Reuters:TAMO.BO Exchange:BSE Ticker:TAMO
Price (INR) 1,247.50
Price target (INR) 1,465.00
52-week range (INR) 1,365.60 -673.70
Market cap (USDm) 17,093
Shares outstanding (m) 611.0
Net debt/equity (%) 100.9
Book value/share (INR) 332.44
Price/book (x) 3.8
FYE 3/31 2010A 2011E 2012E
Sales (INRm) 904,568 1,213,557 1,463,988
Net Profit(INRm)
-5,698.4 98,704.9 124,599.5
DB EPS(INR)
17.10 153.42 187.36
PER (x) 31.1 8.1 6.7
Yield (net)(%)
3.0 1.3 1.3
Tata Motors' domestic medium and heavy commercial vehicle (MHCV) vol-umes displayed an expected sequential uptrend in March 2011 (23,338units, +12% YoY). Volumes for FY11 at 192,067 units (+24%YoY) came inline with our estimates. Domestic light commercial vehicle (LCV) volumescontinued to be strong in March 2011 (26,415, +18% YoY) and FY11 vol-umes at 254,655 units (+17%YoY) were also in line with estimates. Weforecast domestic MHCV volumes to grow at 12%/10% in FY12E/13E. LCVvolumes are forecast to grow at 10% p.a. FY12E and FY13E. We expectvolume growth to moderate as CV demand enters a mid-cycle stage.We maintain our Buy rating and preferred pick status on Tata Motors witha target price of Rs 1465. Our positive outlook on the company is based onthe continued turnaround in the Jaguar Land Rover (JLR) business (65% ofEBITDA) and robust volume outlook in US and China. The stock currentlytrades at 4.5xFY12E EV/EBITDA.
Key highlights (see table below): * Overall volumes for March-11 andFY11 were 83,363 units (+11% YoY) and 803,665 units (25% YoY).* Domestic passenger car volumes (excluding Nano) at 14,134 (Mar-11) fell26% YoY. Indica volumes were weak at 6,937 (-40% YoY) whereas Indigovolumes were flat at 7,197. Domestic utility vehicles (UVs) volumes wereat 4,837 units (+24% YoY) for March-11 and 42,297 units (26% YoY) forFY11. Overall, TAMO's passenger vehicle (ex-Nano) growth in FY11 at 12%has significantly underperformed industry growth of 30%.* Nano March-11 volumes came at 8,707 units (+85% YoY). FY11 volumeswere 70,432 (+132% YoY).
Tata Motors: monthly domestic volume trends
Source: Company, Deutsche Bank
Srinivas Rao, CFAResearch Analyst(+91) 22 6658 [email protected]
Amyn PiraniResearch Analyst(+91) 22 6658 [email protected]
4 April 2011 Strategy Asia Equities Daily Focus
Page 48 Deutsche Bank AG/Hong Kong

Asia IndiaAutomobiles & Components
03 Apr 2011 - 10:15:31 PM IST
COMPANY ALERT Breaking News
TVS Motor Buy
March-11 volumes: strong momentum; maintain Buy
Reuters:TVSM.BO Exchange:BSE Ticker:TVSM
Price (INR) 60.00
Price target (INR) 92.00
52-week range (INR) 83.35 - 40.28
Market cap (USDm) 639
Shares outstanding (m) 475.0
Net debt/equity (%) 69.1
Book value/share (INR) 20.31
Price/book (x) 3.0
FYE 3/31 2010A 2011E 2012E
Sales (INRm) 43,631 61,930 73,589
Net Profit(INRm)
880.1 1,984.1 2,818.8
DB EPS(INR)
1.85 4.18 5.93
PER (x) 15.0 14.4 10.1
Yield (net)(%)
2.2 2.1 2.5
TVS's March 2011 volumes continued to display strong trends in both thetwo-wheeler (2W) and three-wheeler (3W) segments. 3W volumes for FY11at 39,929 (+167% YoY) have been higher than our forecast of 37,790(+150% YoY). We highlight that our positive investment case on the stockis based on the expected shift in sales mix towards 3W which are ~3x moreprofitable than TVS's existing 2W portfolio. FY11 2W volumes at 2mn(+32% YoY) were in line with our estimates. We forecast 3W volumes togrow by 45%/35% in FY12E/13E to 55K/74K units. 2W volumes are esti-mated to grow by 15%/11.5% in FY12E/13E to 2.3mn/2.55mn.We maintain our Buy rating on the stock with a target price of Rs 92. Thestock currently trades at 12xFY12E EPS (after adjusting for negative equityvalue of the investments in Indonesia), which is a c20% discount to its peersHero Honda (HROH.BO, Rs 1602, Hold) and Bajaj (BAJA.NS, Rs 1459, Buy).We believe the continued strength in 3W volumes and increasing proportionof its new scooter - Wego - in its 2W volumes should lead to margin ex-pansion (6.4% in FY11E to 7.4% in FY13E), leading to an EPS CAGR(FY11-13E) of 31%.
Key highlights (see table below):
* Domestic 2W volume in March 2011 was at 162,719 (+29% YoY), ledmainly by strong scooter numbers (42,655 units, +50% YoY). TVS's do-mestic 2W volumes grew a tad higher than sector -- Hero Honda (515,852units, 24% YoY).* TVS's FY11 domestic 2W sales (1.78mn, +31% YoY) outperformed HeroHonda (5.4mn, 17% YoY).
Source: Deutsche Bank, company data
Amyn PiraniResearch Analyst(+91) 22 6658 [email protected]
Srinivas Rao, CFAResearch Analyst(+91) 22 6658 [email protected]
4 April 2011 Strategy Asia Equities Daily Focus
Deutsche Bank AG/Hong Kong Page 49
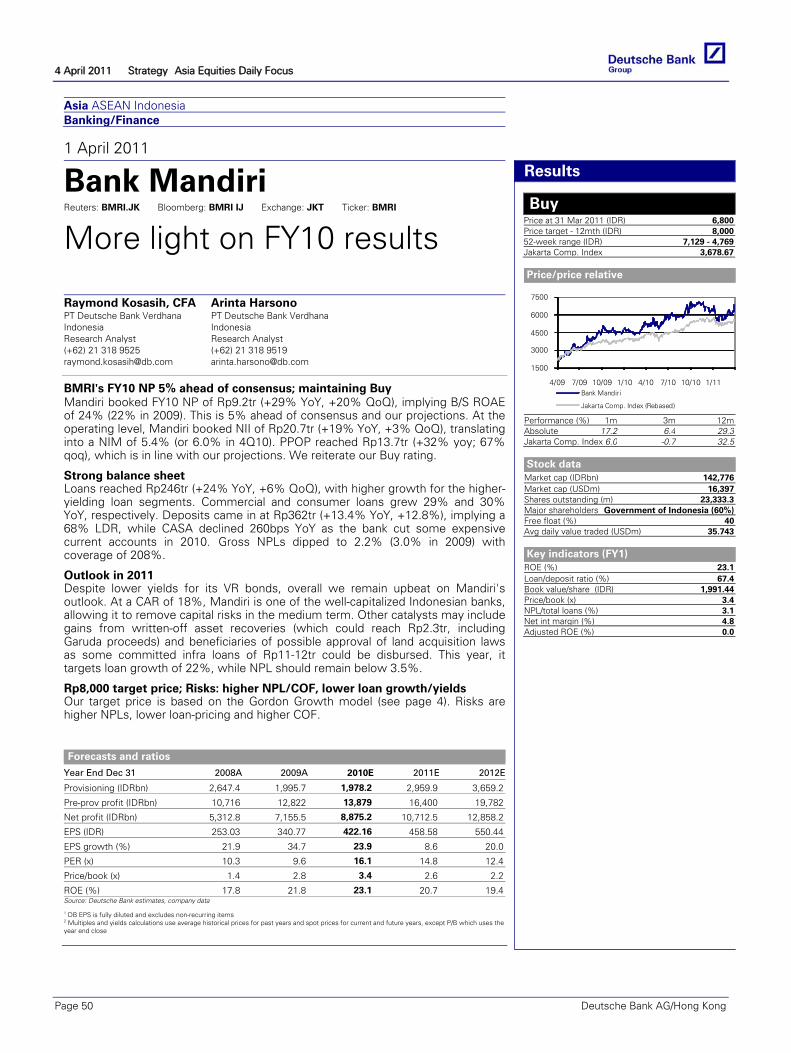
Asia ASEAN Indonesia Banking/Finance
1 April 2011
Bank Mandiri Reuters: BMRI.JK Bloomberg: BMRI IJ Exchange: JKT Ticker: BMRI
More light on FY10 results
Raymond Kosasih, CFA PT Deutsche Bank Verdhana Indonesia Research Analyst (+62) 21 318 9525 [email protected]
Arinta Harsono PT Deutsche Bank Verdhana Indonesia Research Analyst (+62) 21 318 9519 [email protected]
BMRI's FY10 NP 5% ahead of consensus; maintaining Buy Mandiri booked FY10 NP of Rp9.2tr (+29% YoY, +20% QoQ), implying B/S ROAE of 24% (22% in 2009). This is 5% ahead of consensus and our projections. At the operating level, Mandiri booked NII of Rp20.7tr (+19% YoY, +3% QoQ), translating into a NIM of 5.4% (or 6.0% in 4Q10). PPOP reached Rp13.7tr (+32% yoy; 67% qoq), which is in line with our projections. We reiterate our Buy rating.
Forecasts and ratios
Year End Dec 31 2008A 2009A 2010E 2011E 2012E
Provisioning (IDRbn) 2,647.4 1,995.7 1,978.2 2,959.9 3,659.2
Pre-prov profit (IDRbn) 10,716 12,822 13,879 16,400 19,782
Net profit (IDRbn) 5,312.8 7,155.5 8,875.2 10,712.5 12,858.2
EPS (IDR) 253.03 340.77 422.16 458.58 550.44
EPS growth (%) 21.9 34.7 23.9 8.6 20.0
PER (x) 10.3 9.6 16.1 14.8 12.4
Price/book (x) 1.4 2.8 3.4 2.6 2.2
ROE (%) 17.8 21.8 23.1 20.7 19.4Source: Deutsche Bank estimates, company data
1 DB EPS is fully diluted and excludes non-recurring items 2 Multiples and yields calculations use average historical prices for past years and spot prices for current and future years, except P/B which uses the year end close
Results
Buy Price at 31 Mar 2011 (IDR) 6,800Price target - 12mth (IDR) 8,00052-week range (IDR) 7,129 - 4,769Jakarta Comp. Index 3,678.67
Price/price relative
1500
3000
4500
6000
7500
4/09 7/09 10/09 1/10 4/10 7/10 10/10 1/11Bank Mandiri
Jakarta Comp. Index (Rebased)
Performance (%) 1m 3m 12mAbsolute 17.2 6.4 29.3Jakarta Comp. Index 6.0 -0.7 32.5
Stock data
Market cap (IDRbn) 142,776Market cap (USDm) 16,397Shares outstanding (m) 23,333.3Major shareholders Government of Indonesia (60%)Free float (%) 40Avg daily value traded (USDm) 35.743
Key indicators (FY1)
ROE (%) 23.1Loan/deposit ratio (%) 67.4Book value/share (IDR) 1,991.44Price/book (x) 3.4NPL/total loans (%) 3.1Net int margin (%) 4.8Adjusted ROE (%) 0.0
Strong balance sheet Loans reached Rp246tr (+24% YoY, +6% QoQ), with higher growth for the higher-yielding loan segments. Commercial and consumer loans grew 29% and 30% YoY, respectively. Deposits came in at Rp362tr (+13.4% YoY, +12.8%), implying a 68% LDR, while CASA declined 260bps YoY as the bank cut some expensive current accounts in 2010. Gross NPLs dipped to 2.2% (3.0% in 2009) with coverage of 208%. Outlook in 2011 Despite lower yields for its VR bonds, overall we remain upbeat on Mandiri's outlook. At a CAR of 18%, Mandiri is one of the well-capitalized Indonesian banks, allowing it to remove capital risks in the medium term. Other catalysts may include gains from written-off asset recoveries (which could reach Rp2.3tr, including Garuda proceeds) and beneficiaries of possible approval of land acquisition laws as some committed infra loans of Rp11-12tr could be disbursed. This year, it targets loan growth of 22%, while NPL should remain below 3.5%.
Rp8,000 target price; Risks: higher NPL/COF, lower loan growth/yields Our target price is based on the Gordon Growth model (see page 4). Risks are higher NPLs, lower loan-pricing and higher COF.
4 April 2011 Strategy Asia Equities Daily Focus 4 April 2011 Strategy Asia Equities Daily Focus
Page 50 Deutsche Bank AG/Hong Kong

Asia ASEAN IndonesiaResources Metals & Mining
01 Apr 2011 - 08:08:37 AM GMT
COMPANY ALERT Results
Bumi Hold
First take on FY10 - NP up by 63% YoY
Reuters:BUMI.JK Exchange:JKT Ticker:BUMI
Price (IDR) 3,350
Price target (IDR) NA
52-week range (IDR) 3,350.00 -1,290.00
Market cap (USDm) 7,992
Shares outstanding (m) 20,773.4
Net debt/equity (%) 160.5
Book value/share (USD) 0.10
Price/book (x) 3.9
FYE 12/31 2009A 2010E 2011E
Sales (US-Dm)
3,219 3,745 4,793
Net Profit(USDm)
190.4 287.8 477.2
DB EPS(USD)
0.01 0.01 0.02
PER (x) 14.3 47.1 16.7
Yield (net)(%)
1.5 0.0 0.9
FY10 gross revenues USD4,370mn (+19%YoY) were in line with our fore-cast, while OP (USD1099mn, +72% YoY) and Reported NP (USD311mn,+63%YoY) were 6% and 8% above our forecast respectively.
FY10:- Contribution from associated income (primarily stake in Newmont) nearlytripled to USD236mn, in-line additional stake acquisition & strong commod-ity price.- Interest expense ballooned nearly threefold to USD523mn, reflecting sig-nificantly loans secured in 2H09 and throughout the year.- Recorded USD141mn gain on its divestment in the Bengalon barge port(in KPC) in 1H.- Recorded USD178mn gains from derivative contracts (tied to the 5% CB& some prepayment option on the CIC loan), mostly booked in 4Q10.- Effective tax rate remained at 46%, whilst minority interest expense was43% of pre-minorities profits compared to only 33% in FY09.
4Q10:- Revenues +15%QoQ, 1%YoY; OP reversed last year's losses, +29%QoQ.- Reported NP also reversed last year's losses, +121%, the QoQ jump ben-efited from lower interest expense (given the refinancing in 4Q10), bookingof USD214mn of gains on derivatives contract (tied to the 5% CB & someprepayment option on the CIC loan).
Cherie KhoengPT Deutsche Bank Verdhana In-donesiaResearch Analyst(+62) 21 318 [email protected]
Heriyanto IrawanPT Deutsche Bank Verdhana In-donesiaResearch Analyst(+62) 21 318 [email protected]
4 April 2011 Strategy Asia Equities Daily Focus 4 April 2011 Strategy Asia Equities Daily Focus
Deutsche Bank AG/Hong Kong Page 51
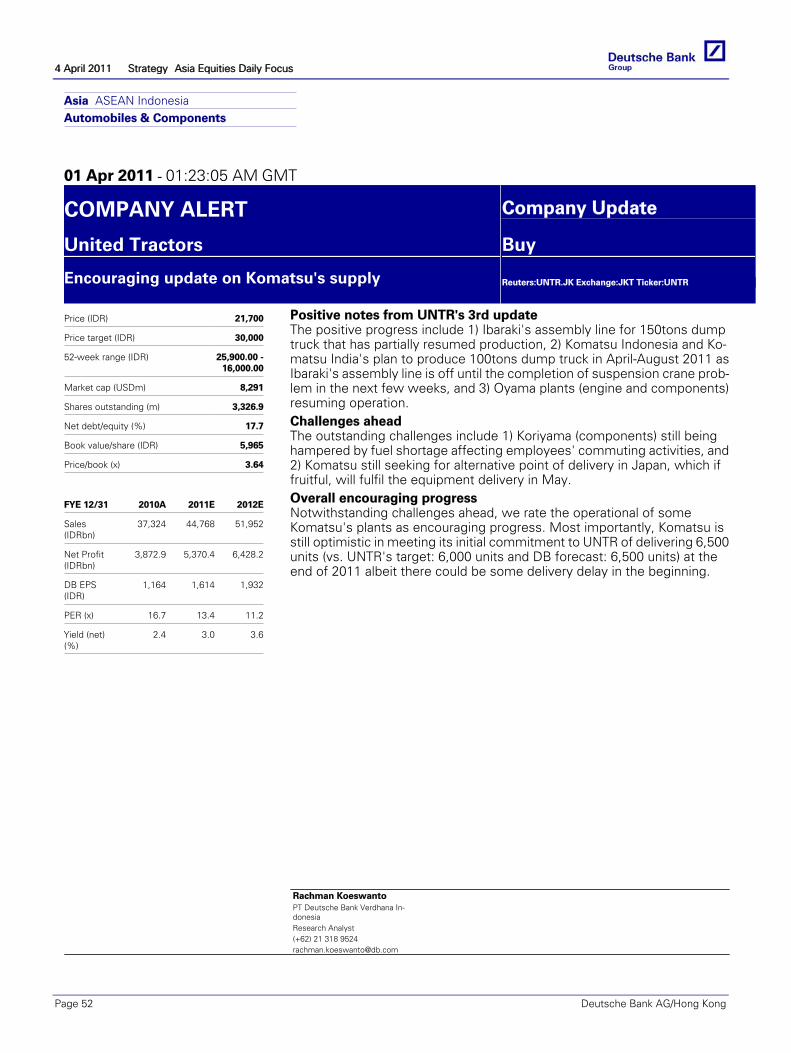
Asia ASEAN IndonesiaAutomobiles & Components
01 Apr 2011 - 01:23:05 AM GMT
COMPANY ALERT Company Update
United Tractors Buy
Encouraging update on Komatsu's supply
Reuters:UNTR.JK Exchange:JKT Ticker:UNTR
Price (IDR) 21,700
Price target (IDR) 30,000
52-week range (IDR) 25,900.00 -16,000.00
Market cap (USDm) 8,291
Shares outstanding (m) 3,326.9
Net debt/equity (%) 17.7
Book value/share (IDR) 5,965
Price/book (x) 3.64
FYE 12/31 2010A 2011E 2012E
Sales(IDRbn)
37,324 44,768 51,952
Net Profit(IDRbn)
3,872.9 5,370.4 6,428.2
DB EPS(IDR)
1,164 1,614 1,932
PER (x) 16.7 13.4 11.2
Yield (net)(%)
2.4 3.0 3.6
Positive notes from UNTR's 3rd updateThe positive progress include 1) Ibaraki's assembly line for 150tons dumptruck that has partially resumed production, 2) Komatsu Indonesia and Ko-matsu India's plan to produce 100tons dump truck in April-August 2011 asIbaraki's assembly line is off until the completion of suspension crane prob-lem in the next few weeks, and 3) Oyama plants (engine and components)resuming operation.Challenges aheadThe outstanding challenges include 1) Koriyama (components) still beinghampered by fuel shortage affecting employees' commuting activities, and2) Komatsu still seeking for alternative point of delivery in Japan, which iffruitful, will fulfil the equipment delivery in May.Overall encouraging progressNotwithstanding challenges ahead, we rate the operational of someKomatsu's plants as encouraging progress. Most importantly, Komatsu isstill optimistic in meeting its initial commitment to UNTR of delivering 6,500units (vs. UNTR's target: 6,000 units and DB forecast: 6,500 units) at theend of 2011 albeit there could be some delivery delay in the beginning.
Rachman KoeswantoPT Deutsche Bank Verdhana In-donesiaResearch Analyst(+62) 21 318 [email protected]
4 April 2011 Strategy Asia Equities Daily Focus 4 April 2011 Strategy Asia Equities Daily Focus
Page 52 Deutsche Bank AG/Hong Kong

Asia ASEAN Thailand Banking/Finance Banks
4 April 2011
Kasikornbank Reuters: KBAN.BK Bloomberg: KBANK TB Exchange: SET Ticker: KBAN
Looking for solid 1Q11 earnings Worawat Saisuphatphol, CFA Tisco Securities Co, Ltd Research Analyst (+66) 2 633 6463 [email protected]
Expect strong 1Q11 earnings; reiterate BUY rating We expect KBANK to announce 1Q11 earnings of Bt5.9bn, a rise of 36% YoY and 12% QoQ. The YoY increase should be driven by strong loan growth of 13.8% YoY), an increase in NIM of 14bps YoY (old accounting standard) and non-interest income growth of 19% YoY. KBANK’s earnings should rise QoQ due to decent credit growth and healthy non-interest income. Reiterate Buy with TP of Bt164.
Forecasts and ratios
Year End Dec 31 2009A 2010A 2011E 2012E 2013E
Net profit (THBm) 14,804.4 19,928.3 24,662.5 28,782.4 32,105.6
EPS (THB) 6.19 8.33 10.30 12.03 13.41
EPS growth (%) -3.6 34.6 23.8 16.7 11.5
PER (x) 10.5 12.1 12.7 10.9 9.7
Price/book (x) 1.70 2.23 2.04 1.81 1.60
DPS (net) (THB) 2.25 2.25 2.92 3.79 4.23
Yield (net) (%) 3.5 2.2 2.2 2.9 3.2
ROE (%) 12.7 15.6 17.1 17.7 17.4Source: Deutsche Bank estimates, company data
1 DB EPS is fully diluted and excludes non-recurring items 2 Multiples and yields calculations use average historical prices for past years and spot prices for current and future years, except P/B which uses the year end close
Results
Buy Price at 1 Apr 2011 (THB) 130.50Price target - 12mth (THB) 164.0052-week range (THB) 130.50 - 83.50SET 1,064
Price/price relative
40
60
80
100
120
140
4/09 7/09 10/09 1/10 4/10 7/10 10/10 1/11Kasikornbank
SET (Rebased)
Performance (%) 1m 3m 12mAbsolute 9.2 4.0 33.5SET 7.0 3.1 32.8
Stock data
Market cap (THBm) 312,320Market cap (USDm) 10,309Shares outstanding (m) 2,393.3Major shareholders –Free float (%) 90Avg daily value traded (USDm) 35.4
Key indicators (FY1)
ROE (%) 17.1Loan/deposit ratio (%) 98.3Book value/share (THB) 63.92Price/book (x) 2.0NPL/total loans (%) 2.8Net int margin (%) 3.98Adjusted ROE (%) 0.0
Focus on quality with 2011 loan growth target of 7-9% being maintained Despite the positive signs on loan demand, KBANK’s management is not certain whether the new investment cycle will be sustained. It is, therefore, maintaining a conservative guidance on 2011 loan growth of 7-9%. Its key business strategy is on value chain solutions with the target to increase its market shares in key industries, such as petrochemicals, retail/wholesale, transportation, construction and auto, to 30% from the current 17% within the next 3 years.
Liquidity management and locking in long-term funding In February, KBANK’s LDR had fallen to 93% vs. its target of 95% due to Bt64bn of deposit inflow from its special deposit campaign. In March, more sizable inflow is expected due to its aggressive deposit campaign (effective rate of 3.5% p.a. with a 16-month maturity). We expect its LDR to fall further to 92% in 1Q11 (LDR with borrowing of 84% vs. target of 92-93%). This helps reduce liquidity pressure and should only add around 10bps to average funding costs.
Target price raised slightly to Bt164 implying a P/BV of 2.6x Our TP of Bt164 implies a P/BV of 2.6x for 2011F. We derived this using the dividend discount model and assuming a CoE of 12.6% (vs. the market CoE of 11.4%) and L/T growth of 8.6% (sustained growth in book value). Key risks include renewed political unrest, intensified competition especially in the SME loan segment, delays in raising interest rates and expense overruns for its KT program.
4 April 2011 Strategy Asia Equities Daily Focus
Deutsche Bank AG/Hong Kong Page 53

Asia ASEAN Thailand Resources Construction Materials
1 April 2011
Siam Cement Reuters: SCC.BK Bloomberg: SCC TB Exchange: SET Ticker: SCC
Takeaways from SCC Reverse Roadshow Sansanee Srijamjuree Tisco Securities Co, Ltd Research Analyst (+66) 2 633 6475 [email protected]
Reiterate BUY on strong growth potential Information from the SCC Reverse Roadshow reinforced our positive view of the company’s earnings outlook and growth prospects. Volume growth in its petrochem division and increased sales of PP and HVA products should help insulate its earnings during the petrochemical trough and provide strong growth potential during the 2012-13 up-cycle. Maintain Buy.
Forecasts and ratios
Year End Dec 31 2009A 2010A 2011E 2012E 2013E
Sales (THBm) 238,664.3 301,323.1 314,017.1 344,967.1 359,236.2
EBITDA (THBm) 44,046.1 41,943.3 53,773.2 62,708.3 71,291.4
Reported NPAT (THBm) 24,345.5 37,381.9 31,990.5 40,110.7 44,782.2
Reported EPS FD(THB) 20.29 31.15 26.66 33.43 37.32
DB EPS FD(THB) 20.36 22.82 26.66 33.43 37.32
DB EPS growth (%) 48.0 12.1 16.8 25.4 11.6
PER (x) 8.0 12.0 13.2 10.5 9.4
EV/EBITDA (x) 5.8 8.9 8.8 7.2 6.0
DPS (net) (THB) 8.50 14.02 12.00 15.04 16.79
Yield (net) (%) 5.2 5.1 3.4 4.3 4.8Source: Deutsche Bank estimates, company data
1 DB EPS is fully diluted and excludes non-recurring items 2 Multiples and yields calculations use average historical prices for past years and spot prices for current and future years, except P/B which uses the year end close
Company Update
Buy Price at 31 Mar 2011 (THB) 351.00Price target - 12mth (THB) 434.0052-week range (THB) 353.00 - 234.00SET 1,047
Price/price relative
0
100
200
300
400
4/09 7/09 10/09 1/10 4/10 7/10 10/10 1/11Siam Cement
SET (Rebased)
Performance (%) 1m 3m 12mAbsolute 12.9 2.9 36.6SET 6.0 1.4 32.9
Stock data
Market cap (THBm) 421,200Market cap (USDm) 13,926Shares outstanding (m) 1,200.0Major shareholders The Crown Property Bureau Free float (%) 70Avg daily value traded (USDm) 775,648,967.7
Key indicators (FY1)
ROE (%) 22.9Net debt/equity (%) 51.4Book value/share (THB) 121.56Price/book (x) 2.89Net interest cover (x) 6.8Operating profit margin (%) 12.8
Volume growth in petrochemical business to drive earnings PE spread should have bottomed out as global ethylene capacity will rise by only 6mt this year (compared with 12mt in 2010 and demand growth of 6-7mt p.a.) and 3mt next year while there is no new supply beyond 2012. Hence, we expect the up-cycle to begin in 2012. Meanwhile the PP spread remains high at US$720/t and this should be sustained given limited new supply and strong demand from the auto and electronic appliance sectors. Well-positioned for further expansion and M&A opportunities Earnings of cement and building product businesses should be boosted by demand growth and expected price hikes while paper earnings should be fairly stable due to flat sales volume and spread. SCC has postponed a decision to invest in a petrochemical complex in Vietnam until 2H11 due to problems in securing project financing and expected political change there. Given huge cash on hand of Bt70bn at end-2010, SCC is looking for M&A opportunities and investment in core businesses in this region. Maintain profit forecasts and TP of Bt434; key risks We stand by our profit forecasts and TP of Bt434, derived using the EV/CE model (EV/CE = (ROCE-g)/(WACC-g)). Risks include uneven economic growth, falling petrochem spreads, rising energy costs, political unrest, and start-up delays at new petrochem plants at Map Ta Phut (see page 4).
4 April 2011 Strategy Asia Equities Daily Focus
Page 54 Deutsche Bank AG/Hong Kong

4 April 2011 Strategy Asia Equities Daily Focus
Deutsche Bank AG/Hong Kong Page 55
Appendix 1 Important Disclosures
Additional information available upon request
For disclosures pertaining to recommendations or estimates made on a security mentioned in this report, please see the most recently published company report or visit our global disclosure look-up page on our website at http://gm.db.com/ger/disclosure/DisclosureDirectory.eqsr.
Analyst Certification
The views expressed in this report accurately reflect the personal views of the undersigned lead analyst about the subject issuers and the securities of those issuers. In addition, the undersigned lead analyst has not and will not receive any compensation for providing a specific recommendation or view in this report. Ching-Li Teo
Equity rating key Equity rating dispersion and banking relationships Buy: Based on a current 12- month view of total share-holder return (TSR = percentage change in share price from current price to projected target price plus pro-jected dividend yield ) , we recommend that investors buy the stock. Sell: Based on a current 12-month view of total share-holder return, we recommend that investors sell the stock Hold: We take a neutral view on the stock 12-months out and, based on this time horizon, do not recommend either a Buy or Sell. Notes: 1. Newly issued research recommendations and target prices always supersede previously published research.2. Ratings definitions prior to 27 January, 2007 were:
Buy: Expected total return (including dividends) of 10% or more over a 12-month period Hold: Expected total return (including dividends) between -10% and 10% over a 12-month period Sell: Expected total return (including dividends) of -10% or worse over a 12-month period
7%
32%
61%
11%12%13%
0
100
200
300
400
500
Buy Hold Sell
Asia-Pacific Universe
Companies Covered Cos. w/ Banking Relationship

4 April 2011 Strategy Asia Equities Daily Focus
Page 56 Deutsche Bank AG/Hong Kong
Regulatory Disclosures
1. Important Additional Conflict Disclosures
Aside from within this report, important conflict disclosures can also be found at https://gm.db.com/equities under the "Disclosures Lookup" and "Legal" tabs. Investors are strongly encouraged to review this information before investing.
2. Short-Term Trade Ideas
Deutsche Bank equity research analysts sometimes have shorter-term trade ideas (known as SOLAR ideas) that are consistent or inconsistent with Deutsche Bank's existing longer term ratings. These trade ideas can be found at the SOLAR link at http://gm.db.com.
3. Country-Specific Disclosures
Australia: This research, and any access to it, is intended only for "wholesale clients" within the meaning of the Australian Corporations Act. Brazil: The views expressed above accurately reflect personal views of the authors about the subject company(ies) and its(their) securities, including in relation to Deutsche Bank. The compensation of the equity research analyst(s) is indirectly affected by revenues deriving from the business and financial transactions of Deutsche Bank. EU countries: Disclosures relating to our obligations under MiFiD can be found at http://globalmarkets.db.com/riskdisclosures. Japan: Disclosures under the Financial Instruments and Exchange Law: Company name - Deutsche Securities Inc. Registration number - Registered as a financial instruments dealer by the Head of the Kanto Local Finance Bureau (Kinsho) No. 117. Member of associations: JSDA, The Financial Futures Association of Japan. Commissions and risks involved in stock transactions - for stock transactions, we charge stock commissions and consumption tax by multiplying the transaction amount by the commission rate agreed with each customer. Stock transactions can lead to losses as a result of share price fluctuations and other factors. Transactions in foreign stocks can lead to additional losses stemming from foreign exchange fluctuations. "Moody's", "Standard & Poor's", and "Fitch" mentioned in this report are not registered as rating agency in Japan unless specifically indicated as Japan entities of such rating agencies. New Zealand: This research is not intended for, and should not be given to, "members of the public" within the meaning of the New Zealand Securities Market Act 1988. Russia: This information, interpretation and opinions submitted herein are not in the context of, and do not constitute, any appraisal or evaluation activity requiring a license in the Russian Federation.

Deutsche Bank AG/Hong Kong
North American locations
Deutsche Bank Securities Inc. 60 Wall Street New York, NY 10005 Tel: (212) 250 2500
Deutsche Bank Securities Inc. One International Place 12th Floor Boston, MA 02110 United States of America Tel: (1) 617 217 6100
Deutsche Bank Securities Inc. 222 South Riverside Plaza 30th Floor Chicago, IL 60606 Tel: (312) 537-3758
Deutsche Bank Securities Inc. 3033 East First Avenue Suite 303, Third Floor Denver, CO 80206 Tel: (303) 394 6800
Deutsche Bank Securities Inc. 1735 Market Street 24th Floor Philadelphia, PA 19103 Tel: (215) 854 1546
Deutsche Bank Securities Inc. 101 California Street 46th Floor San Francisco, CA 94111 Tel: (415) 617 2800
Deutsche Bank Securities Inc. 700 Louisiana Street Houston, TX 77002 Tel: (832) 239-4600
International locations
Deutsche Bank Securities Inc. 60 Wall Street New York, NY 10005 United States of America Tel: (1) 212 250 2500
Deutsche Bank AG London 1 Great Winchester Street London EC2N 2EQ United Kingdom Tel: (44) 20 7545 8000
Deutsche Bank AG Große Gallusstraße 10-14 60272 Frankfurt am Main Germany Tel: (49) 69 910 00
Deutsche Bank AG Deutsche Bank Place Level 16 Corner of Hunter & Phillip Streets Sydney, NSW 2000 Australia Tel: (61) 2 8258 1234
Deutsche Bank AG Level 55 Cheung Kong Center 2 Queen's Road Central Hong Kong Tel: (852) 2203 8888
Deutsche Securities Inc. 2-11-1 Nagatacho Sanno Park Tower Chiyoda-ku, Tokyo 100-6171 Japan Tel: (81) 3 5156 6701
Global Disclaimer The information and opinions in this report were prepared by Deutsche Bank AG or one of its affiliates (collectively "Deutsche Bank"). The information herein is believed to be reliable and has been obtained from public sources believed to be reliable. Deutsche Bank makes no representation as to the accuracy or completeness of such information.
Deutsche Bank may engage in securities transactions, on a proprietary basis or otherwise, in a manner inconsistent with the view taken in this research report. In addition, others within Deutsche Bank, including strategists and sales staff, may take a view that is inconsistent with that taken in this research report.
Opinions, estimates and projections in this report constitute the current judgement of the author as of the date of this report. They do not necessarily reflect the opinions of Deutsche Bank and are subject to change without notice. Deutsche Bank has no obligation to update, modify or amend this report or to otherwise notify a recipient thereof in the event that any opinion, forecast or estimate set forth herein, changes or subsequently becomes inaccurate. Prices and availability of financial instruments are subject to change without notice. This report is provided for informational purposes only. It is not an offer or a solicitation of an offer to buy or sell any financial instruments or to participate in any particular trading strategy. Target prices are inherently imprecise and a product of the analyst judgement.
As a result of Deutsche Bank’s recent acquisition of BHF-Bank AG, a security may be covered by more than one analyst within the Deutsche Bank group. Each of these analysts may use differing methodologies to value the security; as a result, the recommendations may differ and the price targets and estimates of each may vary widely.
Deutsche Bank has instituted a new policy whereby analysts may choose not to set or maintain a target price of certain issuers under coverage with a Hold rating. In particular, this will typically occur for "Hold" rated stocks having a market cap smaller than most other companies in its sector or region. We believe that such policy will allow us to make best use of our resources. Please visit our website at http://gm.db.com to determine the target price of any stock.
The financial instruments discussed in this report may not be suitable for all investors and investors must make their own informed investment decisions. Stock transactions can lead to losses as a result of price fluctuations and other factors. If a financial instrument is denominated in a currency other than an investor's currency, a change in exchange rates may adversely affect the investment. Past performance is not necessarily indicative of future results. Deutsche Bank may with respect to securities covered by this report, sell to or buy from customers on a principal basis, and consider this report in deciding to trade on a proprietary basis.
Unless governing law provides otherwise, all transactions should be executed through the Deutsche Bank entity in the investor's home jurisdiction. In the U.S. this report is approved and/or distributed by Deutsche Bank Securities Inc., a member of the NYSE, the NASD, NFA and SIPC. In Germany this report is approved and/or communicated by Deutsche Bank AG Frankfurt authorized by the BaFin. In the United Kingdom this report is approved and/or communicated by Deutsche Bank AG London, a member of the London Stock Exchange and regulated by the Financial Services Authority for the conduct of investment business in the UK and authorized by the BaFin. This report is distributed in Hong Kong by Deutsche Bank AG, Hong Kong Branch, in Korea by Deutsche Securities Korea Co. This report is distributed in Singapore by Deutsche Bank AG, Singapore Branch, and recipients in Singapore of this report are to contact Deutsche Bank AG, Singapore Branch in respect of any matters arising from, or in connection with, this report. Where this report is issued or promulgated in Singapore to a person who is not an accredited investor, expert investor or institutional investor (as defined in the applicable Singapore laws and regulations), Deutsche Bank AG, Singapore Branch accepts legal responsibility to such person for the contents of this report. In Japan this report is approved and/or distributed by Deutsche Securities Inc. The information contained in this report does not constitute the provision of investment advice. In Australia, retail clients should obtain a copy of a Product Disclosure Statement (PDS) relating to any financial product referred to in this report and consider the PDS before making any decision about whether to acquire the product. Deutsche Bank AG Johannesburg is incorporated in the Federal Republic of Germany (Branch Register Number in South Africa: 1998/003298/10). Additional information relative to securities, other financial products or issuers discussed in this report is available upon request. This report may not be reproduced, distributed or published by any person for any purpose without Deutsche Bank's prior written consent. Please cite source when quoting.
Copyright © 2011 Deutsche Bank AG