3rd quarter report, - dg cement
TRANSCRIPT

2018
3rd Quarter Report,March 31,
(Un-audited)

Company Information 02
Contact Us 03
Directors’ Report 04
Interim Financial StatementsCondensed Interim Balance Sheet 10
Condensed Interim Profit and Loss Account 12
Condensed Interim Statement of Comprehensive Income 13
Condensed Interim Cash Flow Statement 14
Condensed Interim Statement of Changes in Equity 15
Notes to the Condensed Interim Financial Information 16
Interim Consolidated Financial StatementsCondensed Interim Consolidated Balance Sheet 28
Condensed Interim Consolidated Profit and Loss Account 30
Condensed Interim Consolidated Statement of
Comprehensive Income 31
Condensed Interim Consolidated Cash Flow Statement 32
Condensed Interim Consolidated Statement of Changes in Equity 33
Notes to the Condensed Interim Consolidated
Financial Information 34
Contents
DG Cement 3rd Quarter 201801

DG Cement 3rd Quarter 201802
Company Information
Mrs. Naz Mansha ChairpersonMr. Raza Mansha Chief ExecutiveMr. Khalid Niaz KhawajaMr. Mohammad Arif Hameed Mr. Khalid Qadeer Qureshi Mr. Farid Noor Ali FazalMr. Shahzad Ahmad Malik
Mr. Khalid Niaz Khawaja Member/ChairmanMr. Khalid Qadeer Qureshi MemberMr. Mohammad Arif Hameed Member
Mr. Khalid Niaz Khawaja Member/ChairmanMr. Raza Mansha Member Mr. Khalid Qadeer Qureshi Member
Mr. Khalid Mahmood Chohan
Mr. Raza Mansha Chief Executive OfficerMr. Aftab Ahmad Khan Director FinanceDr. Arif Bashir Director Technical & OperationsMr. Farid Noor Ali Fazal Director MarketingMr. Inayat Ullah Niazi Chief Financial Officer
Allied Bank Limited MCB Islamic Bank Limited Bank Alfalah Limited Meezan Bank LimitedBank Al-Habib Limited National Bank of PakistanBank Islami Pakistan Limited Samba Bank LimitedDubai Islamic Bank Soneri Bank LimitedFaysal Bank Limited Standard Chartered BankHabib Bank Limited Limited (Pakistan) LimitedHabib Metropolitan Bank The Bank of KhyberMCB Bank Limited The Bank of PunjabUnited Bank Limited A.F. Ferguson & Co., Chartered Accountants
Mr. Shahid Hamid, Bar-at-Law
0006469
1213275-6
0402252300164
DGKC
Board of Directors
Audit Committee
Human Resource &Remuneration Committee
Company Secretary
Management
Local Bankers
External Auditors
Legal Advisors
CUIN
NTN
STRN
Symbol

DG Cement 3rd Quarter 201803
Nishat House, 53-A, Lawrence Road,Lahore-PakistanUAN: 92 42 111 11 33 33 Fax: 92 42 36367414Email: [email protected] site: www.dgcement.com
Khofli Sattai, Distt., Dera Ghazi Khan-PakistanPhone: 92-641-460025-7Fax: 92-641-462392Email: [email protected]
12, K.M. Choa Saidan Shah Road,Khairpur, Tehsil Kallar Kahar, Distt. Chakwal-PakistanPhone: 92-543-650215-8Fax: 92-543-650231
Chichaee Gadani Main RCD, Hub,Distt. Lasbela, PakistanUAN: 92 42 111 11 33 33
THK Associates (Pvt) LtdHead Office, Karachi1st Floor, 40-C, Block-6, P.E.C.H.S., Karachi.Tel: (021) 111 000 322Fax: (021) 34168271
Branch Office, LahoreDYL Motorcycles Ltd. Office,147-Q Block, Behind Emporium Mall, Johar Town, LahoreCell: 0303-4444795, 0323-8999514
Mr. Inayat Ullah Niazi Chief Financial OfficerE-mail: [email protected]: 0092 42 111 11 33 33
Mr. Khalid Mehmood Chohan Company SecretaryE-mail: [email protected]: 0092 42 111 11 33 33
Registered Office
Factories
Share Registrar
For Investors’ Information,Comments, Inquiries,Complaints:
Contact Us

The directors of your company are pleased to present you the FY18 nine monthly performance numbers:
PKR in thousands
NMFY18 NMFY17Sales 23,375,208 22,632,898Cost of sales 16,205,907 13,418,020Gross profit 7,169,301 9,214,878Administrative expenses 455,124 395,118Selling and distribution expenses 691,209 727,700Other operating expenses 656,266 715,489Other income 1,638,931 1,617,407Finance cost 318,025 272,329Profit before taxation 6,687,608 8,721,649Taxation 1,717,779 2,267,629Profit after taxation 4,969,829 6,454,020EPS 11.34 14.73
Production and Sales volumetric data is as under:
Figures in MT
NMFY18 NMFY17Clinker Production 3,227,719 3,198,299Cement Production 3,658,872 3,408,206Cement -Total Sales 3,692,466 3,400,842Cement Local Sales (Excluding own consumption) 3,312,951 2,959,316Cement Exports Sales 379,515 441,526Clinker Local Purchases 20,959 -Clinker Local Sales 26,576 -
Volumetric change
% change for NMFY18 wrt NMFY17
Clinker Production 0.92 Cement Production 7.35 Cement -Total Sales 8.58 Cement Local Sales (Excluding own consumption) 11.95 Cement Exports Sales (14.04)
DG Cement 3rd Quarter 201804
Directors’ Report

Q1HY18 Q1HY17 Q2HY18 Q2HY17 HY18 HY17 Q3HY18 Q3HY17 NM18 NM17GP margin (%) 35 44 32 42 33 43 25 36 31 41PBT margin (%) 33 42 31 41 32 41 22 33 29 39
Company sales grew by 9% in volumes but only 3% in value in current nine months in comparison with last year’s figures. GP margin recorded at 31% (NMFY17: 41%) for nine months and 25% (Q3Fy17: 36%) for third quarter. PBT and PAT ratios to sales remained at 29% and 21% respectively for nine months in comparison with 38% and 28% respectively of comparable period. EPS decreased by 23% for nine months.
Major reason for this decline in profitability is reduction in gross margins. This is majorly result of high coal prices. COGS moved upward by 21%. On the other hand, sales volumetric increase could not be translated effectively into value due to tough market conditions. Prices continue to move downward in first two months of Q3. In March, however, prices started picking up backed by strong demand across country.
Pakistan Cement Industry reported a growth of 18% in local market and a decline of 8% in exports. On overall basis the industrial growth for nine months of this fiscal years remained at 15%. This is very encouraging trend and a good indication for economic development. Q3 of this year registered 19% more domestic sales than of last year. If we compare Q3 with Q2 of this year, domestic sales are increased by 6.5%. During third quarter of FY18, PKR lost about 4.5% against USD and in nine months time of this fiscal year PKR lost about 10%. [104.97=>110.70=>115.71]. 6 months KIBOR that was around 6.15% in first and second quarter moved to around 6.61% at the end of third quarter. Pressure on balance of payment, oil prices and inflation will continue to test economy. However, expected GDP growth rate for this fiscal year is encouraging.
Cement sales are expected to continue the overwhelming trend of growth on local front. Prices of cement also gained on back of strong demand recently. CPEC activities and household sector will be main contributories. Other ongoing PSDP projects will make cement demand high. One of the important developments is approval of Diamer Bhasha dam and allocation of land for it. This project is initially approved for building water reservoir phase while electricity generation phase will be done later. Mohmand Dam Hydropower Project also got green signal from ministry of planning.
On future profitability positive impacts will be coming from high cement demand and demand-based price gain while fluctuating FX, high coal prices and upward trending inflation will counter the positive impacts simultaneously. The Hub project is expected to be operational in last quarter of this financial year.
Principal activity of the Company is manufacture and sale of cement and following are the principal risks the Company face:
• Tight price market and tough competition• Capacity utilization• Interest rate• Foreign currency fluctuations• Shrinking exports market
DG Cement 3rd Quarter 201805


31 March, 30 June, 2018 2017 Un-Audited Audited Note (Rupees in thousand)
EQUITY AND LIABILITIES
CAPITAL AND RESERVES
Authorised share capital - 950,000,000 (June 30, 2017: 950,000,000) ordinary shares of Rs 10 each 9,500,000 9,500,000 - 50,000,000 (June 30, 2017: 50,000,000) preference shares of Rs 10 each 500,000 500,000 10,000,000 10,000,000 Issued, subscribed and paid up share capital 438,119,118 (June 30, 2017: 438,119,118) ordinary shares of Rs 10 each 4,381,191 4,381,191 Reserves 38,774,439 38,014,337 Accumulated profit 34,157,287 32,473,351 77,312,917 74,868,879
NON-CURRENT LIABILITIES
Long term finances - secured 5 18,487,676 12,520,000 Long term deposits 89,876 79,441 Retirement and other benefits 226,297 186,837 Deferred taxation 6,186,219 5,866,359 24,990,068 18,652,637
CURRENT LIABILITIES
Trade and other payables 6,261,050 5,454,447 Short term borrowings - secured 9,290,539 8,571,228 Current portion of non-current liabilities 1,304,945 523,778 Accrued finance cost 315,150 217,204 Derivative financial instrument - 48,056 Provision for taxation 35,090 35,090 17,206,774 14,849,803CONTINGENCIES AND COMMITMENTS 6 - - 119,509,759 108,371,319
The annexed notes 1 to 16 form an integral part of this condensed interim financial information.
DG Cement 3rd Quarter 201810
Balance SheetCondensed Interim Unconsolidated
Chief Executive

31 March, 30 June, 2018 2017 Un-Audited Audited Note (Rupees in thousand)
ASSETS
NON-CURRENT ASSETS
Property, plant and equipment 7 72,392,759 62,447,737 Investments 8 18,678,736 18,564,054 Long term loans, advances and deposits 59,823 58,844 91,131,318 81,070,635
CURRENT ASSETS
Stores, spares and loose tools 5,518,346 4,939,420 Stock-in-trade 458,121 1,162,914 Trade debts 266,019 220,182 Investments 8 17,829,553 17,044,084 Advances, deposits, prepayments and other receivables 2,909,089 1,987,849 Loan to related party 1,000,000 1,000,000 Income tax receivable 21,825 524,355 Cash and bank balances 375,488 421,880 28,378,441 27,300,684
119,509,759 108,371,319
DG Cement 3rd Quarter 201811
As At March 31, 2018
DirectorChief Financial Officer

DG Cement 3rd Quarter 201812
DirectorChief Executive Chief Financial Officer
Profit And Loss AccountFor the Quarter and Nine Months Ended March 31, 2018 (Un-audited)
2018 2017
July to January to July to January to
March March March March
Note (Rupees in thousand) (Rupees in thousand)
Sales 23,375,208 7,611,538 22,632,898 7,945,735
Cost of sales 9 (16,205,907) (5,692,157) (13,418,020) (5,070,422)
Gross profit 7,169,301 1,919,381 9,214,878 2,875,313
Administrative expenses (455,124) (159,205) (395,118) (133,795)
Selling and distribution expenses (691,209) (231,044) (727,700) (222,995)
Other operating expenses (656,266) (186,738) (715,489) (209,112)
Other income 1,638,931 446,086 1,617,407 441,566
Profit from operations 7,005,633 1,788,480 8,993,978 2,750,977
Finance cost (318,025) (125,381) (272,329) (109,216)
Profit before taxation 6,687,608 1,663,099 8,721,649 2,641,761
Taxation 10 (1,717,779) (427,125) (2,267,629) (693,422)
Profit after taxation 4,969,829 1,235,974 6,454,020 1,948,339
Earnings per share
(basic and diluted) Rupees 11.34 2.82 14.73 4.45
The annexed notes 1 to 16 form an integral part of this condensed interim financial information.

DG Cement 3rd Quarter 201813
Statement of Comprehensive IncomeFor the Quarter and Nine Months Ended March 31, 2018 (Un-audited)
DirectorChief Executive Chief Financial Officer
2018 2017
July to January to July to January to
March March March March
(Rupees in thousand) (Rupees in thousand)
Profit after taxation 4,969,829 1,235,974 6,454,020 1,948,339
Other comprehensive income
for the period
Items that may be re-classified
subsequently to profit or loss
Change in value of available-for-sale
financial assets 760,102 1,298,692 3,137,850 (785,207)
Gain during the year transferred to profit
and loss account on derecognition
of investment - - - -
760,102 1,298,692 3,137,850 (785,207)
Items that will not be subsequently
re-classified to profit or loss - - - -
Other comprehensive income
for the period 760,102 1,298,692 3,137,850 (785,207)
Total comprehensive income
for the period 5,729,931 2,534,666 9,591,870 1,163,132
The annexed notes 1 to 16 form an integral part of this condensed interim financial information.

2018 2017 July to July to March March Note (Rupees in thousand)
Cash flows from operating activities
Cash generated from operations 12 7,132,061 5,068,888
Finance cost paid (220,079) (112,035)
Retirement and other benefits paid (38,876) (42,757)
Taxes paid (880,389) (2,659,669)
Payment to subsidiary against tax losses (15,000) (50,500)
Long term deposits - net 10,435 2,039
Net cash generated from operating activities 5,988,152 2,205,966
Cash flows from investing activities
Fixed capital expenditure (11,495,855) (19,152,318)
Proceeds from sale of property, plant and equipment 29,794 4,559
Investments made - net (140,049) (186,091)
Long term loans, advances and deposits - net (979) 11,111
Interest received 59,465 153,532
Dividend received 1,494,565 1,471,403
Net cash used in investing activities (10,053,059) (17,697,804)
Cash flows from financing activities
Repayment of long term finances (541,667) (769,358)
Disbursement of loans 7,290,510 10,320,000
Settlement of derivative financial instrument (35,077) 11,310
Dividend paid (3,285,893) (2,628,387)
Net cash used in financing activities 3,427,873 6,933,565
Net (decrease) in cash and cash equivalents (637,034) (8,558,273)
Cash and cash equivalents at the beginning of the period (8,149,348) 3,558,492
Exchange loss on cash and cash equivalents (128,669) (7,917)
Cash and cash equivalents at the end of the period 13 (8,915,051) (5,007,698)
The annexed notes 1 to 16 form an integral part of this condensed interim financial information.
DG Cement 3rd Quarter 201814
Cash Flow StatementFor the Nine Months Ended March 31, 2018 (Un-audited)
DirectorChief Executive Chief Financial Officer

DG Cement 3rd Quarter 201815
Statement of Changes In EquityFor the Nine Months Ended March 31, 2018 (Un-audited)
Dir
ecto
rC
hief
Exe
cutiv
eC
hief
Fin
anci
al O
ffice
r
Cap
ital
res
erve
Rev
enue
res
erve
Bal
ance
as
at J
une
30, 2
017
- A
udit
ed
4,38
1,19
1 4,
557,
163
28,0
31,8
37
353,
510
5,07
1,82
7 32
,473
,351
74
,868
,879
Tota
l co
mp
rehe
nsiv
e in
com
e fo
r th
e p
erio
d-
Pro
fit fo
r th
e p
erio
d
- -
- -
- 4,
969,
829
4,96
9,82
9-
Oth
er c
omp
rehe
nsiv
e in
com
e fo
r th
e p
erio
d
- -
760,
102
- -
- 76
0,10
2
-
- 76
0,10
2 -
- 4,
969,
829
5,72
9,93
1To
tal c
ont
rib
utio
ns b
y an
d d
istr
ibut
ions
to
ow
ners
of
the
Co
mp
any
reco
gni
zed
dir
ectl
y
in
equi
ty-
Fina
l div
iden
d fo
r th
e ye
ar e
nded
June
30,
201
7 (R
s 7.
5 p
er s
hare
) -
- -
- -
(3,2
85,8
93)
(3,2
85,8
93)
Bal
ance
as
at M
arch
31,
201
8- U
naud
ited
4,
381,
191
4,55
7,16
3 28
,791
,939
35
3,51
0 5,
071,
827
34,1
57,2
87
77,3
12,9
17
Bal
ance
as
at J
une
30, 2
016
- A
udit
ed
4,38
1,19
1 4,
557,
163
24,2
56,3
85
353,
510
5,07
1,82
7 27
,163
,353
65
,783
,429
Tota
l co
mp
rehe
nsiv
e in
com
e fo
r th
e p
erio
d-
Pro
fit fo
r th
e p
erio
d
- -
- -
- 6,
454,
020
6,45
4,02
0-
Oth
er c
omp
rehe
nsiv
e in
com
e fo
r th
e p
erio
d
- -
3,13
7,85
0 -
- -
3,13
7,85
0
-
- 3,
137,
850
- -
6,45
4,02
0 9,
591,
870
Tota
l co
ntri
but
ions
by
and
dis
trib
utio
ns t
o
ow
ners
of
the
Co
mp
any
reco
gni
zed
dir
ectl
y
in
eq
uity
- Fi
nal d
ivid
end
for
the
year
end
ed
Ju
ne 3
0, 2
016
(Rs
6 p
er s
hare
) -
- -
- -
(2,6
28,7
15)
(2,6
28,7
15)
Bal
ance
as
at M
arch
31,
201
7- U
naud
ited
4,
381,
191
4,55
7,16
3 27
,394
,235
35
3,51
0 5,
071,
827
30,9
88,6
58
72,7
46,5
84
The
anne
xed
not
es 1
to
16 fo
rm a
n in
tegr
al p
art
of t
his
cond
ense
d in
terim
fina
ncia
l inf
orm
atio
n.
Fair
valu
ere
serv
e
Sha
rep
rem
ium
Sha
reca
pit
al
Cap
ital
rede
mpt
ion
rese
rve
fund
Gen
eral
rese
rve
Una
pp
rop
riat
edp
rofit
Tota
l
Rup
ees
in t
hous
and
s

1. Status and nature of business
D. G. Khan Cement Company Limited (the "Company") is a public limited company incorporated in
Pakistan and is listed on the Pakistan Stock Exchange Limited. It is principally engaged in production
and sale of Clinker, Ordinary Portland and Sulphate Resistant Cement. The registered office of the
Company is situated at 53-A, Lawrence Road, Lahore.
2. Basis of preparation
This condensed interim financial information is un-audited and is being submitted to the members as
required by section 237 of the Companies Act, 2017 (the "Act"). These financial statements have been
prepared in accordance with the accounting and reporting standards as applicable in Pakistan. The
accounting and reporting standards applicable in Pakistan comprise of International Financial Reporting
Standards (IFRS Standards) issued by the International Accounting Standards Board (IASB) as notified
under the Companies Act, 2017 and Provisions of and directives issued under the Companies Act, 2017.
Where provisions of and directives issued under the Companies Act, 2017 differ from the IFRS
Standards, the provisions of and directives issued under the Companies Act, 2017 have been followed.
This condensed interim financial information does not include all the information required for annual
financial statements and therefore, should be read in conjunction with the annual financial statements for
the year ended June 30, 2017.
3. Significant accounting policies
3.1 The accounting policies adopted for the preparation of this condensed interim financial information
are the same as those applied in the preparation of preceding annual published financial
statements of the Company for the year ended June 30, 2017.
3.2 Initial application of standards, amendments or an interpretation to existing standards
The following amendments to existing standards have been published that are applicable to the
Company’s financial statements covering annual periods, beginning on or after the following dates:
3.2.1 Standards, amendments to published standards and interpretations that are effective in the current period
Certain standards, amendments and interpretations to approved accounting standards are
effective for accounting periods beginning on July 01, 2017 but are considered not to be
relevant or to have any significant effect on the Company’s operations (although they may
affect the accounting for future transactions and events) and are, therefore, not detailed in
this condensed interim financial information except for:
DG Cement 3rd Quarter 201816
Notes to and Forming Part of the Unconsolidated Condensed Interim Financial InformationFor the Quarter and Nine Months Ended March 31, 2018 (Un-audited)

- IAS 7, ‘Cashflow statements: Disclosure initiative’ (effective for periods beginning on or
after January 1, 2017). This amendment requires disclosure to explain changes in liabilities
for which cash flows have been, or will be classified as financing activities in the statement
of cash flows. The amendment only covers balance sheet items for which cash flows are
classified as financing activities. In case other items are included within the reconciliation,
the changes in liabilities arising from financing activities will be identified separately. A
reconciliation of the opening to closing balance is not specifically required but instead the
information can be provided in other ways. In the first year of adoption, comparative
information need not be provided. The application of this amendment does not have any
material impact on the Company's financial statements.
3.2.2 Standards, amendments and interpretations to existing standards that are not yet effective and have not been early adopted by the Company
The following amendments and interpretations to existing standards have been published
and are mandatory for the Company's accounting periods beginning on or after July 01,
2018 or later periods, and the Company has not early adopted them:
Effective date (accounting periods beginning on or after)
Other standards or interpretations
IFRS 9, 'Financial instruments' July 01, 2018
IFRS 15, 'Revenue from contracts with customers' July 01, 2018
Amendments to IFRS 15, ‘Revenue from contracts
with customers' on gross versus net revenue presentation July 01, 2018
IFRIC 22, ‘Foreign currency transactions and
advance consideration’ January 01, 2018
IFRS 16 ‘Leases' January 01, 2019
IFRIC 23 January 01, 2019
The Company will apply these standards/amendments from their respective effective dates
and has yet to assess the impact of these amendments on its financial statements.
3.3 Significant accounting estimates, judgements and financial risk:
The preparation of this condensed interim financial information requires the management to make
judgements, estimates and assumptions that affect the application of policies and the reported
amounts of assets, liabilities, income and expenses. Actual results may differ from these estimates.
In preparing this condensed interim financial information, the significant judgements made by the
management in applying the Company’s accounting policies and the key sources of estimation
DG Cement 3rd Quarter 201817

DG Cement 3rd Quarter 201818
uncertainty were the same as those that applied to the financial statements for the year ended
June 30, 2017, with the exception of changes in estimates that are required in determining the
provision for income taxes as referred to in note 4.
The Company's financial risk management objectives and policies are consistent with those disclosed in the financial statements as at and for the year ended June 30, 2017.
4. Taxation
Income tax expense is recognised based on management's best estimate of the weighted average annual income tax rate expected for the full financial year.
March 31, June 30, 2018 2017 Un-audited Audited (Rupees in thousand)
5. Long term finances - secured
Long term loans - note 5.1 19,768,843 13,020,000
Less: Current portion shown under current liabilities 1,281,167 500,000
18,487,676 12,520,000
5.1 Long term loans
Opening balance 13,020,000 3,538,251
Add:
Proceeds of borrowing 7,290,510 11,320,000
Exchange loss during the period - 641
20,310,510 14,858,892
Less:
Repayment during the period 541,667 1,838,892
Closing balance 19,768,843 13,020,000
6. Contingencies and commitments
6.1 Contingencies There is no significant change in contingencies from the annual financial statements of the
Company for the year ended June 30, 2017 except for letters of guarantees issued to various parties aggregating to Rs 1,206.112 million (June 30, 2017: Rs 1,065.762 million)
6.2 Commitments in respect of:
(i) Contracts for capital expenditure Rs 48.178 million (June 30, 2017: Rs 183.524 million)
(ii) Letters of credits for capital expenditure Rs 1,227.371 million (June 30, 2017: Rs 773.728 million)
(iii) Letters of credit other than capital expenditure Rs 2,203.889 million (June 30, 2017: Rs 876.794 million)

DG Cement 3rd Quarter 201819
(iv) The amount of future payments under operating leases and the period in which these payments will become due are as follows:
March 31, June 30, 2018 2017 Un-audited Audited (Rupees in thousand)
Not later than one year 331 331
Later than one year and not later than five years 1,325 1,325
Later than five years 4,397 4,645
6,053 6,301
7. Property, plant and equipment
Operating assets - note 7.1 30,056,384 30,987,739
Capital work-in-progress - note 7.2 42,257,025 31,365,859
Major spare parts and stand-by equipment 79,350 94,139
72,392,759 62,447,737
7.1 Operating fixed assets
Opening book value 30,987,739 31,806,997
Add: Additions during the period - note 7.1.1 619,477 1,264,268
Less: Disposals during the period
- at book value - note 7.1.2 23,023 21,715
Depreciation charged during the period 1,527,809 2,061,811
1,550,832 2,083,526
Closing book value 30,056,384 30,987,739
7.1.1 Additions during the period/year
Freehold land 89,457 28,343
Buildings on freehold land:
- Factory buildings 2,386 138,997
- Office building and housing colony 139,818 29,200
Roads 17,934 60,389
Plant and machinery 54,474 824,927
Quarry equipment 894 16,097
Furniture, fixtures and office equipment 59,677 34,968
Motor vehicles 80,024 118,180
Power and water supply lines 174,813 13,167
619,477 1,264,268

DG Cement 3rd Quarter 201820
March 31, June 30, 2018 2017 Un-audited Audited (Rupees in thousand)
7.1.2 Disposals during the period
Office equipment - -
Motor vehicles 23,023 21,715
23,023 21,715
7.2 Capital work-in-progress
Civil works 268,480 282,943
Plant and machinery 589,790 667,647
Advances for capital expenditure 6,713 202,416
Unallocated expenditure 1,629 290
Expansion project:
- Civil works 14,115,224 7,807,172
- Plant and machinery 22,455,889 18,086,304
- Advances to suppliers and contractors 2,104,268 1,370,303
- Others 2,715,032 2,948,784
41,390,413 30,212,563
42,257,025 31,365,859
8. Investments
Carrying value of investments at the beginning
of the period / year 35,608,138 30,766,981
Investments made during the period / year
- Related parties 140,049 278,193
140,049 278,193
Fair value gain during the period / year on:
- Available for sale investments 760,102 4,564,456
760,102 4,564,456
Investments disposed off during the period/year - (1,492)
Carrying value at the end of the period / year 36,508,289 35,608,138
Investments classified in current assets (17,829,553) (17,044,084)
Closing balance 18,678,736 18,564,054

DG Cement 3rd Quarter 201821
2018 2017 July to January to July to January to March March March March (Rupees in thousand) 9. Cost of sales
Raw and packing materials consumed 1,976,910 748,879 1,746,658 591,472 Salaries, wages and other benefits 1,562,713 515,420 1,368,781 457,931 Electricity and gas 1,661,477 630,056 1,968,322 738,268 Furnace oil and coal 6,878,532 2,406,034 5,703,486 2,460,293 Stores and spares consumed 1,389,117 538,755 999,409 340,597 Repair and maintenance 241,846 78,213 179,525 59,436 Insurance 41,092 13,280 40,592 13,477 Depreciation on property, plant and equipment 1,473,426 495,148 1,480,731 497,487 Royalty 254,433 85,437 252,284 91,208 Excise duty 24,321 8,196 23,890 8,605 Vehicle running expenses 23,640 9,546 19,608 7,787 Postage, telephone and telegram 3,936 1,452 3,065 1,861 Printing and stationery 8,720 2,125 7,895 3,196 Legal and professional charges 1,478 259 2,394 585 Travelling and conveyance 5,327 1,823 10,611 5,605 Plant cleaning and gardening 26,171 8,633 20,339 7,879 Rent, rates and taxes 43,356 15,472 45,776 16,473 Freight charges 22,492 7,464 21,042 6,683 Other expenses 29,463 9,860 42,264 8,559 Total manufacturing cost 15,668,450 5,576,052 13,936,672 5,317,402
Opening work-in-process 522,557 94,028 166,940 184,974 Closing work-in-process (67,352) (67,352) (409,880) (409,880) 455,205 26,676 (242,940) (224,906) Cost of goods manufactured 16,123,655 5,602,728 13,693,732 5,092,496
Opening stock of finished goods 332,278 228,327 185,342 272,970 Closing stock of finished goods (86,855) (86,855) (221,578) (221,578) 245,423 141,472 (36,236) 51,392 Less: Own consumption capitalized (163,171) (52,043) (239,476) (73,466) 16,205,907 5,692,157 13,418,020 5,070,422
10. Taxation
Current: - For the year 1,397,919 191,325 2,199,621 639,399 - Prior years - 58,181 - 33,228 1,397,919 249,506 2,199,621 672,627 Deferred 319,860 177,619 68,008 20,795 1,717,779 427,125 2,267,629 693,422

10.1 The new production line being set up at Hub, Baluchistan is expected to start operations by June 2018 and the applicable tax credit for investment estimated at Rs 3.1 billion under section 65B of the Income Tax Ordinance, 2001 will be recognized accordingly when the operations commence.
11. Transactions with related parties The related parties comprise subsidiary company, associated companies, other related companies, directors of the company, key management personnel and post employment benefit plans. Significant transactions with related parties are as follows:
July to March July to March
2018 2017
Un-audited Un-audited
(Rupees in thousand)
Relationship with the Nature of transaction
Company
Subsidiary company Purchase of goods and services 1,013,708 1,049,059
Rental income 643 625
Dividend income 51,191 38,393
Sale of goods 17,215 17,958
Other related parties Purchase of goods and services 28,405 1,354,676
Insurance premium 83,255 106,218
Sale of goods 120,415 115,766
Mark-up income on balances
with related parties 50,240 27,214
Insurance claim received 6,288 2,458
Dividend income 1,438,515 1,429,561
Key management Salaries and other
personnel employment benefits 152,965 143,067
Post employment Expense charged in respect of staff
benefit plans retirement benefits plans (defined
benefit plan) 79,825 73,699
Expense charged in respect of staff
retirement benefits plans (contribution
plan) 51,191 36,686
DG Cement 3rd Quarter 201822

DG Cement 3rd Quarter 201823
March 31, June 30,
2018 2017
Un-audited audited
(Rupees in thousand)
Balances with related parties:
Long term deposits - 325
Trade debts 21,767 22,662
Advances, deposits, prepayments and other receivables 5,797 3,303
Trade and other payables 279,848 219,468
July to July to
March, March,
2018 2017
Un-audited Un-audited
(Rupees in thousand)
12. Cash generated from operations
Profit before tax 6,687,608 8,721,649
Adjustment for :
- Depreciation on property, plant and equipment 1,527,809 1,536,167
- Profit on disposal of property, plant and equipment (6,770) 6,721
- Profit on bank deposits (9,564) (100,245)
- Dividend income (1,494,565) (1,471,403)
- Retirement and other benefits accrued 78,336 78,996
- Mark-up income (50,240) (27,214)
- Exchange loss - net 183,655 40,295
- Finance cost 318,025 272,329
- Provision of WPPF 352,061 466,816
- Gain on disposal of investments at fair value through profit or loss - (1,280)
- (Gain)/loss on derivative financial instruments (12,979) (2,998)
Profit before working capital changes 7,573,376 9,519,833
Effect on cash flow due to working capital changes:
- (Increase) / decrease in stores, spares and loose tools (578,926) 127,966
- (Decrease) / Increase in stock-in-trade 704,793 (155,511)
- (Increase) / decrease in trade debts (36,949) (14,330)
- Increase in advances, deposits, prepayments and other receivables (920,901) (3,309,826)
- Decrease / (Increase) in trade and other payables 390,668 (1,099,244)
(441,315) (4,450,945)
Cash generated from operations 7,132,061 5,068,888

DG Cement 3rd Quarter 201824
March 31, March 31, 2018 2017 Un-audited Un-audited (Rupees in thousand)
13. Cash and cash equivalents
Short term borrowings - secured (9,290,539) (5,677,826)
Cash and bank balances 375,488 670,128
(8,915,051) (5,007,698)
14. Financial risk management
14.1 Financial risk factors
The company’s activities expose it to a variety of financial risks: market risk (including currency risk, fair value interest rate risk, cash flow interest rate risk and price risk), credit risk and liquidity risk.
The condensed interim financial information does not include all financial risk management information and disclosures required in the annual financial statements, and should be read in conjunction with the company’s annual financial statements as at June 30, 2017.
There have been no changes in the risk management department or in any risk management policies since the year ended June 30, 2017.
14.2 Liquidity risk
Compared to year end, there was no material change in the contractual undiscounted cash out flows for financial liabilities.
Rupees in thousand Less than 1 Between 1 and More than 3 Carrying value year 3 years years As at March 31, 2018 Long term finances - secured 19,768,843 1,281,167 11,358,826 7,128,850
Long term deposits 89,876 - - 89,876
Trade and other payables 6,261,050 6,261,050 - -
Short term borrowings - secured 9,290,539 9,290,539 - -
Accrued finance cost 315,150 315,150 - -
35,725,458 17,147,906 11,358,826 7,218,726
As at June 30, 2017 Long term finances - secured 13,020,000 500,000 4,132,722 8,387,278
Long term deposits 79,441 - - 79,441
Derivative financial instrument 48,056 48,056 - -
Trade and other payables 4,562,349 4,562,349 - -
Short term borrowings - secured 8,571,228 8,571,228 - -
Accrued finance cost 217,204 217,204 - -
26,498,278 13,898,837 4,132,722 8,466,719

DG Cement 3rd Quarter 201825
14.3 Fair value estimation
The different levels for fair value estimation used by the Company have been defined as follows:
- The fair value of financial instruments traded in active markets (such as publicly traded available
for sale securities) is based on quoted (unadjusted) market prices at the end of the reporting
period. The quoted market price used for financial assets held by the company is the current bid
price. These instruments are included in Level 1.
- The fair value of financial instruments that are not traded in an active market (for example
over-the-counter derivatives) is determined using valuation techniques. These valuation
techniques maximise the use of observable market data where it is available and rely as little as
possible on entity specific estimates. If all significant inputs required to fair value an instrument are
observable, the instrument is included in Level 2.
- If one or more of the significant inputs is not based on observable market data, the instrument is
included in level 3.
The following table presents the Company's assets and liabilities that are measured at fair values:
Level 1 Level 2 Level 3 Total As at March 31, 2018 (Rupees in thousand)
Assets
Investments - available for sale 33,954,515 - 4,051,000 38,005,515
Total assets 33,954,515 - 4,051,000 38,005,515
Liabilities - - - -
Total liabilities - - - -
As at June 30, 2017
Assets Investments - Available for sale 29,003,364 - 4,051,000 33,054,364
Total assets 29,003,364 - 4,051,000 33,054,364
Liabilities Derivative financial instruments - 48,056 - 48,056
Total liabilities - 48,056 - 48,056

DirectorChief Executive Chief Financial Officer
DG Cement 3rd Quarter 201826
There were no transfers between Level 1 and 2 during the period. There were no changes in valuation
techniques during the periods.
15. Date of authorization for issue
This interim financial information was authorized for issue on April 27, 2018 by the Board of Directors of
the Company.
16. Corresponding figures
In order to comply with the requirements of International Accounting Standard 34 - 'Interim Financial
Reporting', the condensed interim balance sheet have been compared with the balances of annual audited
financial statements of preceding financial year, whereas, the condensed interim profit and loss account,
condensed interim statement of comprehensive income, condensed interim cash flow statement and
condensed interim statement of changes in equity have been compared with the balances of comparable
period of immediately preceding financial year.
Interim ConsolidatedFinancial
Statements

31 March, 30 June, 2018 2017 Un-Audited Audited Note (Rupees in thousand)
EQUITY AND LIABILITIES
CAPITAL AND RESERVES
Authorised capital - 950,000,000 (June 30, 2017: 950,000,000) ordinary shares of Rs 10 each 9,500,000 9,500,000 - 50,000,000 (June 30, 2017: 50,000,000) preference shares of Rs 10 each 500,000 500,000 10,000,000 10,000,000
Issued, subscribed and paid up capital 438,119,118 (June 30, 2017: 438,119,118) ordinary shares of Rs 10 each 4,381,191 4,381,191 Reserves 38,739,121 37,979,019 Accumulated profit 33,891,077 32,333,597 77,011,389 74,693,807 Non-controlling interest 1,785,778 1,971,423 78,797,167 76,665,230
NON-CURRENT LIABILITIES
Long term finances 5 19,087,676 12,547,500 Long term deposits 89,876 79,441 Retirement and other benefits 226,297 186,838 Deferred taxation 6,562,451 6,245,772 25,966,300 19,059,551
CURRENT LIABILITIES
Trade and other payables 6,540,865 5,695,482 Loan from related party - unsecured 6 214,000 169,000 Short term borrowing-secured 10,304,578 8,614,810 Current portion of non-current liabilities 1,332,445 610,028 Accrued finance cost 315,150 219,927 Derivative financial instrument - 48,056 Provision for taxation 35,090 35,090 18,742,128 15,392,393Contingencies and Commitments 7 - - 123,505,595 111,117,174
The annexed notes form an integral part of this condensed interim consolidated financial information.
DG Cement 3rd Quarter 201828
Balance SheetCondensed Interim Consolidated
Chief Executive

31 March, 30 June, 2018 2017 Un-Audited Audited Note (Rupees in thousand)
ASSETS
NON-CURRENT ASSETS
Property, plant and equipment 8 76,554,379 65,810,012 Biological assets 409,103 591,579 Investments 9 16,321,764 16,126,081 Long term loans, advances and deposits 60,728 59,748 93,345,974 82,587,420
CURRENT ASSETS
Stores, spares and loose tools 5,677,630 5,083,011 Stock-in-trade 1,217,849 1,795,345 Trade debts 829,087 497,748 Investments 9 17,822,369 17,044,142 Advances, deposits, prepayments and other receivables 3,200,372 1,983,428 Loan to related party 1,000,000 1,000,000 Income tax recoverable 28,332 675,552 Cash and bank balances 383,982 450,528 30,159,621 28,529,754
123,505,595 111,117,174
DG Cement 3rd Quarter 201829
As At March 31, 2018
DirectorChief Financial Officer

DG Cement 3rd Quarter 201830
DirectorChief Executive Chief Financial Officer
Consolidated Profit And Loss AccountFor the Quarter and Nine Months Ended March 31, 2018 (Un-audited)
2018 2017
July to January to July to January to
March March March March
Note (Rupees in thousand) (Rupees in thousand)
Sales 25,395,325 8,377,120 24,249,034 8,502,818
Cost of sales 10 (18,149,001) (6,391,735) (14,759,367) (5,479,220)
Gross profit 7,246,324 1,985,385 9,489,667 3,023,598
Administrative expenses (514,243) (181,436) (436,829) (148,960)
Selling and distribution expenses (706,839) (236,629) (740,447) (226,880)
Other operating expenses (824,907) (229,777) (874,461) (235,850)
Other income 1,659,492 503,232 1,640,383 488,389
Profit / (Loss) from operations 6,859,827 1,840,775 9,078,313 2,900,297
Finance cost (339,008) (126,392) (297,141) (117,075)
Profit before taxation 6,520,819 1,714,383 8,781,172 2,783,222
Taxation 11 (1,780,216) (439,927) (2,327,759) (720,000)
Profit after taxation 4,740,603 1,274,456 6,453,413 2,063,222
Attributable to:
Equity holders of the parent 4,843,373 1,280,111 6,453,383 2,028,747
Non-controlling interest (102,770) (5,655) 30 34,475
4,740,603 1,274,456 6,453,413 2,063,222
Earning per share basic and diluted (Rupees) 10.82 2.91 14.73 4.71
The annexed notes form an integral part of this condensed interim consolidated financial information.

DG Cement 3rd Quarter 201831
Consolidated Statement of Comprehensive IncomeFor the Quarter and Nine Months Ended March 31, 2018 (Un-audited)
DirectorChief Executive Chief Financial Officer
2018 2017
July to January to July to January to
March March March March
(Rupees in thousand) (Rupees in thousand)
Profit after taxation 4,740,603 1,274,456 6,453,413 2,063,222
Items that may be re-classified
to profit or loss
Available for sale financial assets
- Change in fair value of available
-for-sale financial assets 760,102 1,294,572 3,137,850 (786,351)
- Gain during the year transferred to
profit and loss account
on derecognition of investment - - - -
760,102 1,294,572 3,137,850 (786,351)
Items that will not be subsequently
re-classified to profit or loss - - - -
Other comprehensive income
for the period 760,102 1,294,572 3,137,850 (786,351)
Total comprehensive income for the period 5,500,705 2,569,028 9,591,263 1,276,871
Attributable to:
Equity holders of the parent 5,603,475 2,576,536 9,591,233 1,242,911
Non-controlling interest (102,770) (7,508) 30 33,960
5,500,705 2,569,028 9,591,263 1,276,871
The annexed notes form an integral part of this condensed interim consolidated financial information.

2018 2017 July to July to March March Note (Rupees in thousand) Cash generated from operations 13 6,538,280 5,079,293
Financial cost paid (243,785) (144,337)
Retirement and other benefits paid (38,877) (42,758)
Taxes paid (801,317) (2,595,171)
Payment to subsidiary against tax losses (15,000) (50,500)
long term deposits - net 10,435 2,039
Net cash from operating activities [A] 5,449,736 2,248,567
Fixed capital expenditure (12,318,537) (18,958,727)
Proceeds from sale of property, plant and equipment 40,662 4,607
Long term loans and deposits - net (980) 11,110
Investments made - net (203,609) (276,626)
Interest received 59,478 153,532
Dividend received 1,452,056 1,471,403
Net cash (used in) investing activities [B] (10,970,930) (17,594,701)
Repayment of long term finances (627,917) (871,233)
Loan from related party 45,000 -
Settlement of derivative financial instrument (35,077) 11,310
Proceeds from long term finances 7,890,510 10,320,000
Dividend paid (3,378,967) (2,659,799)
Net cash from financing activities [C] 3,893,549 6,800,278
In(De)crease in cash and cash equivalents [A+B+C] (1,627,645) (8,545,856)
Cash and cash equivalents at the beginning of period (8,164,282) 3,272,088
Exchange loss on cash and cash equivalents (128,669) (7,917)
Cash and cash equivalents at the end of period 14 (9,920,596) (5,281,685)
The annexed notes form an integral part of this condensed interim consolidated financial information.
DG Cement 3rd Quarter 201832
Consolidated Cash Flow StatementFor the Nine Months Ended March 31, 2018 (Un-audited)
DirectorChief Executive Chief Financial Officer

DG Cement 3rd Quarter 201833
Consolidated Statement of Changes In EquityFor the Nine Months Ended March 31, 2018 (Un-audited)
Dir
ecto
rC
hief
Exe
cutiv
eC
hief
Fin
anci
al O
ffice
r
Cap
ital
res
erve
Rev
enue
res
erve
Bal
ance
as
at J
une
30, 2
017
- A
udite
d 4,
381,
191
4,55
7,16
3 27
,957
,495
35
3,51
0 5,
110,
851
32,3
33,5
97
74,6
93,8
07
1,97
1,42
3 76
,665
,230
Tota
l com
pre
hens
ive
inco
me
for
the
per
iod
- P
rofit
for
the
per
iod
-
- -
- -
4,84
3,37
3 4,
843,
373
(102
,770
) 4,
740,
603
- O
ther
com
pre
hens
ive
inco
me
for
the
per
iod
-
- 76
0,10
2 -
- -
760,
102
10,1
99
770,
301
Tota
l con
trib
utio
ns b
y an
d di
stri
butio
ns to
ow
ners
of t
he C
ompa
ny r
ecog
nize
d di
rect
ly in
equ
ity-
Pare
nt c
ompa
ny-
Fina
l div
iden
d fo
r th
e ye
ar e
nded
Jun
e 30
, 201
7 (R
s 7.
5 p
er s
hare
) -
- -
- -
(3,2
85,8
93)
(3,2
85,8
93)
- (3
,285
,893
)
- S
ubsi
dia
ry c
omp
any
- Fi
nal d
ivid
end
for
the
year
end
ed
Jun
e 30
, 201
7 (R
s 2
per
sha
re)
- -
- -
- -
- (9
3,07
4)
(93,
074)
Bal
ance
as
at M
arch
31,
201
8 -
Unau
dite
d 4,
381,
191
4,55
7,16
3 28
,717
,597
35
3,51
0 5,
110,
851
33,8
91,0
77
77,0
11,3
89
1,78
5,77
8 78
,797
,167
Bal
ance
as
at J
une
30, 2
016
- A
udite
d 4,
381,
191
4,55
7,16
3 24
,183
,708
35
3,51
0 5,
110,
851
27,1
08,3
37
65,6
94,7
60
2,04
1,33
7 67
,736
,097
Tota
l com
pre
hens
ive
inco
me
for
the
per
iod
- P
rofit
for
the
per
iod
-
- -
- -
6,45
3,38
3 6,
453,
383
30
6,45
3,41
3
- O
ther
com
pre
hens
ive
inco
me
for
the
per
iod
-
- 3,
137,
850
- -
- 3,
137,
850
- 3,
137,
850
Tota
l con
trib
utio
ns b
y an
d di
stri
butio
ns to
ow
ners
of t
he C
ompa
ny r
ecog
nize
d di
rect
ly in
equ
ity-
Par
ent
com
pan
y-
Fina
l div
iden
d fo
r th
e ye
ar e
nded
Jun
e 30
, 201
6 (R
s 6
per
sha
re)
- -
- -
- (2
,628
,715
) (2
,628
,715
) -
(2,6
28,7
15)
- Su
bsid
iary
com
pany
- Fi
nal d
ivid
end
for
the
year
end
ed
Jun
e 30
, 201
6 (R
s 1.
5 p
er s
hare
) -
- -
- -
- -
(31,
412)
(3
1,41
2)
Bal
ance
as
at M
arch
31,
201
7 -
Una
udite
d
4,38
1,19
1 4,
557,
163
27,3
21,5
58
353,
510
5,11
0,85
1 30
,933
,005
72
,657
,278
2,
009,
955
74,6
67,2
33
The
anne
xed
not
es fo
rm a
n in
tegr
al p
art
of t
his
cond
ense
d in
terim
con
solid
ated
fina
ncia
l inf
orm
atio
n.
Rup
ees
in t
hous
and
s
Sha
reca
pit
alS
hare
pre
miu
m
Fair
valu
ere
serv
e
Cap
ital
rede
mpt
ion
rese
rve
fund
Gen
eral
rese
rve
Una
ppro
pria
ted
prof
it
Tota
l equ
ityat
trib
utab
le to
shar
ehol
ders
of
pare
nt c
ompa
ny
Non
-con
trol
ling
inte
rest
Tota
l

1. Legal Status and nature of business
The group comprises of: - D. G. Khan Cement Company Limited (the parent company); - Nishat Paper Products Company Limited; - Nishat Dairy (Private) Limited; and - Nishat Farm Supplies (Private) Limited.
D. G. Khan Cement Company Limited is a public limited company incorporated in Pakistan and is listed on Pakistan Stock Exchange Limited. It is principally engaged in production and sale of Clinker, Ordinary Portland and Sulphate Resistant Cement (hereinafter referred to as the 'Cement segment').
Nishat Paper Products Company Limited is a public limited company incorporated in Pakistan. It is principally engaged in the manufacture and sale of paper products and packaging material (hereinafter referred to as the 'Paper segment').
Nishat Dairy (Private) Limited is a private limited company incorporated in Pakistan. It is principally engaged in the business of production and sale of raw milk (hereinafter referred to as the 'Dairy segment').
Nishat Farm Supplies (Private) Limited is a private limited company incorporated in Pakistan. It is a wholly owned subsidiary of Nishat Dairy (Private) Limited. The principal activity of the company is to carry on the business of sale, marketing and distribution of imported chemicals, medicines, vaccines, cows, other chemicals of all kinds and types (hereinafter referred to as the 'Farm Supplies segment').
The registered office of the Group is situated at 53-A, Lawrence Road, Lahore. The parent company's holding in its subsidiaries is as follows:
Effective percentage of holding
- Nishat Paper Products Company Limited 55.00% - Nishat Dairy (Private) Limited 55.10% (approx) - Nishat Farm Supplies (Private) Limited 55.10% (approx)
2. Basis of preparation
This condensed interim financial information is un-audited and is being submitted to the members as required by section 237 of the Companies Act, 2017 (the "Act"). These financial statements have been prepared in accordance with the accounting and reporting standards as applicable in Pakistan. The accounting and reporting standards applicable in Pakistan comprise of International Financial Reporting Standards (IFRS Standards) issued by the International Accounting Standards Board (IASB) as notified under the Companies Act, 2017 and Provisions of and directives issued under the Companies Act, 2017. Where provisions of and directives issued under the Companies Act, 2017 differ from the IFRS Standards, the provisions of and directives issued under the Companies Act, 2017 have been followed. This condensed interim financial information does not include all the information required for annual financial statements and therefore, should be read in conjunction with the annual financial statements for the year ended June 30, 2017.
DG Cement 3rd Quarter 201834
Notes to and Forming Part of the Consolidated Condensed Interim Financial InformationFor the Quarter and Nine Months Ended March 31, 2018 (Un-audited)

3. Significant accounting policies
3.1 The accounting policies adopted for the preparation of this consolidated condensed interim financial information are the same as those applied in the preparation of preceding annual published consolidated financial statements of the group for the year ended June 30, 2017.
3.2 Initial application of standards, amendments or an interpretation to existing standards
The following amendments to existing standards have been published that are applicable to the group’s consolidated financial statements covering annual periods, beginning on or after the following dates:
3.2.1 Standards, amendments to published standards and interpretations that are effective in the current period
Certain standards, amendments and interpretations to approved accounting standards are effective for accounting periods beginning on July 01, 2017 but are considered not to be relevant or to have any significant effect on the Group’s operations (although they may affect the accounting for future transactions and events) and are, therefore, not detailed in this condensed interim financial information except for:
- IAS 7, ‘Cashflow statements: Disclosure initiative’ (effective for periods beginning on or after January 1, 2017). This amendment requires disclosure to explain changes in liabilities for which cash flows have been, or will be classified as financing activities in the statement of cash flows. The amendment only covers balance sheet items for which cash flows are classified as financing activities. In case other items are included within the reconciliation, the changes in liabilities arising from financing activities will be identified separately. A reconciliation of the opening to closing balance is not specifically required but instead the information can be provided in other ways. In the first year of adoption, comparative information need not be provided. The application of this amendment does not have any material impact on the Group's financial statements.
3.2.2 Standards, amendments and interpretations to existing standards that are not yet effective and have not been early adopted by the Group
The following amendments and interpretations to existing standards have been published and are mandatory for the Group's accounting periods beginning on or after July 01, 2018 or later periods, and the Group has not early adopted them:
Effective date (accounting periods beginning on or after)
Other standards or interpretations
IFRS 9, 'Financial instruments' July 01, 2018
IFRS 15, 'Revenue from contracts with customers' July 01, 2018
Amendments to IFRS 15, ‘Revenue from contracts with customers' on gross versus net revenue presentation July 01, 2018
IFRIC 22, ‘Foreign currency transactions and advance consideration’ January 01, 2018
IFRS 16 ‘Leases' January 01, 2019
IFRIC 23 January 01, 2019
The group will apply these standards/amendments from their respective effective dates and has yet to assess the impact of these amendments on its financial statements.
DG Cement 3rd Quarter 201835

DG Cement 3rd Quarter 201836
3.3 Significant accounting estimates, judgements and financial risk:
The preparation of this consolidated condensed interim financial requires the management to make judgements, estimates and assumptions that affect the application of policies and the reported amounts of assets, liabilities, income and expenses. Actual results may differ from these estimates.
In preparing this condensed interim financial information, the significant judgements made by the management in applying the Group’s accounting policies and the key sources of estimation uncertainty were the same as those that applied to the financial statements for the year ended June 30, 2017, with the exception of changes in estimates that are required in determining the provision for income taxes as referred to in note 4.
The Group's financial risk management objectives and policies are consistent with those disclosed in the financial statements as at and for the year ended June 30, 2017.
4. Taxation
Income tax expense is recognised based on management's estimate of the weighted average effective annual income tax rate expected for the full financial year.
March 31, June 30, 2018 2017 Un-audited audited (Rupees in thousand)
5. Long term finances
Long term loans -note 5.1 20,396,343 13,133,750
Less: Current portion shown under current liabilities 1,308,667 586,250
19,087,676 12,547,500
5.1 Long term loans
Opening balance 13,133,750 3,785,126
Add: Disbursements during the period 7,890,510 11,320,000
Exchange loss during the period - 641
21,024,260 15,105,767
Less: Repayment during the period 627,917 1,972,017
Closing balance 20,396,343 13,133,750
6. Loan from related party - unsecured
This represents unsecured and interest free loan provided by the three directors of the Dairy Segment. The loan amount shall be payable within one year from the execution date.
7 Contingencies and commitments
7.1 Contingencies
There is no significant change in contingencies from the preceding annual financial statements of the Group for the year ended June 30, 2017 except for letters of guarantees issued to various parties aggregating to Rs 1,368.490 million (June 30, 2017: Rs 1,189.572 million).

DG Cement 3rd Quarter 201837
7.2 Commitments in respect of:
(i) Contracts for capital expenditure Rs. 48.178 million (June 30, 2017: Rs 904.364 million)
(ii) Letters of credits for capital expenditure Rs 1,227.371 million (June 30, 2017: Rs 773.728 million)
(iii) Letters of credit other than capital expenditure Rs 3,025.368 million (June 30, 2017: Rs 1,087.394 million)
(iv) The amount of future payments under operating leases and the period in which these payments will become due are as follows:
March 31, June 30, 2018 2017 Un-audited audited (Rupees in thousand)
Not later than one year 331 331
Later than one year and not later than five years 1,325 1,325
Later than five years 4,397 4,645
6,053 6,301
8. Property, plant and equipment
Operating assets - note 8.1 33,245,090 34,336,559
Capital work-in-progress - note 8.2 43,229,939 31,379,314
Major spare parts and stand-by equipment 79,350 94,139
76,554,379 65,810,012
8.1 Operating fixed assets
Opening book value 34,336,559 35,288,238
Add: Additions during the period/ year -note 8.1.1 665,177 1,411,508
35,001,736 36,699,746
Less: Disposals during the period/ year
- net book value -note 8.1.2 33,108 25,418
Depreciation charged during the period/ year 1,723,538 2,337,769
Closing book value 33,245,090 34,336,559

DG Cement 3rd Quarter 201838
March 31, June 30, 2018 2017 Un-audited audited (Rupees in thousand)
8.1.1 Major additions during the period
Freehold land 116,759 38,525 Buildings on freehold land 7,382 221,859 Office building and housing colony 139,818 29,200 Roads 17,934 66,354 Plant and machinery 57,057 852,612 Quarry equipment 894 18,722 Furniture, fixtures and office equipment 62,369 39,664 Motor vehicles 88,151 123,240 Power and water supply lines 174,813 21,332 665,177 1,411,508
8.1.2 Disposals during the period
Plant and machinery 8,966 11,469 Furniture, fixtures and office equipment - 291 Motor vehicles 24,142 13,658 33,108 25,418
8.2 Capital work-in-progress
Civil works 304,668 288,412 Plant and machinery 589,790 671,644 Advances for capital expenditure 6,713 204,820 Unallocated expenditure 1,629 1,875
Expansion project: - Civil works 14,115,224 7,807,172 - Plant and machinery 23,392,615 18,086,304 - Advances to suppliers and contractors 2,104,268 1,370,303 - Others 2,715,032 2,948,784 42,327,139 30,212,563 43,229,939 31,379,3149. Investments
Carrying value of investments at the beginning of the period / year 33,170,223 28,260,287 Investments made during the period / year - Related parties 203,609 349,997 - Others - - 203,609 349,997 Fair value gain / loss during the period / year on: - Available for sale investments 770,301 4,561,430 - Investments at fair value through profit or loss - - 770,301 4,561,430 Investments disposed off during the period/year - (1,491)
Carrying value at the end of the period / year 34,144,133 33,170,223 Investments classified in current assets (17,822,369) (17,044,142) Closing balance 16,321,764 16,126,081

DG Cement 3rd Quarter 201839
2018 2017 July to January to July to January to March March March March (Rupees in thousand) 10. Cost of sales
Raw and packing materials consumed 3,444,470 1,287,961 2,595,099 804,746 Salaries, wages and other benefits 1,664,349 549,045 1,464,068 490,974 Electricity and gas 1,758,864 727,443 2,049,835 758,344 Furnace oil and coal 6,878,532 2,334,656 5,703,486 2,460,293 Stores and spares consumed 1,407,526 546,178 1,024,655 348,512 Repair and maintenance 273,766 86,679 214,814 70,893 Insurance 43,994 14,746 42,770 14,036 Depreciation on property, plant and equipment 1,665,015 558,033 1,681,371 563,796 Royalty 254,433 85,437 252,284 91,208 Excise duty 24,321 8,196 23,890 8,605 Vehicle running expenses 24,483 9,992 20,058 8,237 Postage, telephone and telegram 3,966 1,463 3,096 1,874 Printing and stationery 8,720 2,120 7,895 3,196 Legal and professional charges 1,578 259 2,494 585 Travelling and conveyance 5,329 1,823 10,781 5,256 Plant cleaning and gardening 26,171 8,633 20,339 7,879 Rent, rates and taxes 43,506 15,203 45,777 16,473 Freight charges 22,527 7,465 21,057 6,698 Other expenses 89,698 22,502 99,883 26,031 Total manufacturing cost 17,641,248 6,267,834 15,283,652 5,687,636
Opening work-in-process 522,557 94,028 166,940 184,974 Closing work-in-process (67,352) (67,352) (409,880) (409,880) 455,205 26,676 (242,940) (224,906) Cost of goods manufactured 18,096,453 6,294,510 15,040,712 5,462,730
Opening stock of finished goods 431,356 364,904 292,094 418,225 Closing stock of finished goods (215,637) (215,637) (333,963) (333,963) 215,719 149,267 (41,869) 84,262 Less: Own consumption capitalized (163,171) (52,042) (239,476) (67,772) 18,149,001 6,391,735 14,759,367 5,479,220
11. Taxation
Current: - For the year 1,463,537 209,729 2,267,751 665,977 - Prior years - 58,181 - 33,228 1,463,537 267,910 2,267,751 699,205 Deferred 316,679 172,017 60,008 20,795 1,780,216 439,927 2,327,759 720,000
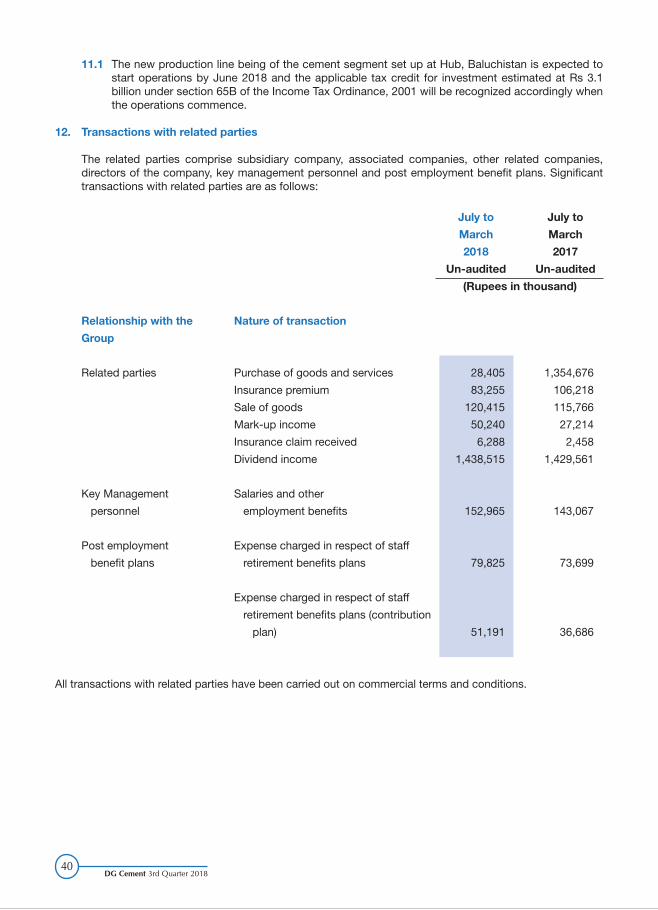
11.1 The new production line being of the cement segment set up at Hub, Baluchistan is expected to start operations by June 2018 and the applicable tax credit for investment estimated at Rs 3.1 billion under section 65B of the Income Tax Ordinance, 2001 will be recognized accordingly when the operations commence.
12. Transactions with related parties The related parties comprise subsidiary company, associated companies, other related companies, directors of the company, key management personnel and post employment benefit plans. Significant transactions with related parties are as follows:
July to July to
March March
2018 2017
Un-audited Un-audited
(Rupees in thousand)
Relationship with the Nature of transaction
Group
Related parties Purchase of goods and services 28,405 1,354,676
Insurance premium 83,255 106,218
Sale of goods 120,415 115,766
Mark-up income 50,240 27,214
Insurance claim received 6,288 2,458
Dividend income 1,438,515 1,429,561
Key Management Salaries and other
personnel employment benefits 152,965 143,067
Post employment Expense charged in respect of staff
benefit plans retirement benefits plans 79,825 73,699
Expense charged in respect of staff
retirement benefits plans (contribution
plan) 51,191 36,686
All transactions with related parties have been carried out on commercial terms and conditions.
DG Cement 3rd Quarter 201840

DG Cement 3rd Quarter 201841
March 31, June 30,
2018 2017
Un-audited audited
(Rupees in thousand)
Balances with related parties:
Long term deposits - 325
Trade and other payables 2,154 10,254
Advances, deposits, prepayments and other receivable 5,797 536
Trade debts 21,632 25,138
July to July to
March, March,
2018 2017
Un-audited Un-audited
(Rupees in thousand)
13. Cash generated from operations
Profit before tax 6,520,819 8,781,172
Adjustment for :
- Depreciation on property, plant and equipment 1,723,538 1,471,403
- Profit on bank deposits (9,564) (100,245)
- Profit on disposal of property, plant and equipment (7,554) 6,700
- Dividend income (1,452,056) (1,471,403)
- Provision of WPPF 362,641 466,816
- Retirement and other benefits accrued 78,336 78,996
- Markup income (50,253) (27,214)
- Exchange loss - net 183,655 40,295
- Finance cost 339,008 297,141
- Gain on disposal of investments at fair value through profit or loss - (1,280)
- Gain on derivative financial instruments (12,979) (2,998)
Profit before working capital changes 7,675,591 9,539,383
- Stores, spares and loose tools (594,619) 107,477
- Stock-in-trade 577,496 (305,722)
- Trade debts (322,451) (208,943)
- Advances, deposits, prepayments and other receivables (1,216,605) (3,396,865)
- Trade and other payables 418,868 (656,036)
Net working capital changes (1,137,311) (4,460,089)
Cash generated from operations 6,538,280 5,079,293

DG Cement 3rd Quarter 201842
March 31, March 31, 2018 2017 Un-audited Un-audited (Rupees in thousand)
14. Cash and cash equivalents
Short term borrowings - secured (10,304,578) (5,996,829) Cash and bank balances 383,982 715,144 (9,920,596) (5,281,685)
15. Financial risk management
15.1 Financial risk factors
The group’s activities expose it to a variety of financial risks: market risk (including currency risk, fair value interest rate risk, cash flow interest rate risk and price risk), credit risk and liquidity risk.
The consolidated condensed interim financial information does not include all financial risk management information and disclosures required in the annual financial statements, and should be read in conjunction with the group’s annual financial statements as at June 30, 2017.
There have been no changes in the risk management department or in any risk management policies since the year ended June 30, 2017.
15.2 Liquidity risk
Compared to the year ended June 30, 2017, the group has acquired long term borrowings amounting to Rs 7.8 billion as referred to in note 5.1. The contractual undiscounted cash flows for the group's financial liabilities are as follows.
Rupees in thousand Less than 1 Between 1 and More than 3 Carrying value year 3 years years As at March 31, 2018 Long term finances - secured 20,396,343 1,308,667 11,441,329 7,646,347
Long term deposits 89,876 - - 89,876
Trade and other payables 6,527,308 6,527,308 - -
Short term borrowings - secured 10,304,578 10,304,578 - -
Accrued finance cost 315,150 315,150 - -
37,633,255 18,455,703 11,441,329 7,736,223
As at June 30, 2017 Long term finances - secured 13,133,750 586,250 800,000 1,350,000
Long term deposits 79,441 - - 79,441
Trade and other payables 4,081,090 4,081,090 - -
Short term borrowings - secured 8,614,810 8,614,810 - -
Loan from related party - unsecured 169,000 169,000 - -
Accrued finance cost 219,927 219,927 - -
Derivative financial instrument 48,056 48,056 - -
26,346,074 13,719,133 800,000 1,429,441
DG Cement 3rd Quarter 201843
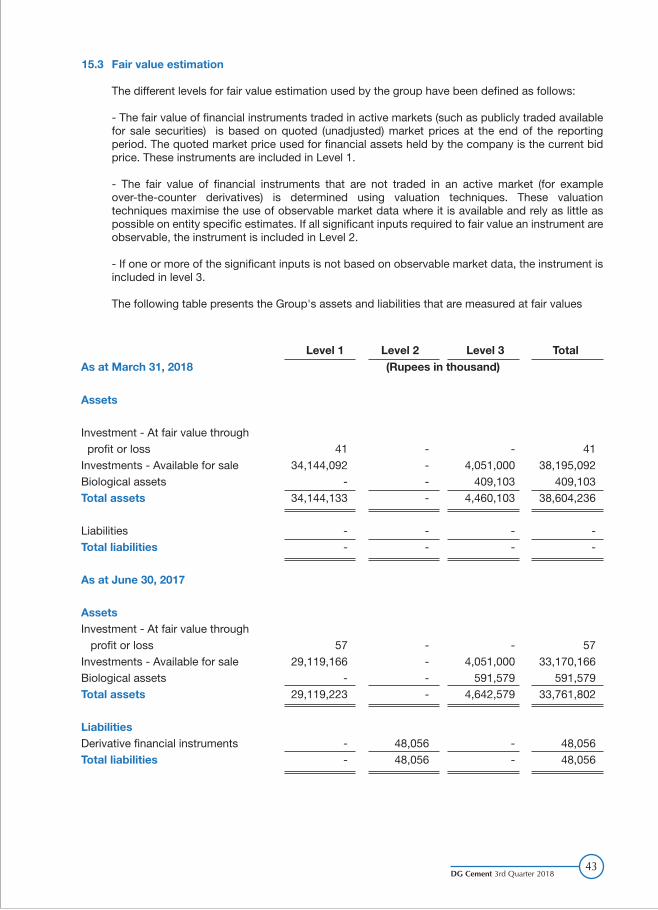
15.3 Fair value estimation
The different levels for fair value estimation used by the group have been defined as follows:
- The fair value of financial instruments traded in active markets (such as publicly traded available for sale securities) is based on quoted (unadjusted) market prices at the end of the reporting period. The quoted market price used for financial assets held by the company is the current bid price. These instruments are included in Level 1.
- The fair value of financial instruments that are not traded in an active market (for example over-the-counter derivatives) is determined using valuation techniques. These valuation techniques maximise the use of observable market data where it is available and rely as little as possible on entity specific estimates. If all significant inputs required to fair value an instrument are observable, the instrument is included in Level 2.
- If one or more of the significant inputs is not based on observable market data, the instrument is included in level 3.
The following table presents the Group's assets and liabilities that are measured at fair values
Level 1 Level 2 Level 3 Total As at March 31, 2018 (Rupees in thousand)
Assets
Investment - At fair value through profit or loss 41 - - 41 Investments - Available for sale 34,144,092 - 4,051,000 38,195,092 Biological assets - - 409,103 409,103 Total assets 34,144,133 - 4,460,103 38,604,236
Liabilities - - - - Total liabilities - - - -
As at June 30, 2017
Assets Investment - At fair value through profit or loss 57 - - 57 Investments - Available for sale 29,119,166 - 4,051,000 33,170,166 Biological assets - - 591,579 591,579 Total assets 29,119,223 - 4,642,579 33,761,802
Liabilities Derivative financial instruments - 48,056 - 48,056 Total liabilities - 48,056 - 48,056
DG Cement 3rd Quarter 201844
There were no transfers between Level 1 and 2 during the period. There were no changes in valuation techniques during the periods.
Valuation techniques used to measure level 3 assets
The fair value of these assets is determined by an independent professionally qualified valuer. Latest valuation of these assets was carried out on June 30, 2017. Level 3 fair value of Biological assets has been determined using a replacement cost approach, whereby, current cost of similar dairy cattle in the international market has been adjusted for transportation costs to arrive at fair value.
Valuation inputs and relationship to fair value
The international market prices of similar dairy cattle, when these increase the fair value increases. The fair value is also dependent on the age of the cattle. The fair value increases as the cows mature. This value decreases as cows age and go through lactations.
Fair value sensitivity analysis for biological assets
If the fair value of biological assets , at the year end date fluctuates by 1% higher/lower with all other variables held constant, pre tax loss for the period would have been Rs 4.091 million (2017: Rs 5.916 million) lower/higher mainly as a result of lower/higher fair value loss on biological assets.
The carrying values of all financial assets and liabilities reflected in the financial statements approximate their fair values. Fair value is determined on the basis of objective evidence at each reporting date.
16. Operating segments
Segment information is presented in respect of the group's business. The primary format, business segment, is based on the group's management reporting structure.
The group's operations comprise of the following main business segment types:
Type of segments Nature of business
Cement Production and sale of clinker, Ordinary Portland and
Sulphate Resistant Cements.
Paper Manufacture and supply of paper products and packing material.
Dairy Production of raw milk
16.1 Segment analysis and reconciliation - condensed
The information by operating segment is based on internal reporting to the Group executive
committee, identified as the 'Chief Operating Decision Maker' as defined by IFRS 8. This
information is prepared under the IFRS's applicable to the consolidated financial statements. All
group financial data are assigned to the operating segments.

DG Cement 3rd Quarter 201845
Rup
ees
in t
hous
and
s
July
1 t
o M
arch
31,
Cem
ent
Pap
er
Dai
ry/F
arm
Elim
inat
ion
- ne
tC
onso
lidat
ed
Rev
enue
from
- E
xter
nal C
usto
mer
s 23
,375
,208
2
2,63
2,89
8
1,0
92,8
76
789
,470
9
27,2
41
826
,666
-
-
2
5,39
5,32
5 2
4,24
9,03
4
- In
ter-
grou
p
-
1,0
13,5
46
1,0
49,0
59
- -
(1,0
13,5
46)
(1,0
49,0
59)
- -
23,3
75,2
08
22,6
32,8
98
2,10
6,42
2 1,
838,
529
927,
241
826,
666
(1,0
13,5
46)
(1,0
49,0
59)
25,3
95,3
25
24,2
49,0
34
Seg
men
t gro
ss p
rofit
/(los
s)
7,16
9,30
1 9,
214,
878
265,
752
450,
181
(181
,886
) (1
76,6
33)
(6,8
43)
1,24
1 7,
246,
324
9,48
9,66
7
Seg
men
t exp
ense
s (1
,802
,599
) (1
,838
,307
) (6
2,45
5)
(47,
306)
(1
80,9
35)
(166
,124
) -
- (2
,045
,989
) (2
,051
,737
)
Oth
er in
com
e
1,63
8,93
1 1,
617,
407
12,8
32
9,70
4 8,
372
13,8
97
(643
) (6
25)
1,65
9,49
2 1,
640,
383
Fina
ncia
l cha
rges
(3
18,0
25)
(272
,329
) (1
9,50
1)
(24,
465)
(1
,482
) (3
47)
- -
(339
,008
) (2
97,1
41)
Taxa
tion
(1,7
17,7
79)
(2,2
67,6
29)
(60,
925)
(1
10,2
87)
(1,5
12)
50,1
57
- -
(1,7
80,2
16)
(2,3
27,7
59)
Pro
fit a
fter t
axat
ion
4,96
9,82
9 6,
454,
020
135,
703
277,
827
(357
,443
) (2
79,0
50)
(7,4
86)
616
4,74
0,60
3 6,
453,
413
Dep
reci
atio
n
1,52
7,80
9 1,
536,
167
24,8
72
24,5
95
146,
984
153,
710
23,8
73
25,6
46
1,72
3,53
8 1,
740,
118
Cap
ital e
xpen
ditu
re
(11,
495,
855)
(1
9,15
2,31
8)
(934
,925
) (9
,678
) (6
8,40
0)
(100
,448
) 18
0,64
3 30
3,71
7 (1
2,31
8,53
7)
(18,
958,
727)
Cas
h to
ope
ratio
ns
5,98
8,15
2 2,
205,
966
(395
,744
) 18
1,31
8 (7
8,51
4)
61,7
40
(64,
158)
(2
00,4
57)
5,44
9,73
6 2,
248,
567
Cas
h fro
m in
vest
ing
(10,
053,
059)
(1
7,69
7,80
4)
(974
,027
) (3
0,97
0)
(80,
001)
(7
1,99
3)
136,
157
206,
066
(10,
970,
930)
(1
7,59
4,70
1)
Rup
ees
in th
ousa
nds
31.0
3.20
18
30.0
6.20
17
31.0
3.20
18
30.0
6.20
17
31.0
3.20
18
30.0
6.20
17
31.0
3.20
18
30.0
6.20
17
31.0
3.20
18
30.0
6.20
17
unau
dite
d au
dite
d un
audi
ted
audi
ted
unau
dite
d au
dite
d un
audi
ted
audi
ted
unau
dite
d au
dite
d
Seg
men
t ass
ets
11
9,50
9,75
9 83
,418
,265
3,
358,
500
1,86
0,33
0 2,
932,
509
3,23
0,91
0 (2
,295
,173
) 22
,607
,669
12
3,50
5,59
5 11
1,11
7,17
4
Seg
men
t lia
bilit
ies
42,1
96,8
42
17,6
34,8
36
2,12
2,58
3 67
7,24
1 60
7,92
4 54
8,88
2 (2
18,9
21)
15,5
90,9
85
44,7
08,4
28
34,4
51,9
44
16
.2
Geo
grap
hica
l seg
men
ts
All
segm
ents
of t
he g
roup
are
man
aged
on
natio
n-w
ide
basi
s an
d op
erat
e m
anuf
actu
ring
faci
litie
s an
d sa
les
offic
es in
Pak
ista
n on
ly.
2018
2017
2018
2017
2018
2017
2018
2017
2018
2017
DirectorChief Executive Chief Financial Officer
17. Date of authorization for issue
This consolidated condensed interim financial information was authorized for issue on April 27, 2018 by
the Board of Directors of the of the Parent Company.
18. Corresponding figures
In order to comply with the requirements of International Accounting Standard 34 - 'Interim Financial
Reporting', the condensed interim consolidated balance sheet have been compared with the balances of
annual audited financial statements of preceding financial year, whereas, the condensed interim
consolidated profit and loss account, condensed interim consolidated statement of comprehensive
income, condensed interim consolidated cash flow statement and condensed interim consolidated
statement of changes in equity have been compared with the balances of comparable period of
immediately preceding financial year.
DG Cement 3rd Quarter 201846

DG Cement 3rd Quarter 201847
Notes

DG Cement 3rd Quarter 201848
Notes

Nishat House, 53-A, Lawrence Road, Lahore-Pakistan.UAN:+92-42-111-11-33-33
D.G. KHAN CEMENT COMPANY LIMITED
VE
RS
AT
ILE
P
h: +
92 4
2 37
12 1
920