3qfy2018 corporate presentation - riverstone...
TRANSCRIPT

Riverstone Holdings Limited3QFY2018 Corporate Presentation

Disclaimer
This presentation may contain forward looking statements that involve risks and uncertainties. Actual future
performance, outcomes and results may differ materially from those expressed in forward looking
statements as a result of a number of risks, uncertainties and assumptions. Representative examples of
these factors include (without limitation) general industry and economic conditions, interest rate trends,
cost of capital and capital availability, competition from other companies, shifts in customer demands,
customers and partners, changes in operating expenses, including employee wages, benefits and training,
governmental and public policy changes and the continued availability of financing in the amounts and the
terms necessary to support future business. You are cautioned not to place undue reliance on these
presentation and the information contain therein, which are based on current view of management on
future events.
Without prejudice to or derogating from the generality of the foregoing, no representation or assurance is
given by Riverstone that this presentation contain all information that an investor may require. To the extent
permitted by applicable law, Riverstone or its related persons (and their respective directors, associates,
connected persons and/or employees) shall not be liable in any manner whatsoever for any consequences
(including but not limited to any direct, indirect or consequential losses, loss of profits and damages) arising
from the reliance or use of the information contain in this presentation.
Investors are advised to make their own independent evaluation from this presentation, consider their own
individual investment objectives, financial situation and particular needs and consult their own professional
and financial advisers as the legal, business, financial, tax and other aspects as investors may regard as
relevant.
2

Group
Financial
Highlights for
3QFY2018Outlook & Key
Challenges
3

▪ Revenue increased 27.5% yoy from RM187.8 million for 3QFY2017 to
RM239.5 million for 3QFY2018
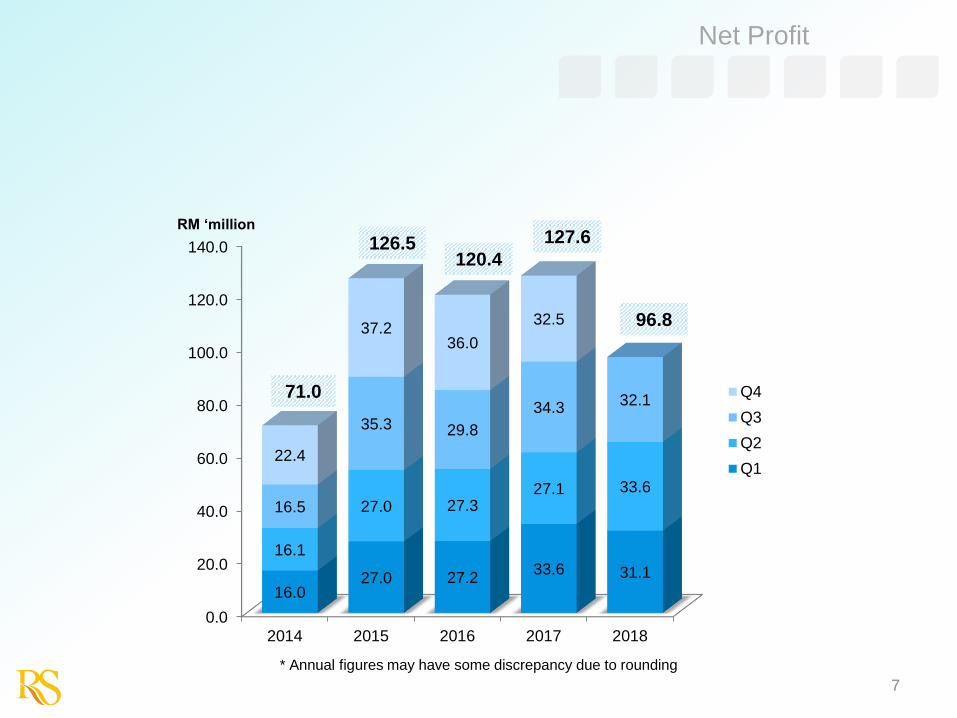
▪ Net profit decreased 6.5% yoy from RM34.3 million for 3QFY2017 to
RM32.1 million for 3QFY2018
▪ Continues to generate positive operating free cash flow of RM44.7
million for 3QFY2018
▪ Net cash position of RM85.7 million
4
Results Overview
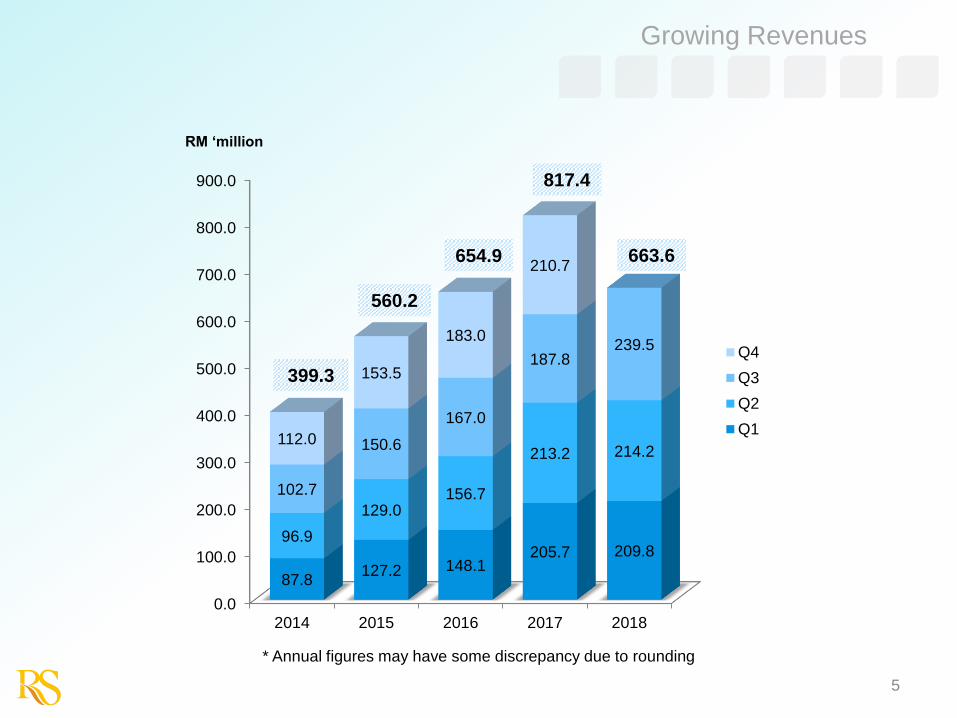
0.0
100.0
200.0
300.0
400.0
500.0
600.0
700.0
800.0
900.0
2014 2015 2016 2017 2018
87.8127.2 148.1
205.7 209.896.9
129.0156.7
213.2 214.2
102.7
150.6
167.0
187.8239.5
112.0
153.5
183.0
210.7
Q4
Q3
Q2
Q1
Growing Revenues
399.3
560.2
654.9
* Annual figures may have some discrepancy due to rounding
RM ‘million
5
817.4
663.6

0.0
20.0
40.0
60.0
80.0
100.0
120.0
140.0
160.0
180.0
200.0
2014 2015 2016 2017 2018
26.940.2 43.1
51.8 46.9
25.9
38.8 38.2
43.7 48.326.5
48.0 43.6
50.8 46.1
29.6
48.0 48.2
51.5
Q4
Q3
Q2
Q1
Gross Profit
RM ‘million
108.9
174.9
* Annual figures may have some discrepancy due to rounding
6
173.2
197.8
141.3
0.0
20.0
40.0
60.0
80.0
100.0
120.0
140.0
2014 2015 2016 2017 2018
16.027.0 27.2
33.6 31.1
16.1
27.0 27.327.1 33.6
16.5
35.3 29.8
34.332.1
22.4
37.236.0
32.5
Q4
Q3
Q2
Q1
Net Profit
71.0
126.5120.4
* Annual figures may have some discrepancy due to rounding
RM ‘million
7
127.6
96.8

Positive Cash Flow Generation From Operating Activities
0.0
20.0
40.0
60.0
80.0
100.0
120.0
140.0
160.0
2014 2015 2016 2017 2018
9.7
26.213.3
40.4 43.525.2
27.440.7
37.6 26.3
21.2
54.7
34.3
58.8
44.7
6.8
13.8
30.7
8.9
Q4
Q3
Q2
Q1
RM ‘million
62.8
122.1 119.0
* Annual figures may have some discrepancy due to rounding8
145.7
114.3

Robust Balance Sheet Strength
Year End
31 Dec
As at
31 Dec 2017
(RM’000)
As at
30 Sep 2018
(RM’000)
Net cash and cash equivalents 114,250 106,176
Total borrowings 25,000 20,500
Shareholders equity 632,616 686,394
Net assets (RM Sen per share)¹ 85.36 92.62
Return on equity (“ROE”) 220.7%
(3QFY2017)
18.8%
(3QFY2018)
¹Based on 741.1 million shares in issue excluding treasury shares as at 30 September 2018 and 31
December 2017 respectively2Calculated on an annualised basis
9
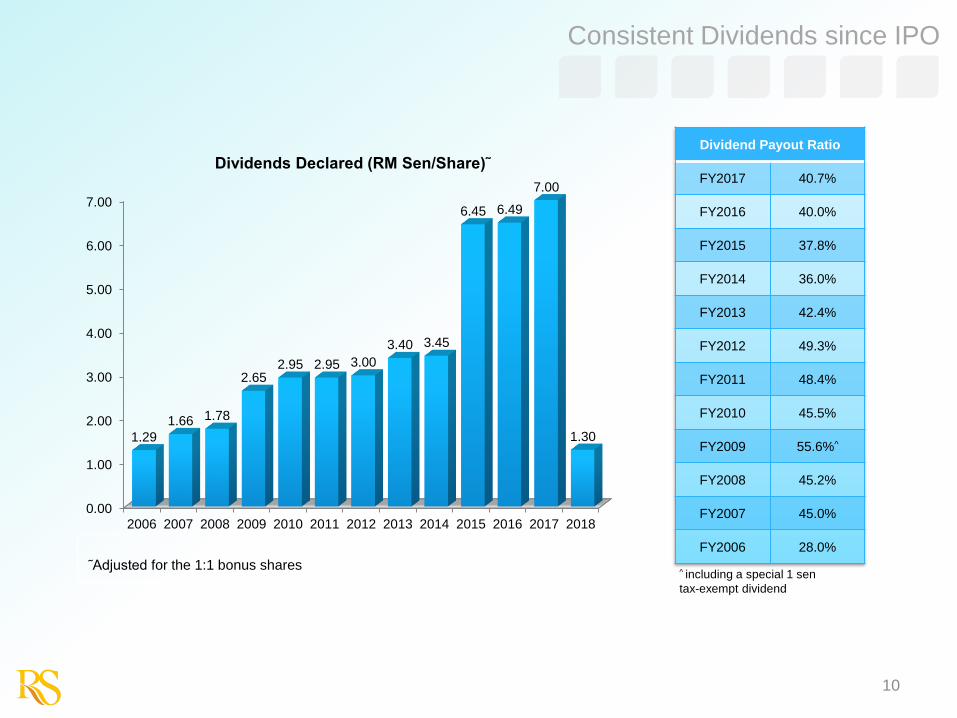
Consistent Dividends since IPO
0.00
1.00
2.00
3.00
4.00
5.00
6.00
7.00
2006 2007 2008 2009 2010 2011 2012 2013 2014 2015 2016 2017 2018
1.29
1.66 1.78
2.652.95 2.95 3.00
3.40 3.45
6.45 6.49
7.00
1.30
Dividends Declared (RM Sen/Share)˜
^ including a special 1 sen
tax-exempt dividend
Dividend Payout Ratio
FY2017 40.7%
FY2016 40.0%
FY2015 37.8%
FY2014 36.0%
FY2013 42.4%
FY2012 49.3%
FY2011 48.4%
FY2010 45.5%
FY2009 55.6%^
FY2008 45.2%
FY2007 45.0%
FY2006 28.0%
˜Adjusted for the 1:1 bonus shares
10

Group
Financial
Highlights for
3QFY2018Outlook & Key
Challenges
11

Outlook
12
▪ Phase 5 expansion is on track with an additional 1.4 billion pieces to ramp up totalannual production capacity to 9.0 billion pieces by end FY2018
▪ Phase 6 expansion to add another 1.4 billion pieces by end FY2019 to 10.4 billionpieces in total annual production capacity
▪ Both cleanroom and healthcare markets as well as US and Japan markets are growingand continue to gain traction
▪ Continue to develop new products to tap on cleanroom and healthcare markets

Key Challenges
13
Challenges Actions
Competition • Cleanroom: Continue to target new markets and
customers
• Healthcare: Focus on customised and premium products
Increase in costs such as raw
material, labor, and fuel
• Automation
• Improve productivity using Lean Six Sigma
• Reduce changeover time by installing an additional line

Investment Merits
Plan to increase capacity by 1.0 ~ 1.5 billion pieces of gloves every
year
Resilient balance sheet with net cash position and continued ability
to generate positive operating cash flow
Consistent dividend payout since listing
Why we are distinct from our competitors – we have 2 main sources of revenue, namely:
1. High tech cleanroom gloves –own brand, direct to end-user; and
2.Healthcare gloves – consistent demand, resistant to changing market conditions
14

15

Thank You!
Media & IR Contacts:
Kamal SamuelManaging Director
James BywaterSenior Consultant
Jonathan WeeAssociate
Tel: (65) 6438 2990
Fax: (65) 6438 0064
16