3q’14 financial results october 17, 2014
TRANSCRIPT
3Q’14 Financial Results
October 17, 2014

2
Cautionary Statement Regarding Forward-Looking Statements
The following slides are part of a presentation by Synchrony Financial in connection with reporting quarterly financial results. No representation is made that the information in these slides is complete. For
additional information, see the earnings release and financial supplement included as exhibits to our Current Report on Form 8-K filed today and available on our website (www.synchronyfinancial.com) and
the SEC’s website (www.sec.gov). All references to net earnings and net income are intended to have the same meaning.
This presentation contains certain forward-looking statements as defined in Section 27A of the Securities Act of 1933, as amended, and Section 21E of the Securities Exchange Act of 1934, as amended,
which are subject to the “safe harbor” created by those sections. Forward-looking statements may be identified by words such as “outlook,” “expects,” “intends,” “anticipates,” “plans,” “believes,” “seeks,”
“targets,” “estimates,” “will,” “should,” “may” or words of similar meaning, but these words are not the exclusive means of identifying forward-looking statements. Forward-looking statements are based on
management’s current expectations and assumptions, and are subject to inherent uncertainties, risks and changes in circumstances that are difficult to predict. As a result, actual results could differ
materially from those indicated in these forward-looking statements. Factors that could cause actual results to differ materially include global political, economic, business, competitive, market, regulatory
and other factors and risks, such as: the impact of macroeconomic conditions and whether industry trends we have identified develop as anticipated; retaining existing partners and attracting new partners,
concentration of our platform revenue in a small number of Retail Card partners, promotion and support of our products by our partners, and financial performance of our partners; our need for additional
financing, higher borrowing costs and adverse financial market conditions impacting our funding and liquidity, and any reduction in our credit ratings; our ability to securitize our loans, occurrence of an early
amortization of our securitization facilities, loss of the right to service or subservice our securitized loans, and lower payment rates on our securitized loans; our reliance on dividends, distributions and other
payments from Synchrony Bank; our ability to grow our deposits in the future; changes in market interest rates and the impact of any margin compression; effectiveness of our risk management processes
and procedures, reliance on models which may be inaccurate or misinterpreted, our ability to manage our credit risk, the sufficiency of our allowance for loan losses and the accuracy of the assumptions or
estimates used in preparing our financial statements; our ability to offset increases in our costs in retailer share arrangements; competition in the consumer finance industry; our concentration in the U.S.
consumer credit market; our ability to successfully develop and commercialize new or enhanced products and services; our ability to realize the value of strategic investments; reductions in interchange
fees; fraudulent activity; cyber-attacks or other security breaches; failure of third parties to provide various services that are important to our operations; disruptions in the operations of our computer
systems and data centers; international risks and compliance and regulatory risks and costs associated with international operations; catastrophic events; alleged infringement of intellectual property rights
of others and our ability to protect our intellectual property; litigation and regulatory actions; damage to our reputation; our ability to attract, retain and motivate key officers and employees; tax legislation
initiatives or challenges to our tax positions and state sales tax rules and regulations; significant and extensive regulation, supervision, examination and enforcement of our business by governmental
authorities, the impact of the Dodd-Frank Act and the impact of the CFPB’s regulation of our business; changes to our methods of offering our CareCredit products; impact of capital adequacy rules;
restrictions that limit our ability to pay dividends and repurchase our capital stock and that limit Synchrony Bank’s ability to pay dividends; regulations relating to privacy, information security and data
protection as well as anti-money laundering and anti-terrorism financing laws; use of third-party vendors and ongoing third-party business relationships; effect of General Electric Capital Corporation (GECC)
being subject to regulation by the Federal Reserve Board both as a savings and loan holding company and as a systemically important financial institution; General Electric Company (GE) not completing
the separation from us as planned or at all, GE’s inability to obtain savings and loan holding company deregistration (GE SLHC Deregistration) and GE continuing to have significant control over us;
completion by the Federal Reserve Board of a review (with satisfactory results) of our preparedness to operate on a standalone basis, independently of GE, and Federal Reserve Board approval required
for us to continue to be a savings and loan holding company, including the timing of the approval and the imposition of any significant additional capital or liquidity requirements; our need to establish and
significantly expand many aspects of our operations and infrastructure; delays in receiving or failure to receive Federal Reserve Board agreement required for us to be treated as a financial holding
company after the GE SLHC Deregistration; loss of association with GE’s strong brand and reputation; limited right to use the GE brand name and logo and need to establish a new brand; GE has
significant control over us; terms of our arrangements with GE may be more favorable than we will be able to obtain from unaffiliated third parties; obligations associated with being a public company; our
incremental cost of operating as a standalone public company could be substantially more than anticipated; GE could engage in businesses that compete with us, and conflicts of interest may arise between
us and GE; and failure caused by us of GE’s distribution of our common stock to its stockholders in exchange for its common stock to qualify for tax-free treatment, which may result in significant tax
liabilities to GE for which we may be required to indemnify GE. For the reasons described above, we caution you against relying on any forward-looking statements, which should also be read in conjunction
with the other cautionary statements that are included elsewhere in this presentation and in our public filings, including under the heading “Risk Factors” in the Registration Statement on Form S-1, as
amended and filed on July 18, 2014 (File No. 333-194528). You should not consider any list of such factors to be an exhaustive statement of all of the risks, uncertainties, or potentially inaccurate
assumptions that could cause our current expectations or beliefs to change. Further, any forward-looking statement speaks only as of the date on which it is made, and we undertake no obligation to
update or revise any forward-looking statement to reflect events or circumstances after the date on which the statement is made or to reflect the occurrence of unanticipated events, except as otherwise
may be required by law. Differences between this presentation and the supplemental financials may occur due to rounding.
Non-GAAP Measures
The information provided herein includes measures we refer to as “platform revenue” and “platform revenue excluding retailer share arrangements” and certain capital ratios, which are not prepared in
accordance with U.S. generally accepted accounting principles (“GAAP”). The reconciliations of such measures to the most directly comparable GAAP measures are included in the detailed financial tables
included in the press release accompanying this distribution, which is available on our website and the SEC’s website.
Disclaimers

3
(a) Source: Nilson
(b) Includes loan receivables of $56.8 billion and loan receivables held for sale of $1.5 billion
Business Overview
Strong Value Proposition for Partners and Consumers 2 Deep partner integration enables customized loyalty products, across channels
Advanced data analytics and targeted marketing capabilities
Dedicated team members support partners to help maximize program effectiveness
Partner and cardholder focused mobile payments and e-commerce strategies … forging new partnerships
and investing in emerging technologies
Attractive Growth Opportunities 3 Significant opportunity to leverage long-standing partnerships to increase penetration
Opportunity to attract new partners
Opportunity to expand commercial offerings
Developing broad product suite to support our efforts to build a leading, full-scale online bank
Solid Financial Profile and Operating Performance 4 Strong receivables growth: 9% annual growth since 2011, with 714 average FICO
Solid fundamentals with attractive returns
Strong capital and liquidity with diverse funding profile
Positioned for future capital return post separation
Leading Consumer Finance Business
Largest PLCC provider in US: 59.9 million average active accounts and $58.3 billion in receivables
A leader in financing for major consumer purchases and healthcare services
Long-standing and diverse partner base
1 (a) (b)

4
3Q’14 Highlights
Financial highlights
• $548 million Net earnings, $0.70 EPS
• Strong growth across the business
Purchase volume +11%, Loan
receivables +7%, Platform revenue +9%
• Asset quality continues to improve
Net charge-offs down 2bps.
30+ delinquency down 6bps.
• Expenses in-line with expectations
Increase driven by growth investments
and standalone infrastructure
• Strong capital and liquidity
15.1% T1C (B1)
$14.1 billion high quality liquid assets
Business highlights
• Extended two of our largest partners …
including Lowe’s, we have now renewed
our 5 largest partnerships through 2019
and beyond
• Payment Solutions added ~ 1,000
partners & CareCredit added ~ 9,000
provider locations since 3Q’13
• Announced agreement with Apple Pay
for participating Dual Card programs
• Introduced new value proposition at
Sam’s Club and launched EMV cards at
Sam’s Club and Walmart
• Launched new brand campaign
• Separation process underway …
building out stand-alone infrastructure

5
Growth Metrics
+11% Purchase volume $ in billions
Loan receivables $ in billions
Active accounts Average active accounts in millions
Platform revenue $ in millions
3Q’13 3Q’14
$23.5 $26.0
$53.3 $56.8
$2,519 $2,317
59.9 56.2
+7% +9%
+7%
3Q’13 3Q’14
3Q’13 3Q’14 3Q’13 3Q’14
(a) $58.3 billion total receivables including loans held for sale of $1.5 billion
(a)

6
Platform Results
Retail Card Loan receivables, $ in billions
$36.2 $38.5
3Q’13 3Q’14
(a) Loan receivables do not include $1.5 billion of balances classified as held for sale, 11% growth including held for sale receivables
Strong receivables growth across
partner programs
Platform revenue up 10% driven
by receivable growth
Payment Solutions Loan receivables, $ in billions
$10.7 $11.5
3Q’13 3Q’14
Broad receivables growth led by
home furnishing, auto and power
equipment
Platform revenue up driven by
receivable growth
CareCredit Loan receivables, $ in billions
$6.4 $6.8
3Q’13 3Q’14
Receivables growth led by dental
and veterinary
Platform revenue up 8% driven
by receivable growth and higher
yield
Purchase
volume
Accounts
$18.8
45.6
$21.0
48.4
+11%
+6%
$3.0
6.3
$3.2
6.9
+9%
+9%
$1.7
4.3
$1.8
4.6
+5%
+8%
Purchase
volume
Accounts
Purchase
volume
Accounts
Platform
revenue $1,544 $1,694 +10% $382 $403 +6% $391 $422 +8%
Platform
revenue
Platform
revenue
+6% +7% +6%
(b) (b) (b)
(b) Accounts represent average active accounts in millions, which are credit card or installment loan accounts on which there has been a purchase, payment or outstanding balance in the current month
(a)
(c) Platform revenue $ in millions
(c) (c) (c)
V% V% V%

7
Financial Results
Summary earnings statement
Third quarter 2014 highlights
$ in millions, except ratios
Net interest income (NII) $2,879 $2,703 $176 7%
Retailer share arrangements (RSA) (693) (680) (13) (2)%
NII, after RSA 2,186 2,023 163 8%
Provision for loan losses 675 541 (134) (25)%
Other income 96 114 (18) (16)%
Other expense 728 575 (153) (27)%
Pre-Tax earnings 879 1,021 (142) (14)%
Provision for income taxes 331 380 49 13%
Net earnings $548 $641 $(93) (15)%
Return on assets 3.2% 4.7% (1.5)pts.
3Q’14 3Q’13 % $
B/(W) • $548 million Net earnings, $0.70 EPS
• Net interest income after RSAs up 8%
driven by growth in loan receivables
RSAs up $13 million, 2%
• Provision for loan losses driven
largely by growth
Asset quality stable … 30+ delinquencies
down 6bps. vs. prior year
Reserve coverage flat to 2Q’14 at 5.5%
• Other income driven largely by
increased loyalty and rewards costs
• Other expenses in-line with
expectations, increase driven by
growth and infrastructure build

8
Net Interest Income
Third quarter 2014 highlights
• Net interest income up 7% driven by
growth in receivables partially offset
by higher funding costs
Interest and fees on loans up 8%
• Net interest margin decline driven
primarily by increase in liquidity
portfolio
Receivable yield 21.8%, down 21bps.
reflecting slightly higher payment rate
Liquidity portfolio increased to $14.1 billion,
conservatively invested in cash and
short-term U.S. Treasuries
Interest expense increased to 1.7%, up
14bps.
Net interest income
$ in millions, % of average interest-earning assets
19.7% 17.1%
3Q’13 3Q’14
+7%
$2,703 $2,879
Receivable Yield 21.99% 21.78% (21)bps.
3Q’13 Net interest margin 19.7%
Liquidity (2.3)
Receivable yield (0.2)
Interest expense (0.1)
3Q’14 Net interest margin 17.1%
Net interest margin walk
V%
9
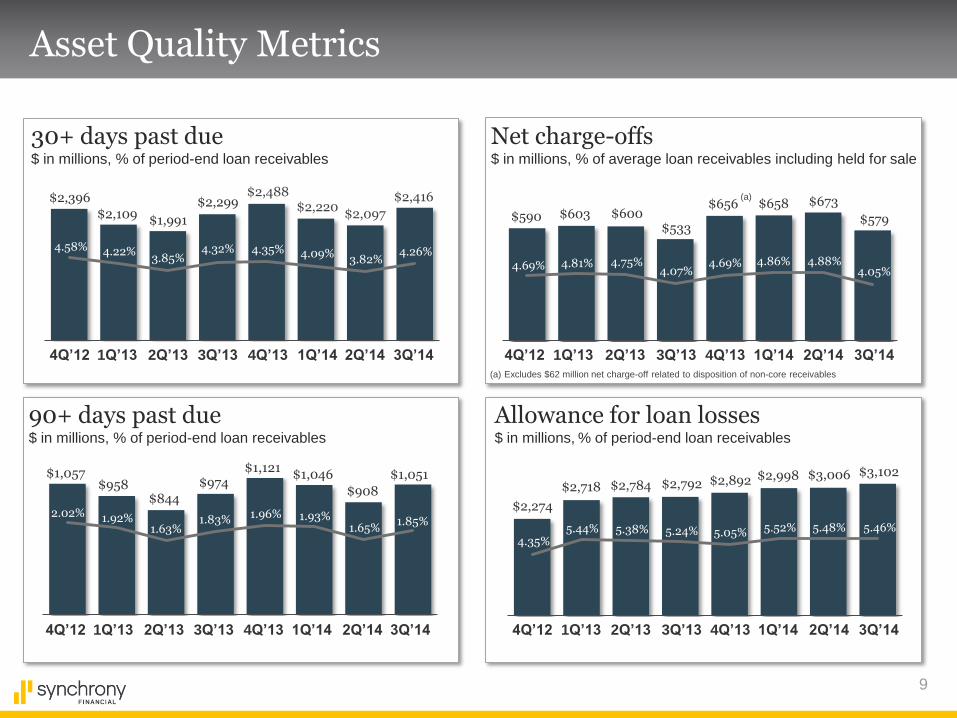
Asset Quality Metrics
Net charge-offs $ in millions, % of average loan receivables including held for sale
30+ days past due $ in millions, % of period-end loan receivables
Allowance for loan losses $ in millions, % of period-end loan receivables
90+ days past due $ in millions, % of period-end loan receivables
4.32% 4.26%
5.24% 5.46%
4.07% 4.88%
$974 $1,051
3Q’13 3Q’14
$2,299 $2,416
$533
$673
$2,792 $3,102
1.83% 1.85%
4.86% 4.69%
$656
4.05%
$579 $658
5.48%
$3,006
5.52%
$2,998
5.05%
$2,892
3.82%
$2,097
4.09%
$2,220
4.35%
$2,488
$908
1.65%
$1,046
1.93%
$1,121
1.96%
4Q’13 1Q’14 2Q’14
3Q’13 3Q’14 4Q’13 1Q’14 2Q’14
3Q’13 3Q’14 4Q’13 1Q’14 2Q’14
3Q’13 3Q’14 4Q’13 1Q’14 2Q’14
4.75%
$600
2Q’13
4.81%
$603
1Q’13
5.38%
$2,784
2Q’13
5.44%
$2,718
1Q’13
3.85%
$1,991
2Q’13
4.22%
$2,109
1Q’13
$844
2Q’13
1.63%
$958
1Q’13
1.92%
4.58%
$2,396
4Q’12
$1,057
4Q’12
2.02%
4.69%
$590
4Q’12
4.35%
$2,274
4Q’12
(a) Excludes $62 million net charge-off related to disposition of non-core receivables
(a)

10
Other expense $ in millions
Other Expense
Employee cost $173 $239 $66 38%
Professional fees 120 159 39 33%
Marketing/BD 54 115 61 113%
Info. processing 47 47 - -%
Other 181 168 (13) (7)%
Other expense $575 $728 $153 27%
Efficiency 26.9% 31.9% +5.0pts.
$575
Third quarter 2014 highlights
• Expenses in-line with expectations …
increase driven by business growth,
marketing investments and
infrastructure build
Purchase volume +11%, Receivables +7%
Investments to establish our brand, grow
direct deposits and market our programs
Infrastructure build costs
• Separation expenses in line with S-1
(a) “Other Expenses” divided by sum of “NII, after RSA” plus “Other income”
(1)
V$ V%
+27%
(a)
$728
3Q’13 3Q’14 S-1 Current
Guidance Estimate
Marketing $100 - $150 $120
Brand/Deposits $90 - $100 $100
Infrastructure $200 - $300 $250
$390 - $550 ~ $470
11
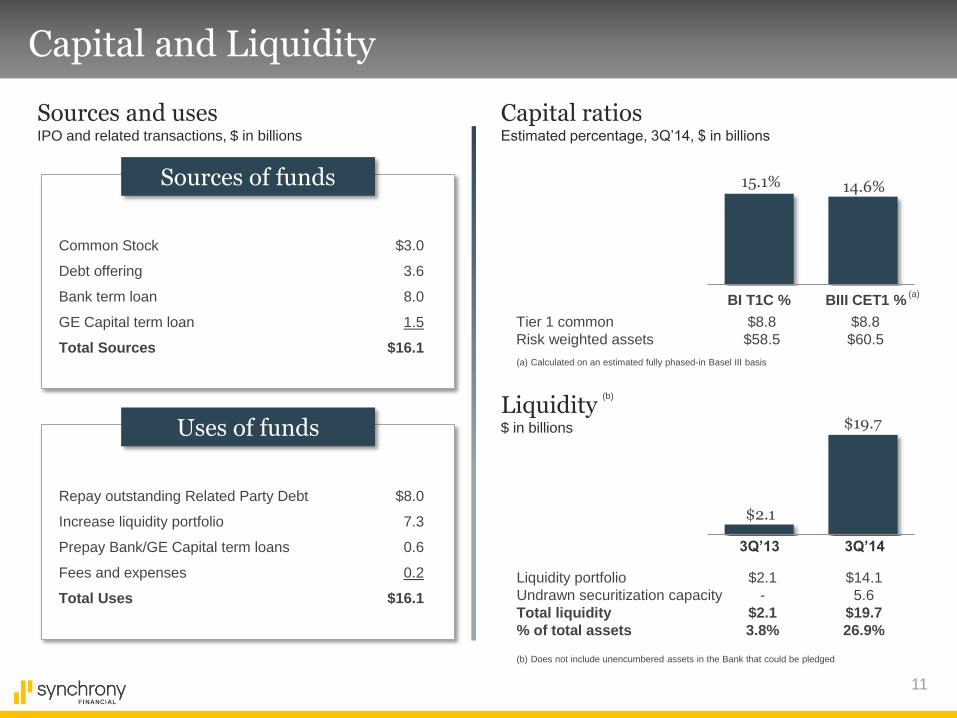
Capital and Liquidity
Liquidity $ in billions
Liquidity portfolio $2.1 $14.1
Undrawn securitization capacity - 5.6
Total liquidity $2.1 $19.7
% of total assets 3.8% 26.9%
3Q’14
$19.7
$2.1
3Q’13
Capital ratios Estimated percentage, 3Q’14, $ in billions
15.1%
BI T1C %
Tier 1 common $8.8 $8.8
Risk weighted assets $58.5 $60.5
(b) Does not include unencumbered assets in the Bank that could be pledged
(b)
Sources and uses IPO and related transactions, $ in billions
Common Stock $3.0
Debt offering 3.6
Bank term loan 8.0
GE Capital term loan 1.5
Total Sources $16.1
Sources of funds
Repay outstanding Related Party Debt $8.0
Increase liquidity portfolio 7.3
Prepay Bank/GE Capital term loans 0.6
Fees and expenses 0.2
Total Uses $16.1
Uses of funds
BIII CET1 %
14.6%
(a) Calculated on an estimated fully phased-in Basel III basis
(a)

12
Funding profile
Funding sources $ in billions
3Q’13 3Q’14 Variance
Deposits 47% 54% +7pts.
Securitization 33% 25% (8)pts.
GE Capital loan 20% 2% (18)pts.
3rd Party Debt - 19% 19pts.
$46.8
$60.3
Deposits
Securitization
GE Capital loan
3rd Party Debt
$22.2
$15.4
$9.2
$32.7
$15.1
$11.1
Third quarter 2014 highlights
• Strong deposit growth … now 54% of
funding
Long-term target of 60% - 70% of total
funding from deposits
• Extended securitization facilities and
added $5.6B undrawn capacity
• Completed unsecured bond issuance
Increased size from $3.0 billion to $3.6
billion … additional proceeds used to pre-
pay Bank and GE Capital term loans
• GE Capital loan prepayment ahead of
schedule
Increased Bank term loan by $750 million
on October 6th, additional proceeds used
to pay down GE Capital term loan
Prepayment will result in approximately
$15 million interest expense savings
annually
V$
+11.1
(7.8)
(0.3)
+10.5
$1.4
13
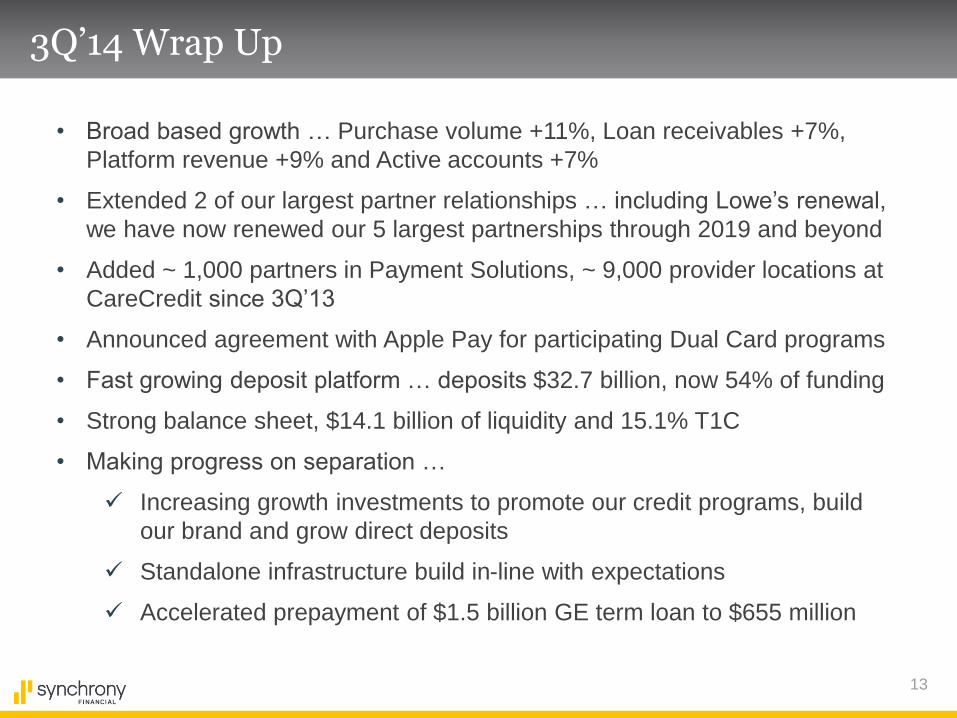
3Q’14 Wrap Up
• Broad based growth … Purchase volume +11%, Loan receivables +7%,
Platform revenue +9% and Active accounts +7%
• Extended 2 of our largest partner relationships … including Lowe’s renewal,
we have now renewed our 5 largest partnerships through 2019 and beyond
• Added ~ 1,000 partners in Payment Solutions, ~ 9,000 provider locations at
CareCredit since 3Q’13
• Announced agreement with Apple Pay for participating Dual Card programs
• Fast growing deposit platform … deposits $32.7 billion, now 54% of funding
• Strong balance sheet, $14.1 billion of liquidity and 15.1% T1C
• Making progress on separation …
Increasing growth investments to promote our credit programs, build
our brand and grow direct deposits
Standalone infrastructure build in-line with expectations
Accelerated prepayment of $1.5 billion GE term loan to $655 million
14
Summary
Growth objectives supported by online bank
with strong deposit growth
Solid fundamentals with strong returns
Attractive growth opportunities, particularly to further leverage
data analytics, mobile and e-capabilities
Private Label Credit Card leader well-positioned
to capitalize on deep partner integration
Differentiated business model with solid value proposition
for both partners and consumers

3Q’14 Financial Results
October 17, 2014