3q 2016 ryder earnings presentation
TRANSCRIPT

Proprietary and Confidential
Third Quarter 2016 Earnings Conference Call
October 25, 2016
@ 2016 Ryder System, Inc.All Rights Reserved
2
Safe Harbor and Non-GAAP Financial MeasuresNote Regarding Forward-Looking Statements: Certain statements and information included in this presentation are "forward-looking statements" under theFederal Private Securities Litigation Reform Act of 1995, including our expectations regarding market conditions, earnings performance, revenue in our businesssegments, fleet size, growth in our contractual product lines, demand and pricing trends in commercial rental and used vehicle sales, free cash flow, capitalexpenditures, debt, adjusted ROC and our 2017 outlook. Accordingly, these forward-looking statements should be evaluated with consideration given to themany risks and uncertainties inherent in our business that could cause actual results and events to differ materially from those in the forward-looking statements.Important factors that could cause such differences include, among others, lower than expected lease sales, further decreases in commercial rental demand orpoor acceptance of rental pricing, our ability to right-size our commercial rental fleet in line with demand, availability of labor to maintain our fleet at normalizedlevels, ability to redeploy and prepare vehicles for sale in a cost-efficient manner, worsening of market demand for used vehicles impacting current pricing,residual values and our anticipated proportion of retail versus wholesale sales, lack of customer demand for on-demand maintenance, higher than expectedmaintenance costs from new engine technology or lower than expected benefits from maintenance initiatives, decreases in freight demand or volumes, pooroperational execution particularly with start-ups and new product launches, our ability to obtain adequate profit margins for our services, our inability to maintaincurrent pricing levels due to soft economic conditions, uncertainty and instability in the global economic market, business interruptions or expenditures due tosevere weather or natural occurrences, competition from other service providers and new entrants, customer retention levels, loss of key customers, driver andtechnician shortages resulting in higher procurement costs and turnover rates, unexpected bad debt reserves or write-offs, changes in customers’ businessenvironments that will limit their ability to commit to long-term vehicle leases, a decrease in credit ratings, increased debt costs, adequacy of accountingestimates, reserves and accruals particularly with respect to pension, taxes, depreciation, insurance and revenue, sudden or unusual changes in fuel prices,unanticipated currency exchange rate fluctuations, our ability to manage our cost structure, and the risks described in our filings with the Securities andExchange Commission. The risks included here are not exhaustive. New risks emerge from time to time and it is not possible for management to predict all suchrisk factors or to assess the impact of such risks on our business. Accordingly, we undertake no obligation to publicly update or revise any forward-lookingstatements, whether as a result of new information, future events, or otherwise.
Note Regarding Non-GAAP Financial Measures: This presentation includes certain non-GAAP financial measures as defined under SEC rules, including:
Comparable Earnings Measures, which consist of comparable earnings from continuing operations, comparable earnings per share from continuingoperations (as well as forecasts), comparable earnings before income tax and comparable tax rate. Additionally, our adjusted return on average capital(ROC) and adjusted return on capital spread (ROC spread) measures are calculated based on comparable earnings items.
Operating Revenue Measures, which consist of operating revenue and operating revenue growth excluding foreign exchange for Ryder and its businesssegments, and segment EBT as a percentage of operating revenue.
Cash Flow Measures, which consist of total cash generated and free cash flow.
Debt Measures, including total obligations and total obligations to equity.
Refer to Appendix - Non-GAAP Financial Measures, beginning on slide 34, for reconciliations of the non-GAAP financial measures contained in this presentationto the nearest GAAP measure. Additional information regarding non-GAAP financial measures as required by Regulation G and Item 10(e) of Regulation S-Kcan be found in our most recent Form 10-K, Form 10-Q and our Form 8-K filed with the SEC as of the date of this presentation, which are available athttp://investors.ryder.com.

@ 2016 Ryder System, Inc.All Rights Reserved
3
Contents
• Third Quarter 2016 Results Overview• Asset Management Update• EPS Forecast• Q & A

@ 2016 Ryder System, Inc.All Rights Reserved
4
3rd Quarter Results Overview
• Earnings per diluted share from continuing operations were $1.59 vs. $1.70 in 3Q15
— 3Q16 included non-operating pension costs of $0.08 — 3Q15 included non-operating pension costs of $0.05 and a pension-related
benefit of $0.01
• Comparable earnings per diluted share from continuing operations were $1.67 vs. $1.74 in 3Q15
• Total revenue increased 3% (up 4% excluding foreign exchange) and operating revenue increased 3% (up 4% excluding foreign exchange) vs. prior year
— Total revenue benefited from higher operating revenue, partially offset by lower fuel costs passed through to customers
— Operating revenue increased due to higher contractual revenue in all business segments, partially offset by lower transactional commercial rental revenue

@ 2016 Ryder System, Inc.All Rights Reserved
5
Key Financial Statistics
Third Quarter ($ Millions, Except Per Share Amounts)
Note: Amounts throughout presentation may not be additive due to rounding.
2016 2015 %B/(W)Total Revenue $ 1,724.4 $ 1,669.1 3%Fuel and Subcontracted Transportation (256.1) (242.6) 6%
Operating Revenue $ 1,468.3 $ 1,426.5 3%
Earnings Per Share from Continuing Operations $ 1.59 $ 1.70 (6)%
Comparable Earnings Per Share from Continuing Operations $ 1.67 $ 1.74 (4)%
Memo:Average Shares (Millions) - Diluted 53.3 53.3Tax Rate from Continuing Operations 35.4% 35.1%Comparable Tax Rate from Continuing Operations 35.7% 35.3%

@ 2016 Ryder System, Inc.All Rights Reserved
6
Key Financial Statistics
Year-To-Date ($ Millions, Except Per Share Amounts)
Note: Amounts throughout presentation may not be additive due to rounding.
2016 2015 %B/(W)Total Revenue $ 5,057.8 $ 4,899.2 3%Fuel and Subcontracted Transportation (733.8) (779.8) (6)%
Operating Revenue $ 4,324.0 $ 4,119.4 5%
Earnings Per Share from Continuing Operations $ 4.02 $ 4.31 (7)%
Comparable Earnings Per Share from Continuing Operations $ 4.35 $ 4.47 (3)%
Memo:Average Shares (Millions) - Diluted 53.3 53.2Tax Rate from Continuing Operations 36.1% 35.7%Comparable Tax Rate from Continuing Operations 36.5% 36.4%Adjusted Return on Capital vs. Cost of Capital (Trailing 12 months) 1.0% 1.4%

@ 2016 Ryder System, Inc.All Rights Reserved
7
3rd Quarter Results Overview – FMS
• Fleet Management Solutions (FMS) total revenue unchanged and FMS operating revenue up 1%
– Full service lease revenue up 7%
– Contract maintenance revenue up 3%
– Commercial rental revenue down 14%
– Contract-related maintenance revenue up 5%
• FMS earnings declined due to lower used vehicle results and lower commercial rental performance, partially offset by higher full service lease performance and reduced overhead spending
• FMS earnings before tax (EBT) down 11%– FMS EBT percent of FMS total revenue down 120 basis points to 9.7%
– FMS EBT percent of FMS operating revenue down 150 basis points to 11.3%

@ 2016 Ryder System, Inc.All Rights Reserved
8
3rd Quarter Results Overview – DTS
• Dedicated Transportation Solutions (DTS) total revenue up 15% and DTS operating revenue up 7% due to higher volumes and new business as well as higher pricing
• DTS earnings increased primarily due to revenue growth
• DTS earnings before tax (EBT) up 32%
– DTS EBT percent of DTS total revenue up 80 basis points to 6.7%– DTS EBT percent of DTS operating revenue up 170 basis points to 8.9%

@ 2016 Ryder System, Inc.All Rights Reserved
9
3rd Quarter Results Overview – SCS
• Supply Chain Solutions (SCS) total revenue up 8% and SCS operating revenue up 8%
– SCS total revenue and SCS operating revenue increased due to new business and increased volumes
• SCS earnings increased primarily due to revenue growth
• SCS earnings before tax (EBT) up 16% – SCS EBT percent of SCS total revenue up 50 basis points to 7.4% – SCS EBT percent of SCS operating revenue up 70 basis points to 9.0%

@ 2016 Ryder System, Inc.All Rights Reserved
10
Capital Expenditures
Year-To-Date($ Millions)
2016 20152016 $
O/(U) 2015
Full Service Lease $ 1,223 $ 1,509 $ (286)
Commercial Rental 79 513 (434)
Operating Property and Equipment 102 83 19
Gross Capital Expenditures 1,404 2,106 (702)
Less: Proceeds from Sales (Primarily Revenue Earning Equipment) (338) (321) 17
Net Capital Expenditures $ 1,066 $ 1,785 $ (719)
@ 2016 Ryder System, Inc.All Rights Reserved
11
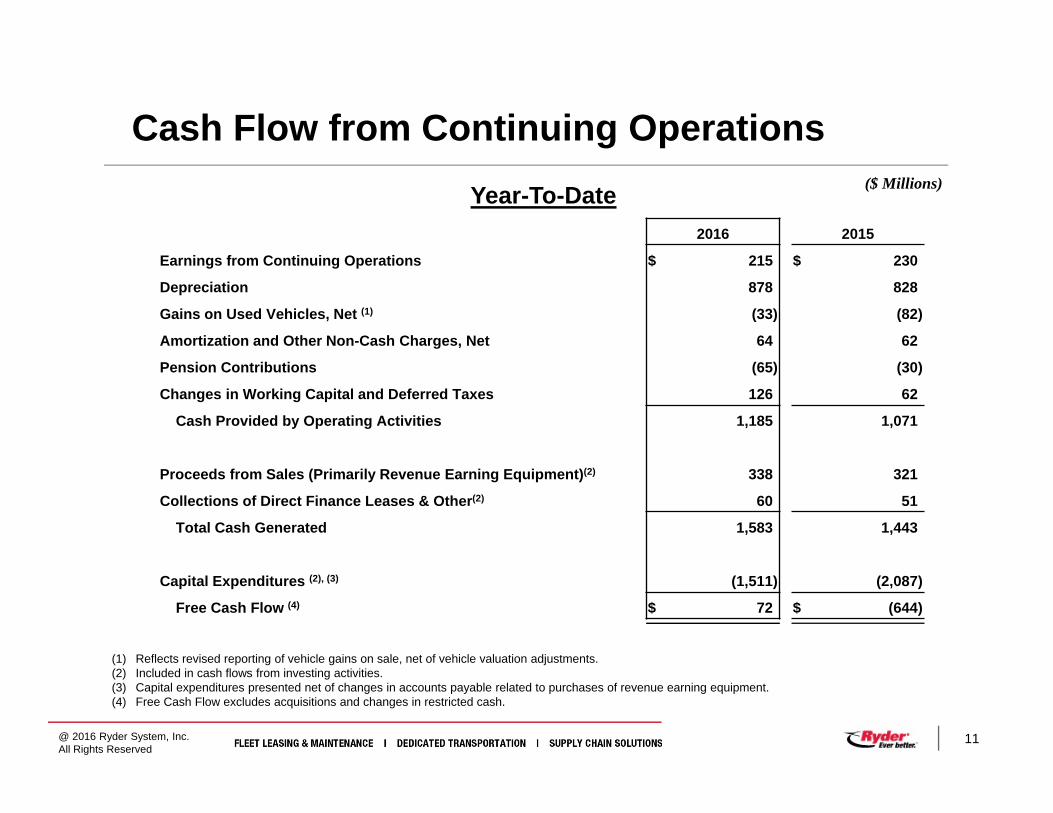
Cash Flow from Continuing OperationsYear-To-Date ($ Millions)
(1) Reflects revised reporting of vehicle gains on sale, net of vehicle valuation adjustments. (2) Included in cash flows from investing activities.(3) Capital expenditures presented net of changes in accounts payable related to purchases of revenue earning equipment.(4) Free Cash Flow excludes acquisitions and changes in restricted cash.
2016 2015
Earnings from Continuing Operations $ 215 $ 230
Depreciation 878 828
Gains on Used Vehicles, Net (1) (33) (82)
Amortization and Other Non-Cash Charges, Net 64 62
Pension Contributions (65) (30)
Changes in Working Capital and Deferred Taxes 126 62
Cash Provided by Operating Activities 1,185 1,071
Proceeds from Sales (Primarily Revenue Earning Equipment)(2) 338 321
Collections of Direct Finance Leases & Other(2) 60 51
Total Cash Generated 1,583 1,443
Capital Expenditures (2), (3) (1,511) (2,087)
Free Cash Flow (4) $ 72 $ (644)

@ 2016 Ryder System, Inc.All Rights Reserved
12
Debt to Equity Ratio
(1) Represents debt to equity target of 225% to 275% while maintaining a solid investment grade rating. (2) Illustrates impact of accumulated net pension related equity charge on leverage.(3) Total Equity includes impact of accumulated net pension related equity charge of $574 million as of 9/30/2016, $577 million as of 12/31/2015 and $576 million as of 9/30/2015.
($ Millions)
9/30/2016 12/31/2015 9/30/2015Total Debt 5,520 5,503 5,434
Total Equity (3) 2,097 1,987 1,952
Debt to Equity 263% 277% 278%
(2)
(1)

@ 2016 Ryder System, Inc.All Rights Reserved
13
Contents
• Third Quarter 2016 Results Overview• Asset Management Update• EPS Forecast• Q & A
@ 2016 Ryder System, Inc.All Rights Reserved
14
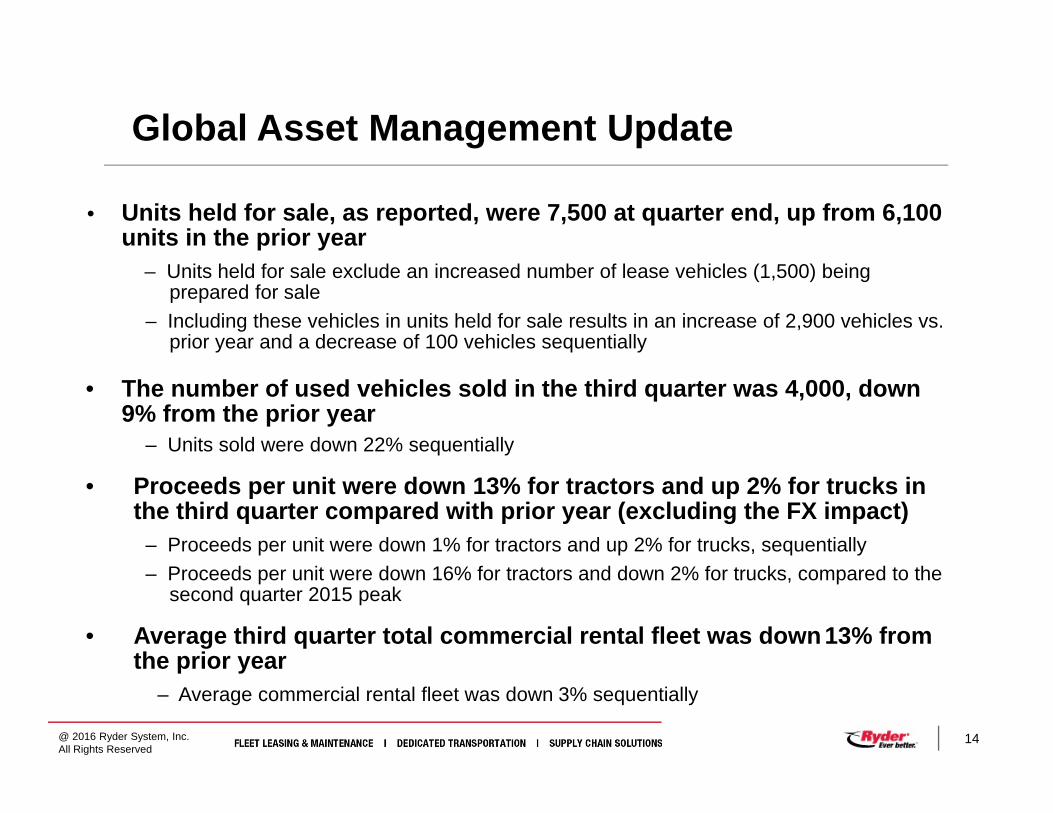
• Units held for sale, as reported, were 7,500 at quarter end, up from 6,100 units in the prior year
– Units held for sale exclude an increased number of lease vehicles (1,500) being prepared for sale
– Including these vehicles in units held for sale results in an increase of 2,900 vehicles vs. prior year and a decrease of 100 vehicles sequentially
• The number of used vehicles sold in the third quarter was 4,000, down9% from the prior year
– Units sold were down 22% sequentially
• Proceeds per unit were down 13% for tractors and up 2% for trucks in the third quarter compared with prior year (excluding the FX impact)
– Proceeds per unit were down 1% for tractors and up 2% for trucks, sequentially– Proceeds per unit were down 16% for tractors and down 2% for trucks, compared to the
second quarter 2015 peak
• Average third quarter total commercial rental fleet was down 13% from the prior year
– Average commercial rental fleet was down 3% sequentially
Global Asset Management Update

@ 2016 Ryder System, Inc.All Rights Reserved
15
Contents
• Third Quarter 2016 Results Overview• Asset Management Update• EPS Forecast• Q & A

@ 2016 Ryder System, Inc.All Rights Reserved
16
EPS Forecast – Continuing Operations ($ Earnings Per Share)
• Full year EPS forecast is reduced to $5.29 - $5.44 from $5.49 - $5.64
• Full year Comparable EPS forecast is reduced to $5.70 - $5.85 from $5.90 - $6.05
• Current forecast is as follows:Fourth Quarter 2016 Full Year 2016
EPS Forecast $1.27 - $1.42 $5.29 - $5.44
Comparable EPS Forecast $1.35 - $1.50 $5.70 - $5.85
Fourth Quarter 2015 Full Year 2015
EPS $1.42 $5.73
Comparable EPS $1.66 $6.13

@ 2016 Ryder System, Inc.All Rights Reserved
17
Q&A

@ 2016 Ryder System, Inc.All Rights Reserved
18
Appendix
Full Service Lease Vehicle Count
Business Segment Detail
Central Support Services
Balance Sheet
Capital Expenditures, Cash Flow and Leverage
Return on Capital Spread
Asset Management
Non-GAAP Financial Measures & Reconciliations

@ 2016 Ryder System, Inc.All Rights Reserved
19
Full Service Lease (FSL) Vehicle Count
(A) 3Q16 includes a higher number of vehicles being prepared for sale (approximately 1,500)
Note: Represents end of period vehicle count.
3Q15 4Q15 1Q16 2Q16 3Q16 (A)3Q16 (A)
O/(U) 3Q15 End of PeriodFSL Vehicles (as reported) 130,600 131,800 133,300 134,300 136,600 6,000UK FSL Trailers 4,300 3,900 3,700 3,400 3,500 (800)
FSL Vehicles - excluding UK 126,300 127,900 129,600 130,900 133,100 6,800
4Q15 O/(U)3Q15
1Q16 O/(U)4Q15
2Q16 O/(U)1Q16
3Q16 (A)
O/(U) 2Q16 Sequential ChangeFSL Vehicles (as reported) 1,200 1,500 1,000 2,300UK FSL Trailers (400) (200) (300) 100
FSL Vehicles - excluding UK 1,600 1,700 1,300 2,200

@ 2016 Ryder System, Inc.All Rights Reserved
20
Business Segments
(1) Our primary measure of segment financial performance excludes unallocated CSS, non-operating pension costs, restructuring and other charges, net and other items.
($ Millions)Third Quarter
Memo: Operating Revenue2016 2015 % B/(W) 2016 2015 % B/(W)
Total Revenue:Fleet Management Solutions $ 1,155.0 $ 1,157.6 —% $ 997.9 $ 988.4 1%Dedicated Transportation Solutions 260.9 226.9 15% 196.6 184.2 7%Supply Chain Solutions 416.9 387.3 8% 345.5 318.8 8%Eliminations (108.4) (102.7) (6)% (71.7) (65.0) (10)%
Total $ 1,724.4 $ 1,669.1 3% $ 1,468.3 $ 1,426.5 3%
Segment Earnings Before Tax: (1)
Fleet Management Solutions $ 112.3 $ 126.4 (11)%Dedicated Transportation Solutions 17.6 13.3 32%Supply Chain Solutions 31.0 26.6 16%Eliminations (12.6) (12.0) (5)%
148.2 154.3 (4)%Central Support Services (Unallocated Share) (9.3) (10.1) 8%Non-operating Pension Costs (7.2) (4.8) (51)%Other Items — 0.4 NMEarnings Before Income Taxes $ 131.7 $ 139.9 (6)%Provision for Income Taxes 46.6 49.1 5%Earnings from Continuing Operations $ 85.1 $ 90.8 (6)%Comparable Earnings from Continuing Operations $ 89.4 $ 93.3 (4)%

@ 2016 Ryder System, Inc.All Rights Reserved
21
Business Segments
(1) Our primary measure of segment financial performance excludes unallocated CSS, non-operating pension costs, restructuring and other charges, net and other items.
($ Millions)Year-To-Date
Memo: Operating Revenue2016 2015 % B/(W) 2016 2015 % B/(W)
Total Revenue:Fleet Management Solutions $ 3,404.5 $ 3,394.1 —% $ 2,955.5 $ 2,846.7 4%Dedicated Transportation Solutions 764.0 663.1 15% 581.2 526.9 10%Supply Chain Solutions 1,207.7 1,155.3 5% 999.4 934.3 7%Eliminations (318.3) (313.3) (2)% (212.1) (188.4) (13)%
Total $ 5,057.8 $ 4,899.2 3% $ 4,324.0 $ 4,119.4 5%
Segment Earnings Before Tax: (1)
Fleet Management Solutions $ 306.4 $ 338.6 (10)%Dedicated Transportation Solutions 48.3 34.7 39%Supply Chain Solutions 79.1 70.0 13%Eliminations (37.1) (35.1) (6)%
396.7 408.1 (3)%Central Support Services (Unallocated Share) (30.2) (32.9) 8%Non-operating Pension Costs (21.7) (14.4) (51)%Other Items (7.7) (3.3) NMEarnings Before Income Taxes $ 337.2 $ 357.5 (6)%Provision for Income Taxes 121.8 127.5 4%Earnings from Continuing Operations $ 215.4 $ 230.1 (6)%Comparable Earnings from Continuing Operations $ 232.8 $ 238.5 (2)%
@ 2016 Ryder System, Inc.All Rights Reserved
22
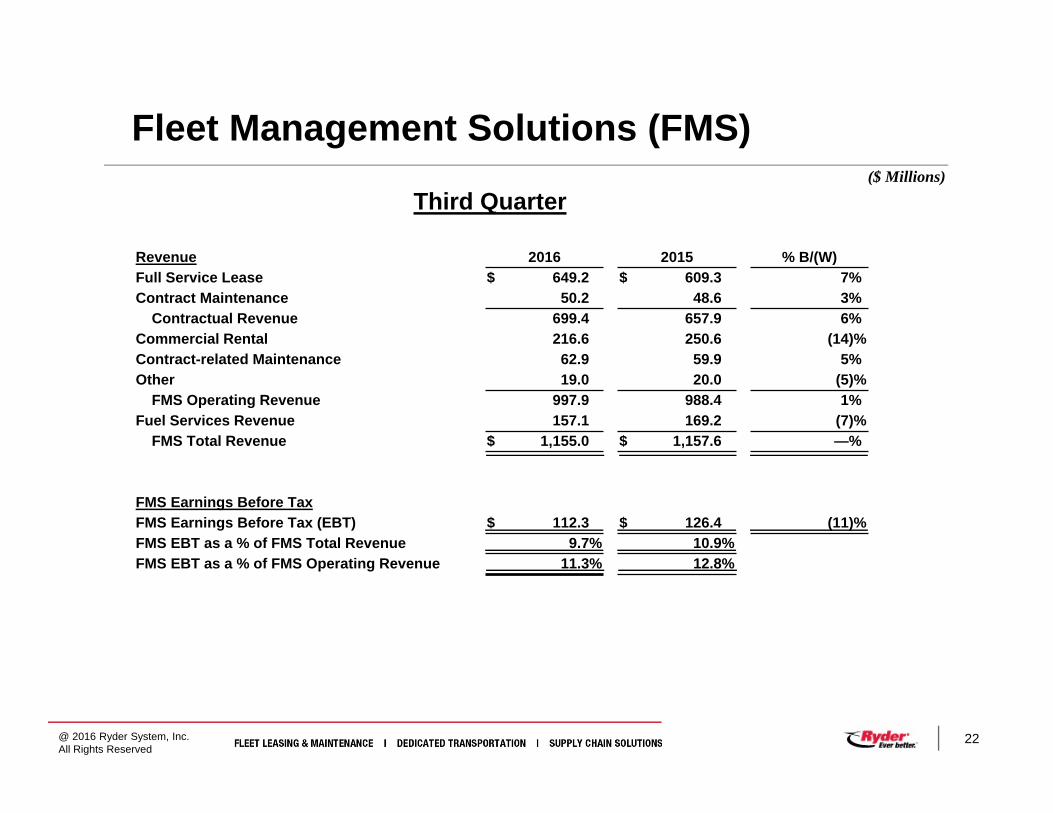
Fleet Management Solutions (FMS)
Third Quarter ($ Millions)
Revenue 2016 2015 % B/(W)Full Service Lease $ 649.2 $ 609.3 7%Contract Maintenance 50.2 48.6 3%
Contractual Revenue 699.4 657.9 6%Commercial Rental 216.6 250.6 (14)%Contract-related Maintenance 62.9 59.9 5%Other 19.0 20.0 (5)%
FMS Operating Revenue 997.9 988.4 1%Fuel Services Revenue 157.1 169.2 (7)%
FMS Total Revenue $ 1,155.0 $ 1,157.6 —%
FMS Earnings Before TaxFMS Earnings Before Tax (EBT) $ 112.3 $ 126.4 (11)%FMS EBT as a % of FMS Total Revenue 9.7% 10.9%FMS EBT as a % of FMS Operating Revenue 11.3% 12.8%

@ 2016 Ryder System, Inc.All Rights Reserved
23
Fleet Management Solutions (FMS)
Year-To-Date ($ Millions)
Revenue 2016 2015 % B/(W)Full Service Lease $ 1,918.4 $ 1,782.1 8%Contract Maintenance 151.5 143.6 6%
Contractual Revenue 2,069.9 1,925.7 7%Commercial Rental 636.0 694.7 (8)%Contract-related Maintenance 189.9 169.6 12%Other 59.7 56.7 5%
FMS Operating Revenue 2,955.5 2,846.7 4%Fuel Services Revenue 449.0 547.4 (18)%
FMS Total Revenue $ 3,404.5 $ 3,394.1 —%
Earnings Before TaxFMS Earnings Before Tax (EBT) $ 306.4 $ 338.6 (10)%FMS EBT as a % of FMS Total Revenue 9.0% 10.0%FMS EBT as a % of FMS Operating Revenue 10.4% 11.9%

@ 2016 Ryder System, Inc.All Rights Reserved
24
Dedicated Transportation Solutions (DTS)($ Millions)
Third Quarter
Revenue 2016 2015 % B/(W)DTS Operating Revenue $ 196.6 $ 184.2 7%Subcontracted Transportation 37.7 13.7 176%Fuel 26.5 29.0 (9)%
DTS Total Revenue $ 260.9 $ 226.9 15%
Earnings Before TaxDTS Earnings Before Tax (EBT) $ 17.6 $ 13.3 32%DTS EBT as a % of DTS Total Revenue 6.7% 5.9%DTS EBT as a % of DTS Operating Revenue 8.9% 7.2%

@ 2016 Ryder System, Inc.All Rights Reserved
25
Dedicated Transportation Solutions (DTS)($ Millions)
Year-To-Date
Revenue 2016 2015 % B/(W)DTS Operating Revenue $ 581.2 $ 526.9 10%Subcontracted Transportation 106.9 42.8 150%Fuel 75.9 93.4 (19)%
DTS Total Revenue $ 764.0 $ 663.1 15%
Earnings Before TaxDTS Earnings Before Tax (EBT) $ 48.3 $ 34.7 39%DTS EBT as a % of DTS Total Revenue 6.3% 5.2%DTS EBT as a % of DTS Operating Revenue 8.3% 6.6%

@ 2016 Ryder System, Inc.All Rights Reserved
26
Supply Chain Solutions (SCS)($ Millions)
Third Quarter
Revenue 2016 2015 % B/(W)Automotive $ 140.8 $ 118.8 19%Technology & Healthcare 61.4 62.5 (2)%CPG & Retail 110.8 109.6 1%Industrial & Other 32.4 28.0 16%
SCS Operating Revenue 345.5 318.8 8%Subcontracted Transportation 56.1 54.0 4%Fuel 15.4 14.6 5%
SCS Total Revenue $ 416.9 $ 387.3 8%
Earnings Before TaxSCS Earnings Before Tax (EBT) $ 31.0 $ 26.6 16%SCS EBT as a % of SCS Total Revenue 7.4% 6.9%SCS EBT as a % of SCS Operating Revenue 9.0% 8.3%

@ 2016 Ryder System, Inc.All Rights Reserved
27
Supply Chain Solutions (SCS)($ Millions)
Year-To-Date
Revenue 2016 2015 % B/(W)Automotive $ 407.1 $ 347.3 17%Technology & Healthcare 177.1 185.8 (5)%CPG & Retail 324.8 323.0 1%Industrial & Other 90.4 78.2 16%
SCS Operating Revenue 999.4 934.3 7%Subcontracted Transportation 162.7 172.0 (5)%Fuel 45.5 49.1 (7)%
SCS Total Revenue $ 1,207.7 $ 1,155.3 5%
Earnings Before TaxSCS Earnings Before Tax (EBT) $ 79.1 $ 70.0 13%SCS EBT as a % of SCS Total Revenue 6.6% 6.1%SCS EBT as a % of SCS Operating Revenue 7.9% 7.5%

@ 2016 Ryder System, Inc.All Rights Reserved
28
Central Support Services (CSS)
Third Quarter ($ Millions)
2016 2015 % B/(W)
Allocated CSS Costs $ 47.9 $ 53.8 11%Unallocated CSS Costs 9.3 10.1 8%Total CSS Costs $ 57.3 $ 63.9 10%

@ 2016 Ryder System, Inc.All Rights Reserved
29
Central Support Services (CSS)
Year-To-Date ($ Millions)
2016 2015 % B/(W)
Allocated CSS Costs $ 146.4 $ 157.2 7%
Unallocated CSS Costs 30.2 32.9 8%
Total CSS Costs $ 176.6 $ 190.2 7%

@ 2016 Ryder System, Inc.All Rights Reserved
30
Balance Sheet($ Millions)
September 30, 2016 December 31, 2015Current Assets $ 1,138 $ 1,098Revenue Earning Equipment, Net 8,275 8,185Operating Property and Equipment, Net 740 715Other Assets 956 955
Total Assets $ 11,109 $ 10,953
Current Liabilities $ 975 $ 1,046Total Debt 5,520 5,503Other Non-Current Liabilities (including Deferred Income Taxes) 2,517 2,417Shareholders' Equity 2,097 1,987
Total Liabilities and Shareholders' Equity $ 11,109 $ 10,953

@ 2016 Ryder System, Inc.All Rights Reserved
31
Capital Expenditures, Cash Flow and Leverage (1)
Gross Capital Expenditures ($ Millions)
Debt to Equity / Total Obligations to Equity (2)
(1) Free Cash Flow and Gross Capital Expenditures exclude acquisitions. Total Obligations to Equity includes acquisitions. (2) The debt to equity metric was not revised in years prior to 2012 to reflect the change in accounting treatment of certain sale-leaseback transactions as debt.(3) Illustrates impact of accumulated net pension related equity charge on leverage.(4) Represents debt to equity target of 225% to 275% while maintaining solid investment grade credit rating.
Free Cash Flow 341 614 258 (257) (488) (340) (315) (728) 200
Debt to Equity 213% 175% 196% 257% 272% 227% 260% 277% 265%
Pension Impact (3)
Lease Commercial Rental PP&E/Other
(4)

@ 2016 Ryder System, Inc.All Rights Reserved
32
Adjusted Return on Capital Spread
(1) Adjusted Total Capital represents Adjusted Average Total Capital in billions.
(2) Includes pension settlement charges of $69M, primarily buyouts, which impacted Return on Equity by 360 basis points.
Adj ROC O/(U) COC 1.2% 0.8% 0.8% (2.2)% (1.3)% 0.2% 0.9% 1.0% 1.1% 1.4% 0.9%
Return on Equity 15.5% 14.2% 11.2% 4.4% 8.4% 11.9% 14.9% 14.9% 11.3% 16.1% 14.2%
Adjusted Total Capital (1) $4.2 $4.8 $4.8 $4.2 $4.0 $4.6 $5.2 $5.6 $6.6 $7.1 $7.6(2)
Adjusted Return on Capital (ROC)
Cost of Capital (COC)

@ 2016 Ryder System, Inc.All Rights Reserved
33
Asset Management YTD Update (US Only)
(a) Current year statistics may exclude some units due to a lag in reporting(b) Excludes early terminations where customer purchases vehicle
(a)(b)
Redeployments – Vehicles coming off-lease or in Rental with useful life remaining are redeployed in the Ryder fleet (SCS, or with another Lease customer). Redeployments exclude units transferred into the Rental product line.
Extensions – Ryder re-prices lease contract and extends maturity date.
Early terminations – Customer elects to terminate lease prior to maturity. Depending on the remaining useful life, the vehicle may be redeployed in the Ryder fleet (Commercial Rental, SCS, other Lease customer) or sold by Ryder.

@ 2016 Ryder System, Inc.All Rights Reserved
34
Non-GAAP Financial Measures This presentation includes “non-GAAP financial measures” as defined by SEC rules. As required by SEC rules, we provide a reconciliation of each non-GAAP financial measure to the most comparable GAAP measure. Non-GAAP financial measures should be considered in addition to, but not as a substitute for or superior to, other measures of financial performance prepared in accordance with GAAP.
Specifically, the following non-GAAP financial measures are included in this presentation:
Non-GAAP Financial Measure Comparable GAAP MeasureReconciliation & Additional Information
Presented on Slide Titled PageOperating Revenue Measures:
Operating Revenue Total Revenue Key Financial Statistics 5-6
FMS Operating Revenue, DTS Operating Revenue and SCS Operating Revenue
FMS Total Revenue, DTS Total Revenue and SCS Total Revenue
Fleet Management Solutions (FMS), Dedicated Transportation Solutions (DTS) and Supply Chain Solutions (SCS)
22-27
Operating Revenue Growth ex-Foreign Exchange Total Revenue Foreign Exchange Impact on Operating Revenue Growth
35
FMS EBT as a % of FMS Operating Revenue, DTS EBT as a % of DTS Operating Revenue and SCS EBT as a % of SCS Operating Revenue
FMS EBT as a % of FMS Total Revenue, DTS EBT as a % of DTS Total Revenue and SCS EBT as a % of SCS Total Revenue
Fleet Management Solutions (FMS), Dedicated Transportation Solutions (DTS) and Supply Chain Solutions (SCS)
22-27
Comparable Earnings Measures:
Comparable Earnings and Comparable EPS Earnings and EPS from Continuing Operations Earnings and EPS from Continuing Operations Reconciliation
36
Comparable EPS Forecast EPS Forecast from Continuing Operations EPS Forecast – Continuing Operations 37
Comparable Earnings Before Income Tax and Comparable Tax Rate
Earnings Before Income Tax and Tax Rate Earnings and Tax Rate from Continuing Operations Reconciliation
38
Adjusted Return on Capital (ROC) and Adjusted ROC Spread
Not Applicable. However, non-GAAP elements of the calculation have been reconciled to the corresponding GAAP measures. A numerical reconciliation of net earnings to adjusted net earnings and average total debt and average shareholders' equity to adjusted average total capital is provided.
Adjusted Return on Capital Reconciliation 39-40
Cash Flow Measures:
Total Cash Generated and Free Cash Flow Cash Provided by Operating Activities Cash Flow from Continuing Operations 41-42
Debt Measures:
Total Obligations and Total Obligations to Equity Balance Sheet Debt and Debt to Equity Debt to Equity Reconciliation 43
@ 2016 Ryder System, Inc.All Rights Reserved
35
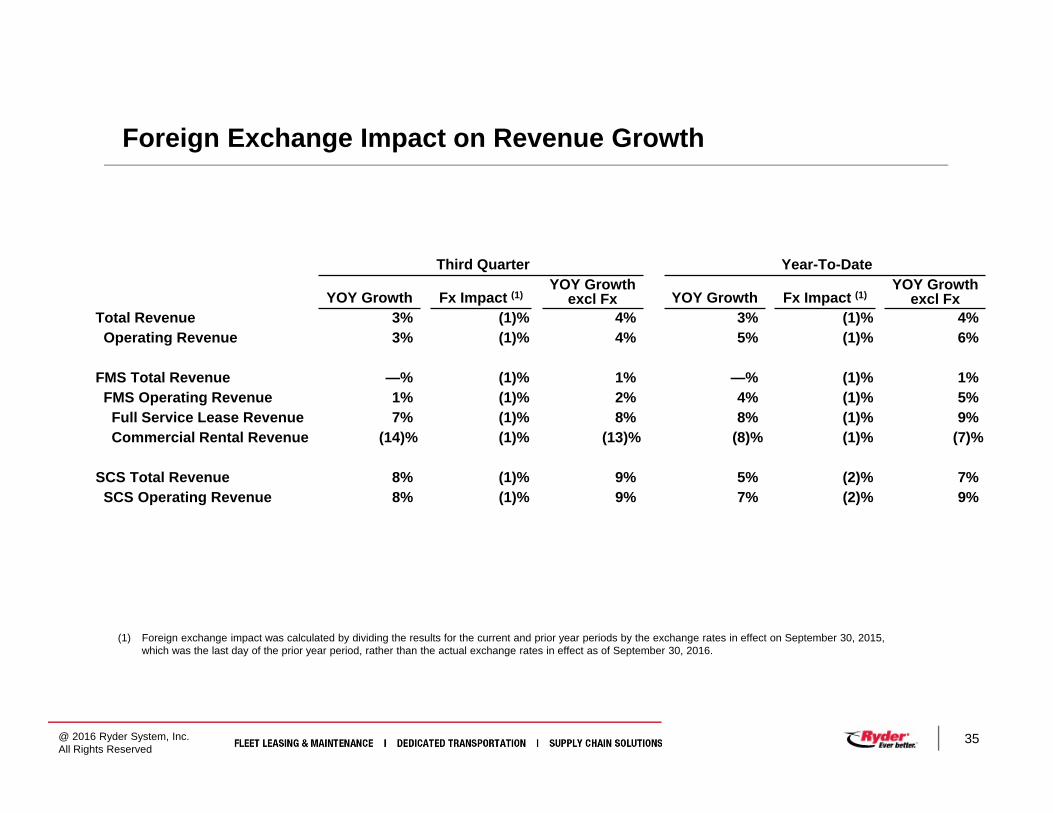
Foreign Exchange Impact on Revenue Growth
(1) Foreign exchange impact was calculated by dividing the results for the current and prior year periods by the exchange rates in effect on September 30, 2015, which was the last day of the prior year period, rather than the actual exchange rates in effect as of September 30, 2016.
Third Quarter Year-To-Date
YOY Growth Fx Impact (1)YOY Growth
excl Fx YOY Growth Fx Impact (1)YOY Growth
excl FxTotal Revenue 3% (1)% 4% 3% (1)% 4%Operating Revenue 3% (1)% 4% 5% (1)% 6%
FMS Total Revenue —% (1)% 1% —% (1)% 1%FMS Operating Revenue 1% (1)% 2% 4% (1)% 5%Full Service Lease Revenue 7% (1)% 8% 8% (1)% 9%Commercial Rental Revenue (14)% (1)% (13)% (8)% (1)% (7)%
SCS Total Revenue 8% (1)% 9% 5% (2)% 7%SCS Operating Revenue 8% (1)% 9% 7% (2)% 9%

@ 2016 Ryder System, Inc.All Rights Reserved
36
Earnings and EPS from Continuing Operations Reconciliation (1)
($ Millions or $ Earnings Per Share)
3Q16 3Q16 3Q15 3Q15Earnings EPS Earnings EPS
GAAP $ 85.1 $ 1.59 $ 90.8 $ 1.70Non-operating pension costs 4.2 0.08 2.7 0.05Pension-related adjustments — — (0.3) (0.01)Comparable $ 89.4 $ 1.67 $ 93.3 $ 1.74
YTD16 YTD16 YTD15 YTD15Earnings EPS Earnings EPS
GAAP $ 215.4 $ 4.02 $ 230.1 $ 4.31Non-operating pension costs 12.7 0.24 8.2 0.15Pension-related adjustments 4.8 0.09 (0.3) (0.01)Professional fees — — 2.4 0.04Tax law change — — (1.9) (0.03)Comparable $ 232.8 $ 4.35 $ 238.5 $ 4.47
(1) The reconciliation of the EBT and Tax Rate for these items are included on slide 38.
@ 2016 Ryder System, Inc.All Rights Reserved
37
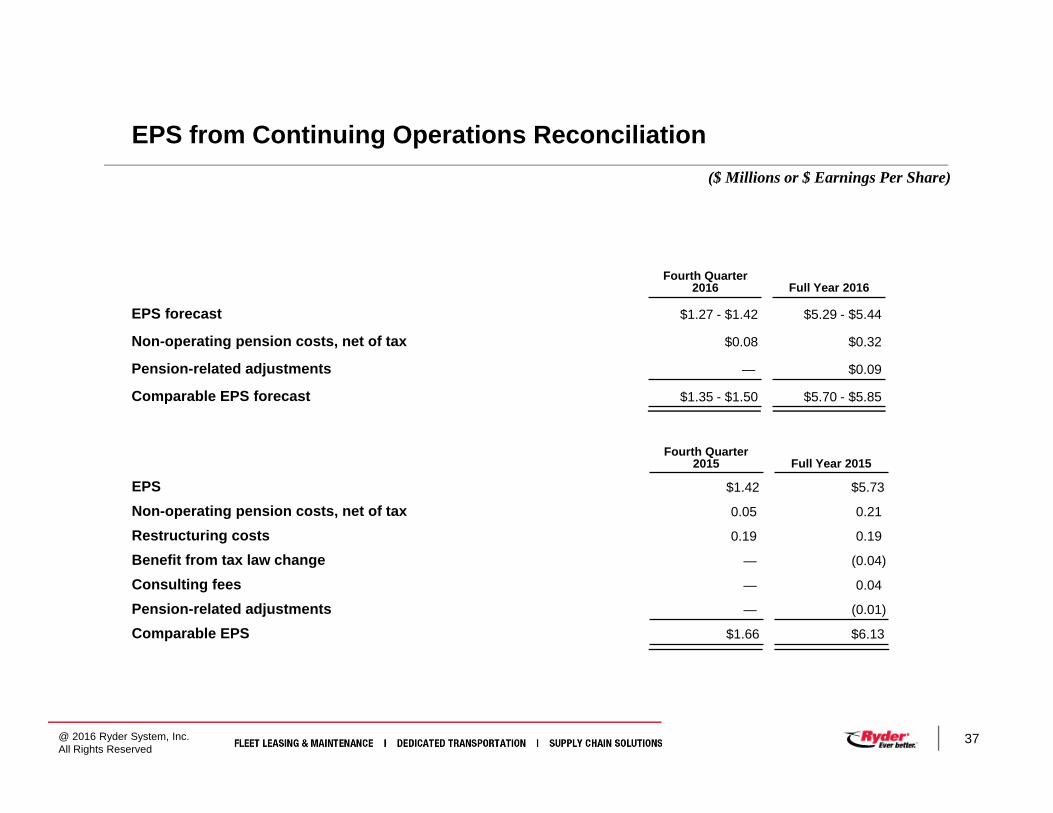
EPS from Continuing Operations Reconciliation($ Millions or $ Earnings Per Share)
Fourth Quarter 2016 Full Year 2016
EPS forecast $1.27 - $1.42 $5.29 - $5.44
Non-operating pension costs, net of tax $0.08 $0.32
Pension-related adjustments — $0.09
Comparable EPS forecast $1.35 - $1.50 $5.70 - $5.85
Fourth Quarter 2015 Full Year 2015
EPS $1.42 $5.73
Non-operating pension costs, net of tax 0.05 0.21
Restructuring costs 0.19 0.19
Benefit from tax law change — (0.04)
Consulting fees — 0.04
Pension-related adjustments — (0.01)
Comparable EPS $1.66 $6.13

@ 2016 Ryder System, Inc.All Rights Reserved
38
EBT and Tax Rate from Continuing Operations Reconciliation($ Millions or $ Earnings Per Share)
3Q16 3Q16 3Q16 YTD16 YTD16 YTD16EBT Tax Tax Rate EBT Tax Tax Rate
GAAP $ 131.7 $ 46.6 35.4% $ 337.2 $ 121.8 36.1%Non-operating pension costs 7.2 3.0 21.7 9.0Pension-related adjustments — — 7.7 2.8Comparable (1) $ 138.9 $ 49.6 35.7% $ 366.5 $ 133.7 36.5%
3Q15 3Q15 3Q15 YTD15 YTD15 YTD15EBT Tax Tax Rate EBT Tax Tax Rate
GAAP $ 139.9 $ 49.1 35.1% $ 357.5 $ 127.5 35.7%Non-operating pension costs 4.8 2.1 14.4 6.2Pension-related adjustments (0.5) (0.2) (0.5) (0.2)Professional fees 0.1 — 3.8 1.4Tax law change — — — 1.9Comparable (1) $ 144.2 $ 51.0 35.3% $ 375.2 $ 136.7 36.4%
(1) The comparable provision for income taxes is computed using the same methodology as the GAAP provision for income taxes. Income tax effects of non-GAAP adjustments are calculated based on the statutory tax rates of the jurisdiction to which the non-GAAP adjustments relate.

@ 2016 Ryder System, Inc.All Rights Reserved
39
Adjusted Return on Capital Reconciliation(1)
($ Millions)
(1) Non-GAAP elements of this calculation have been reconciled to the corresponding GAAP measures. A numerical reconciliation of net earnings to adjusted net earnings and average total debt and average shareholders' equity to adjusted average total capital is provided on this slide.
(2) Earnings calculated based on a 12-month rolling period.(3) Interest expense includes interest on off-balance sheet vehicle obligations.(4) Income taxes were calculated by excluding taxes related to comparable earnings items and interest expense.(5) The average is calculated based on the average GAAP balances.(6) Represents comparable earnings items for those periods.
2006 2007 2008 2009 2010 2011Net earnings (2) $ 249 $ 254 $ 200 $ 62 $ 118 $ 170Restructuring and other charges, net and other items - 1 70 30 6 6Income taxes 144 152 150 54 61 108Adjusted earnings before income taxes 393 407 420 146 185 284Adjusted interest expense (3) 149 169 165 150 133 135Adjusted income taxes (4) (207) (220) (230) (122) (124) (157)Adjusted net earnings [A] $ 332 $ 356 $ 355 $ 174 $ 194 $ 262
Average total debt(5) $ 2,480 $ 2,848 $ 2,882 $ 2,692 $ 2,512 $ 3,079Average off-balance sheet debt(5) 99 150 171 142 114 78Average total shareholders' equity(5) 1,610 1,791 1,778 1,396 1,402 1,428Average adjustments to shareholders' equity (6) (5) 1 10 16 2 4Adjusted average total capital [B] $ 4,184 $ 4,789 $ 4,841 $ 4,245 $ 4,030 $ 4,588
Adjusted return on capital [A]/[B] 7.9% 7.4% 7.3% 4.1% 4.8% 5.7%
Weighted average cost of capital 6.7% 6.6% 6.5% 6.3% 6.1% 5.5%Adjusted return on capital spread 1.2% 0.8% 0.8% (2.2)% (1.3)% 0.2%

@ 2016 Ryder System, Inc.All Rights Reserved
40
Adjusted Return on Capital Reconciliation(1)
($ Millions)
(1) Non-GAAP elements of this calculation have been reconciled to the corresponding GAAP measures. A numerical reconciliation of net earnings to adjusted net earnings and average total debt and average shareholders' equity to adjusted average total capital is provided on this slide.
(2) Earnings calculated based on a 12-month rolling period.(3) Interest expense includes interest on off-balance sheet vehicle obligations.(4) Income taxes were calculated by excluding taxes related to comparable earnings items and interest expense.(5) The average is calculated based on the average GAAP balances.(6) Represents comparable earnings items for those periods.
2012 2013 2014 2015 3Q15 3Q162016
ForecastNet earnings (2) $ 210 $ 238 $ 218 $ 305 $ 240 $ 291 $ 292Restructuring and other charges, net and other
items 17 - 115 18 116 22 8Income taxes 91 126 118 164 130 158 163Adjusted earnings before income taxes 317 363 451 486 486 471 463Adjusted interest expense (3) 144 141 145 151 152 148 149Adjusted income taxes (4) (167) (177) (214) (224) (229) (217) (220)Adjusted net earnings [A] $ 294 $ 327 $ 383 $ 413 $ 409 $ 402 $ 392
Average total debt(5) $ 3,778 $ 4,015 $ 4,653 $ 5,177 $ 4,989 $ 5,559 $ 5,551Average off-balance sheet debt(5) 2 1 2 1 2 2 1Average total shareholders' equity(5) 1,406 1,594 1,926 1,895 1,878 2,026 2,054Average adjustments to shareholders' equity (6) (3) (2) 8 11 18 3 1Adjusted average total capital [B] $ 5,182 $ 5,608 $ 6,589 $ 7,084 $ 6,886 $ 7,589 $ 7,607
Adjusted return on capital [A]/[B] 5.7% 5.8% 5.8% 5.8% 5.9% 5.3% 5.2%
Weighted average cost of capital 4.8% 4.8% 4.7% 4.4% 4.5% 4.3% 4.3%Adjusted return on capital spread 0.9% 1.0% 1.1% 1.4% 1.4% 1.0% 0.9%
@ 2016 Ryder System, Inc.All Rights Reserved
41
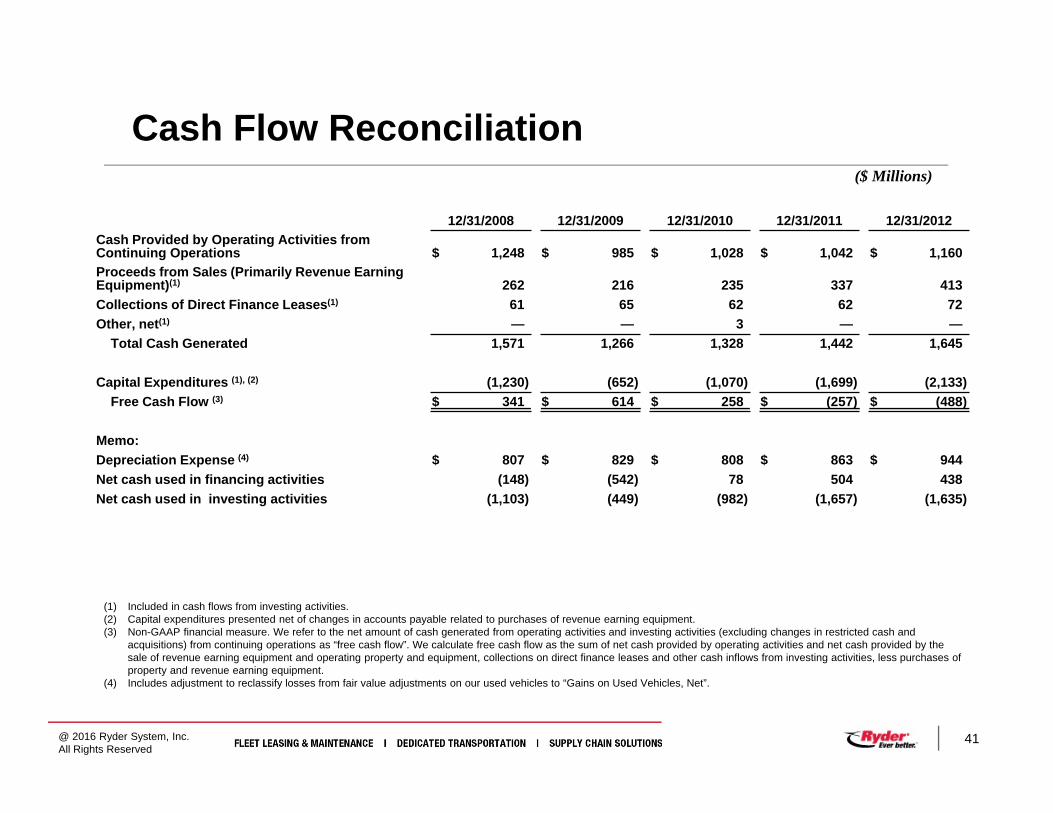
Cash Flow Reconciliation
(1) Included in cash flows from investing activities.(2) Capital expenditures presented net of changes in accounts payable related to purchases of revenue earning equipment.(3) Non-GAAP financial measure. We refer to the net amount of cash generated from operating activities and investing activities (excluding changes in restricted cash and
acquisitions) from continuing operations as “free cash flow”. We calculate free cash flow as the sum of net cash provided by operating activities and net cash provided by the sale of revenue earning equipment and operating property and equipment, collections on direct finance leases and other cash inflows from investing activities, less purchases of property and revenue earning equipment.
(4) Includes adjustment to reclassify losses from fair value adjustments on our used vehicles to “Gains on Used Vehicles, Net”.
($ Millions)
12/31/2008 12/31/2009 12/31/2010 12/31/2011 12/31/2012Cash Provided by Operating Activities from Continuing Operations $ 1,248 $ 985 $ 1,028 $ 1,042 $ 1,160Proceeds from Sales (Primarily Revenue Earning Equipment)(1) 262 216 235 337 413Collections of Direct Finance Leases(1) 61 65 62 62 72Other, net(1) — — 3 — —
Total Cash Generated 1,571 1,266 1,328 1,442 1,645
Capital Expenditures (1), (2) (1,230) (652) (1,070) (1,699) (2,133)Free Cash Flow (3) $ 341 $ 614 $ 258 $ (257) $ (488)
Memo:Depreciation Expense (4) $ 807 $ 829 $ 808 $ 863 $ 944Net cash used in financing activities (148) (542) 78 504 438Net cash used in investing activities (1,103) (449) (982) (1,657) (1,635)

@ 2016 Ryder System, Inc.All Rights Reserved
42
Cash Flow Reconciliation($ Millions)
(1) Included in cash flows from investing activities.(2) Capital expenditures presented net of changes in accounts payable related to purchases of revenue earning equipment.(3) Non-GAAP financial measure. We refer to the net amount of cash generated from operating activities and investing activities (excluding changes in restricted cash and
acquisitions) from continuing operations as “free cash flow”. We calculate free cash flow as the sum of net cash provided by operating activities and net cash provided by the sale of revenue earning equipment and operating property and equipment, collections on direct finance leases and other cash inflows from investing activities, less purchases of property and revenue earning equipment.
(4) Includes adjustment to reclassify losses from fair value adjustments on our used vehicles to “Gains on Used Vehicles, Net”.
12/31/2013 12/31/2014 12/31/2015 9/30/2015 9/30/20162016
ForecastCash Provided by Operating Activities from
Continuing Operations $ 1,252 $ 1,383 $ 1,442 $ 1,071 $ 1,185 $ 1,613Proceeds from Sales (Primarily Revenue Earning
Equipment)(1) 452 497 427 321 338 417Collections of Direct Finance Leases (1) 71 66 71 51 60 77Other, net (1) 8 (1) — — — 4
Total Cash Generated 1,783 1,944 1,940 1,443 1,583 2,111
Capital Expenditures (1), (2) (2,123) (2,259) (2,668) (2,087) (1,511) (1,911)Free Cash Flow (3) $ (340) $ (315) $ (728) $ (644) $ 72 $ 200
Memo:Depreciation Expense (4) $ 967 $ 1,047 $ 1,040 $ 828 $ 878 1,191Net cash provided by (used in) financing activities 347 312 731 665 (55) (179)Net cash used in investing activities (1,604) (1,705) (2,161) (1,707) (1,109) $ (1,408)

@ 2016 Ryder System, Inc.All Rights Reserved
43
Debt to Equity Reconciliation(1)
Note: Amounts may not recalculate due to rounding.
($ Millions)
(1) The debt to equity metric was not revised in years prior to 2012 to reflect the change in accounting treatment of certain sale-leaseback transactions as debt.(2) For years beginning in 2012, sale-leaseback transactions that were previously accounted for as off-balance sheet are now included in GAAP balance sheet
debt. The Company does not reconcile total obligations to equity for these years as this metric is the same as the debt to equity metric.
12/31/2008% to
Equity 12/31/2009% to
Equity 12/31/2010% to
Equity 12/31/2011% to
Equity
Debt $ 2,863 213% $ 2,498 175% $ 2,747 196% $ 3,382 257%
PV of minimum lease payments and guaranteed residual values under operating leases for vehicles 163 119 100 64
Total Obligations (2) $ 3,026 225% $ 2,617 183% $ 2,847 230% $ 3,446 261%

@ 2016 Ryder System, Inc.All Rights Reserved
44