3q 2015 results - amazon web services · highlights over past 18 months rick muncrief becomes ceo...
TRANSCRIPT

3Q 2015 Results Rick Muncrief, President and CEO
November 5, 2015

WPX in Transition
2 WPX Energy | 3Q'15 Earnings Call | November 5, 2015

Highlights Over Past 18 Months
Rick Muncrief becomes CEO
May, 2014
WPX completes sale of working interest
to Legacy LP June, 2014
Infill project added ~200 gross locations in
Williston August, 2014
Completed sale of NE Pennsylvania
assets February, 2015
Announced consolidation of Denver office to Tulsa
March2015
Completed sale of Northeast Supply Link
May, 2015
Completed exit of international assets
January, 2015
Completed acquisition of RKI
August, 2015
2014 2015 2016
Added partner to accelerate development of Trail Ridge Properties
August, 2014
Outlined multi-year strategy October, 2014
Named Clay Gaspar SVP of Operations and Development
October, 2014
Gallup oil play hits 100,000 net acres
June, 2015
Named Kevin Vann as CFO
July, 2014
Adds 26K acres in Gallup oil play
August, 2014
Renegotiated $1.75B unsecured revolver
July, 2015
Processes underway to
achieve 2015/2016 divestiture target
NOTE: Transactions totaling over $4 Billion. Acquisitions Asset sales
Announced sale of Van Hook Gathering System
August, 2015
Completed Powder River Basin Sale
September, 2015
3 WPX Energy | 3Q'15 Earnings Call | November 5, 2015

Foundation for Exceptional Growth in Place
WPX Energy | 3Q'15 Earnings Call | November 5, 2015 4
QUALITY
► Core Permian
► Core Williston
► Core San Juan
QUANTITY
► 4,600+ oil locations1
► Multi-decade inventory
► Significant upside to location count
► Large gas option of inventory
FLEXIBILITY
► Strong liquidity
► Capital flexibility
► Asset sales underway
► Strong hedge position
FOCUS
► Embracing rapid change
► Operational excellence
► Delevering
► Value creation
1 Gross locations

Financial Results Kevin Vann, Chief Financial Officer

3rd Quarter and YTD Results
Dollars in millions, except production numbers
3Q YTD
2015 2014 2015 2014
Daily Production
Gas (MMcf/d) 665 746 681 777
Oil (Mbbl/d) 35.2 25.8 34.2 23.0
NGLs (Mbbl/d) 21.3 17.1 19.3 17.5
Equivalent (Mboe/d) 167.3 167.2 167.0 170.0
Adjusted EBITDAX 240 199 714 729
Adjusted Net Income from Continuing Operations (42) (15) (45) 17
Capital Activity 205 629 640 1,389
Note: Adjusted EBITDAX and adjusted net income are non-GAAP measures. A reconciliation to relevant measures included in GAAP is provided in this presentation.
6 WPX Energy | 3Q'15 Earnings Call | November 5, 2015

Production Prior Guidance Current Guidance
Natural Gas MMcf/d 660 - 675 665 - 680
Oil Mbbl/d 35.0 - 36.5 35.0 - 36.5
NGL Mbbl/d2 18.0 – 19.0 19.5– 22.5
Total Mboe/d 163 - 168 165 - 172
Expenses Prior Guidance Current Guidance
$ per Boe
LOE $3.75 - $4.25 $3.50 - $4.00
GP&T 4.50 - 5.00 4.50 - 5.00
Production Tax 1.25 - 1.75 1.00 - 1.50
Cash Operating Expense $9.50 - $11.00 $9.00 - $10.50
DD&A 14.00 - 14.75 15.00 – 15.75
$ in Millions
G&A7 $230 - $240 $230 - $240
Exploration 20 - 40 20 - 40
Interest Expense8 170- 175 170- 175
Equity (Earnings) Loss 0 - (5) 0 - (5) Avg. Price Differentials5 Prior Guidance Current Guidance
NYMEX – Nat. Gas (Mcf) ($0.40) - ($0.60) ($0.40) - ($0.60)
Oil – WTI per barrel ($8.00) - ($10.00) ($8.00) - ($10.00)
2015 Full-Year Guidance1
Tax Rate Prior Guidance Current Guidance
Tax Provision 33% - 37% 33% - 37%
Net Realized Price6 Prior Guidance Current Guidance
NGL – % of WTI 30% - 35% 25% - 30%
Cap Ex ($ in Millions) Prior Guidance Current Guidance
Delaware $100 - $120 $100 - $120
Williston 285 - 305 285 - 305
San Juan 290 - 310 290 - 310
Piceance 150 - 165 150 - 165
Other3 0 - 25 0 - 25
Total4 $825 - $925 $825 - $925
1 Reflects August 17th close date of RKI
2 NGL guidance assumes only 15% ethane recovery. 3 Other includes expenditures for Other Basins, Land, Exploration and Corporate. 4 Excludes any acquisition capital. 5 Average price differentials ranges for oil and natural gas exclude hedges, but include basis differential and revenue adjustments, such as fuel. 6 Percentage of realized price ranges for NGLs excludes hedges, but includes basis differential and revenue adjustments. 7 Excludes severance and relocation costs and includes stock compensation expenses of $30 - $40MM. 8 Excludes one-time cost of $16.4MM associated with acquisition of RKI
7 WPX Energy | 3Q'15 Earnings Call | November 5, 2015

WPX Hedges
8 WPX Energy | 3Q'15 Earnings Call | November 5, 2015
Oct - Dec 2015 2016 2017
Volume/Day Average Price Volume/Day Average Price Volume/Day Average Price
Natural Gas (MMBtu)
Fixed Price Swaps¹ 435,107 $4.06 412,132 $3.63 92,500 $3.22
Costless Collars 50,000 $4.00 - $4.50 - - - -
Fixed Price Calls - - - - 16,301 $4.50
Natural Gas Basis (MMBtu)
MidCon Basis Swaps 20,000 ($0.18) 5,000 ($0.23) - -
Rockies Basis Swaps 280,000 ($0.17) 162,500 ($0.22) 42,500 ($0.21)
San Juan Basis Swaps 107,500 ($0.11) 72,500 ($0.19) 17,500 ($0.16)
SoCal Basis Swaps 50,000 $0.08 30,000 ($0.02) 10,000 $0.00
Permian Basis Swaps - - 25,000 ($0.18) - -
Crude Oil (bbl)
Fixed Price Swaps¹ 30,146 $85.63 27,549 $61.70 9,304 $61.66
Crude Oil Basis (bbl)
Midland Basis Swaps 5,000 $0.30 5,000 ($0.45) - -
1 In connection with several natural gas and crude oil swaps, we entered into swaptions with the swap counterparties granting the counterparty the right, but not the obligation, to enter into an underlying swap with us in the future. Natural gas swaptions for 2016 total 90,000 MMBtu/d at a weighted average strike price of $4.23. Crude oil swaptions for 2016 total 11,000 bbl/d; 5,750 bbl/d at a weighted average strike price of $60.05 and 5,250 bbl/d at a weighted average strike price of $97.55. Natural gas swaptions for 2017 total 65,000 MMBtu/d at a weighted average strike price of $4.19. Crude oil swaptions for 2017 total 1,500 bbl/d at a weighted average strike price of $59.00.
Updated: November 3, 2015

Operational Results Clay Gaspar, Chief Operating Officer

Permian: Deep Inventory of High-Return Locations
10 WPX Energy | 3Q'15 Earnings Call | November 5, 2015
Improving efficiencies
► 1st three rotary steerable wells reduced spud to TD by average of 9 days
► Average days to TD reduced 25%1
► High-graded rig fleet and reduced day rates ~8%
~$2 per barrel improvement in oil differentials1
► Reduced transportation costs will continue to improve differentials
Acquired existing 3D seismic in state line
► 150+ square miles
► Allows for structural analysis
► Targeted landing and geo-steering
Vertical Delaware Sand competes within basin
Strong results using 1,500 lb/ft completes in the Wolfcamp A
Asset continues to exceed initial expectations
150+ square miles of 3D seismic in State Line
1 3Q’15 vs. 2Q’15

Permian: Initial Results Above Acquisition Type Curve
11 WPX Energy | 3Q'15 Earnings Call | November 5, 2015
Note: Includes all wells (7) with 1,500 lb/ft completions with 30 days or more of production. Type curve assumes 30 days of cleanout, EUR of 670 Mboe and 1,000 lbs/ft completions
Acquisition Type Curve - 670 Mboe
Normalized Wolfcamp A Production (76% above type curve after 251 days)
0
50,000
100,000
150,000
200,000
250,000
0 50 100 150 200 250
Cu
mu
lati
ve, M
bo
e
Days of Production (Post Cleanout)
250
200
150
100
50
0

Permian: Strong Well Results Validate Core Position 9
,00
0’
WOLFCAMP B
WOLFCAMP C
WOLFCAMP D
CHERRY CANYON
BRUSHY CANYON
AVALON
FIRST BONE SPRING
SECOND BONE SPRING
BELL CANYON
THIRD BONE SPRING
WOLFCAMP A
Hydrocarbon Pay Indication
12 WPX Energy | 3Q'15 Earnings Call | November 5, 2015
EOG STATE PATHFINDER 2H IP(30): 1,210 bopd Bone Spring 1st
EOG STATE MERCURY 1H IP(30): 1,490 bopd Avalon Upper
EOG EXCELSIOR 12 3H IP(30): 954 bopd Avalon Upper
WPX COVINGTON 46 3H Max Day: 1,156 Boepd Wolfcamp A
BHP OLYPHANT 57-T1-43X42 1H 1st 3 mo. Cum: 144,751 Boe Wolfcamp A
EOG VOYAGER 15 3H IP(30): 1,895 bopd Wolfcamp A
BHP HILL AND MEEKER 56-T2-22 2H IP(30): 1,102 bopd Wolfcamp A
BHP STATE TUNSTILL 56-T2-10 1H
IP(30): 1,241 bopd Wolfcamp A
Anadarko BOHLANDER 33-95 1H IP(30): 1,071 bopd Wolfcamp B
EOG STATE PATHFINDER 4H IP(30): 1,563 bopd Bone Spring 2nd
EOG STATE PATHFINDER 5H IP(30): 1,621 bopd Bone Spring 2nd
EOG STATE MAGELLAN 7H IP(30): 1,892 bopd Bone Spring 2nd
EOG STATE MERCURY 11H IP(30): 2,018 bopd Bone Spring 2nd
EOG STATE MAGELLAN 2H IP(30): 1,802 bopd Bone Spring 2nd
WPX ACREAGE
WPX BUNIN 4-2H (3,618’ lat.) IP(30): 1,176 Boepd Wolfcamp A
WPX PECOS STATE46-1H(3,624’ lat)
IP(30): 1,269 Boepd Avalon
WPX Lindsay 10-8H IP(30): 1,294 Boepd Wolfcamp A
WPX Lindsay 10-1H (4,386’ lat.)
IP(30): 1,035 Boepd Avalon Lower
WPX CBR 44-2H (4,120’ lat.) IP(30): 1,188 Boepd Wolfcamp A
WPX CBR 3 Well Pad CBR 32-4H Max Day: 1,136 Boepd CBR 32-5H Max Day: 1.354 Boepd CBR 32-7H Max Day: 1,294 Boepd Wolfcamp A
WPX EAST PECOS 22-7H Max Day: 1,446 Boepd Bone Spring 2nd
WPX RDX 10-5H Max Day: 1,443 Boepd Avalon Lower

Williston: Costs Down with Performance Increasing
Operating costs trending lower1
► 54% reduction in LOE
► 52% improvement in oil differentials
Improving efficiencies
► Coil tubing, ~$250k savings per well
► Redesigned pad facilities, ~$300k savings per well
Significantly lower well costs2
► $6.2MM for D&C
► $1.1MM for artificial lift and facilities
Added 2nd rig in August
► Well-to-well contract
Aggressively testing well optimization
► Pounds of sand
► Number of stages
13 WPX Energy | 3Q'15 Earnings Call | November 5, 2015
Well Name ZONE Pounds Stages 30 Day Avg. IP
Mandaree 24-13HD BKN 10 MM# 45 1,638 bopd
Mandaree 24-13HY TF-1 6 MM# 45 1,419 bopd
Mandaree 24-13HZ TF-1 10 MM# 45 1,179 bopd
Mandaree Pad
1 3Q ’15 vs. 3Q ’14 2 Combined average of 6MM lb. wells and 10MM lb. wells

0
10,000
20,000
30,000
40,000
50,000
60,000
70,000
80,000
90,000
100,000
0 10 20 30 40 50 60 70
Cu
mu
lati
ve P
rod
uct
ion
, Mb
oe
Days of Production
Williston: Early Results From Larger Stimulations - Mandaree Pad
14 WPX Energy | 3Q'15 Earnings Call | November 5, 2015
Mandaree 24-13HD (98% above type curve after 50 days,10MM#/45 stages)
Mandaree 24-13HY (60% above type curve after 48 days,6MM#/45 stages)
Mandaree 24-13HZ (44% above type curve after 54 days,10MM#/45 stages)
750 Mboe Type Curve (Blended)
100
90
80
70
60
50
40
30
20
10
0
WPX Energy | 3Q'15 Earnings Call | November 5, 2015
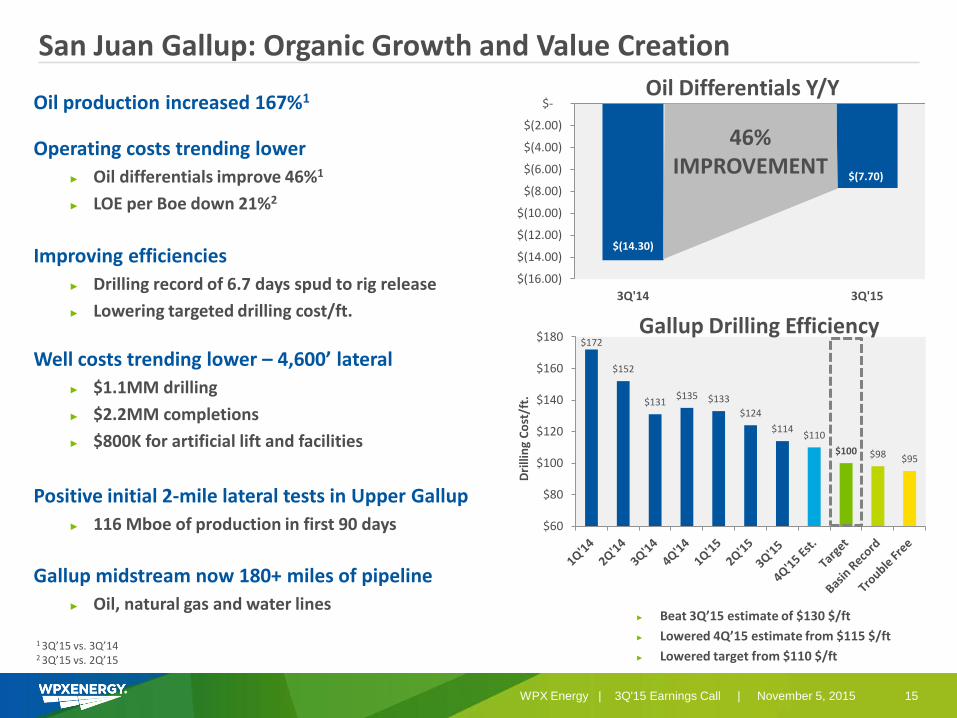
$(14.30)
$(7.70)
$(16.00)
$(14.00)
$(12.00)
$(10.00)
$(8.00)
$(6.00)
$(4.00)
$(2.00)
$-
3Q'14 3Q'15
$172
$152
$131 $135 $133
$124
$114 $110
$100 $98 $95
$60
$80
$100
$120
$140
$160
$180
San Juan Gallup: Organic Growth and Value Creation Oil Differentials Y/Y
1 3Q’15 vs. 3Q’14 2 3Q’15 vs. 2Q’15
Gallup Drilling Efficiency
Dri
llin
g C
ost
/ft.
15
Oil production increased 167%1
Operating costs trending lower
► Oil differentials improve 46%1
► LOE per Boe down 21%2
Improving efficiencies
► Drilling record of 6.7 days spud to rig release
► Lowering targeted drilling cost/ft.
Well costs trending lower – 4,600’ lateral
► $1.1MM drilling
► $2.2MM completions
► $800K for artificial lift and facilities
Positive initial 2-mile lateral tests in Upper Gallup
► 116 Mboe of production in first 90 days
Gallup midstream now 180+ miles of pipeline
► Oil, natural gas and water lines ► Beat 3Q’15 estimate of $130 $/ft
► Lowered 4Q’15 estimate from $115 $/ft
► Lowered target from $110 $/ft
46% IMPROVEMENT
0
2000
4000
6000
8000
10000
12000
14000
16000
0 20 40 60 80 100 120
Gas
Rat
e, M
MC
FD
Days Producing
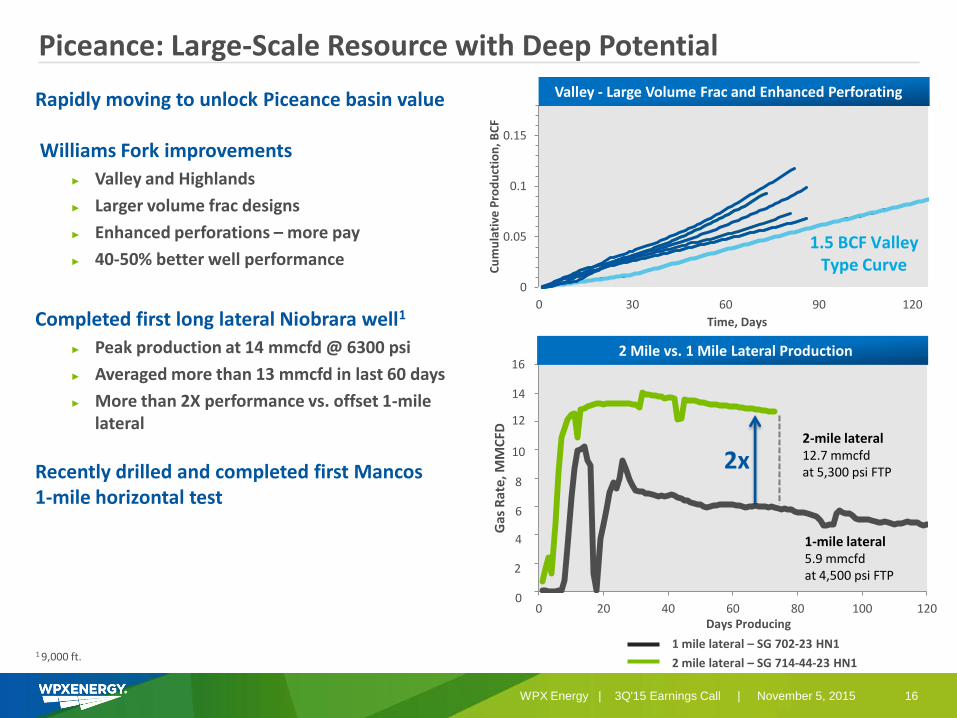
2-mile lateral 12.7 mmcfd at 5,300 psi FTP
1-mile lateral 5.9 mmcfd at 4,500 psi FTP
Piceance: Large-Scale Resource with Deep Potential
Rapidly moving to unlock Piceance basin value Williams Fork improvements
► Valley and Highlands
► Larger volume frac designs
► Enhanced perforations – more pay
► 40-50% better well performance
Completed first long lateral Niobrara well1
► Peak production at 14 mmcfd @ 6300 psi
► Averaged more than 13 mmcfd in last 60 days
► More than 2X performance vs. offset 1-mile lateral
Recently drilled and completed first Mancos 1-mile horizontal test
1 mile lateral – SG 702-23 HN1
2 mile lateral – SG 714-44-23 HN1
16 WPX Energy | 3Q'15 Earnings Call | November 5, 2015
2x
16
14
12
10
8
6
4
0
2
0
0.05
0.1
0.15
0 30 60 90 120
Cu
mu
lati
ve P
rod
uct
ion
, BC
F
Time, Days
1.5 BCF Valley Type Curve
Valley - Large Volume Frac and Enhanced Perforating
2 Mile vs. 1 Mile Lateral Production
1 9,000 ft.

Operating within cashflow second half of 20151
On track to achieve 2015 divestiture target2
Estimated YE15 net debt to adjusted EBITDAX of 3.0x -3.2x Aggressively testing new technical concepts Strong hedge positions for remaining 2015 and full-year 2016
What’s Important
1 Excludes land acquisitions and any transaction cost associated with the RKI acquisition 2 Includes both announced and closed divestitures. Based on mid-point of the $400MM - $500MM divestiture target in 2015.
17 WPX Energy | 3Q'15 Earnings Call | November 5, 2015
Appendix

WPX Portfolio
PICEANCE BASIN Cash Flow + Resource Potential
• Vertical: Deep inventory (~11,000 locations) with infrastructure in place
• Niobrara/Mancos: 15-20 Tcfe stacked-pay resource potential
• Stable cash flows provide financial flexibility
WILLISTON BASIN High Oil Content with Continuing Growth
• 600+ operated remaining locations, ~87,000 acres
• 34% production CAGR 1Q’12-3Q’15 (Mboe/d)
• Downspacing, infrastructure, operational efficiencies drive upside
PERMIAN BASIN Deep Inventory of High-Return Locations
• Decades of drillable locations
• Significant upside potential from downspacing and additional prospective horizons
• 670,000+ net prospective acres
SAN JUAN BASIN Oil and Natural Gas Development Opportunities
• Gallup Oil: 400+ locations, ~100,000 acres
• Natural gas: potential for future development opportunities
• Established infrastructure
19 WPX Energy | 3Q'15 Earnings Call | November 5, 2015

$4.61
$3.47
$-
$0.50
$1.00
$1.50
$2.00
$2.50
$3.00
$3.50
$4.00
$4.50
$5.00
3Q'14 3Q'15
$(11.23)
$(6.14)
$(12.00)
$(10.00)
$(8.00)
$(6.00)
$(4.00)
$(2.00)
$-
3Q'14 3Q'15
$5.32
$4.84
$3.00
$3.50
$4.00
$4.50
$5.00
$5.50
3Q'14 3Q'15
$4.05
$3.27
$0.00
$0.75
$1.50
$2.25
$3.00
$3.75
$4.50
3Q'14 3Q'15
Cost Continue to Trend Lower
LOE
GP&T
19% Decrease
G&A1
25% Decrease
9% Decrease
Oil Differentials
45% Improvement
$ p
er B
oe
$ p
er B
oe
$ p
er B
oe
20 WPX Energy | 3Q'15 Earnings Call | November 5, 2015
1 Excludes one-time expenses associated with Early Exit Program (2014) , Severance and Relocation (2015)

~92,000 net acres
► Currently operating 4 rigs
► 3 rigs running in Wolfcamp
► 1 rig in Delaware Sands/Bone Spring
3,600 gross risked locations
Commodity mix1
► 52% oil
► 31% natural gas
► 17% NGLs
Available sales outlets
► Holley Frontier’s Artesia, NM Refinery
► Western’s El Paso Refinery
► Gulf Coast
► Cushing
► Midland
Permian Overview
21 WPX Energy | 3Q'15 Earnings Call | November 5, 2015
1 Based off YTD production

Williston Overview
~87,000 net acres
► Currently operating 2 rigs
600+ gross drilling locations
► 520 operated drilling locations
► 90 non-op locations
Commodity mix
► 87% oil
► 7% natural gas
► 6% NGLs
Available sales outlets
► Clearbrook, Minn. (WTI)
► Guernsey, Wyo. (WTI)
► Local refining markets
► Rail to all coastal markets (Brent, LLS, WTI)
N D
22 WPX Energy | 3Q'15 Earnings Call | November 5, 2015

San Juan Overview
~232,000 net acres ► Oil window: ~100,000 acres1
► Gas window: ~132,000 acres
► Currently operating 1 rig
~3,900 total gross drilling locations2
► Oil window: 400+3
► Gas window: ~3,5002
Commodity mix ► Oil window
► Oil: 52%
► NGLs: 19%
► Gas: 29%
► Gas window ► Natural gas: 99%
► NGLs: 1%
Available sales outlets ► Oil: Local refining markets or rail (WTI, Brent, LLS)
► Gas: Blanco Hub
DRY GAS
WET GAS
OIL
1 Acreage owned or controlled by WPX 2 Includes non-op and operated locations 3 Assumes 4,600' laterals
23 WPX Energy | 3Q'15 Earnings Call | November 5, 2015

Piceance Overview
~200,000 net acres ► Currently operating 1 rig
~11,000 gross drilling locations
Commodity mix1
► 2% oil
► 77% natural gas
► 21% NGLs
Available sales outlets
► San Juan
► Rockies
► California
► MidCon
Unbooked deep resource potential
► Niobrara/Mancos: ~160,000 acres
► Dry gas
CO
1 Assumes full ethane recovery
24 WPX Energy | 3Q'15 Earnings Call | November 5, 2015

Domestic Price Realization for 2015
Gas ($/Mcf) Oil ($/bbl) NGL ($/bbl)
1Q ’15 2Q ’15 3Q ’15 4Q ’15 1Q ’15 2Q ’15 3Q ’15 4Q ’15 1Q ’15 2Q ’15 3Q ’15 4Q ’15
Weighted-Average Sales Price $2.90 $2.40 $2.69 $38.34 $49.64 $40.10 $22.74 $20.40 $17.87
Revenue Adjustments1 $(.28) $(.32) $(.30) $(.70) $(1.04) $(1.99) $(7.34) $(6.64) $(5.47)
Hedge Impact – – –
Net Price2 $2.62 $2.08 $2.39 $37.64 $48.60 $38.11 $15.40 $13.76 $12.40
Realized Portion of Derivatives Not Designated as Hedges3 $1.05 $1.02 $0.91 $29.49 $24.92 $31.79 – –
--
Net Price Including All Derivatives
$3.67 $3.10 $$3.30 $67.13 $73.52 $69.90 $15.40 $13.76 $12.40
1 Natural gas revenue adjustments are primarily related to field compression fuel. NGL revenue adjustments include T&F and revenue sharing. Of the oil revenue adjustments, gathering deductions represent $(1.50). 2 “Net Price” equals income statement product revenues by commodity, divided by volume. 3 Represents the realized cash flows that occurred during each quarter, which are attributable to derivatives that were not designated as hedges for accounting purposes.
25 WPX Energy | 3Q'15 Earnings Call | November 5, 2015

Mexican Exports to Drive Western Demand Growth
W. Texas 3.1 Bcf/d
S. Texas 3.64 Bcf/d
Bentek Sourced Export Capacities
Costa Azul LNG Facility
Total Current Capacity
7.4 Bcf/d July 2014, El Paso announced 21 Year deal with Mexico’s CFE to provide up to 500 MMBtu/d of firm capacity from SJ basin to Mexico border beginning Nov. 2014.
North Baja 130 Mcf/d
Sempra and Pemex recently announced coordination for the potential development of LNG exports with assumed capacity of up to 1 Bcf/d.
Sept 2014, CFE outlines two pipe-line projects sourcing 2.5 Bcf/d from Waha, Texas, by 2017.
Colorado Interstate Gas Co El Paso Natural Gas Co Kern River Gas Transmission Co Northwest Pipeline Corp Questar Pipeline Co Transcolorado Gas Transmission Co Transwestern Pipeline Co
Arizona 812 MMcf/d
Total Proposed Capacity
7.7 Bcf/d
26 WPX Energy | 3Q'15 Earnings Call | November 5, 2015
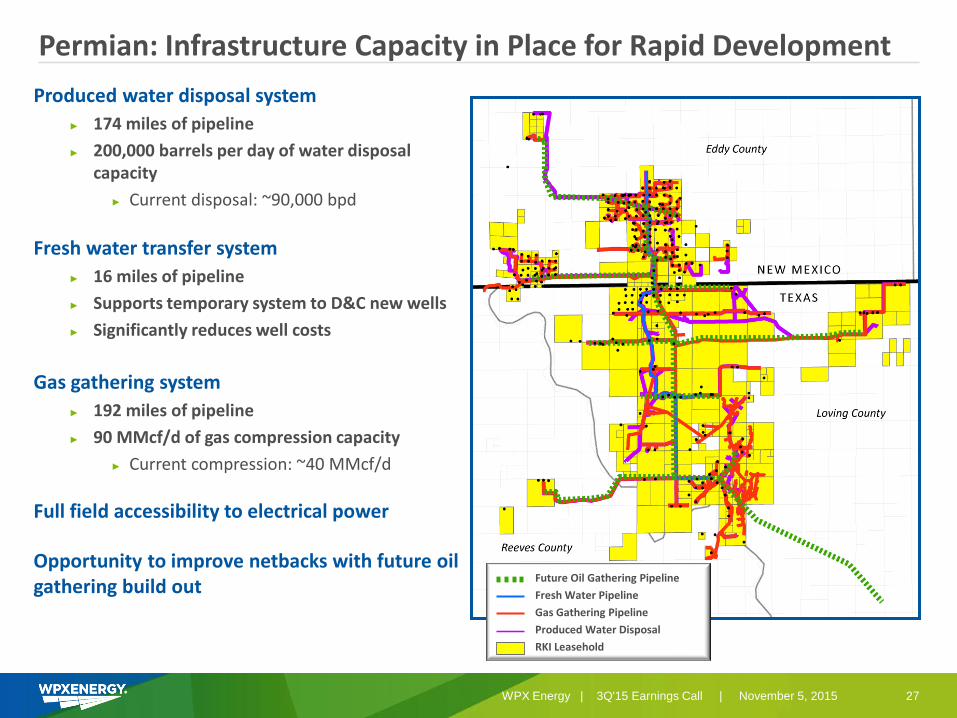
Permian: Infrastructure Capacity in Place for Rapid Development
27
Produced water disposal system
► 174 miles of pipeline
► 200,000 barrels per day of water disposal capacity
► Current disposal: ~90,000 bpd
Fresh water transfer system
► 16 miles of pipeline
► Supports temporary system to D&C new wells
► Significantly reduces well costs
Gas gathering system
► 192 miles of pipeline
► 90 MMcf/d of gas compression capacity
► Current compression: ~40 MMcf/d
Full field accessibility to electrical power
Opportunity to improve netbacks with future oil gathering build out
Future Oil Gathering Pipeline
Fresh Water Pipeline
Gas Gathering Pipeline
Produced Water Disposal
RKI Leasehold
WPX Energy | 3Q'15 Earnings Call | November 5, 2015
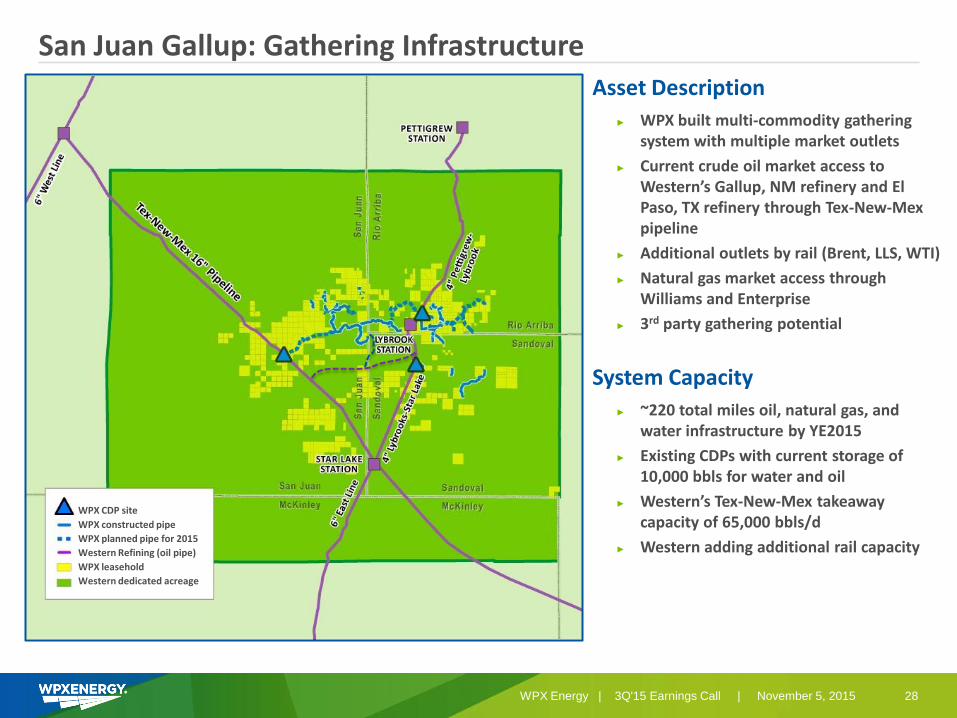
San Juan Gallup: Gathering Infrastructure Asset Description
► WPX built multi-commodity gathering system with multiple market outlets
► Current crude oil market access to Western’s Gallup, NM refinery and El Paso, TX refinery through Tex-New-Mex pipeline
► Additional outlets by rail (Brent, LLS, WTI)
► Natural gas market access through Williams and Enterprise
► 3rd party gathering potential
System Capacity
► ~220 total miles oil, natural gas, and water infrastructure by YE2015
► Existing CDPs with current storage of 10,000 bbls for water and oil
► Western’s Tex-New-Mex takeaway capacity of 65,000 bbls/d
► Western adding additional rail capacity
WPX CDP site
WPX constructed pipe
WPX planned pipe for 2015
Western Refining (oil pipe)
WPX leasehold
Western dedicated acreage
28 WPX Energy | 3Q'15 Earnings Call | November 5, 2015

Piceance: Water Treatment System
Asset Description
► WPX built produced and completions water handling system
► Three water treatment facilities located in basin
► ~400 miles of water pipeline infrastructure
► System designed for 10+ rig program
► 3rd party water service opportunities
System Capacity ► Three water treatment facilities
► 18,700 – 37,400 bpd capacity per facility
► Disposal capacity of ~22,000 bpd
► Total storage capacity of ~1.9 MMbbls
WPX constructed pipe
WPX Leasehold
The Valley
The Highlands
29 WPX Energy | 3Q'15 Earnings Call | November 5, 2015

Non-GAAP

WPX Non-GAAP Disclaimer
This presentation may include certain financial measures, including adjusted EBITDAX (earnings before interest, taxes, depreciation, depletion, amortization and exploration expenses), that are non-GAAP financial measures as defined under the rules of the Securities and Exchange Commission.
This presentation is accompanied by a reconciliation of these non-GAAP financial measures to their nearest GAAP financial measures. Management uses these financial measures because they are widely accepted financial indicators used by investors to compare a company’s performance. Management believes that these measures provide investors an enhanced perspective of the operating performance of the company and aid investor understanding. Management also believes that these non-GAAP measures provide useful information regarding our ability to meet future debt service, capital expenditures and working capital requirements. These non-GAAP financial measures should not be considered in isolation or as substitutes for a measure of performance prepared in accordance with United States generally accepted accounting principles.
31 WPX Energy | 3Q'15 Earnings Call | November 5, 2015

Reconciliation-Adjusted Income (Loss) from Continuing Operations (Unaudited) 2014 2015
(Dollars in millions, except per share amounts) 1Q 2Q 3Q 4Q Year 1Q 2Q 3Q 4Q YTD
Income (loss) from continuing operations attributable to WPX Energy, Inc. available to common stockholders $ - $ (144) $ 46 $ 227 $ 129 $ 22 $ (23) $ (106) $ (107)
Income (loss) from continuing operations - diluted earnings per share $ - $(0.71) $ 0.23 $ 1.10 $ 0.62 $ 0.11 $ (0.12) $(0.44) $ (0.50)
Pre-tax adjustments:
Impairment of producing properties, costs of acquired unproved reserves and leasehold (1) $ - $ - $ - $ 20 $ 20 $ - $ - $ - $ -
Impairments- exploratory related $ - $ 40 $ 22 $ 67 $ 129 $ - $ - $ 47 $ 47
Loss on sale of working interests in the Piceance Basin $ - $ 195 $ 1 $ - $ 196 $ - $ - $ - $ -
Net gain on sales of assets $ - $ - $ - $ - $ - $ (69) $ (209) $ (2) $ (280)
Expense related to Early Exit Program $ - $ 2 $ 8 $ - $ 10 $ - $ - $ - $ -
Contract termination and early rig release expenses $ - $ - $ 6 $ 6 $ 12 $ 26 $ - $ - $ 26
Assignment of natural gas storage commitment $ - $ - $ - $ 14 $ 14 $ - $ - $ - $ -
Costs related to severance and relocation $ - $ - $ - $ - $ - $ 8 $ 7 $ 1 $ 16
Costs related to acquistion and retention $ - $ - $ - $ - $ - $ - $ 1 $ 103 $ 104
Unrealized MTM (gain) loss $ 27 $ - $ (133) $ (453) $ (559) $ 30 $ 203 $ (50) $ 183
Total pre-tax adjustments $ 27 $ 237 $ (96) $ (346) $ (178) $ (5) $ 2 $ 99 $ 96
Less tax effect for above items $ (10) $ (87) $ 35 $ 126 $ 64 $ 2 $ (1) $ (35) $ (34)
Impact of new state tax law in New York (net of federal benefit) $ 9 $ - $ - $ - $ 9 $ - $ - $ - $ -
Total adjustments, after-tax $ 26 $ 150 $ (61) $ (220) $ (105) $ (3) $ 1 $ 64 $ 62
Adjusted income (loss) from continuing operations available to common stockholders $ 26 $ 6 $ (15) $ 7 $ 24 $ 19 $ (22) $ (42) $ (45)
Adjusted diluted earnings (loss) per common share $ 0.13 $ 0.03 $(0.07) $ 0.03 $ 0.12 $ 0.09 $ (0.11) $(0.17) $ (0.20)
Diluted weighted-average shares (millions) 205.2 202.7 207.5 206.3 206.3 205.9 205.0 251.2 220.3
(1) These items are presented net of amounts attributable to noncontrolling interests.
32 WPX Energy | 3Q'15 Earnings Call | November 5, 2015

Reconciliation – EBITDAX (Unaudited) 2014 2015
(Dollars in millions) 1Q 2Q 3Q 4Q YTD 1Q 2Q 3Q 4Q YTD
Adjusted EBITDAX
Reconciliation to net income (loss):
Net income (loss) $ 19 $ (133) $ 66 $ 219 $ 171 $ 68 $ (30) $ (230) $ (192)
Interest expense 29 28 31 35 123 33 32 65 130
Provision (benefit) for income taxes 13 (82) 25 119 75 13 (14) (52) (53)
Depreciation, depletion and amortization 193 202 201 214 810 216 227 242 685
Exploration expenses 15 54 28 76 173 7 6 56 69
EBITDAX 269 69 351 663 1,352 337 221 81 639
Impairment of producing properties, costs of acquired unproved reserves and equity investments
- - - 20 20 - - - -
Loss on sale of working interests in the Piceance Basin - 195 1 - 196 - - - -
Net gain on sales of assets - - - - - (69) (209) (2) (280)
RKI acquistion costs and loss on acquired debt retirement - - - - - - - 87 87
Net (gain) loss on derivatives 195 17 (148) (498) (434) (105) 71 (205) (239)
Net cash received (paid) related to settlement of derivatives (168) (17) 15 45 (125) 135 132 155 422
(Income) loss from discontinued operations (19) (11) (20) 8 (42) (46) 7 124 85
Adjusted EBITDAX $ 277 $ 253 $ 199 $ 238 $ 967 $ 252 $ 222 $ 240 $ 714
33 WPX Energy | 3Q'15 Earnings Call | November 5, 2015

Disclaimer
The information contained in this summary has been prepared to assist you in making your own evaluation of the Company and does not purport to contain all of the information you may consider important in deciding whether to invest in shares of the Company’s common stock. In all cases, it is your obligation to conduct your own due diligence. All information contained herein, including any estimates or projections, is based upon information provided by the Company. Any estimates or projections with respect to future performance have been provided to assist you in your evaluation but should not be relied upon as an accurate representation of future results. No persons have been authorized to make any representations other than those contained in this summary, and if given or made, such representations should not be considered as authorized.
Certain statements, estimates and financial information contained in this summary constitute forward-looking statements or information. Such forward-looking statements or information involve known and unknown risks and uncertainties that could cause actual events or results to differ materially from the results implied or expressed in such forward-looking statements or information. While presented with numerical specificity, certain forward-looking statements or information are based (1) upon assumptions that are inherently subject to significant business, economic, regulatory, environmental, seasonal, competitive uncertainties, contingencies and risks including, without limitation, the ability to obtain debt and equity financings, capital costs, construction costs, well production performance, operating costs, commodity pricing, differentials, royalty structures, field upgrading technology, and other known and unknown risks, all of which are difficult to predict and many of which are beyond the Company's control, and (2) upon assumptions with respect to future business decisions that are subject to change.
There can be no assurance that the results implied or expressed in such forward-looking statements or information or the underlying assumptions will be realized and that actual results of operations or future events will not be materially different from the results implied or expressed in such forward-looking statements or information. Under no circumstances should the inclusion of the forward-looking statements or information be regarded as a representation, undertaking, warranty or prediction by the Company or any other person with respect to the accuracy thereof or the accuracy of the underlying assumptions, or that the Company will achieve or is likely to achieve any particular results. The forward-looking statements or information are made as of the date hereof and the Company disclaims any intent or obligation to update publicly or to revise any of the forward-looking statements or information, whether as a result of new information, future events or otherwise. Recipients are cautioned that forward-looking statements or information are not guarantees of future performance and, accordingly, recipients are expressly cautioned not to put undue reliance on forward-looking statements or information due to the inherent uncertainty therein.
34 WPX Energy | 3Q'15 Earnings Call | November 5, 2015

Reserves Disclaimer
The SEC requires oil and gas companies, in filings made with the SEC, to disclose proved reserves, which are those quantities of oil and gas, which, by analysis of geoscience and engineering data, can be estimated with reasonable certainty to be economically producible – from a given date forward, from known reservoirs, under existing economic conditions, operating methods, and governmental regulations. The SEC permits the optional disclosure of probable and possible reserves. We have elected to use in this presentation “probable” reserves and “possible” reserves, excluding their valuation. The SEC defines “probable” reserves as “those additional reserves that are less certain to be recovered than proved reserves but which, together with proved reserves, are as likely as not to be recovered.” The SEC defines “possible” reserves as “those additional reserves that are less certain to be recovered than probable reserves.” The Company has applied these definitions in estimating probable and possible reserves. Statements of reserves are only estimates and may not correspond to the ultimate quantities of oil and gas recovered. Any reserve estimates provided in this presentation that are not specifically designated as being estimates of proved reserves may include estimated reserves not necessarily calculated in accordance with, or contemplated by, the SEC’s reserves reporting guidelines. Investors are urged to consider closely the disclosure regarding our business that may be accessed through the SEC’s website at www.sec.gov.
The SEC’s rules prohibit us from filing resource estimates. Our resource estimations include estimates of hydrocarbon quantities for (i) new areas for which we do not have sufficient information to date to classify as proved, probable or even possible reserves, (ii) other areas to take into account the low level of certainty of recovery of the resources and (iii) uneconomic proved, probable or possible reserves. Resource estimates do not take into account the certainty of resource recovery and are therefore not indicative of the expected future recovery and should not be relied upon. Resource estimates might never be recovered and are contingent on exploration success, technical improvements in drilling access, commerciality and other factors.
35 WPX Energy | 3Q'15 Earnings Call | November 5, 2015