3d tunnel seismic prediction: a next generation tool to
TRANSCRIPT

T. Dickmann/3D Tunnel Seismic Prediction: A Next Generation Tool.../JRMTT 20(1), 2014, 35-47
35
T. Dickmann/3D Tunnel Seismic Prediction: A Next Generation Tool.../JRMTT 20(1), 2014, 35-47
35
Journal of Rock Mechanics & Tunnelling Technology (JRMTT) 20 (1) 2014 pp 35-47
Available online at www.isrmtt.com
3D Tunnel Seismic Prediction: A Next Generation Tool to Characterize Rock Mass Conditions Ahead of the Tunnel Face
T. Dickmann Amberg Technologies AG, Switzerland
ABSTRACT Unknown geological boundaries can cause serious problems and risks during tunnel advancement. Common exploration methods like probe drillings or surface geophysical surveys can lead to insufficient results due to frequent changes of geological conditions and high overburden. Besides probe drilling, non-destructive geophysical methods can detect lithological heterogeneities within sufficient distances ahead of the tunnel face. To perform reliable seismic measurements and thus mitigating risks for tunnel construction in hard rock conditions, it is strongly recommended to integrate the process of geological forecast methodology into the overall management of risk and cost control. The new generation of the 3D tunnel seismic prediction system integrates the operational requirements as well as the demanded state-of-the-art data imaging procedure. The sophisticated method is user-purpose oriented and leads the operator straight to the result in a 3D environment. A further step is done to control geological uncertainties ahead of the face in hard rock conditions and to provide an important impact on logistic optimization that could end up in an economic and consequentially time- and cost-effective practice of probe drilling ahead. Keywords: 3D TSP; Ahead investigation; Geophysical prediction; Rock characterisation;
Tunnelling 1. INTRODUCTION High costs and the demand for safety influence the adoption of high excavation rates and the application of the best possible technology for the optimum construction program. This demanding characteristic of underground projects requires a thorough investigation of the ground. Tunnelling is still a risky undertaking where the geological complexity of each region is related to as a major factor. This major factor may emerge as a challenge when weak rock mass quality, fracturing and weathering, groundwater ingress and for deep tunnels rock stress characterise the geology encountered during tunnelling. As a consequence, the highest risk particularly lies in the uncertainty of the geology. Significant geological boundaries, which especially cut the tunnel axis very suddenly, can cause serious problems. Their timely prediction are of great importance. Common exploration methods like exploratory drillings or geophysical predictions from the surface can lead to insufficient results due to frequent changes of geological conditions, high overburden, dense infrastructures above the tunnel track etc. Besides exploratory drilling from the tunnel face, non-destructive geophysical methods can detect lithological heterogeneities within sufficient distances ahead of the tunnel face. These methods need to be robust and reliable and shall not

T. Dickmann/3D Tunnel Seismic Prediction: A Next Generation Tool.../JRMTT 20(1), 2014, 35-47
36
T. Dickmann/3D Tunnel Seismic Prediction: A Next Generation Tool.../JRMTT 20(1), 2014, 35-47
36
disrupt the tunnelling process while yielding results quickly and at moderate costs. One of the cutting-edge technologies with a proven record of success is the latest TSP-3D technology.
2. IMPLICATIONS OF UNCERTAIN GROUND CONDITIONS
Underground work generally poses intimidating, but not impossible challenges to the geotechnical and tunnel design teams. Tunnelling means construction carried out in an uncertain and often aggressive environment. Geology determines the cost, overall feasibility, and even the application of the completed structure. The relationship between geology and cost is so dominant that all parties involved in the planning and design of tunnels must give serious consideration to the geology of the site. The spatial uncertainties in geotechnical properties are greater in tunnelling projects compared to most other engineering projects. It essentially requires expert engineering judgement and experience. In many cases, experience in similar ground conditions may not be available and one has to deal with unique uncertainties in ground conditions. For this reason the regional geology and hydrogeology has to be understood. Typically, groundwater condition is the most difficult parameter to predict and also the most troublesome during construction. Any information about location, depth of the water table and aquifer thickness is an important precondition for the design of the tunnel lining.
The identification of the potential risks at the planning stage is important because it gives time for planners and decision makers to understand the uncertainties associated with the project. A first step of the risk assessment involves identifying all the factors and parameters that could affect the tunnel in order to determine the likelihood of a failure or an unsatisfactory performance in a qualitative manner. Geology establishes one of the major risk categories.
Within tunnelling projects a significant cause of cost overrun has historically been associated with the contractor claims for ground conditions significantly different from those expected at the time of tender. It has been difficult to assess these claims without a well-defined benchmark conditions agreed at the outset between all the interested parties. However the nature of the tunnelling contract greatly effects how the site investigation data is interpreted and further investigation stages are pursued. In adversarial contracts, some post contract site investigation work is done retrospectively to prove and disprove claims against the findings from the original site investigations. In constructive and shared risk contracts, further site investigation work is done to achieve more positive goals including safety, optimisation of techniques and tunnelling processes and even research for future projects. In the later, those site investigations such as Tunnel Seismic Prediction are specified already in the tender documents including corresponding list entries in the Bill of Quantities. Figure 1 illustrates the way how to reasonably integrate Tunnel Seismic Prediction into the planning, tendering and operating of a tunnelling project.
3. PREDICTING GEOLOGICAL UNCERTAINTIES AHEAD OF THE TUNNEL FACE
3.1 Tunnel Seismic Prediction
Due to geological assessment constraints non-destructive geophysical site investigations while tunnelling have developed and improved significantly over recent times. In particular, when site investigations from the surface are limited given the topography, tunnel seismic imaging can detect lithological heterogeneities within distances up to hundreds of meters ahead of the face, many times more that of probe drilling alone. It is the most effective prediction method because of its large prediction range, high resolution and ease of application on a tunnel construction site.

T. Dickmann/3D Tunnel Seismic Prediction: A Next Generation Tool.../JRMTT 20(1), 2014, 35-47
37
T. Dickmann/3D Tunnel Seismic Prediction: A Next Generation Tool.../JRMTT 20(1), 2014, 35-47
37
It is based on evaluating elastic body waves, which are being excited by detonation charges providing the best signal to noise ratio and the least restrictive conditions for recording and processing (Fig. 2). The body waves travel as compression or shear waves through the ground and are being reflected at interfaces with different mechanical properties like density or elasticity. Thus, by separation of the different wave types using three-component-sensors it is possible to deduct information about the mechanical properties of the ground such as elastic modulus. Even in rather complex geological hard rock condition, pediction ranges of over 150 m can be achieved.
Fig. 1 - Necessary provisions of risk management during tunnelling in terms of Tunnel Seismic Prediction
Fig. 2 - Measurement layout of the 3D Tunnel Seismic Prediction method (TSP 303) consisting of usually 4 receivers (RCV) and 24 shot points
Especially, tunnel excavations using tunnel boring machines (TBM) do not provide geological data of the tunnel face, and they often use continuous probe drilling from the tunnel face to overcome this drawback. Besides the only one-dimensional information given, probe drilling causes significant delays to excavation. A careful risk management has to address such constraints by
T. Dickmann/3D Tunnel Seismic Prediction: A Next Generation Tool.../JRMTT 20(1), 2014, 35-47
38
T. Dickmann/3D Tunnel Seismic Prediction: A Next Generation Tool.../JRMTT 20(1), 2014, 35-47
38
adequate exploration and proper measures. The proven approach of a three-phase based risk assessment to control geological uncertainties uses the Tunnel Seismic Prediction (TSP) method to identify suspected fault zones identified from surface topography and geological mapping. Once the geological risk zone is identified, a probe drilling is carried out when the concerned zone is closer to the face. In addition, site geologists continually map the tunnel sidewalls to describe precisely the geological features encountered and to classify the rock mass for determination of the rock support (Dickmann, 2012). If access to the rock mass at tunnel side walls isn’t available due to the use of precast segment lining at shielded TBM advances, there is almost no way to carry out geological mapping .
3.2 Specific Aspects of Tunnel Seismic Operation
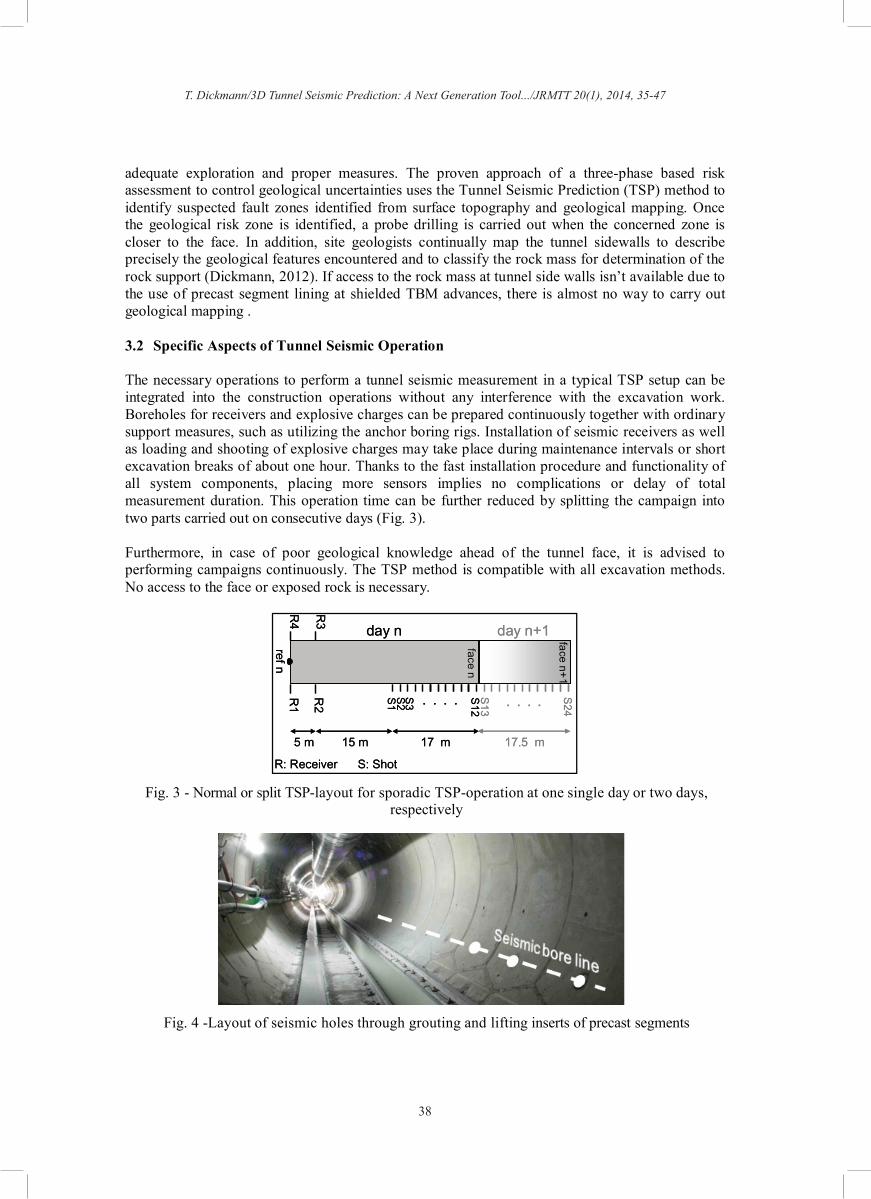
The necessary operations to perform a tunnel seismic measurement in a typical TSP setup can be integrated into the construction operations without any interference with the excavation work. Boreholes for receivers and explosive charges can be prepared continuously together with ordinary support measures, such as utilizing the anchor boring rigs. Installation of seismic receivers as well as loading and shooting of explosive charges may take place during maintenance intervals or short excavation breaks of about one hour. Thanks to the fast installation procedure and functionality of all system components, placing more sensors implies no complications or delay of total measurement duration. This operation time can be further reduced by splitting the campaign into two parts carried out on consecutive days (Fig. 3).
Furthermore, in case of poor geological knowledge ahead of the tunnel face, it is advised to performing campaigns continuously. The TSP method is compatible with all excavation methods. No access to the face or exposed rock is necessary.
Fig. 3 - Normal or split TSP-layout for sporadic TSP-operation at one single day or two days, respectively
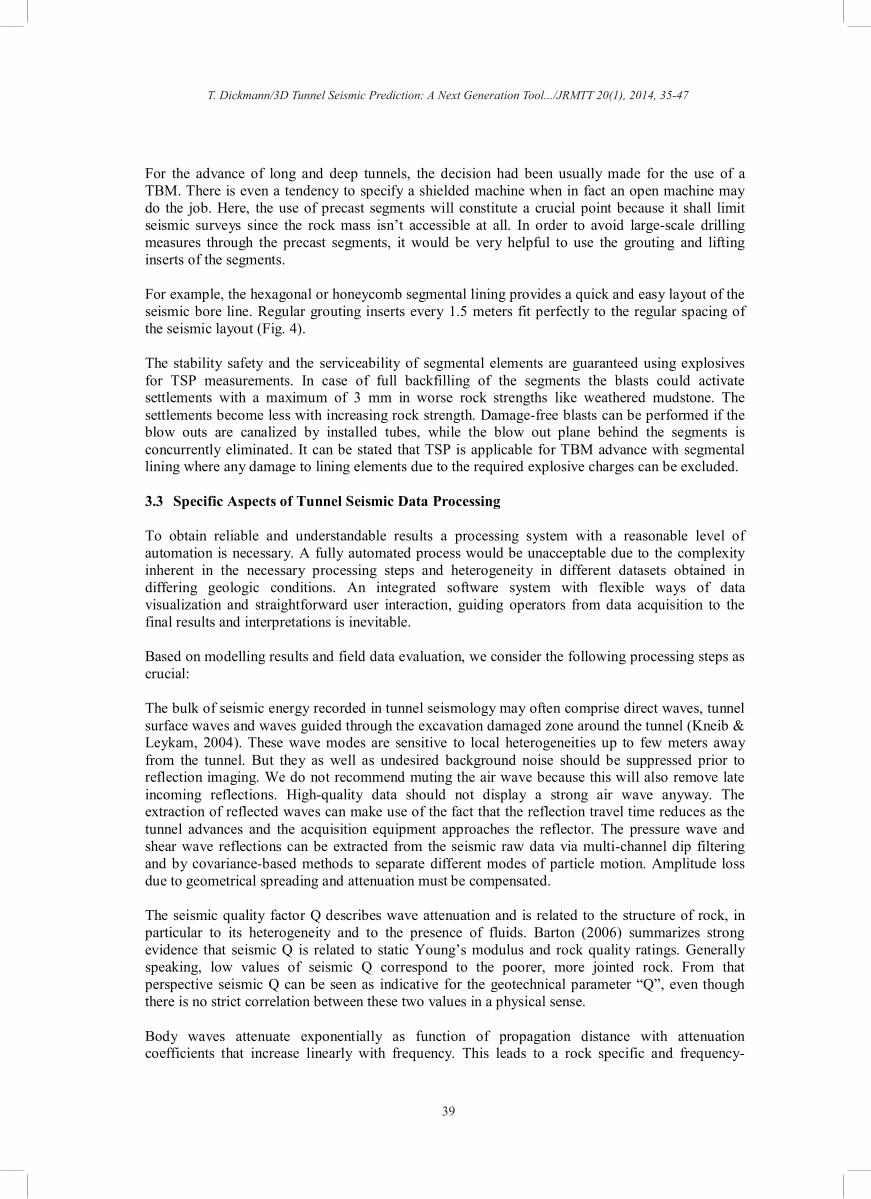
Fig. 4 -Layout of seismic holes through grouting and lifting inserts of precast segments
5 m 15 m 17 m
ref n
S1
S2
S3
S24
.... ....R1
R2
R3
R4
S12
face n
face n+1
17.5 m
S13
day n day n+1
R: Receiver S: Shot
5 m 15 m 17 m
ref n
S1
S2
S3
S24
.... ....R1
R2
R3
R4
S12
face n
face n+1
17.5 m
S13
day n day n+1
R: Receiver S: Shot
T. Dickmann/3D Tunnel Seismic Prediction: A Next Generation Tool.../JRMTT 20(1), 2014, 35-47
39
T. Dickmann/3D Tunnel Seismic Prediction: A Next Generation Tool.../JRMTT 20(1), 2014, 35-47
39
For the advance of long and deep tunnels, the decision had been usually made for the use of a TBM. There is even a tendency to specify a shielded machine when in fact an open machine may do the job. Here, the use of precast segments will constitute a crucial point because it shall limit seismic surveys since the rock mass isn’t accessible at all. In order to avoid large-scale drilling measures through the precast segments, it would be very helpful to use the grouting and lifting inserts of the segments.
For example, the hexagonal or honeycomb segmental lining provides a quick and easy layout of the seismic bore line. Regular grouting inserts every 1.5 meters fit perfectly to the regular spacing of the seismic layout (Fig. 4).
The stability safety and the serviceability of segmental elements are guaranteed using explosives for TSP measurements. In case of full backfilling of the segments the blasts could activate settlements with a maximum of 3 mm in worse rock strengths like weathered mudstone. The settlements become less with increasing rock strength. Damage-free blasts can be performed if the blow outs are canalized by installed tubes, while the blow out plane behind the segments is concurrently eliminated. It can be stated that TSP is applicable for TBM advance with segmental lining where any damage to lining elements due to the required explosive charges can be excluded.
3.3 Specific Aspects of Tunnel Seismic Data Processing
To obtain reliable and understandable results a processing system with a reasonable level of automation is necessary. A fully automated process would be unacceptable due to the complexity inherent in the necessary processing steps and heterogeneity in different datasets obtained in differing geologic conditions. An integrated software system with flexible ways of data visualization and straightforward user interaction, guiding operators from data acquisition to the final results and interpretations is inevitable.
Based on modelling results and field data evaluation, we consider the following processing steps as crucial:
The bulk of seismic energy recorded in tunnel seismology may often comprise direct waves, tunnel surface waves and waves guided through the excavation damaged zone around the tunnel (Kneib & Leykam, 2004). These wave modes are sensitive to local heterogeneities up to few meters away from the tunnel. But they as well as undesired background noise should be suppressed prior to reflection imaging. We do not recommend muting the air wave because this will also remove late incoming reflections. High-quality data should not display a strong air wave anyway. The extraction of reflected waves can make use of the fact that the reflection travel time reduces as the tunnel advances and the acquisition equipment approaches the reflector. The pressure wave and shear wave reflections can be extracted from the seismic raw data via multi-channel dip filtering and by covariance-based methods to separate different modes of particle motion. Amplitude loss due to geometrical spreading and attenuation must be compensated.
The seismic quality factor Q describes wave attenuation and is related to the structure of rock, in particular to its heterogeneity and to the presence of fluids. Barton (2006) summarizes strong evidence that seismic Q is related to static Young’s modulus and rock quality ratings. Generally speaking, low values of seismic Q correspond to the poorer, more jointed rock. From that perspective seismic Q can be seen as indicative for the geotechnical parameter “Q”, even though there is no strict correlation between these two values in a physical sense.
Body waves attenuate exponentially as function of propagation distance with attenuation coefficients that increase linearly with frequency. This leads to a rock specific and frequency-

T. Dickmann/3D Tunnel Seismic Prediction: A Next Generation Tool.../JRMTT 20(1), 2014, 35-47
40
T. Dickmann/3D Tunnel Seismic Prediction: A Next Generation Tool.../JRMTT 20(1), 2014, 35-47
40
independent seismic quality factor Q estimated from signal frequencies up to few kHz. We have investigated amplitude spectra of direct compressional waves as function of propagation distance in many hard rock tunnels around the world and found strong attenuation with Q-values ranging between 15 and 50. Waves under investigation should not have passed through the excavation damaged zone (EDZ) because attenuation there is much higher and not representative of undisturbed rock. This condition is satisfied by generation and recording of seismic energy inside boreholes and not on the tunnel wall.
Strong attenuation (low Q) limits the possible prediction range because signal amplitudes are damped such that they finally disappear in the background noise at specific propagation distances. Strong attenuation also causes wave trains to disperse such that reflected pulses cannot be focused via imaging. Therefore attenuation should be compensated for by inverse Q-filtering (Bickel & Natarajan, 1985).
In the computationally most expensive processing step the information of the seismic traces is mapped from time domain into the three dimensional space domain. This involves velocity model building and migration. The velocity models are input to prestack migration which focuses reflection energy along portions of the ellipsoidal isochrones (i.e. surfaces of constant travel time) using incidence angle information. Since the TSP method records three-component seismograms, the incidence angle can be derived by polarization analysis of the ground motion. The resulting migration image is a three dimensional map of acoustic impedance representing changes in seismic velocity and density. Thus, combining the velocity model and the reflection image allows interpreting density variations. With this information further rock mechanical parameters of interest such as elastic modulus, Poisson ratio etc. can be calculated using empirical relationships (Barton, 2006).
4. 3D-TSP: A NEW ERA OF TUNNEL SEISMIC PREDICTION
The novel TSP 303 system integrates 3D data acquisition and processing software containing routines for optimal seismic imaging with respect to tunnelling requirements. It exploits the information in the seismic wave field by separate compression (P) and shear (S) wave analysis and the 3D-velocity based migration and reflector extraction technology (3D-VMR). The 3D-VMR technology provides an adequate and detailed 3D image of the ground leading to a more reliable interpretation compared to conventional 2D approaches.
The 3D-VMR technology investigates reflection seismic data in order to determine the wave velocity in the propagation medium. If the velocity model used in travel time computation closely resembles the true rock velocities, any migrated reflector element appears at the same location independent of illumination distance. For measurement geometries with small variation in the illumination angles, as in tunnel seismic exploration, it is a good approach to determine velocity via migrations with test velocities and a succeeding analysis of migration errors. The error information combined with the known used migration velocity yields a velocity model (Fig. 5). This model forms the base for the next iteration until the final image computation yields the best fit model.
Figure 6 shows a real case of rock mass consisting of intact Gneiss formation within the already excavated tunnel stretch. It illustrates the P-wave velocity distribution analysed by the VMR-technology, which is presented in planes of longitudinal, plan and cross views through the computed data cuboid of a size of 200 x 100 x 100 metres in tunnelling direction and in each vertical and horizontal direction, respectively. The tunnel alignment is centred in the cuboid. The same data is shown in Figure 6 in a full space view, where velocity values lower than 5,000 m/s have been extracted.

T. Dickmann/3D Tunnel Seismic Prediction: A Next Generation Tool.../JRMTT 20(1), 2014, 35-47
41
T. Dickmann/3D Tunnel Seismic Prediction: A Next Generation Tool.../JRMTT 20(1), 2014, 35-47
41
Fig. 5 - Perspective view of longitudinal, plan and cross section of a 3D velocity distribution (P-wave) 150 m ahead of the tunnel face
Fig. 6 - Full space perspective view of a 3D velocity distribution (P-wave)
Around the tunnel, P-wave velocities of more than 6,300 m/s exist and represent an intact rock mass of high strength. Just in front of the tunnel face, a low velocity zone is indicated where highly jointed rock mass occurs. This zone retains a few metres and coarse jointing prevails on the subsequent section. About 70 metres ahead of the tunnel face a first fault zone becomes apparent almost (cross-cut) striking the prospective tunnel axis. This precursor is followed by another bigger fault intersecting the prospective tunnel from 80 to 92 metres ahead of the tunnel face. Further ahead intact gneiss with wide to moderate jointing returns and retains till the end of the forecast range.
Once the 3D-velocity distribution has been set, the next step of the 3D-VMR process is the 3D-reflector extraction. Here, the 3D-migration cuboid is being analysed and as a result reduced to this information, which reveals the most significant reflectors. A proper reflector image can now focus on zones within the rock mass, which are considered to be relevant for the further tunnelling.
T. Dickmann/3D Tunnel Seismic Prediction: A Next Generation Tool.../JRMTT 20(1), 2014, 35-47
42
T. Dickmann/3D Tunnel Seismic Prediction: A Next Generation Tool.../JRMTT 20(1), 2014, 35-47
42
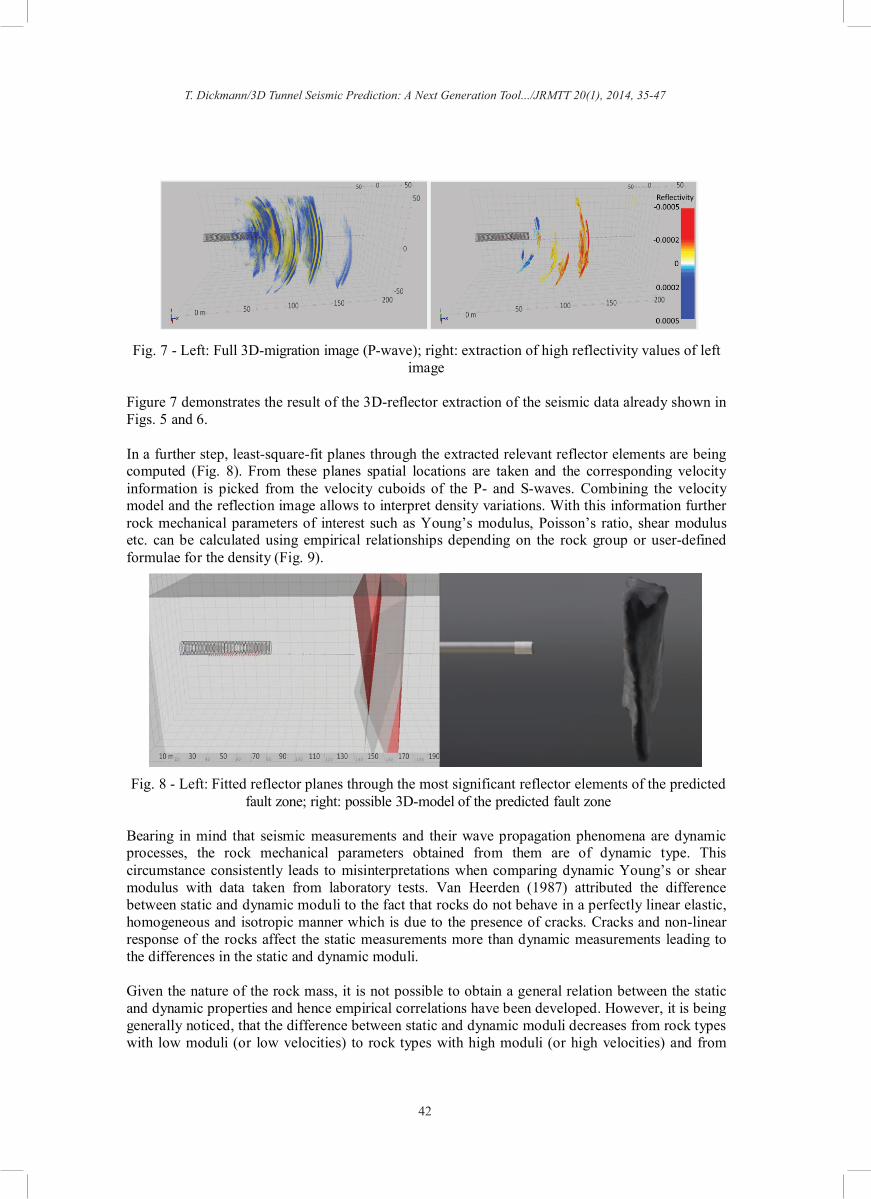
Fig. 7 - Left: Full 3D-migration image (P-wave); right: extraction of high reflectivity values of left image
Figure 7 demonstrates the result of the 3D-reflector extraction of the seismic data already shown in Figs. 5 and 6.
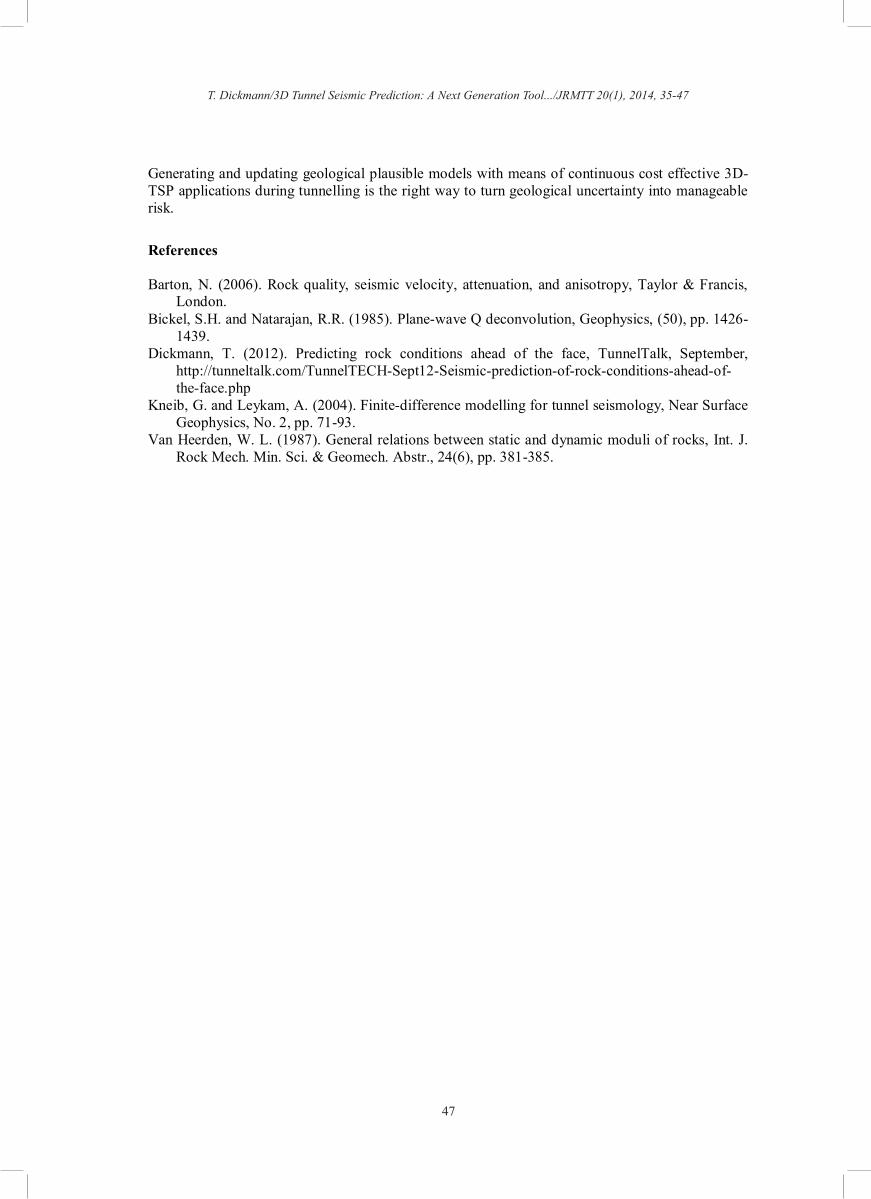
In a further step, least-square-fit planes through the extracted relevant reflector elements are being computed (Fig. 8). From these planes spatial locations are taken and the corresponding velocity information is picked from the velocity cuboids of the P- and S-waves. Combining the velocity model and the reflection image allows to interpret density variations. With this information further rock mechanical parameters of interest such as Young’s modulus, Poisson’s ratio, shear modulus etc. can be calculated using empirical relationships depending on the rock group or user-defined formulae for the density (Fig. 9).
Fig. 8 - Left: Fitted reflector planes through the most significant reflector elements of the predicted fault zone; right: possible 3D-model of the predicted fault zone
Bearing in mind that seismic measurements and their wave propagation phenomena are dynamic processes, the rock mechanical parameters obtained from them are of dynamic type. This circumstance consistently leads to misinterpretations when comparing dynamic Young’s or shear modulus with data taken from laboratory tests. Van Heerden (1987) attributed the difference between static and dynamic moduli to the fact that rocks do not behave in a perfectly linear elastic, homogeneous and isotropic manner which is due to the presence of cracks. Cracks and non-linear response of the rocks affect the static measurements more than dynamic measurements leading to the differences in the static and dynamic moduli.
Given the nature of the rock mass, it is not possible to obtain a general relation between the static and dynamic properties and hence empirical correlations have been developed. However, it is being generally noticed, that the difference between static and dynamic moduli decreases from rock types with low moduli (or low velocities) to rock types with high moduli (or high velocities) and from

T. Dickmann/3D Tunnel Seismic Prediction: A Next Generation Tool.../JRMTT 20(1), 2014, 35-47
43
T. Dickmann/3D Tunnel Seismic Prediction: A Next Generation Tool.../JRMTT 20(1), 2014, 35-47
43
unconsolidated sediments to compact, non-fractured rock mass, respectively. In addition to this generally linear relation between static and dynamic moduli, a stress dependency had been observed and had led to a rather exponential relation (Van Heerden 1987). The VMR-technology of the TSP 303 system is making use of this exponential relation in order to guide the user in the comparison with dynamic and static moduli values.
Fig. 9 - Rock mechanical properties (top) characterising the fault zone shown in the longitudinal section
The total processing and analysis time of the 3D tunnel seismic prediction system TSP 303 is about three hours on the construction site. Comprehensive reports can be given to the contractor within valuable time. Since the geological risk zone are identified, the contactor in agreement with the engineer is able to decide, what measures are to be taken. Depending on the distance to the hazardous zone, he may decide to advance closer to the predicted zone. Once he has still got a safe range, he may carry out a shorter probe drilling to obtain evidence by the petrographical drilling profile. The confirmation may lead him to the decision of extensive roof bolting and/or pre-injection to treat the ground prior to excavation in order to stabilise the ground during excavation.
5. CASE STUDY OF 3D-TSP
In this case study, there were two objectives which the client of the project wanted to have investigated. Firstly, a geological prediction of minimum 100 m ahead of the tunnel face and secondly, a verification of the results of an existing probe drill. Since geology is known from an extrapolation approach from a parallel tunnel, TSP was requested to verify the appearance and characteristics of fault and fracture zones and their crossing to the planned tunnel axis. At the time of measurement, the geomechanical classification was class III-IV according to RMR rock mass rating with an unstable rock behaviour at the tunnel face.
Figure 11a summarizes the geological forecast based on the 30 m probe drill result between tunnel face at meter 57 and end of drill at meter 87. The on-going geological forecast represents the extrapolation of the encountered geology of the parallel tunnel until meter 182. The already excavated tunnel and the first 3 m of the probe drill is placed in a weathered volcanic breccia where the geomechanical rock conditions shows fair to poor rock mass quality (RMR classification III- IV). Between meter 60 and meter 75 a fault zone with decreased and poor rock mass quality (RMR classification III- IV) is embedded. At meter 75 the rock mass improves significantly and a change to good quality (RMR classification III- II) was found, although with a fractured contact zone of 4 m length until meter 79. The remaining section of the probe drill to meter 87 revealed volcanic

T. Dickmann/3D Tunnel Seismic Prediction: A Next Generation Tool.../JRMTT 20(1), 2014, 35-47
44
T. Dickmann/3D Tunnel Seismic Prediction: A Next Generation Tool.../JRMTT 20(1), 2014, 35-47
44
breccia. The further geological forecast, based on information of the parallel tunnel, doesn’t indicate any other tunnelling relevant or significant rock mass change, except a smaller 7 m long fracture zone included between meter 161 and meter 168.
Dripping water with low permeability of 1.25 l/s was present in the weathered volcanic breccia and fault zone between meter 45 and meter 75 and extends into the fractured contact zone up to meter 79. The subsequent volcanic breccia doesn’t show any presence of water and is considered to bedry to the area of the forecasted embedded fracture zone, where a low permeability might become possible again.
Fig. 10 - Full space perspective view of the cropped 3D velocity distribution (SH-wave) revealing fault and fracture zone
Figure 10 illustrates the SH-wave velocity distribution in a cropped display of a computed data cuboid of 200 x 50 x 50 metres in tunnelling direction and in each vertical and horizontal direction, respectively. The tunnel alignment is centred in the cuboid. The cropping reduces the display to velocities smaller than 2,050 m/s. Around the tunnel, SH-wave velocities of more than 2050 m/s exist and represent rock mass of weathered volcanic breccia. Just few meters in front of the tunnel face, a low velocity zone up-dipping and left striking and an extension of approx. 20m is indicated where highly fractured rock mass occurs. Behind this zone, the velocity increases and returns to values of good rock mass conditions. About 100 meters ahead of the tunnel face the velocity drops down again and a second low velocity zone becomes visible, almost cross-cut striking the prospective tunnel axis from approx. meter 160 to 170. Further ahead, intact rock mass returns to good conditions and retains till the end of the forecast range at meter 200.
With the combined velocity information of both P- and S-waves, further rock mechanical parameters of interest were being calculated using empirical relationships for the density. Figure 11b shows five graphs, which describe the predicted curve progression of the P-wave velocity, S-wave velocity, Vp/Vs ratio, Poisson ratio, Density and Dynamic Young’s modulus along the tunnel axis. The graphs are also colour shaded below their respective chart line. Figure 11c represents the longitudinal model view of the 3D-TSP result with reflectors and boundary shading according to Young’s modulus values. A colour change takes place at a reflector element extension from its location and orientation in space and its intersection point with the tunnel axis.
The measured reference velocity of the direct P-wave in the area of the 3D-TSP layout was 3,540 m/s (S-wave 2,050 m/s, Vp/Vs 1.73), corresponding to the fair to poor rock mass of the weathered volcanic rock. Beyond the tunnel face location at meter 60, the values of the mentioned parameters begin to decline. P-wave velocity (2,840 m/s) declines more than S-wave velocity (1,800 m/s) and both considerably show the fault zone extension until meter 75. Its relative low Vp/Vs ratio (1.60-

T. Dickmann/3D Tunnel Seismic Prediction: A Next Generation Tool.../JRMTT 20(1), 2014, 35-47
45
T. Dickmann/3D Tunnel Seismic Prediction: A Next Generation Tool.../JRMTT 20(1), 2014, 35-47
45
1.58) represents a zone of mostly unconsolidated breccia in a higher stress regime where water presence does not influence the shear wave, significantly.
Fig. 11 - a) Geological forecast with 30 m long probe drilling from tunnel face b) Rock property charts derived from TSP measurements c) TSP result with reflectors and boundary shading
according to Young’s modulus values in longitudinal view d) TSP geological model in plan view
A contact zone between 75m and 90m indicates a strong fractured but un-weathered volcanic breccia. Within this transition zone, the situation (Dynamic Young’s modulus) slowly changes to better and good condition until 90m, according to the decreasing fracturing that was being found. This better rock mass condition persists for about 70 m.

T. Dickmann/3D Tunnel Seismic Prediction: A Next Generation Tool.../JRMTT 20(1), 2014, 35-47
46
T. Dickmann/3D Tunnel Seismic Prediction: A Next Generation Tool.../JRMTT 20(1), 2014, 35-47
46
About 100 m ahead of the tunnel face, at meter 161, the P-wave velocity drops again slightly (from 3,760 m/s to 3,630 m/s), while the S-wave velocity drops stronger (from 2,150 m/s to 1,940 m/s) indicating a fracture zone forecasted for this area. This zone extends over about 5 m where the higher increasing Vp/Vs ratio (from 1.75 to 1.87) also indicates possible water bearing.
As a last step of interpretation, the TSP geological model is presented in Fig. 11d as the plan view of the rock mass changes along the tunnel axis. The geological borders are the start and end point of interrelated reflectors within same rock mass characteristics derived from the rock properties. The same model is shown in Fig. 12 in full 3D space.
Fig. 12 - 3D-TSP geological model highlighting fault and fracture zones in their environment of volcanic breccia
Conclusively, it is shown that the TSP prognosis is in very good agreement with the geological findings of the probe drill and the further geological forecast. The TSP result points out the fault zone and fracture zone as rock mass change critical for the tunnelling. In contrast to the probe drill, TSP found a widened fractured rock mass in the contact area between the fault zone and stable volcanic breccia. In addition, the result confirms the stable rock conditions after the excavation will have passed the fault zone and before entering the fracture zone.
6. CONCLUSIONS
Geophysical methods are an essential part of modern tunnelling, which enables continuous risk assessment and management during construction. They are meaningful and necessary tools in modern tunnelling and it is well noted that the tunnelling community continuously overcomes its scepticism and doubts about the potential of these methods. When exactly realising the optimal use of them, tunnelling will become more predictable in both costs and risks.
With the novel 3D tunnel seismic prediction system TSP 303 an important step is done in the geological 3D imaging that forms an essential integral part for the risk assessment during the tunnelling process. From the moment a tunnel is envisioned, geology strongly affects almost every major decision that must be made in the planning, design, and through into the construction of a tunnel and all available tools should be employed to reduce the levels of uncertainty encountered.
T. Dickmann/3D Tunnel Seismic Prediction: A Next Generation Tool.../JRMTT 20(1), 2014, 35-47
47
T. Dickmann/3D Tunnel Seismic Prediction: A Next Generation Tool.../JRMTT 20(1), 2014, 35-47
47
Generating and updating geological plausible models with means of continuous cost effective 3D-TSP applications during tunnelling is the right way to turn geological uncertainty into manageable risk.
References
Barton, N. (2006). Rock quality, seismic velocity, attenuation, and anisotropy, Taylor & Francis, London.
Bickel, S.H. and Natarajan, R.R. (1985). Plane-wave Q deconvolution, Geophysics, (50), pp. 1426-1439.
Dickmann, T. (2012). Predicting rock conditions ahead of the face, TunnelTalk, September, http://tunneltalk.com/TunnelTECH-Sept12-Seismic-prediction-of-rock-conditions-ahead-of-the-face.php
Kneib, G. and Leykam, A. (2004). Finite-difference modelling for tunnel seismology, Near Surface Geophysics, No. 2, pp. 71-93.
Van Heerden, W. L. (1987). General relations between static and dynamic moduli of rocks, Int. J. Rock Mech. Min. Sci. & Geomech. Abstr., 24(6), pp. 381-385.