3d systems corporation profit 58,522 68,937 ... repayment of capital lease obligations ... all...
TRANSCRIPT
1
UNITED STATES SECURITIES AND EXCHANGE COMMISSION
Washington, D.C. 20549 __________________
FORM 10-Q
QUARTERLY REPORT PURSUANT TO SECTION 13 OR 15(d) OF THE SECURITIES EXCHANGE ACT OF 1934
For the quarterly period ended September 30, 2017 OR
TRANSITION REPORT PURSUANT TO SECTION 13 OR 15(d) OF THE SECURITIES EXCHANGE ACT OF 1934 For the transition period from ____________to____________
Commission File No. 001-34220 __________________________
3D SYSTEMS CORPORATION (Exact name of Registrant as specified in its Charter)
_______________ _____________________________
DELAWARE 95-4431352 (State or Other Jurisdiction of Incorporation or Organization)
(I.R.S. Employer Identification No.)
333 THREE D SYSTEMS CIRCLE ROCK HILL, SOUTH CAROLINA 29730
(Address of Principal Executive Offices) (Zip Code)
(Registrant’s Telephone Number, Including Area Code): (803) 326-3900 __________________________
Indicate by check mark whether the registrant: (1) has filed all reports required to be filed by Section 13 or 15(d) of the Securities Exchange Act of 1934 during the preceding 12 months (or for such shorter period that the registrant was required to file such reports), and (2) has been subject to such filing requirements for the past 90 days. Yes No
Indicate by check mark whether the registrant has submitted electronically and posted on its corporate Web site, if any, every Interactive Data File required to be submitted and posted pursuant to Rule 405 of Regulation S-T (§232.405 of this chapter) during the preceding 12 months (or for such shorter period that the registrant was required to submit and post such files). Yes No
Indicate by check mark whether the registrant is a large accelerated filer, an accelerated filer, a non-accelerated filer, smaller reporting company, or an emerging growth company. See the definitions of “large accelerated filer,” “accelerated filer”, “smaller reporting company,” and “emerging growth company” in Rule 12b-2 of the Exchange Act. (Check one):
Large accelerated filer Accelerated filer Non-accelerated filer (Do not check if smaller reporting company) Smaller reporting company Emerging growth company
If an emerging growth company, indicate by check mark if the registrant has elected not to use the extended transition period for complying with any new or revised financial accounting standards provided pursuant to Section 7(a)(2)(B) of the Securities Act.
Indicate by check mark whether the registrant is a shell company (as defined in Rule 12b-2 of the Exchange Act.) Yes No
APPLICABLE ONLY TO CORPORATE ISSUERS:
Indicate the number of shares outstanding of each of the issuer’s classes of common stock, as of the latest practicable date. Shares of Common Stock, par value $0.001, outstanding as of October 27, 2017: 113,862,256

2
3D SYSTEMS CORPORATION
Quarterly Report on Form 10-Q for the Quarter and Nine Months Ended September 30, 2017
TABLE OF CONTENTS
PART I — FINANCIAL INFORMATION Item 1. Financial Statements. 3 Item 2. Management’s Discussion and Analysis of Financial Condition and Results of Operations. 19 Item 3. Quantitative and Qualitative Disclosures About Market Risk. 29 Item 4. Controls and Procedures. 29
PART II — OTHER INFORMATION Item 1. Legal Proceedings. 30 Item 1A. Risk Factors. 30 Item 2. Unregistered Sales of Equity Securities and Use of Proceeds. 30 Item 6. Exhibits. 31
Exhibit 31.1 Exhibit 31.2 Exhibit 32.1 Exhibit 32.2
3
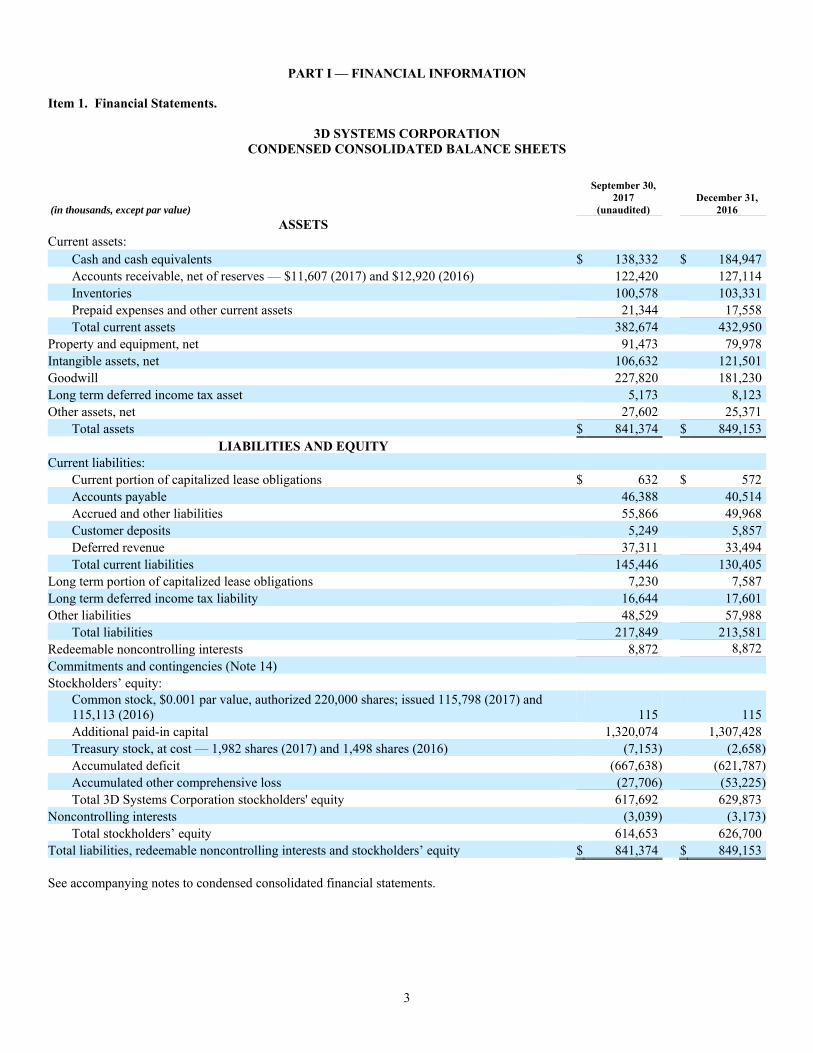
PART I — FINANCIAL INFORMATION Item 1. Financial Statements.
3D SYSTEMS CORPORATION CONDENSED CONSOLIDATED BALANCE SHEETS
(in thousands, except par value)
September 30, 2017
(unaudited) December 31,
2016
ASSETS Current assets:
Cash and cash equivalents $ 138,332 $ 184,947 Accounts receivable, net of reserves — $11,607 (2017) and $12,920 (2016) 122,420 127,114 Inventories 100,578 103,331 Prepaid expenses and other current assets 21,344 17,558 Total current assets 382,674 432,950
Property and equipment, net 91,473 79,978 Intangible assets, net 106,632 121,501 Goodwill 227,820 181,230 Long term deferred income tax asset 5,173 8,123 Other assets, net 27,602 25,371
Total assets $ 841,374 $ 849,153 LIABILITIES AND EQUITY
Current liabilities: Current portion of capitalized lease obligations $ 632 $ 572 Accounts payable 46,388 40,514 Accrued and other liabilities 55,866 49,968 Customer deposits 5,249 5,857 Deferred revenue 37,311 33,494 Total current liabilities 145,446 130,405
Long term portion of capitalized lease obligations 7,230 7,587 Long term deferred income tax liability 16,644 17,601 Other liabilities 48,529 57,988
Total liabilities 217,849 213,581 Redeemable noncontrolling interests 8,872 8,872 Commitments and contingencies (Note 14) Stockholders’ equity:
Common stock, $0.001 par value, authorized 220,000 shares; issued 115,798 (2017) and 115,113 (2016)
115 115
Additional paid-in capital 1,320,074 1,307,428 Treasury stock, at cost — 1,982 shares (2017) and 1,498 shares (2016) (7,153) (2,658) Accumulated deficit (667,638) (621,787) Accumulated other comprehensive loss (27,706) (53,225) Total 3D Systems Corporation stockholders' equity 617,692 629,873
Noncontrolling interests (3,039) (3,173) Total stockholders’ equity 614,653 626,700
Total liabilities, redeemable noncontrolling interests and stockholders’ equity $ 841,374 $ 849,153 See accompanying notes to condensed consolidated financial statements.

4
3D SYSTEMS CORPORATION CONDENSED CONSOLIDATED STATEMENTS OF OPERATIONS AND COMPREHENSIVE LOSS
(Unaudited)
Quarter Ended September 30,
Nine Months Ended September 30,
(in thousands, except per share amounts) 2017 2016 2017 2016
Revenue: Products $ 87,626 $ 94,543 $ 276,777 $ 280,406 Services 65,281 61,819 192,028 186,622
Total revenue 152,907 156,362 468,805 467,028 Cost of sales:
Products 59,467 56,321 150,769 146,682 Services 34,918 31,104 98,655 93,485
Total cost of sales 94,385 87,425 249,424 240,167 Gross profit 58,522 68,937 219,381 226,861 Operating expenses:
Selling, general and administrative 66,497 64,814 195,990 202,009 Research and development 24,360 26,140 71,661 67,345
Total operating expenses 90,857 90,954 267,651 269,354 Loss from operations (32,335) (22,017) (48,270) (42,493) Interest and other expense, net (1,257) (1,624) (123) (1,290) Loss before income taxes (33,592) (23,641) (48,393) (43,783) Provision (benefit) for income taxes 3,723 (2,214) 6,831 665 Net loss (37,315) (21,427) (55,224) (44,448) Less: net income (loss) attributable to noncontrolling interests 355 (214) 833 (799) Net loss attributable to 3D Systems Corporation $ (37,670) $ (21,213) $ (56,057) $ (43,649) Net loss per share available to 3D Systems Corporation common stockholders - basic and diluted $ (0.34) $ (0.19) $ (0.50) $ (0.39) Other comprehensive income:
Pension adjustments, net of taxes $ (24) $ 18 $ (105) $ 54 Foreign currency translation gain 4,904 4,282 25,785 5,567
Total other comprehensive income 4,880 4,300 25,680 5,621
Less foreign currency translation gain attributable to noncontrolling interests 26 22 161 68 Other comprehensive income attributable to 3D Systems Corporation 4,854 4,278 25,519 5,553 Comprehensive loss (32,435) (17,127) (29,544) (38,827)
Less comprehensive income (loss) attributable to noncontrolling interests 381 (192) 994 (731)
Comprehensive loss attributable to 3D Systems Corporation $ (32,816) $ (16,935) $ (30,538) $ (38,096) See accompanying notes to condensed consolidated financial statements.

5
3D SYSTEMS CORPORATION
CONDENSED CONSOLIDATED STATEMENTS OF CASH FLOWS (Unaudited)
Nine Months Ended September 30,
(In thousands) 2017 2016 Cash flows from operating activities:
Net loss $ (55,224) $ (44,448) Adjustments to reconcile net loss to net cash provided by operating activities: Depreciation and amortization 46,146 45,731 Stock-based compensation 21,084 28,405 Lower of cost or market adjustment 12,883 10,723 Provision for bad debts 1,297 1,488 Provision for (benefit of) deferred income taxes 1,674 (5,464) Impairment of assets 324 8,590 Changes in operating accounts, net of acquisitions:
Accounts receivable 10,777 36,357 Inventories (13,959) (26,236) Prepaid expenses and other current assets (2,939) (1,619) Accounts payable 3,463 (9,938) Accrued and other current liabilities (4,734) (10,841) Deferred revenue 2,869 1,763
All other operating activities (5,985) 3,729 Net cash provided by operating activities 17,676 38,240
Cash flows from investing activities: Cash paid for acquisitions, net of cash assumed (36,541) — Purchases of property and equipment (21,072) (12,014) Additions to license and patent costs (875) (790) Other investing activities (2,350) (1,000) Proceeds from disposition of property and equipment 271 —
Net cash used in investing activities (60,567) (13,804) Cash flows from financing activities:
Payments on earnout consideration (3,206) — Payments related to net-share settlement of stock-based compensation (4,494) (1,507) Repayment of capital lease obligations (297) (786)
Net cash used in financing activities (7,997) (2,293) Effect of exchange rate changes on cash and cash equivalents 4,273 1,572 Net (decrease) increase in cash and cash equivalents (46,615) 23,715 Cash and cash equivalents at the beginning of the period 184,947 155,643 Cash and cash equivalents at the end of the period $ 138,332 $ 179,358 Cash interest payments $ 378 $ 633 Cash income tax payments, net $ 4,715 $ 8,040 Transfer of equipment from inventory to property and equipment, net (a) $ 8,964 $ 9,395 Transfer of equipment to inventory from property and equipment, net (b) $ 364 $ 349 Stock issued for acquisitions $ 3,208 $ —
(a) Inventory is transferred from inventory to property and equipment at cost when the Company requires additional machines for training or demonstration or for placement into on-demand manufacturing services locations.
(b) In general, an asset is transferred from property and equipment, net, into inventory at its net book value when the Company has identified a potential sale for a used machine.
See accompanying notes to condensed consolidated financial statements.

6
3D SYSTEMS CORPORATION CONDENSED CONSOLIDATED STATEMENT OF EQUITY
(Unaudited)
Common Stock Treasury Stock
(In thousands, except par value) Shares
Par Value $0.001
Additional Paid In Capital Shares Amount
Accumulated Deficit
Accumulated Other Comprehensive
Loss
Total 3D Systems Corporation
Stockholders' Equity
Equity Attributable to Noncontrolling
Interests
Total Stockholders'
Equity
Balance at December 31, 2016 115,113 $ 115 $ 1,307,428 1,498 $ (2,658) $ (621,787) $ (53,225) $ 629,873 $ (3,173) $ 626,700
Issuance (repurchase) of stock 493 — — 484 (4,495) — — (4,495) — (4,495)
Issuance of stock for acquisitions 192 — 3,208 — — — — 3,208 — 3,208
Purchase of subsidiary shares from noncontrolling interest
— — (1,440) — — — 50 (1,390) (860) (2,250)
Cumulative impact of change in accounting policy
— — (10,206) — — 10,206 — — — —
Stock-based compensation expense — — 21,084 — — — — 21,084 — 21,084
Net income (loss) — — — — — (56,057) — (56,057) 833 (55,224)
Pension adjustment — — — — — — (105) (105) — (105)
Foreign currency translation adjustment — — — — — — 25,574 25,574 161 25,735
Balance at September 30, 2017 115,798 $ 115 $ 1,320,074 1,982 $ (7,153) $ (667,638) $ (27,706) $ 617,692 $ (3,039) $ 614,653
Common Stock Treasury Stock
(In thousands, except par value) Shares
Par Value $0.001
Additional Paid In Capital Shares Amount
Accumulated Deficit
Accumulated Other Comprehensive
Loss
Total 3D Systems Corporation
Stockholders' Equity
Equity Attributable to Noncontrolling
Interests
Total Stockholders'
Equity
Balance at December 31, 2015 113,115 $ 113 $ 1,279,738 892 $ (1,026) $ (583,368) $ (39,548) $ 655,909 $ (1,263) $ 654,646
Issuance (repurchase) of stock 1,186 1 (1,240) 438 (268) — — (1,507) — (1,507)
Stock-based compensation expense — — 28,405 — — — — 28,405 — 28,405
Net loss — — — — — (43,649) — (43,649) (799) (44,448)
Pension adjustment — — — — — — 54 54 — 54
Foreign currency translation adjustment — — — — — — 5,499 5,499 68 5,567
Balance at September 30, 2016 114,301 $ 114 $ 1,306,903 1,330 $ (1,294) $ (627,017) $ (33,995) $ 644,711 $ (1,994) $ 642,717
See accompanying notes to condensed consolidated financial statements.

7
3D SYSTEMS CORPORATION
NOTES TO THE CONDENSED CONSOLIDATED FINANCIAL STATEMENTS (Unaudited)
(1) Basis of Presentation The accompanying unaudited condensed consolidated financial statements include the accounts of 3D Systems Corporation and its subsidiaries (collectively, the “Company”). All significant intercompany transactions and balances have been eliminated in consolidation. The unaudited condensed consolidated financial statements have been prepared in accordance with generally accepted accounting principles in the United States of America (“GAAP”) and the rules and regulations of the Securities and Exchange Commission (“SEC”) applicable to interim reports. Accordingly, they do not include all the information and notes required by GAAP for complete financial statements and should be read in conjunction with the audited financial statements included in the Company’s Annual Report on Form 10-K for the year ended December 31, 2016 (“Form 10-K”).
In the opinion of management, the unaudited condensed consolidated financial statements contain all adjustments, consisting of adjustments of a normal recurring nature, necessary to present fairly the financial position, results of operations and cash flows for the periods presented. The results of operations for the quarter and nine months ended September 30, 2017 are not necessarily indicative of the results to be expected for the full year. The preparation of financial statements in accordance with GAAP requires management to make estimates and assumptions that affect the amounts reported in the financial statements. Actual results may differ from those estimates and assumptions. Certain prior period amounts presented in the condensed consolidated financial statements and accompanying footnotes have been reclassified to conform to current year presentation. All dollar amounts presented in the accompanying footnotes are presented in thousands, except for per share information. Recently Adopted Accounting Pronouncements In the first quarter of 2017, the Company adopted Financial Accounting Standards Board (“FASB”) Accounting Standards Update (“ASU”) No. 2016-09, “Compensation – Stock Compensation (Topic 718), Improvements to Employee Share-Based Payment Accounting”. The following summarizes the effects of the adoption on the Company’s unaudited condensed consolidated financial statements:
Forfeitures - Prior to adoption, share-based compensation expense was recognized on a straight-line basis, net of estimated forfeitures, such that expense was recognized only for share-based awards that were expected to vest. A forfeiture rate was estimated annually and revised, if necessary, in subsequent periods if actual forfeitures differed from initial estimates. Upon adoption, the Company no longer applies a forfeiture rate and instead accounts for forfeitures as they occur. The change was applied on a modified retrospective basis resulting in a cumulative effect adjustment to retained earnings of $10,206 as of January 1, 2017. Prior periods were not adjusted. Statement of Cash Flows - The Company historically accounted for excess tax benefits related to share-based compensation on the Statement of Cash Flows as a financing activity. Upon adoption of this standard, excess tax benefits are classified along with other income tax cash flows as an operating activity. The Company has elected to adopt this portion of the standard on a prospective basis beginning in 2017. Prior periods were not adjusted. Income taxes - Upon adoption of this standard, all excess tax benefits and tax deficiencies related to share-based compensation are recognized as income tax expense or benefit in the income statement. The tax effects of exercised or vested awards are treated as discrete items in the reporting period in which they occur. Prior periods were not adjusted.
Recently Issued Accounting Pronouncements In August 2017, the FASB issued ASU No. 2017-12, “Derivatives and Hedging (Topic 815): Targeted Improvements to Accounting for Hedging Activities” (“ASU 2017-12”), in order to create more transparency around how economic results are presented within both the financial statements and in the footnotes and to better align the results of cash flow and fair value hedge accounting with risk management activities. ASU 2017-12 is effective for fiscal years beginning after December 15, 2018, with early adoption permitted. The Company is currently in the process of evaluating when it will adopt ASU 2017-12 and its impact on its consolidated financial statements. In May 2017, the FASB issued ASU No. 2017-09, “Compensation – Stock Compensation (Topic 718): Scope of Modification Accounting” (“ASU 2017-09”), in an effort to reduce diversity and clarify what constitutes a modification, as it relates to the change in terms or conditions of a share-based payment award. According to ASU 2017-09, the Company should account for the effects of a modification unless all of the following are met: (1) the fair value of the modified award is the same as the fair value the original award immediately before the original award is modified, (2) the vesting conditions of the modified award are the same as the vesting conditions

8
of the original award immediately before the original award is modified, and (3) the classification of the modified award as an equity instrument or a liability instrument is the same as the classification of the original award immediately before the original award is modified. The amendments in ASU 2017-09 are effective for annual periods, and interim periods within those annual periods, beginning after December 15, 2017, with early adoption permitted. The Company will adopt ASU 2017-09 beginning January 1, 2018 and does not expect the implementation of this guidance to have a material effect on its consolidated financial statements. In March 2017, the FASB issued ASU No. 2017-07, “Compensation – Retirement Benefits (Topic 715): Improving the Presentation of Net Periodic Pension Cost and Net Periodic Postretirement Benefit Cost” (“ASU 2017-07”), which standardizes the presentation of net benefit cost in the income statement and on the components eligible for capitalization in assets. ASU 2017-07 is effective for fiscal years beginning after December 15, 2017, including interim periods within those annual periods. The amendments in ASU 2017-07 should be applied retrospectively for the presentation of the service cost component and the other components of net periodic pension cost and net periodic postretirement benefit cost in the income statement and prospectively, on and after the effective date, for the capitalization of the service cost component of net periodic pension cost and net periodic postretirement benefit in assets. The Company will adopt ASU 2017-07 in the first quarter of 2018 and does not expect the implementation of this guidance to have a material effect on its consolidated financial statements. In January 2017, the FASB issued ASU No. 2017-04, “Intangibles - Goodwill and Other (Topic 350): Simplifying the Test for Goodwill Impairment” (“ASU 2017-04”), which eliminates the performance of Step 2 from the goodwill impairment test. In performing its annual or interim impairment testing, an entity will instead compare the fair value of the reporting unit with its carrying amount and recognize any impairment charge for the amount by which the carrying amount exceeds the reporting unit’s fair value. Additionally, an entity should consider income tax effects from any tax deductible goodwill on the carrying amount of the reporting unit when measuring the goodwill impairment loss. The standard is effective for fiscal years beginning after December 15, 2019. Early adoption is permitted for interim or annual impairment tests performed on testing dates after January 1, 2017. The Company is currently in the process of evaluating when it will adopt ASU 2017-04 and its impact on its consolidated financial statements. In October 2016, the FASB issued ASU No. 2016-16, “Income Taxes (Topic 740): Intra-Entity Transfers of Assets Other Than Inventory” (“ASU 2016-16”). ASU 2016-16 permits the recognition of income tax consequences related to an intra-entity transfer of an asset other than inventory when the transfer occurs. It is effective for annual reporting periods beginning after December 15, 2017 and interim periods within those annual periods. Early adoption is permitted for any interim or annual period. The Company is currently in the process of evaluating the impact of adoption of ASU 2016-16 on its consolidated financial statements. In August 2016, the FASB issued ASU No. 2016-15, “Statement of Cash Flows (Topic 230) – Classification of Certain Cash Receipts and Cash Payments” (“ASU 2016-15”). With the objective of reducing the existing diversity in practice, ASU 2016-15 addresses the manner in which certain cash receipts and cash payments are presented and classified in the statement of cash flows. ASU 2016-15 is effective for annual reporting periods beginning after December 15, 2017. The amendments should be applied retrospectively with earlier application permitted as of the beginning of an interim or annual reporting period. The Company expects that the implementation of this guidance will not have a material effect on its consolidated financial statements. In February 2016, the FASB issued ASU No. 2016-02, “Leases (Topic 842)” (“ASU 2016-02”). ASU 2016-02 requires lessees to recognize assets and liabilities arising from operating leases on the balance sheet. It is effective for annual reporting periods beginning after December 15, 2018, including interim periods within those fiscal years. Though still evaluating the impact of ASU 2016-02, the Company expects changes to its balance sheet due to the recognition of right-of-use assets and lease liabilities related to its real estate leases, but it does not anticipate material impacts to its results of operations or liquidity. In May 2014, the FASB issued ASU 2014-09, “Revenue from Contracts with Customers” (“ASU 2014-09”). The ASU is a comprehensive new revenue recognition model that requires a company to recognize revenue to depict the transfer of goods or services to customers in an amount that reflects the consideration to which the entity expects to be entitled in exchange for those goods or services. In August 2015, the FASB issued ASU 2015-14, which deferred the effective date of the ASU to fiscal years beginning after December 15, 2017, and interim periods within those fiscal years. Companies may use either a full retrospective or a modified retrospective approach to adopt this ASU. The Company intends to use the modified retrospective method of adoption effective January 1, 2018, the cumulative effect of which would be recognized at the date of initial application with an adjustment to the opening balance of retained earnings. Under the modified retrospective approach, prior periods are not restated; however, it effectively requires a company to apply both the new revenue standard and the previous revenue guidance in the year of adoption. During the year of adoption, both quantitative and qualitative disclosures are required as to the impact of the new standard compared to the previous revenue guidance. The Company has performed an assessment of the impact that the new standard will have on its financial statements. The assessment included the identification of key revenue streams and a review of a sample contracts across the various businesses and geographies. The assessment also identified certain potential accounting differences that may arise from the application of the new standard. The
9
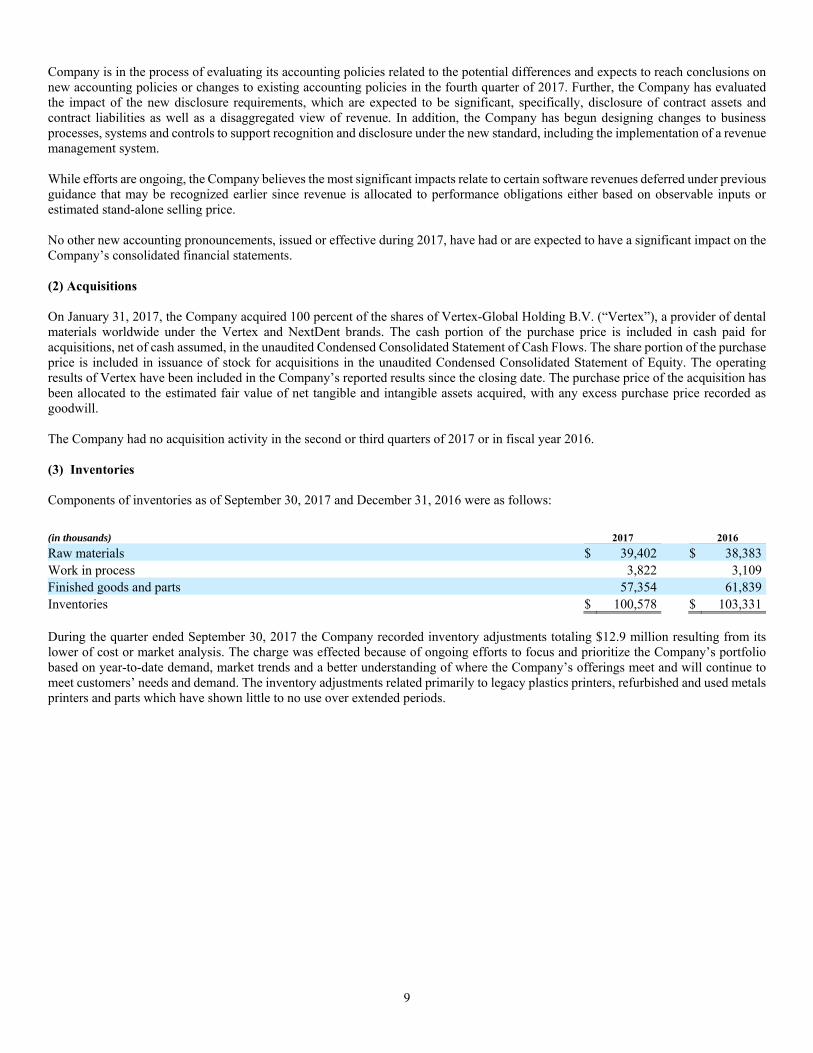
Company is in the process of evaluating its accounting policies related to the potential differences and expects to reach conclusions on new accounting policies or changes to existing accounting policies in the fourth quarter of 2017. Further, the Company has evaluated the impact of the new disclosure requirements, which are expected to be significant, specifically, disclosure of contract assets and contract liabilities as well as a disaggregated view of revenue. In addition, the Company has begun designing changes to business processes, systems and controls to support recognition and disclosure under the new standard, including the implementation of a revenue management system. While efforts are ongoing, the Company believes the most significant impacts relate to certain software revenues deferred under previous guidance that may be recognized earlier since revenue is allocated to performance obligations either based on observable inputs or estimated stand-alone selling price. No other new accounting pronouncements, issued or effective during 2017, have had or are expected to have a significant impact on the Company’s consolidated financial statements. (2) Acquisitions On January 31, 2017, the Company acquired 100 percent of the shares of Vertex-Global Holding B.V. (“Vertex”), a provider of dental materials worldwide under the Vertex and NextDent brands. The cash portion of the purchase price is included in cash paid for acquisitions, net of cash assumed, in the unaudited Condensed Consolidated Statement of Cash Flows. The share portion of the purchase price is included in issuance of stock for acquisitions in the unaudited Condensed Consolidated Statement of Equity. The operating results of Vertex have been included in the Company’s reported results since the closing date. The purchase price of the acquisition has been allocated to the estimated fair value of net tangible and intangible assets acquired, with any excess purchase price recorded as goodwill. The Company had no acquisition activity in the second or third quarters of 2017 or in fiscal year 2016. (3) Inventories Components of inventories as of September 30, 2017 and December 31, 2016 were as follows:
(in thousands) 2017 2016
Raw materials $ 39,402 $ 38,383 Work in process 3,822 3,109 Finished goods and parts 57,354 61,839 Inventories $ 100,578 $ 103,331 During the quarter ended September 30, 2017 the Company recorded inventory adjustments totaling $12.9 million resulting from its lower of cost or market analysis. The charge was effected because of ongoing efforts to focus and prioritize the Company’s portfolio based on year-to-date demand, market trends and a better understanding of where the Company’s offerings meet and will continue to meet customers’ needs and demand. The inventory adjustments related primarily to legacy plastics printers, refurbished and used metals printers and parts which have shown little to no use over extended periods.

10
(4) Property and Equipment Property and equipment, net, as of September 30, 2017 and December 31, 2016 were as follows:
(in thousands) 2017 2016 Useful Life (in years)
Land $ 903 $ 903 N/A Building 11,276 11,122 25-30 Machinery and equipment 128,614 108,682 2-7 Capitalized software 8,809 8,651 3-5 Office furniture and equipment 4,606 3,130 1-5 Leasehold improvements 30,043 24,423 Life of lease (a) Rental equipment 349 144 5 Construction in progress 10,947 7,760 N/A Total property and equipment 195,547 164,815 Less: Accumulated depreciation and amortization (104,074) (84,837) Total property and equipment, net $ 91,473 $ 79,978
(a) Leasehold improvements are amortized on a straight-line basis over the shorter of (i) their estimated useful lives and (ii) the estimated or contractual life of the related lease.
Depreciation expense on property and equipment was $6,497 and $18,767 for the quarter and nine months ended September 30, 2017, respectively, compared to $6,176 and $18,386 for the quarter and nine months ended September 30, 2016, respectively. (5) Intangible Assets Intangible assets, net, other than goodwill, as of September 30, 2017 and December 31, 2016 were as follows:
2017 2016
(in thousands) Gross Accumulated Amortization Net Gross
Accumulated Amortization Net
Useful Life (in years)
Weighted Average
Useful Life Remaining (in years)
Intangible assets with finite lives: Customer relationships $ 106,674 $ (56,538) $ 50,136 $ 99,067 $ (46,252) $ 52,815 1-14 6 Acquired technology 55,148 (37,324) 17,824 52,881 (27,543) 25,338 1-16 4 Trade names 27,764 (16,322) 11,442 28,110 (16,015) 12,095 1-8 5 Patent costs 17,135 (6,794) 10,341 16,263 (5,873) 10,390 1-20 9 Trade secrets 19,443 (11,016) 8,427 19,134 (9,383) 9,751 7 4 Acquired patents 16,655 (11,556) 5,099 16,965 (10,674) 6,291 1-6 4 Other 25,683 (22,320) 3,363 23,431 (18,610) 4,821 2-4 2
Total intangible assets $ 268,502 $ (161,870) $ 106,632 $ 255,851 $ (134,350) $ 121,501 1-20 4 Amortization expense related to intangible assets was $8,845 and $26,661 for the quarter and nine months ended September 30, 2017, respectively, compared to $8,857 and $26,536 for the quarter and nine months ended September 30, 2016, respectively.

11
(6) Accrued and Other Liabilities Accrued liabilities as of September 30, 2017 and December 31, 2016 were as follows:
(in thousands) 2017 2016
Compensation and benefits $ 19,075 $ 22,771 Arbitration award 11,282 — Accrued taxes 9,106 9,831 Vendor accruals 7,297 8,231 Accrued earnouts related to acquisitions 3,971 3,238 Accrued other 2,726 2,956 Royalties payable 1,707 2,092 Accrued professional fees 664 810 Accrued interest 38 39
Total $ 55,866 $ 49,968 Other liabilities as of September 30, 2017 and December 31, 2016 were as follows:
(in thousands) 2017 2016
Long term employee indemnity $ 13,646 $ 11,152 Arbitration award — 11,282 Defined benefit pension obligation 8,576 7,613 Other long term liabilities 7,775 5,726 Long term tax liability 7,124 7,183 Long term deferred revenue 7,062 7,464 Long term earnouts related to acquisitions 4,346 7,568
Total $ 48,529 $ 57,988
(7) Hedging Activities and Financial Instruments
The Company conducts business in various countries using both the functional currencies of those countries and other currencies to effect cross border transactions. As a result, the Company is subject to the risk that fluctuations in foreign exchange rates between the dates that those transactions are entered into and their respective settlement dates will result in a foreign exchange gain or loss. When practicable, the Company endeavors to match assets and liabilities in the same currency on its balance sheet and those of its subsidiaries in order to reduce these risks. When appropriate, the Company enters into foreign currency contracts to hedge exposures arising from those transactions. The Company has elected not to prepare and maintain the documentation to qualify for hedge accounting treatment under Accounting Standards Codification (“ASC”) 815, “Derivatives and Hedging,” and therefore, all gains and losses (realized or unrealized) are recognized in “Interest and other expense, net” in the condensed consolidated statements of operations and comprehensive loss. Depending on their fair value at the end of the reporting period, derivatives are recorded either in prepaid expenses and other current assets or in accrued liabilities on the condensed consolidated balance sheet. The Company had $39,029 in notional foreign exchange contracts outstanding as of September 30, 2017, for which the fair value was not material. No foreign exchange contracts were outstanding as of December 31, 2016. The Company translates foreign currency balance sheets from each international businesses' functional currency (generally the respective local currency) to U.S. dollars at end-of-period exchange rates, and statements of earnings at average exchange rates for each period. The resulting foreign currency translation adjustments are a component of other comprehensive income (loss). The Company does not hedge the fluctuation in reported revenue and earnings resulting from the translation of these international operations' results into U.S. dollars. The impact of translating the Company’s non-U.S. operations’ revenue and earnings into U.S. dollars was not material to the Company’s results of operations for the quarters and nine months ended September 30, 2017 and 2016.
12
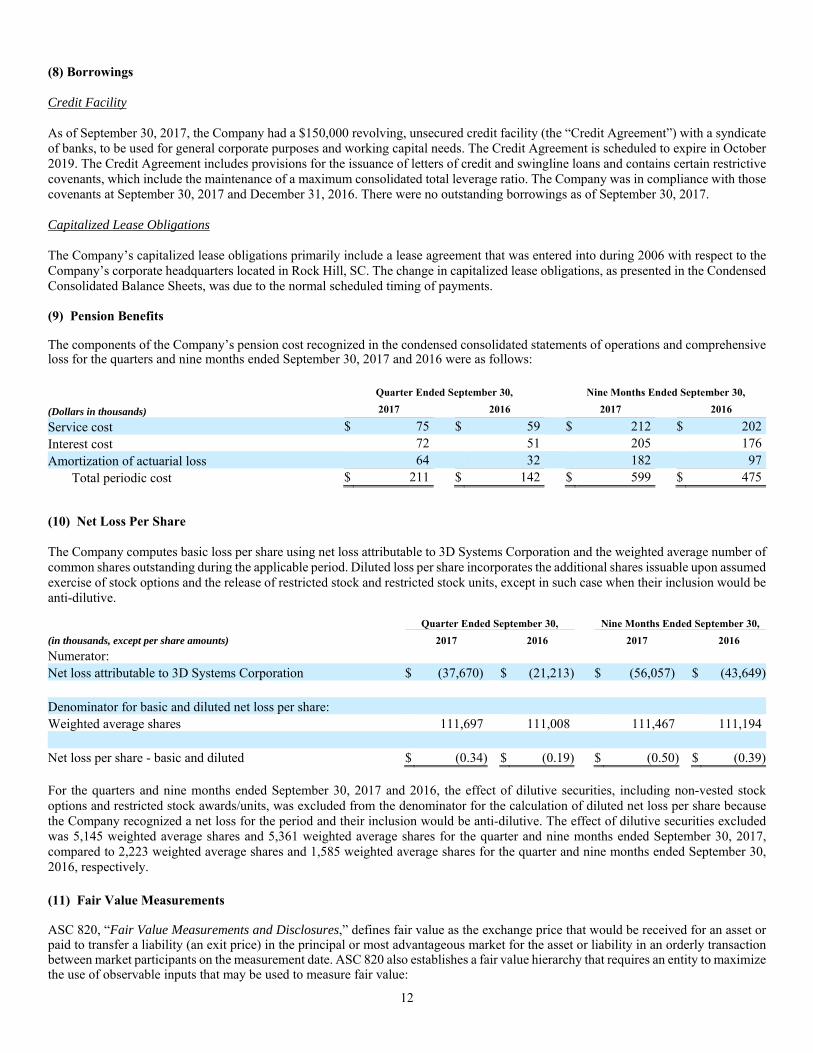
(8) Borrowings Credit Facility As of September 30, 2017, the Company had a $150,000 revolving, unsecured credit facility (the “Credit Agreement”) with a syndicate of banks, to be used for general corporate purposes and working capital needs. The Credit Agreement is scheduled to expire in October 2019. The Credit Agreement includes provisions for the issuance of letters of credit and swingline loans and contains certain restrictive covenants, which include the maintenance of a maximum consolidated total leverage ratio. The Company was in compliance with those covenants at September 30, 2017 and December 31, 2016. There were no outstanding borrowings as of September 30, 2017. Capitalized Lease Obligations The Company’s capitalized lease obligations primarily include a lease agreement that was entered into during 2006 with respect to the Company’s corporate headquarters located in Rock Hill, SC. The change in capitalized lease obligations, as presented in the Condensed Consolidated Balance Sheets, was due to the normal scheduled timing of payments. (9) Pension Benefits The components of the Company’s pension cost recognized in the condensed consolidated statements of operations and comprehensive loss for the quarters and nine months ended September 30, 2017 and 2016 were as follows:
Quarter Ended September 30, Nine Months Ended September 30,
(Dollars in thousands) 2017 2016 2017 2016
Service cost $ 75 $ 59 $ 212 $ 202 Interest cost 72 51 205 176 Amortization of actuarial loss 64 32 182 97
Total periodic cost $ 211 $ 142 $ 599 $ 475
(10) Net Loss Per Share The Company computes basic loss per share using net loss attributable to 3D Systems Corporation and the weighted average number of common shares outstanding during the applicable period. Diluted loss per share incorporates the additional shares issuable upon assumed exercise of stock options and the release of restricted stock and restricted stock units, except in such case when their inclusion would be anti-dilutive.
Quarter Ended September 30, Nine Months Ended September 30,
(in thousands, except per share amounts) 2017 2016 2017 2016
Numerator: Net loss attributable to 3D Systems Corporation $ (37,670) $ (21,213) $ (56,057) $ (43,649) Denominator for basic and diluted net loss per share: Weighted average shares 111,697 111,008 111,467 111,194 Net loss per share - basic and diluted $ (0.34) $ (0.19) $ (0.50) $ (0.39) For the quarters and nine months ended September 30, 2017 and 2016, the effect of dilutive securities, including non-vested stock options and restricted stock awards/units, was excluded from the denominator for the calculation of diluted net loss per share because the Company recognized a net loss for the period and their inclusion would be anti-dilutive. The effect of dilutive securities excluded was 5,145 weighted average shares and 5,361 weighted average shares for the quarter and nine months ended September 30, 2017, compared to 2,223 weighted average shares and 1,585 weighted average shares for the quarter and nine months ended September 30, 2016, respectively.
(11) Fair Value Measurements ASC 820, “Fair Value Measurements and Disclosures,” defines fair value as the exchange price that would be received for an asset or paid to transfer a liability (an exit price) in the principal or most advantageous market for the asset or liability in an orderly transaction between market participants on the measurement date. ASC 820 also establishes a fair value hierarchy that requires an entity to maximize the use of observable inputs that may be used to measure fair value:

13
Level 1 - Quoted prices in active markets for identical assets or liabilities;
Level 2 - Observable inputs other than Level 1 prices, such as quoted prices for similar assets or liabilities, quoted prices in
markets that are not active, or other inputs that are observable or can be corroborated by observable market data for substantially the full term of the assets or liabilities; or
Level 3 - Unobservable inputs that are supported by little or no market activity and that are significant to the fair value of the
assets or liabilities. For the Company, the above standard applies to cash equivalents and earnout consideration. The Company utilizes the market approach to measure fair value for its financial assets and liabilities. The market approach uses prices and other relevant information generated by market transactions involving identical or comparable assets or liabilities. Assets and liabilities measured at fair value on a recurring basis are summarized below:
Fair Value Measurements as of September 30, 2017
(in thousands) Level 1 Level 2 Level 3 Total
Description
Cash equivalents (a) $ 18,224 $ — $ — $ 18,224
Earnout consideration (b) $ — $ — $ 8,317 $ 8,317
Fair Value Measurements as of December 31, 2016
(in thousands) Level 1 Level 2 Level 3 Total
Description
Cash equivalents (a) $ 25,206 $ — $ — $ 25,206
Earnout consideration (b) $ — $ — $ 10,806 $ 10,806
(a) Cash equivalents include funds held in money market instruments and are reported at their current carrying value, which approximates fair value due to the short-term nature of these instruments and are included in cash and cash equivalents in the consolidated balance sheet.
(b) The fair value of the earnout consideration, which is based on the present value of the expected future payments to be made to the sellers of the acquired businesses, was derived by analyzing the future performance of the acquired businesses using the earnout formula and performance targets specified in each purchase agreement and adjusting those amounts to reflect the ability of the acquired entities to achieve the stated targets. Given the significance of the unobservable inputs, the valuations are classified in Level 3 of the fair value hierarchy. The change in earnout consideration reflects a $3,206 payment, partially offset by $717 of accretion.
The Company did not have any transfers of assets and liabilities between Level 1, Level 2 and Level 3 of the fair value measurement hierarchy during the quarter or nine months ended September 30, 2017. In addition to the assets and liabilities included in the above table, certain of our assets and liabilities are to be initially measured at fair value on a non-recurring basis. This includes goodwill and other intangible assets measured at fair value for impairment assessment, in addition to redeemable noncontrolling interests. For additional discussion, refer to “Management’s Discussion and Analysis of Financial Condition and Results of Operations – Critical Accounting Policies and Significant Estimates” in the Company’s Form 10-K. (12) Income Taxes For the quarter and nine months ended September 30, 2017, the Company recorded provisions of $3,723 and $6,831, respectively, resulting in effective tax rates of 11.1% and 14.1%, respectively. For the quarter and nine months ended September 30, 2016, the Company recorded a benefit of $2,214 and a provision of $665, respectively, resulting in effective tax rates of 9.4% and 1.5%, respectively.

14
The Company has not provided for any taxes on the unremitted earnings of its foreign subsidiaries, as the Company intends to permanently reinvest all such earnings outside of the U.S. We believe a calculation of the deferred tax liability associated with these undistributed earnings is impracticable. Tax years 2003 through 2015 remain subject to examination by the U.S. Internal Revenue Service, with most of the years open to examination due to the generation and utilization of various tax credits. The Company files income tax returns (which are open to examination beginning in the year shown in parentheses) in Australia (2012), Belgium (2013), Brazil (2011), China (2015), France (2014), Germany (2013), India (2013), Israel (2012), Italy (2011), Japan (2012), Korea (2012), Mexico (2011), Netherlands (2011), Switzerland (2011), the United Kingdom (2015) and Uruguay (2011). (13) Segment Information The Company operates in one reportable business segment. The Company conducts its business through various offices and facilities located throughout the Asia Pacific region (Australia, China, India, Japan and Korea), EMEA (Belgium, France, Germany, Israel, Italy, the Netherlands, Switzerland and the United Kingdom), Latin America (Brazil, Mexico and Uruguay) and the United States. The Company has historically disclosed summarized financial information for the geographic areas of operations as if they were segments in accordance with ASC 280, “Segment Reporting.” Financial information concerning the Company’s geographical locations is based on the location of the selling entity. Such summarized financial information concerning the Company’s geographical operations is shown in the following tables:
Quarter Ended September 30, Nine Months Ended September 30,
(in thousands) 2017 2016 2017 2016 Revenue from unaffiliated customers:
United States $ 75,402 $ 84,768 $ 234,195 $ 246,150 Other Americas 3,534 2,122 8,300 7,831 Germany 20,761 16,796 60,908 56,225 Other EMEA 31,696 26,948 97,956 83,704 Asia Pacific 21,514 25,728 67,446 73,118
Total revenue $ 152,907 $ 156,362 $ 468,805 $ 467,028 Quarter Ended September 30, Nine Months Ended September 30,
(in thousands) 2017 2016 2017 2016 Revenue by class of product and service:
Products $ 48,227 $ 56,484 $ 150,681 $ 163,301 Materials 39,399 38,059 126,096 117,105 Services 65,281 61,819 192,028 186,622
Total revenue $ 152,907 $ 156,362 $ 468,805 $ 467,028
Quarter Ended September 30, 2017
Intercompany Sales to
(in thousands)
Americas Germany Other EMEA Asia Pacific Total
Americas $ 554 $ 9,439 $ 2,325 $ 5,390 $ 17,708 Germany 945 — 1,645 259 2,849 Other EMEA 15,112 2,006 635 726 18,479 Asia Pacific 613 — 8 772 1,393 Total intercompany sales $ 17,224 $ 11,445 $ 4,613 $ 7,147 $ 40,429 Quarter Ended September 30, 2016
Intercompany Sales to
(in thousands)
Americas Germany Other EMEA Asia Pacific Total
Americas $ 733 $ 6,163 $ 2,244 $ 6,322 $ 15,462 Germany 240 — 976 105 1,321 Other EMEA 14,972 562 1,236 1,053 17,823 Asia Pacific 606 — 113 1,053 1,772 Total intercompany sales $ 16,551 $ 6,725 $ 4,569 $ 8,533 $ 36,378

15
Nine Months Ended September 30, 2017
Intercompany Sales to
(in thousands)
Americas Germany Other EMEA Asia Pacific Total
Americas $ 1,452 $ 27,147 $ 7,267 $ 14,243 $ 50,109 Germany 1,434 — 5,347 261 7,042 Other EMEA 49,327 3,951 3,716 2,639 59,633 Asia Pacific 1,492 — 165 2,921 4,578 Total intercompany sales $ 53,705 $ 31,098 $ 16,495 $ 20,064 $ 121,362 Nine Months Ended September 30, 2016
Intercompany Sales to
(in thousands)
Americas Germany Other EMEA Asia Pacific Total
Americas $ 2,011 $ 21,377 $ 8,313 $ 15,882 $ 47,583 Germany 3,604 — 2,254 169 6,027 Other EMEA 44,946 1,740 3,601 3,301 53,588 Asia Pacific 2,270 — 132 2,859 5,261 Total intercompany sales $ 52,831 $ 23,117 $ 14,300 $ 22,211 $ 112,459
Quarter Ended September 30, Nine Months Ended September 30,
(in thousands) 2017 2016 2017 2016 Loss from operations:
Americas $ (34,255) $ (21,525) $ (63,344) $ (40,458) Germany 193 2,761 1,978 7,732 Other EMEA (1,775) (11,043) 481 (27,225) Asia Pacific 3,891 8,434 14,064 19,537
Subtotal (31,946) (21,373) (46,821) (40,414) Intercompany elimination (389) (644) (1,449) (2,079)
Total $ (32,335) $ (22,017) $ (48,270) $ (42,493)
(14) Commitments and Contingencies The Company leases certain of its facilities and equipment under non-cancelable operating leases. For the quarter and nine months ended September 30, 2017, rent expense under operating leases was $4,009 and $11,461, respectively, compared to $3,542 and $9,717 for the quarter and nine months ended September 30, 2016, respectively. Certain of the Company’s acquisition agreements contain earnout provisions under which the sellers of the acquired businesses can earn additional amounts. The total liability recorded for these earnouts at September 30, 2017 and December 31, 2016 was $8,317 and $10,806, respectively. See Note 6. Put Options Owners of interests in a certain subsidiary have the right in certain circumstances to require the Company to acquire either a portion of or all of the remaining ownership interests held by them. The owners’ ability to exercise any such “put option” right is subject to the satisfaction of certain conditions, including conditions requiring notice in advance of exercise. In addition, these rights cannot be exercised prior to a specified exercise date. The exercise of these rights at their earliest contractual date would result in obligations of the Company to fund the related amounts in 2019. Management estimates, assuming that the subsidiary owned by the Company at September 30, 2017, performs over the relevant future periods at its forecasted earnings levels, that these rights, if exercised, could require the Company, in future periods, to pay approximately $8,872 to the owners of such rights to acquire such ownership interests in the relevant subsidiary. This amount has been recorded as redeemable noncontrolling interests on the Consolidated Balance Sheet at September 30, 2017 and December 31, 2016. The ultimate amount payable relating to this transaction will vary because it is dependent on the future results of operations of the subject business.

16
Litigation Securities and Derivative Litigation The Company and certain of its former executive officers have been named as defendants in a consolidated putative stockholder class action lawsuit pending in the United States District Court for the District of South Carolina. The consolidated action is styled KBC Asset Management NV v. 3D Systems Corporation, et al., Case No. 0:15-cv-02393-MGL. The Amended Consolidated Complaint (the “Complaint”), which was filed on December 9, 2015, alleges that defendants violated the Securities Exchange Act of 1934, as amended (the “Exchange Act”), and Rule 10b-5 promulgated thereunder by making false and misleading statements and omissions and that the former officers are control persons under Section 20(a) of the Exchange Act. The Complaint was filed on behalf of stockholders who purchased shares of the Company’s common stock between October 29, 2013, and May 5, 2015 and seeks monetary damages on behalf of the purported class. Defendants filed a motion to dismiss the Complaint in its entirety on January 14, 2016, which was denied by Memorandum Opinion and Order dated July 25, 2016 (the “Order”). Defendants filed a motion for reconsideration of the Order on August 4, 2016, which was denied by Order dated February 24, 2017. Nine related derivative complaints have been filed by purported Company stockholders against certain of the Company’s former executive officers and members of its Board of Directors. The Company is named as a nominal defendant in all nine actions. The derivatives complaints are styled as follows: (1) Steyn v. Reichental, et al., Case No. 2015-CP-46-2225, filed on July 27, 2015 in the Court of Common Pleas for the 16th Judicial Circuit, County of York, South Carolina (“Steyn”); (2) Piguing v. Reichental, et al., Case No. 2015-CP-46-2396, filed on August 7, 2015 in the Court of Common Pleas for the 16th Judicial Circuit, County of York, South Carolina (“Piguing”); (3) Booth v. Reichental, et al., Case No. 15-692-RGA, filed on August 6, 2015 in the United States District Court for the District of Delaware; (4) Nally v. Reichental, et al., Case No. 15-cv-03756-MGL, filed on September 18, 2015 in the United States District Court for the District of South Carolina (“Nally”); (5) Gee v. Hull, et al., Case No. BC-610319, filed on February 17, 2016 in the Superior Court for the State of California, County of Los Angeles (“Gee”); (6) Foster v. Reichental, et al., Case No. 0:16-cv-01016-MGL, filed on April 1, 2016 in the United States District Court for the District of South Carolina (“Foster”); (7) Lu v. Hull, et al., Case No. BC629730, filed on August 5, 2016 in the Superior Court for the State of California, County of Los Angeles (“Lu”); (8) Howes v. Reichental, et al., Case No. 0:16-cv-2810-MGL, filed on August 11, 2016 in the United States District Court for the District of South Carolina (“Howes”); and (9) Ameduri v. Reichental, et al., Case No. 0:16-cv-02995-MGL, filed on September 1, 2016 in the United States District Court for the District of South Carolina (“Ameduri”). Steyn and Piguing were consolidated into one action styled as In re 3D Systems Corp. Shareholder Derivative Litig., Lead Case No. 2015-CP-46-2225 in the Court of Common Pleas for the 16th Judicial Circuit, County of York, South Carolina. Gee and Lu were consolidated into one action styled as Gee v. Hull, et al., Case No. BC610319 in the Superior Court for the State of California, County of Los Angeles. Nally, Foster, Howes, and Ameduri were consolidated into one action in the United States District Court for the District of South Carolina with Nally as the lead consolidated case. The derivative complaints allege claims for breach of fiduciary duty, abuse of control, gross mismanagement, waste of corporate assets and unjust enrichment and seek, among other things, monetary damages and certain corporate governance actions. All of the derivative complaints listed above have been stayed until the earlier of the close of discovery or the deadline for appealing a dismissal in the KBC Asset Management NV securities class action. The Company believes the claims alleged in the putative securities class action and the derivative lawsuits are without merit and intends to defend the Company and its officers and directors vigorously. Ronald Barranco and Print3D Corporation v. 3D Systems Corporation, et. al. On August 23, 2013, Ronald Barranco, a former Company employee, filed two lawsuits against the Company and certain officers in the United States District Court for the District of Hawaii. The first lawsuit (“Barranco I”) is captioned Ronald Barranco and Print3D Corporation v. 3D Systems Corporation, 3D Systems, Inc., and Damon Gregoire, Case No. CV 13-411 LEK RLP, and alleges seven causes of action relating to the Company’s acquisition of Print3D Corporation (of which Mr. Barranco was a 50% shareholder) and the subsequent employment of Mr. Barranco by the Company. The second lawsuit (“Barranco II”) is captioned Ronald Barranco v. 3D Systems Corporation, 3D Systems, Inc., Abraham Reichental, and Damon Gregoire, Case No. CV 13-412 LEK RLP, and alleges the same seven causes of action relating to the Company’s acquisition of certain website domains from Mr. Barranco and the subsequent employment of Mr. Barranco by the Company. Both Barranco I and Barranco II allege the Company breached certain purchase agreements in order to avoid paying Mr. Barranco additional monies pursuant to royalty and earn out provisions in the agreements. The Company and its officers timely filed responsive pleadings on October 22, 2013 seeking, inter alia, to dismiss Barranco I due to a mandatory arbitration agreement and for lack of personal jurisdiction and to dismiss Barranco II for lack of personal jurisdiction.

17
With regard to Barranco I, the Hawaii district court, on February 28, 2014, denied the Company’s motion to dismiss and its motion to transfer venue to South Carolina for the convenience of the parties. However, the Hawaii court recognized that the plaintiff’s claims are all subject to mandatory and binding arbitration in Charlotte, North Carolina. Because the Hawaii court was without authority to compel arbitration outside of Hawaii, the court ordered that the case be transferred to the district court encompassing Charlotte (the United States District Court for the Western District of North Carolina) so that court could compel arbitration in Charlotte. On April 17, 2014, Barranco I was transferred to the United States District Court for the Western District of North Carolina. Plaintiff filed a demand for arbitration on October 29, 2014. On December 9, 2014, the Company filed its answer to plaintiff’s demand for arbitration. On February 2, 2015, plaintiff filed an amended demand that removed Mr. Gregoire as a defendant from the matter, and on February 4, 2015 the Company filed its amended answer. The parties selected an arbitrator and arbitration took place in September 2015 in Charlotte, North Carolina. On September 28, 2015, the arbitrator issued a final award in favor of Mr. Barranco with respect to two alleged breaches of contract and implied covenants arising out of the contract. The arbitrator found that the Company did not commit fraud or make any negligent misrepresentations to Mr. Barranco. Pursuant to the award, the Company is to pay approximately $11,282, which includes alleged actual damages of $7,254, fees and expenses of $2,318 and prejudgment interest of $1,710. The Company disagrees with the single arbitrator’s findings and conclusions and believes the arbitrator’s decision exceeds his authority and disregards the applicable law. As an initial response, the Company filed a motion for modification on September 30, 2015, based on mathematical errors in the computation of damages and fees. On October 16, 2015, the arbitrator issued an order denying the Company’s motion and sua sponte issuing a modified final award in favor of Mr. Barranco in the same above-referenced amounts, but making certain substantive changes to the award, which changes the Company believes were improper and outside the scope of his authority and the American Arbitration Association rules. On November 20, 2015, the Company filed a motion to vacate the arbitration award in the federal court in the United States District Court for the Western District of North Carolina. Claimants also filed a motion to confirm the arbitration award. A hearing was held on the motions on September 29, 2016 in federal court in the Western District of North Carolina. The court requested supplemental briefing by the parties, which briefs were filed on July 11, 2016. On August 31, 2016, the court issued an order granting in part and denying in part Plaintiff’s motion to confirm the arbitration award and for judgment, entering judgment in the principal amount of the arbitration award and denying Plaintiff’s motion for fees and costs. The court denied the Company’s motion to vacate. On September 7, 2016, Plaintiff filed a motion to amend the judgment to include prejudgment interest. The Company opposed that motion and the parties submitted briefing. On September 28, 2016 the Company filed a motion to alter or amend the judgment. Plaintiff opposed the motion and the parties submitted briefing. On May 18, 2017, the court issued an opinion and order denying the Company’s motion to alter or amend and denying Plaintiff’s motion for prejudgment interest. On September 16, 2017, the Company filed a notice of appeal with the United States Court of Appeals for the Fourth Circuit. The appeal is pending. The Company filed its Opening Brief and the Joint Appendix on August 28, 2017. Plaintiff filed its Opening Brief on September 11, 2017. The Company filed its Reply Brief on September 25, 2017. Notwithstanding the Company’s right to appeal, given the arbitrator’s decision, the Company recorded an $11,282 expense provision for this matter in the quarter ended September 30, 2015. The provision is subject to adjustment based on the ultimate outcome of the Company’s appeal. If it is ultimately determined that money is owed following the full appellate process in federal court, the Company intends to fund any amounts to be paid from cash on hand. This amount has been classified as a current liability given the timeline of the appeals process. With regard to Barranco II, the Hawaii district court, on March 17, 2014, denied the Company’s motion to dismiss and its motion to transfer venue to South Carolina. However, the Hawaii court dismissed Count II in plaintiff’s complaint alleging breach of the employment agreement. The Company filed an answer to the complaint in the Hawaii district court on March 31, 2014. On November 19, 2014, the Company filed a motion for summary judgment on all claims which was heard on January 20, 2015. On January 30, 2015, the court entered an order granting in part and denying in part the Company’s motion for summary judgment. The Order narrowed the plaintiff’s claim for breach of contract and dismissed the plaintiff’s claims for fraud and negligent misrepresentation. As a result, Messrs. Reichental and Gregoire were dismissed from the lawsuit. The case was tried to a jury in May 2016, and on May 27, 2016 the jury found that the Company was not liable for either breach of contract or breach of the implied covenant of good faith and fair dealing. Additionally, the jury found in favor of the Company on its counterclaim against Mr. Barranco and determined that Mr. Barranco violated his non-competition covenant with the Company. On July 5, 2017, the court ordered a bench trial regarding causation and damages with respect to the equitable accounting on the Company’s prevailing counterclaim against Mr. Barranco. The bench trial has been set for November 20, 2017. The Company is involved in various other legal matters incidental to its business. Although the Company cannot predict the results of litigation with certainty, the Company believes that the disposition of all current legal matters will not have a material adverse effect on its consolidated results of operations, consolidated statement of cash flows or consolidated financial position.

18
Export Compliance Matter In October 2017 the Company received an administrative subpoena from the Bureau of Industry and Security of the Department of Commerce (“BIS”) requesting the production of records in connection with possible violations of U.S. export control laws, including with regard to its Quickparts.com, Inc. subsidiary. The Company is cooperating fully with the investigation, but cannot predict its ultimate resolution. The Company expects to incur significant legal costs and other expenses in connection with responding to the investigation. If the U.S. government finds that the Company has violated one or more export control laws or trade sanctions, the Company could be subject to various penalties. By statute, these penalties can include but are not limited to fines, which by statute may be significant, denial of export privileges, and debarment from participation in U.S. government contracts; and any assessment of penalties could also harm the Company’s reputation, create negative investor sentiment, and affect the Company’s share value. The Company cannot at this time predict when BIS will conclude its investigation or determine an estimated cost, if any, or range of costs, for any penalties or fines that may be incurred upon resolution of this matter. Indemnification In the normal course of business, the Company periodically enters into agreements to indemnify customers or suppliers against claims of intellectual property infringement made by third parties arising from the use of the Company’s products. Historically, costs related to these indemnification provisions have not been significant, and the Company is unable to estimate the maximum potential impact of these indemnification provisions on its future results of operations. To the extent permitted under Delaware law, the Company indemnifies its directors and officers for certain events or occurrences while the director or officer is, or was, serving at the Company’s request in such capacity, subject to limited exceptions. The maximum potential amount of future payments the Company could be required to make under these indemnification obligations is unlimited; however, the Company has directors and officers insurance coverage that may enable the Company to recover future amounts paid, subject to a deductible and the policy limits. There is no assurance that the policy limits will be sufficient to cover all damages, if any. (15) Accumulated Other Comprehensive Loss The changes in the balances of accumulated other comprehensive loss by component are as follows:
(in thousands) Foreign currency
translation adjustment Defined benefit pension
plan Total
Balance at December 31, 2016 $ (50,450) $ (2,775) $ (53,225) Other comprehensive income (loss) 25,624 (105) 25,519 Balance at September 30, 2017 $ (24,826) $ (2,880) $ (27,706) For additional information about foreign currency translation, see Note 7. (16) Noncontrolling Interests As of September 30, 2017, the Company owned approximately 70% of the capital and voting rights of Robtec, a service bureau and distributor of 3D printing and scanning products in Brazil. Robtec was acquired on November 25, 2014. As of September 30, 2017, the Company owned approximately 70% of the capital and voting rights of Easyway, a service bureau and distributor of 3D printing and scanning products in China. Approximately 65% of the capital and voting rights of Easyway were acquired on April 2, 2015, and an additional 5% of the capital and voting rights of Easyway were acquired on July 19, 2017 for $2.3 million.

19
Item 2. Management’s Discussion and Analysis of Financial Condition and Results of Operations. This discussion should be read in conjunction with the unaudited condensed consolidated financial statements and the notes thereto included in Item 1 (the “Financial Statements”) of this Quarterly Report on Form 10-Q (“Form 10-Q”). We are subject to a number of risks and uncertainties that may affect our future performance that are discussed in greater detail in the sections entitled “Forward-Looking Statements” at the end of this Item 2 and that are discussed or referred to in Item 1A of Part II of this Form 10-Q. Business Overview 3D Systems Corporation (“3D Systems” or the “Company” or “we” or “us”) is a holding company incorporated in Delaware in 1993 that markets our products and services through subsidiaries in North America and South America (collectively referred to as “Americas”), Europe and the Middle East (collectively referred to as “EMEA”) and the Asia Pacific region (“APAC”). We provide comprehensive 3D printing solutions, including 3D printers, print materials, software, on-demand manufacturing services and digital design tools. Our solutions support advanced applications in a wide range of industries and key verticals including healthcare, aerospace, automotive and durable goods. Our precision healthcare capabilities include simulation, Virtual Surgical Planning (“VSP™”), and printing of medical and dental devices and surgical guides and instruments. 3D Systems has a 30 year history of experience and expertise which have proven vital to our development of an ecosystem that enables customers to optimize product designs, transform workflows, bring innovative products to market and drive new business models. Customers can use our 3D solutions to design and manufacture complex and unique parts, eliminate expensive tooling, produce parts locally or in small batches and reduce lead times and time to market. A growing number of customers are shifting from prototyping applications to also using 3D printing for production. We believe this shift will be further driven by our continued advancement and innovation of 3D printing solutions that improve durability, repeatability, productivity and total cost of operations. Summary of Third Quarter 2017 Financial Results Total consolidated revenue for the quarter ended September 30, 2017 decreased by 2.2%, or $3.5 million, to $152.9 million, compared to $156.4 million for the quarter ended September 30, 2016. These results reflect a decrease in products revenue, partially offset by an increase in materials and services revenue, as further discussed below. Healthcare revenue includes sales of products, materials and services for healthcare-related applications, including simulation, training and planning, 3D printing of surgical guides and instruments and medical and dental devices. For the quarter ended September 30, 2017, healthcare revenue increased by 9.7%, to $46.6 million, and made up 30.5% of total revenue, compared to $42.5 million, or 27.2% of total revenue for the quarter ended September 30, 2016. The increase in healthcare revenue is driven by growth in materials sales, including the acquisition of Vertex, and services sales which include virtual surgical planning and contract manufacturing services. For the quarter ended September 30, 2017, total software revenue from products and services remained relatively flat at $21.3 million, and made up 14.0% of total revenue, compared to $21.4 million, or 13.7% of total revenue for the quarter ended September 30, 2016. As of September 30 and June 30, 2017, our backlog was $26.6 million and $32.4 million, respectively. Production and delivery of our printers is generally not characterized by long lead times; backlog is more dependent on timing of customers’ requested deliveries. In addition, on-demand manufacturing services lead time and backlog depends on whether orders are for rapid prototyping or longer-range production runs. As of September 30, 2017, backlog included $8.9 million of on-demand manufacturing service orders, compared to $9.6 million at June 30, 2017. Gross profit for the quarter ended September 30, 2017 decreased by 15.1%, or $10.4 million, to $58.5 million, compared to $68.9 million for the quarter ended September 30, 2016. Gross profit margin for the quarters ended September 30, 2017 and 2016 was 38.3% and 44.1%, respectively. Gross profit margin for the third quarter of 2017 and 2016 included charges of $12.9 million and $10.7 million, respectively, related to the write-off of excess and obsolete inventory. Operating expenses remained relatively flat at $90.9 million for the quarter ended September 30, 2017 as compared to $91.0 million for the quarter ended September 30, 2016, including continued investments in R&D, go to market and IT infrastructure. Our operating loss for the quarter ended September 30, 2017 was $32.3 million, compared to an operating loss of $22.0 million for the quarter ended September 30, 2016. For the nine months ended September 30, 2017 and 2016, we generated $17.7 million and $38.2 million of cash from operations, respectively, as further discussed below. In total, our unrestricted cash balance at September 30, 2017 and December 31, 2016 was $138.3 million and $184.9 million, respectively. A key driver for the lower cash balance was the Company’s acquisition of Vertex Global (“Vertex”) for approximately $34.3 million.

20
Results of Operations Comparison of revenue by class We earn revenue from the sale of products, materials and services. The products category includes 3D printers, healthcare simulators and digitizers, as well as software, 3D scanners and haptic devices. The materials category includes a wide range of print materials to be used with our 3D printers, the majority of which are proprietary, as well as acquired conventional dental materials. The services category includes warranty and maintenance on 3D printers and simulators, software maintenance, on-demand manufacturing solutions and healthcare services. Due to the relatively high price of certain 3D printers and a corresponding lengthy selling cycle and relatively low unit volume of the higher priced printers in any particular period, a shift in the timing and concentration of orders and shipments from one period to another can affect reported revenue in any given period. Revenue reported in any particular period is also affected by timing of revenue recognition under rules prescribed by U.S. generally accepted accounting principles (“GAAP”). In addition to changes in sales volumes and the impact of revenue from acquisitions, there are two other primary drivers of changes in revenue from one period to another: (1) the combined effect of changes in product mix and average selling prices, sometimes referred to as price and mix effects, and (2) the impact of fluctuations in foreign currencies. As used in this Management’s Discussion and Analysis, the price and mix effects relate to changes in revenue that are not able to be specifically related to changes in unit volume. Table 1 and Table 2 below set forth change in revenue by class for the quarter and nine months ended September 30, 2017, respectively: Table 1
(Dollars in thousands) Products Materials Services Totals
Revenue – third quarter 2016 $ 56,484 36.1 % $ 38,059 24.4 % $ 61,819 39.5 % $ 156,362 100 % Change in revenue:
Volume (6,019) (10.7) 3,740 9.8 2,548 4.1 269 0.1 Price/Mix (3,129) (5.5) (2,883) (7.6) — — (6,012) (3.8) Foreign currency 891 1.6 483 1.3 914 1.5 2,288 1.5 Net change (8,257) (14.6) 1,340 3.5 3,462 5.6 (3,455) (2.2)
Revenue – third quarter 2017 $ 48,227 31.5 % $ 39,399 25.8 % $ 65,281 42.7 % $ 152,907 100 %
Consolidated revenue decreased 2.2%, driven by a decrease in products volume and a shift in product mix, partially offset by increased volumes in both materials and services and the favorable impact of foreign currency. Products revenue decreased because of lower volumes and changes in product mix and average selling prices, including increased demand for lower priced printers and softer demand for simulators during the quarter. For the quarters ended September 30, 2017 and 2016, revenue from printers was $29.4 million and $33.0 million, respectively. Software revenue included in the products category, including scanners and haptic devices, contributed $10.6 million and $10.8 million for the quarters ended September 30, 2017 and 2016, respectively. The increase in materials revenue primarily reflects higher demand from healthcare customers including those of Vertex and NextDent dental materials, both part of the first quarter 2017 Vertex acquisition. This increased demand was partially offset by a decrease related to a shift in product mix. Services revenue increased due to higher demand for healthcare services and on-demand manufacturing services. For the quarters ended September 30, 2017 and 2016, revenue from on-demand manufacturing services contributed $27.2 million and $26.5 million, respectively. For the quarters ended September 30, 2017 and 2016, software services revenue remained relatively flat at $10.7 million and $10.5 million, respectively.

21
Table 2
(Dollars in thousands) Products Materials Services Totals
Revenue – nine months 2016 $ 163,301 35.0 % $ 117,105 25.1 % $ 186,622 39.9 % $ 467,028 100 % Change in revenue:
Volume (8,726) (5.3) 14,833 12.7 6,085 3.3 12,192 2.6 Price/Mix (4,165) (2.6) (4,794) (4.1) — — (8,959) (1.9) Foreign currency 271 0.2 (1,048) (0.9) (679) (0.4) (1,456) (0.3) Net change (12,620) (7.7) 8,991 7.7 5,406 2.9 1,777 0.4
Revenue – nine months 2017 $ 150,681 32.1 % $ 126,096 26.9 % $ 192,028 41.0 % $ 468,805 100 % Total consolidated revenue remained relatively flat as increases in volume for materials and services were offset by a decrease in volume for products and a shift in product mix. Products revenue decreased due to lower printer volume and a shift in product mix and average selling prices. For the nine months ended September 30, 2017 and 2016, printer revenue contributed $88.5 million and $98.2 million, respectively. Software revenue included in the products category, including scanners and haptic devices, contributed $33.2 million and $31.7 million for the nine months ended September 30, 2017 and 2016, respectively. The increase in materials revenue primarily reflects higher demand from healthcare and industrial customers including those of Vertex and NextDent dental materials, both part of the first quarter 2017 Vertex acquisition, partially offset by decreases related to a shift in product mix and an unfavorable foreign currency impact. Services revenue increased due to higher demand for healthcare services, partially offset by a decrease in on-demand manufacturing services. For the nine months ended September 30, 2017 and 2016, revenue from on-demand manufacturing services contributed $78.1 million and $80.3 million, respectively. For the nine months ended September 30, 2017 and 2016, software services contributed $32.5 million and $31.9 million, respectively. Comparison of revenue by geographic region Table 3 and Table 4 below set forth change in revenue by geographic area for the quarter and nine months ended September 30, 2017, respectively: Table 3
(Dollars in thousands) Americas EMEA Asia Pacific Total
Revenue – third quarter 2016 $ 86,890 55.6 % $ 43,744 28.0 % $ 25,728 16.4 % $ 156,362 100 % Change in revenue:
Volume (4,905) (5.6) 7,958 18.2 (2,784) (10.8) 269 0.1 Price/Mix (3,160) (3.6) (1,727) (3.9) (1,125) (4.4) (6,012) (3.8) Foreign currency 111 0.1 2,482 5.7 (305) (1.2) 2,288 1.5 Net change (7,954) (9.1) 8,713 20.0 (4,214) (16.4) (3,455) (2.2)
Revenue – third quarter 2017 $ 78,936 51.6 % $ 52,457 34.3 % $ 21,514 14.1 % $ 152,907 100 % Lower sales volumes in the Americas and APAC as well as a shift in product mix and average selling prices across all geographic regions, offset by higher sales volume in EMEA and the favorable impact of foreign currency, primarily drive the decrease in consolidated revenue. The decrease in revenue in the Americas region primarily reflects lower sales volumes and a shift in product mix and average selling prices. The increase in revenue in the EMEA region primarily reflects higher sales volumes, primarily driven by printer sales, Vertex materials, and the favorable impact of foreign currency. These impacts are slightly offset by a shift in product mix and average selling prices. The decrease in revenue in the Asia Pacific region primarily reflects lower demand combined with a shift in product mix and average selling prices. For the quarters ended September 30, 2017 and 2016, revenue from operations outside the U.S., including Latin America, EMEA and APAC, was 50.7% and 45.8% of total revenue, respectively.

22
Table 4
(Dollars in thousands) Americas EMEA Asia Pacific Total
Revenue – nine months 2016 $ 253,981 54.4 % $ 139,929 30.0 % $ 73,118 15.6 % $ 467,028 100 % Change in revenue:
Volume (7,018) (2.8) 20,442 14.6 (1,232) (1.7) 12,192 2.6 Price/Mix (4,870) (1.9) (661) (0.5) (3,428) (4.7) (8,959) (1.9) Foreign currency 402 0.2 (846) (0.6) (1,012) (1.4) (1,456) (0.3) Net change (11,486) (4.5) 18,935 13.5 (5,672) (7.8) 1,777 0.4
Revenue – nine months 2017 $ 242,495 51.7 % $ 158,864 33.9 % $ 67,446 14.4 % $ 468,805 100 % Consolidated revenue remained relatively flat as increases in sales volume were offset by decreases related to shifts in product mix and average selling prices. The decrease in revenue in the Americas region primarily reflects lower sales volumes and a shift in product mix and average selling prices. The increase in revenue in the EMEA region reflects higher sales volumes, primarily driven by Vertex materials and printer sales, offset slightly by a shift in product mix and average selling prices. The decrease in revenue in the Asia Pacific region primarily reflects a shift in product mix and lower volumes. For the nine months ended September 30, 2017 and 2016, revenue from operations outside the U.S., including Latin America, EMEA and APAC, was 50.0% and 47.3% of total revenue, respectively. Gross profit and gross profit margins Table 5 and Table 6 below set forth gross profit and gross profit margin for the quarters and nine months ended September 30, 2017 and 2016, respectively: Table 5
Quarter Ended September 30,
2017 2016 Change in Gross Profit Change in Gross Profit Margin
(Dollars in thousands) Gross Profit
Gross Profit
Margin Gross Profit
Gross Profit
Margin $ % Percentage Points %
Products $ (360) (0.7) % $ 9,288 16.4 % $ (9,648) (103.9) % (17.1) (104.3) % Materials 28,519 72.4 28,934 76.0 (415) (1.4) (3.6) (4.7) Services 30,363 46.5 30,715 49.7 (352) (1.1) (3.2) (6.4)
Total $ 58,522 38.3 % $ 68,937 44.1 % $ (10,415) (15.1) % (5.8) (13.2) % The decrease in total consolidated gross profit is driven by changes in product mix. Also contributing to the decrease were the inventory adjustments totaling $12.9 million versus adjustments of $10.7 million in the same period of 2016. The 2017 inventory adjustment resulted from a comprehensive review of our portfolio and inventory during the quarter ended September 30, 2017. The 2017 inventory adjustment primarily related to legacy plastics printers, refurbished and used metals printers and parts that have shown little to no use over extended periods. The majority of this adjustment relates to the products category. Gross profit margin for materials decreased primarily due to the mix of sales, including the addition of Vertex traditional dental materials that carry lower margins. Gross profit margin for services decreased slightly, predominantly due to the decrease in on-demand manufacturing services margin to 40.9% for the quarter ended September 30, 2017 as compared to 43.7% for the quarter ended September 30, 2016. Table 6
Nine Months Ended September 30,
2017 2016 Change in Gross Profit Change in Gross Profit Margin
(Dollars in thousands) Gross Profit
Gross Profit
Margin Gross Profit
Gross Profit
Margin $ % Percentage Points %
Products $ 34,255 22.7 % $ 43,790 26.8 % $ (9,535) (21.8) % (4.1) (15.3) % Materials 91,753 72.8 89,934 76.8 1,819 2.0 (4.0) (5.2) Services 93,373 48.6 93,137 49.9 236 0.3 (1.3) (2.6)
Total $ 219,381 46.8 % $ 226,861 48.6 % $ (7,480) (3.3) % (1.8) (3.7) %
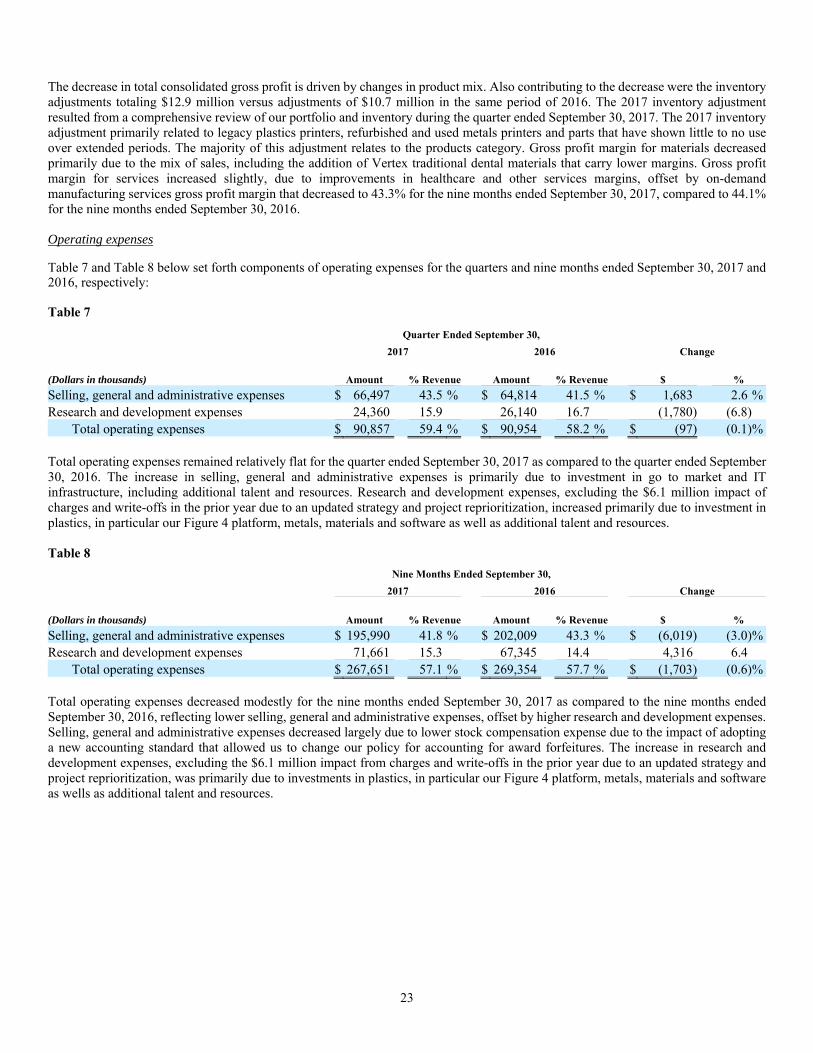
23
The decrease in total consolidated gross profit is driven by changes in product mix. Also contributing to the decrease were the inventory adjustments totaling $12.9 million versus adjustments of $10.7 million in the same period of 2016. The 2017 inventory adjustment resulted from a comprehensive review of our portfolio and inventory during the quarter ended September 30, 2017. The 2017 inventory adjustment primarily related to legacy plastics printers, refurbished and used metals printers and parts that have shown little to no use over extended periods. The majority of this adjustment relates to the products category. Gross profit margin for materials decreased primarily due to the mix of sales, including the addition of Vertex traditional dental materials that carry lower margins. Gross profit margin for services increased slightly, due to improvements in healthcare and other services margins, offset by on-demand manufacturing services gross profit margin that decreased to 43.3% for the nine months ended September 30, 2017, compared to 44.1% for the nine months ended September 30, 2016. Operating expenses Table 7 and Table 8 below set forth components of operating expenses for the quarters and nine months ended September 30, 2017 and 2016, respectively: Table 7
Quarter Ended September 30,
2017 2016 Change
(Dollars in thousands) Amount % Revenue Amount % Revenue $ %
Selling, general and administrative expenses $ 66,497 43.5 % $ 64,814 41.5 % $ 1,683 2.6 % Research and development expenses 24,360 15.9 26,140 16.7 (1,780) (6.8)
Total operating expenses $ 90,857 59.4 % $ 90,954 58.2 % $ (97) (0.1) % Total operating expenses remained relatively flat for the quarter ended September 30, 2017 as compared to the quarter ended September 30, 2016. The increase in selling, general and administrative expenses is primarily due to investment in go to market and IT infrastructure, including additional talent and resources. Research and development expenses, excluding the $6.1 million impact of charges and write-offs in the prior year due to an updated strategy and project reprioritization, increased primarily due to investment in plastics, in particular our Figure 4 platform, metals, materials and software as well as additional talent and resources. Table 8
Nine Months Ended September 30,
2017 2016 Change
(Dollars in thousands) Amount % Revenue Amount % Revenue $ %
Selling, general and administrative expenses $ 195,990 41.8 % $ 202,009 43.3 % $ (6,019) (3.0) % Research and development expenses 71,661 15.3 67,345 14.4 4,316 6.4
Total operating expenses $ 267,651 57.1 % $ 269,354 57.7 % $ (1,703) (0.6) % Total operating expenses decreased modestly for the nine months ended September 30, 2017 as compared to the nine months ended September 30, 2016, reflecting lower selling, general and administrative expenses, offset by higher research and development expenses. Selling, general and administrative expenses decreased largely due to lower stock compensation expense due to the impact of adopting a new accounting standard that allowed us to change our policy for accounting for award forfeitures. The increase in research and development expenses, excluding the $6.1 million impact from charges and write-offs in the prior year due to an updated strategy and project reprioritization, was primarily due to investments in plastics, in particular our Figure 4 platform, metals, materials and software as wells as additional talent and resources.

24
Loss from operations Table 9 below sets forth operating loss by geographic area for the quarters and nine months ended September 30, 2017 and 2016, respectively: Table 9
Quarter Ended September 30, Nine Months Ended September 30,
(in thousands) 2017 2016 2017 2016
Income (loss) from operations: Americas $ (34,255) $ (21,525) $ (63,344) $ (40,458) EMEA (1,582) (8,282) 2,459 (19,493) Asia Pacific 3,891 8,434 14,064 19,537
Subtotal (31,946) (21,373) (46,821) (40,414) Intercompany elimination (389) (644) (1,449) (2,079)
Total $ (32,335) $ (22,017) $ (48,270) $ (42,493) The loss from operations increased $10.3 million and $5.8 million for the quarter and nine months ended September 30, 2017, respectively, when compared to the same periods at September 30, 2016. The operating loss changes were primarily driven by changes in gross profit and operating expenses. See “Gross profit and gross profit margins” and “Operating expenses” above. With respect to the Americas, for the quarter and nine months ended September 30, 2017, as compared to the same periods of 2016, operating losses increased primarily due to the impact of inventory adjustments as described in Note 3 to the condensed consolidated financial statements and under Table 5 above. The Americas region also contains a significant portion of our corporate costs, which negatively impacts profitability compared to the other regions. Operating losses for the regions are also impacted by our transfer pricing policies on intercompany transactions between the regions. The improvements in operating results for the EMEA region in the quarter and nine months ended September 30, 2017, as compared to the same periods of 2016, primarily reflect increased revenue, including the contribution of the acquisition of Vertex. The decrease in income from operations in the Asia Pacific region for the quarter and nine months ended September 30, 2017, as compared to the same periods of 2016, reflects decreases in revenues. Interest and other income, net Table 10 below sets forth components of interest and other expense, net, for the quarters and nine months ended September 30, 2017 and 2016, respectively: Table 10
Quarter Ended September 30, Nine Months Ended September 30,
(Dollars in thousands) 2017 2016 2017 2016
Interest and other expense, net:
Interest income $ (227) $ (153) $ (555) $ (600)
Foreign exchange (gain) loss 822 1,123 (712) (340)
Interest expense 237 272 699 1,053
Other (income) expense, net 425 382 691 1,177
Total interest and other income, net $ 1,257 $ 1,624 $ 123 $ 1,290 Net loss Table 11 and Table 12 below set forth components of net loss attributable to 3D Systems for the quarters and nine months ended September 30, 2017 and 2016, respectively:

25
Table 11
Quarter Ended September 30,
(Dollars in thousands) 2017 2016 Change
Operating loss $ (32,335) $ (22,017) $ (10,318) Less:
Interest and other expense, net 1,257 1,624 (367) Provision for income taxes 3,723 (2,214) 5,937 Net income (loss) attributable to noncontrolling interests 355 (214) 569
Net loss attributable to 3D Systems $ (37,670) $ (21,213) $ (16,457) Net loss per share — basic and diluted $ (0.34) $ (0.19) Table 12
Nine Months Ended September 30,
(Dollars in thousands) 2017 2016 Change
Operating loss $ (48,270) $ (42,493) $ (5,777) Less:
Interest and other expense, net 123 1,290 (1,167) Provision for income taxes 6,831 665 6,166 Net income (loss) attributable to noncontrolling interests 833 (799) 1,632
Net loss attributable to 3D Systems $ (56,057) $ (43,649) $ (12,408) Net loss per share — basic and diluted $ (0.50) $ (0.39) Liquidity and Capital Resources Table 13
Change
(Dollars in thousands) September 30, 2017 December 31, 2016 $ %
Cash and cash equivalents $ 138,332 $ 184,947 $ (46,615) (25.2) % Accounts receivable, net 122,420 127,114 (4,694) (3.7) Inventories 100,578 103,331 (2,753) (2.7) 361,330 415,392 (54,062)
Current portion of capitalized lease obligations 632 572 60 10.5 Accounts payable 46,388 40,514 5,874 14.5 Accrued and other liabilities 55,866 49,968 5,898 11.8 102,886 91,054 11,832
Operating working capital $ 258,444 $ 324,338 $ (65,894) (20.3) %
We assess our liquidity in terms of our ability to generate cash to fund our operating, investing and financing activities. In doing so, we review and analyze our current cash on hand, the number of days our sales are outstanding, inventory turns, capital expenditure commitments and accounts payable turns. Our cash requirements primarily consist of funding of working capital and funding of capital expenditures. We believe our existing cash and cash equivalents will be sufficient to satisfy our working capital needs, capital expenditures, outstanding commitments and other liquidity requirements associated with our existing operations in the foreseeable future, or to consummate significant acquisitions of other businesses, assets, products or technologies. However, it is possible that, in the future, we may need to raise additional funds to finance our activities. If needed, we may be able to raise such funds by issuing equity or debt securities to the public or selected investors, by borrowing from financial institutions, drawing down on our credit facility, or selling assets.

26
Cash held outside the U.S. at September 30, 2017 was $88.8 million, or 64.2% of total cash and equivalents, compared to $83.5 million, or 45.2% of total cash and equivalents at December 31, 2016. Cash held outside the U.S. is used in our foreign operations for working capital purposes and is considered to be permanently invested; consequently, we have not provided for any taxes on repatriation. Cash equivalents comprise funds held in money market instruments and are reported at their current carrying value, which approximates fair value due to the short term nature of these instruments. We strive to minimize our credit risk by investing primarily in investment grade, liquid instruments and limit exposure to any one issuer depending upon credit quality. See Cash flow, Credit facilities and Capitalized lease obligations below. Days’ sales outstanding was 74 days at September 30, 2017 compared to 70 days at December 31, 2016 and accounts receivable more than 90 days past due decreased to 11.3% of gross receivables, from 12.5% at December 31, 2016. We review specific receivables periodically to determine the appropriate reserve for accounts receivable. The majority of our inventory consists of finished goods, including products, materials and service parts. Inventory also consists of raw materials and spare parts for the in-house assembly and support service products. We outsource the assembly of certain 3D printers; therefore, we generally do not hold most parts for the assembly of these printers in inventory. The changes that make up the other components of working capital not discussed above resulted from the ordinary course of business. Differences between the amounts of working capital item changes in the cash flow statement and the balance sheet changes for the corresponding items are primarily the result of foreign currency translation adjustments. Cash flow Table 14 summarizes the cash provided by (used in) operating activities, investing activities and financing activities, as well as the effect of changes in foreign currency exchange rates on cash, for the nine months ended September 30, 2017 and 2016: Table 14
Nine Months Ended September 30,
2017 2016
(Dollars in thousands) Cash provided by operating activities $ 17,676 $ 38,240 Cash used in investing activities (60,567) (13,804) Cash used in financing activities (7,997) (2,293) Effect of exchange rate changes on cash 4,273 1,572
Net increase (decrease) in cash and cash equivalents $ (46,615) $ 23,715
Cash flow from operating activities Table 15 summarizes the components of cash provided by operating activities for the nine months ended September 30, 2017 and 2016:
Table 15
Nine Months Ended September 30,
2017 2016
(Dollars in thousands) Net loss $ (55,224) $ (44,448) Non-cash charges 83,408 89,473 Changes in working capital and all other operating assets (10,508) (6,785)
Net cash provided by operating activities $ 17,676 $ 38,240 Net cash provided by operating activities for the nine months ended September 30, 2017 was $17.7 million. Excluding non-cash charges, net income provided $28.2 million of cash. Non-cash charges primarily consist of depreciation, amortization, stock-based compensation and inventory adjustments. Working capital requirements used $10.5 million of cash. The primary driver of the working capital outflow was increased spend for inventory of $13.9 million, payments of current liabilities of $4.7 million and other operating activities of $6.0 million. These amounts were partially offset by lower accounts receivable of $10.8 million and increases in account payables and deferred revenues of $3.5 million and $2.9 million, respectively. Differences between the amounts of working capital item changes in

27
the cash flow statement and the balance sheet changes for the corresponding items are primarily the result of foreign currency translation adjustments.
Cash flow from investing activities Table 16 summarizes the components of cash used in investing activities for the nine months ended September 30, 2017 and 2016:
Table 16
Nine Months Ended September 30,
2017 2016
(Dollars in thousands) Cash paid for acquisitions, net of cash assumed $ (36,541) $ —Purchases of property and equipment (21,072) (12,014) Proceeds from disposition of property and equipment 271 —Other investing activities (2,350) (1,000) Additions to license and patent costs (875) (790)
Net cash used in investing activities $ (60,567) $ (13,804) The primary outflows of cash relate to the acquisition of Vertex, which we acquired for an aggregate purchase price of $34.3 million, net of cash acquired, and investments in property, plant and equipment as we invest in infrastructure, add to our on-demand manufacturing service and equip facilities for new product development efforts.
Cash flow from financing activities
Table 17 summarizes the components of cash used in financing activities for the nine months ended September 30, 2017 and 2016: Table 17
Nine Months Ended September 30,
2017 2016
(Dollars in thousands) Payments on earnout consideration $ (3,206) $ —Payments related to net-share settlement of stock-based compensation (4,494) (1,507) Repayment of capital lease obligations (297) (786)
Net cash used in financing activities $ (7,997) $ (2,293) Contractual commitments and off-balance sheet arrangements
Credit facilities
In October 2014, we entered into a $150.0 million five-year revolving, unsecured credit facility. The agreement provides for advances in the initial aggregate principal amount of up to $150.0 million. Subject to certain terms and conditions contained in the agreement, we may, at our option, request an increase in the aggregate principal amount available under the credit facility by an additional $75.0 million. As of September 30, 2017 and December 31, 2016, there was no outstanding balance on the credit facility. Based on current financial covenant limitations at September 30, 2017, availability on the credit facility would be approximately $150.0 million. Future results may impact availability. See Note 8 to the condensed consolidated financial statements.
Capitalized lease obligations
Our capitalized lease obligations include a lease agreement that we entered into during 2006 with respect to our Rock Hill, SC facility, in addition to other lease agreements assumed through acquisitions. In accordance with ASC 840, “Leases,” we are considered an owner of the properties, therefore, we have recorded these amounts in our consolidated balance sheet with a corresponding capitalized lease obligation in the liabilities section of the consolidated balance sheet. Our outstanding capitalized lease obligations carrying value at September 30, 2017 and December 31, 2016 was $7.9 million and $8.2 million, respectively.

28
Other contractual arrangements
We lease certain of our facilities and equipment under non-cancelable operating leases. For the quarters ended September 30, 2017 and 2016, rent expense under operating leases was $4.0 million and $3.5 million, respectively. Certain of our acquisition purchase agreements contain earnout payment provisions under which the sellers of the acquired businesses can earn additional amounts. The total amount of liabilities recorded for these earnouts is $8.3 million and $10.8 million at September 30, 2017 and December 31, 2016, respectively.
Off-balance sheet arrangements
We have no off-balance sheet arrangements and do not utilize any “structured debt,” “special purpose,” or similar unconsolidated entities for liquidity or financing purposes. Recent Accounting Pronouncements Our critical accounting policies are disclosed in our Annual Report on Form 10-K for the year ended December 31, 2016 (“Form 10-K”) and Note 1 to our condensed consolidated financial statements. The only change to our critical accounting policies during the nine months ended September 30, 2017 was a modification to the way in which we account for forfeitures of share-based awards. Specifically, beginning in the first quarter of 2017, we recognize forfeitures of share-based awards as they occur in the period of forfeiture rather than estimating the number of awards expected to be forfeited at the grant date and subsequently adjusting the estimate when awards are actually forfeited. This change did not have a material impact on our results of operations in the current period, and is not expected to have a material impact on results of operations in subsequent periods. Critical Accounting Policies and Significant Estimates Except as described below, there have been no material changes from the Critical Accounting Policies and Significant Estimates as previously disclosed in “Management’s Discussion and Analysis of Financial Condition and Results of Operations – Critical Accounting Policies and Significant Estimates” in our Form 10-K. Contingencies We account for contingencies in accordance with ASC 450, “Contingencies” (“ASC 450”). ASC 450 requires that we record an estimated loss from a loss contingency when information available prior to issuance of our financial statements indicates that it is probable that an asset has been impaired or a liability has been incurred at the date of the financial statements and the amount of the loss can be reasonably estimated. Accounting for contingencies such as legal matters requires us to use our judgment. See Note 14 to the Financial Statements in Part I, Item 1 of this Form 10-Q and Note 22 to the consolidated financial statements in our Form 10-K. Forward-Looking Statements Certain statements made in this Form 10-Q that are not statements of historical or current facts are forward-looking statements within the meaning of the Private Securities Litigation Reform Act of 1995. Forward-looking statements involve known and unknown risks, uncertainties and other factors that may cause our actual results, performance or achievements to be materially different from historical results or from any future results expressed or implied by such forward-looking statements. In many cases, you can identify forward-looking statements by terms such as “believes,” “belief,” “expects,” “estimates,” “intends,” “anticipates,” or “plans” or the negative of these terms or other comparable terminology. Forward-looking statements are based upon management’s beliefs, assumptions and current expectations concerning future events and trends, using information currently available, and are necessarily subject to uncertainties, many of which are outside our control. Although we believe that the expectations reflected in the forward-looking statements are reasonable, forward-looking statements are not, and should not be relied upon as a guarantee of future performance or results, nor will they necessarily prove to be accurate indications of the times at or by which any such performance or results will be achieved. A number of important factors could cause actual results to differ materially from those indicated by the forward-looking statements. These factors include without limitation:
competitive industry pressures; our ability to deliver products that meet changing technology and customer needs; our ability to identify strategic acquisitions, to integrate such acquisitions into our business without disruption and to realize
the anticipated benefits of such acquisitions; impact of future write-off or write-downs of intangible assets; our ability to acquire and enforce intellectual property rights and defend such rights against third party claims;

29
our ability to protect our intellectual property rights and confidential information, including our digital content, from third-party infringers or unauthorized copying, use or disclosure;
failure of our information technology infrastructure or inability to protect against cyber-attack; our ability to generate net cash flow from operations; our ability to obtain additional financing on acceptable terms; impact of global economic, political and social conditions and financial markets on our business; fluctuations in our gross profit margins, operating income or loss and/or net income or loss; our ability to efficiently conduct business outside the U.S.; our dependence on our supply chain for components and sub-assemblies used in our 3D printers and other products and for raw
materials used in our print materials; our ability to manage the costs and effects of litigation, investigations or similar matters involving us or our subsidiaries; product quality problems that result in decreased sales and operating margin, product returns, product liability, warranty or
other claims; our ability to retain our key employees and to attract and retain new qualified employees, while controlling our labor costs; our exposure to product liability claims and other claims and legal proceedings; disruption in our management information systems for inventory management, distribution, and other key functions; compliance with U.S. and other anti-corruption laws, data privacy laws, trade controls, economic sanctions, and similar laws
and regulations; changes in, or interpretation of, tax rules and regulations; and compliance with, and related expenses and challenges concerning, conflict-free minerals regulations; and the other factors discussed in the reports we file with or furnishes to the Securities and Exchange Commission (“SEC”) from
time to time, including the risks and important factors set forth in additional detail in “Risk Factors” in Part I, Item 1A of our Form 10-K filed with the SEC.
Certain of these and other factors are discussed in more detail in “Item 1A. Risk Factors” of our Form 10-K. Readers are cautioned not to place undue reliance on these forward-looking statements. The forward-looking statements included herein are made only as of the date of this Form 10-Q and we undertake no obligation to publicly update or review any forward-looking statement made by us or on our behalf, whether as a result of new information, future developments, subsequent events or circumstances or otherwise. All subsequent written or oral forward-looking statements attributable to us or individuals acting on our behalf are expressly qualified in their entirety by the cautionary statements referenced above. Item 3. Quantitative and Qualitative Disclosures about Market Risk. For a discussion of market risks at December 31, 2016, refer to Item 7A, “Quantitative and Qualitative Disclosures about Market Risk,” in our Form 10-K. During the first nine months of 2017, there were no material changes or developments that would materially alter the market risk assessment performed as of December 31, 2016. Item 4. Controls and Procedures. Evaluation of disclosure controls and procedures As of September 30, 2017, we carried out an evaluation, under the supervision and with the participation of our management, including our Chief Executive Officer and Chief Financial Officer, of the effectiveness of the design and operation of our disclosure controls and procedures (as defined in Rules 13a-15(e) and 15d-15(e) of the Securities Exchange Act of 1934, as amended (the “Exchange Act”)) pursuant to Rules 13a-15 and 15d-15 under the Exchange Act. These controls and procedures were designed to provide reasonable assurance that the information required to be disclosed in the reports that we file or submit under the Exchange Act is recorded, processed, summarized and reported within the time periods specified in the SEC’s rules and forms and that such information is accumulated and communicated to our management, including our Chief Executive Officer and Chief Financial Officer, in a manner to allow timely decisions regarding required disclosures. Based on this evaluation, including an evaluation of the rules referred to above in this Item 4, management has concluded that our disclosure controls and procedures were effective as of September 30, 2017 to provide reasonable assurance that the information required to be disclosed in the reports we file or submit under the Exchange Act is recorded, processed, summarized and reported within the time periods specified in the SEC’s rules and forms and that such information is accumulated and communicated to management, including our Chief Executive Officer and Chief Financial Officer, in a manner to allow timely decisions regarding required disclosures. Changes in Internal Controls over Financial Reporting There were no material changes in our internal controls over financial reporting during the period covered by this Form 10-Q that have materially affected, or are reasonably likely to materially affect, our internal control over financial reporting.

30
PART II — OTHER INFORMATION
Item 1. Legal Proceedings. The information set forth in “Litigation” in Note 14 – Commitments and Contingencies to the Financial Statements in Part I, Item 1 of this Form 10-Q is incorporated herein by reference. Item 1A. Risk Factors. Except as described below, there have been no material changes from the risk factors as previously disclosed in our Form 10-K. We have added the following risk factor titled “Export Compliance Exposure”: Export Compliance Exposure In October 2017 the Company received an administrative subpoena from the Bureau of Industry and Security of the Department of Commerce (“BIS”) requesting the production of records in connection with possible violations of U.S. export control laws, including with regard to its Quickparts.com, Inc. subsidiary. The Company is cooperating fully with the investigation, but cannot predict its ultimate resolution. The Company expects to incur significant legal costs and other expenses in connection with responding to the investigation. If the U.S. government finds that the Company has violated one or more export control laws or trade sanctions, the Company could be subject to various penalties. By statute, these penalties can include but are not limited to fines, which may be significant, denial of export privileges, and debarment from participation in U.S. government contracts; and any assessment of penalties could also harm the Company’s reputation, create negative investor sentiment, and affect the Company’s share value. The Company cannot at this time predict when BIS will conclude its investigation or determine an estimated cost, if any, or range of costs, for any penalties or fines that may be incurred upon resolution of this matter. Item 2. Unregistered Sales of Equity Securities and Use of Proceeds. Recent Issuances of Unregistered Securities None. Issuer Purchases of Equity Securities We did not repurchase any of our equity securities during the quarter or nine months ended September 30, 2017, except for unvested restricted stock awards repurchased or forfeited pursuant to our 2004 and 2015 Incentive Stock Plans.
Total number of shares (or units)
purchased
Average price paid per share
(or unit)
Total number of shares (or units) purchased as part of publicly announced plans
or programs
Maximum number (or approximate dollar value)
of shares (or units) that may yet be purchased
under the plans or programs
January 1, 2017 - January 31, 2017 31,761 $ 13.69 — $ —February 1, 2017 - February 28, 2017 35,710 16.61 — —March 1, 2017 - March 31, 2017 2,285 14.49 — —April 1, 2017 - April 30, 2017 20,369 14.87 — —May 1, 2017 - May 31, 2017 17,777 21.65 — —June 1, 2017 - June 30, 2017 9,229 20.67 — —July 1, 2016 - July 31, 2016 13,687 17.13 — —August 1, 2016 - August 31, 2016 127,259 17.08 — —September 1, 2016 - September 30, 2016 12,970 12.93 — —
Total 271,047 (a) $ 16.57 (b) — $ —
(a) Reflects shares of common stock surrendered to the Company for payment of tax withholding obligations in connection with
the vesting of restricted stock.
(b) The average price paid reflects the average market value of shares withheld for tax purposes.

31
Item 6. Exhibits.
3.1 Certificate of Incorporation of Registrant. (Incorporated by reference to Exhibit 3.1 to Form 8-B filed on August 16, 1993, and the amendment thereto, filed on Form 8-B/A on February 4, 1994.)
3.2 Amendment to Certificate of Incorporation filed on May 23, 1995. (Incorporated by reference to Exhibit 3.2 to
Registrant’s Registration Statement on Form S-2/A, filed on May 25, 1995.) 3.3 Certificate of Amendment of Certificate of Incorporation filed with Secretary of State of Delaware on May 19, 2004.
(Incorporated by reference to Exhibit 3.1 of the Registrant’s Quarterly Report on Form 10-Q for the quarterly period ended June 30, 2004, filed on August 5, 2004.)
3.4 Certificate of Amendment of Certificate of Incorporation filed with Secretary of State of Delaware on May 17, 2005.
(Incorporated by reference to Exhibit 3.1 of the Registrant’s Quarterly Report on Form 10-Q for the quarterly period ended June 30, 2005, filed on August 1, 2005.)
3.5 Certificate of Amendment of Certificate of Incorporation filed with the Secretary of State of Delaware on October 7,
2011. (Incorporated by reference to Exhibit 3.1 to Form 8-K filed on October 7, 2011.)
3.6 Certificate of Amendment of Certificate of Incorporation filed with the Secretary of State of Delaware on May 21,2013. (Incorporated by reference to Exhibit 3.1 of the Registrant’s Current Report on Form 8-K, filed on May 22, 2013.)
3.7 Amended and Restated By-Laws of 3D Systems Corporation. (Incorporated by reference to Exhibit 3.1 of Registrant’s
Current Report on Form 8-K filed on December 28, 2016.) 31.1 Certification of Principal Executive Officer filed pursuant to Section 302 of the Sarbanes-Oxley Act of 2002 dated
October 31, 2017. 31.2 Certification of Principal Financial Officer filed pursuant to Section 302 of the Sarbanes-Oxley Act of 2002 dated
October 31, 2017. 32.1 Certification of Principal Executive Officer filed pursuant to 18 U.S.C. Section 1350, as adopted pursuant to Section
906 of the Sarbanes-Oxley Act of 2002 dated October 31, 2017. 32.2 Certification of Principal Financial Officer filed pursuant to 18 U.S.C. Section 1350, as adopted pursuant to Section
906 of the Sarbanes-Oxley Act of 2002 dated October 31, 2017. 101.INS XBRL Instance Document. 101.SCH XBRL Taxonomy Extension Schema Document. 101.CAL XBRL Taxonomy Extension Calculation Linkbase Document. 101.DEF XBRL Taxonomy Extension Definition Linkbase Document. 101.LAB XBRL Taxonomy Extension Label Linkbase Document. 101.PRE XBRL Taxonomy Extension Presentation Linkbase Document. * Management contract or compensatory plan or arrangement

32
SIGNATURE
Pursuant to the requirements of the Securities Exchange Act of 1934, the registrant has duly caused this report to be signed on its behalf by the undersigned thereunto duly authorized.
3D SYSTEMS CORPORATION
By /s/ JOHN N. MCMULLEN John N. McMullen Executive Vice President and Chief Financial Officer (principal financial and accounting officer) (duly authorized officer)
Date: October 31, 2017