3d sph numerical simulation of the wave · pdf file3d sph numerical simulation of the wave...
TRANSCRIPT

Italian Journal of Engineering Geology and Environment - Book Series (6) www.ijege.uniroma1.it © 2013 Sapienza Università Editrice
445
DOI: 10.4408/IJEGE.2013-06.B-43
3D SPH NUMERICAL SIMULATION OF THE WAVE GENERATEDBY THE VAJONT ROCKSLIDE
Renato VACONDIO(*), SeRena PAGANI(*), Paolo MIGNOSA(*) & Rinaldo GENEVOIS(**)
(*) University of Parma, Department of Civil Engineering - Parco area delle Scienze 181/A, 43121 Parma (Italy)(**) University of Padova, Department of Geosciences - Via Gradenigo 6, 35131 Padova (Italy)
the border between Friuli Venezia-Giulia and Veneto (Northern Italy), fell into the artificial reservoir of the Vajont dam. The slide generated one of the most de-structive waves ever documented in the literature.
The wave overflowed the dam, which remained almost intact, and through the downstream narrow gorge reached the Piave valley and the village of Lon-garone, causing the loss of about 2000 people.
In the past 50 years the Vajont slide has been deeply analyzed from a geological point of view (Se-menza et alii, 1965; mülleR, 1987a; mülleR, 1987b; Semenza, 2001; GenevoiS & GhiRotti, 2005). Several authors investigated also its kinematics and dynamics (hendRon & Patton, 1985; Semenza & MELIDORO, 1992; eRiSmann & abele, 2001) and most of them agree that the rockslide can be schematized as a rigid body (mülleR, 1961; Selli & tReviSan, 1964; datei, 2005; SuPeRchi, 2011). There is also a general agree-ment (Selli & tReviSan, 1964; ciabatti, 1964; datei, 1969) about the total volume of the slide, which was estimated in about 270÷300 106 m3.
On the other hand few studies were devoted to the simulation of the wave generated by the rockslide. The older ones are mainly based on the empirical recon-struction of the wave, through the data collected by eye witnesses and by marks observed on the ground after the disaster (Selli & tReviSan, 1964; viPaRelli & meRla, 1968; Semenza, 2001; datei, 2005).
More recently boSa & Petti (2010) simulated these phenomenon by means of a 2D Shallow Wa-
ABSTRACTIn this paper a 3D numerical modeling of the
wave generated by the Vajont slide is presented. In order to completely describe the complex flow gener-ated by the slide a Smoothed Particle Hydrodynam-ics (SPH) technique was adopted. To the best of the author knowledge this is the first attempt to describe the events adopting a fully 3D numerical model which discretizes the Navier-Stokes Equations.
The SPH adopted herein is a meshless Lagrangian technique which is able to simulate the highly frag-mented violent flows generated by the falling slide in the Vajont artificial reservoir. Moreover the Compute Unified Device Architecture (CUDA) of nVidia devic-es parallelization technique has been adopted to obtain the speed-up sufficient for the high resolution needed to accurately describe the phenomenon.
The simulation results have been validated by com-paring the maximum run-up and the water level in the residual lake after the events against the ones reported in literature. In addition to that, the 3D velocity field of the flow during the event together with the discharge hy-drograph which overflowed the dam has been obtained.
Key words: Vajont, rockslide, smoothed particle hydrodyna-mics, Navier-Stokes, free-surface flows
INTRODUCTIONAt 22:39 of October 9th 1963 a catastrophic rock-
slide slipped from the northern slope of Mount Toc, on
email: [email protected], phone: +39 049 8279119

R. VACONDIO, S. PAGANI, P. MIGNOSA & R. GENEVOIS
446
International Conference Vajont 1963-2013. Thoughts and analyses after 50 years since the catastrophic landslide Padua, Italy - 8-10 October 2013
were reconstructed. Moreover, assuming that the slide can be described as a rigid body which rotates around an axis, its kinematics has been calculated starting from the Newton’s second law.
The numerical model was validated by comparing the results against: a) the position of maximum wave run-up reported in Semenza et alii (1965); b) the in-creased water level of the residual lake after the slide. The discharge hydrograph that overflowed the dam was also evaluated.
SPH NUMERICAL SCHEMEThrough the SPH technique, the continuum is
represented as a set of discrete particles, character-ized by their own physical properties (such as mass, density, pressure).
The main feature of the SPH technique is to ap-proximate a generic scalar function A(r) at any point r, as follows:
where h is the so-called “smoothing length” and W(r-r', h) is the weighting function or kernel. This notation in discrete form becomes:
where the summation is extended to all the particles within the domain of influence of the particle a (2h for the kernel function herein adopted), mb and ρb are respectively the mass and the density of particle b.
The gradient of the generic scalar function A'(r)can be approximated by means of an SPH interpolation, as:
which can be written in discrete form as:
In this work the quantic Wendland kernel (Wend-land, 1995) is adopted:
where q=││r-r'││/h and αD is 21/(16πh3).The movement of the particles is defined by in-
tegrating in time the Navier-Stokes equations written for a weakly compressible fluid. In Lagrangian for-malism the continuity equation can be written as
ter model. The slide was schematized as a moving vertical wall which acted as a “piston” in moving the water of the Vajont lake. After the halt of the slide the wall was removed from the model and the “before” terrain elevation was substituted with the “after” configuration of the valley.
In the writers’ opinion, however, the wave can be only approximately described by this type of sche-matization and by means of a two-dimensional depth averaged numerical scheme, which neglects the ver-tical velocity component and assumes that the pres-sure is hydrostatic.
On the other hand, three-dimensional Eulerian models, already widespread in other Computational Fluid Dynamic (CFD) fields, are difficult to apply in this case due to the presence of a highly fragmented free surface and due to the computational effort neces-sary to adequately describe the water body.
In this work a 3D Smoothed Particle Hydrody-namics (SPH) model was used in order to simulate the wave generated by the Vajont rockslide. To the authors’ knowledge, this is the first literature contribu-tion which applies a fully 3D model to the slide move-ment and to the wave simulation.
The “Smoothed Particle Hydrodynamics” (SPH) is a Lagrangian meshless method originally intro-duced in astrophysics (GinGold & monaGhan, 1977) and subsequently extended to Computational Fluid Dynamics (monaGhan, 1994).
This numerical technique enables the numeri-cal simulation of free-surface flows with violent im-pact, such as: breaking waves (dalRymPle & RoGeRS, 2006), dam-break phenomena (cReSPo et alii, 2008), interactions between waves and coastal structures (Gómez-GeSteiRa & dalRymPle, 2004), etc.. The main drawback of the SPH technique is the high computa-tional cost which has prevented till now its applica-tion to practical engineering problem with complex geometries. Recently cReSPo et alii (2011) developed a parallel algorithm named “Dualsphysics” (http://www.dual.sphysics.org/) which overcame this limita-tion by means of the Compute Unified Device Archi-tecture (CUDA) available for nVidia devices. In this way a speed-up of approximately 50-100 with respect of CPU runtime of non-parallel codes was obtained. The same open-source code is herein adopted.
Following the work of SuPeRchi (2011), the 3D shape of the sliding surface and of the rockslide body
(1)
(2)
(3)
(4)
(5)
(6)

3D SPH NUMERICAL SIMULATION OF THE WAVE GENERATED BY THE VAJONT ROCKSLIDE
Italian Journal of Engineering Geology and Environment - Book Series (6) www.ijege.uniroma1.it © 2013 Sapienza Università Editrice
447
the density variation within the 1% c0 is set equal to 20 times the maximum expected velocity.
Particle position is updated using the following XSPH velocity correction (monaGhan, 1994):
where ε =0.5 and ρab=(ρa+ ρb)
/ 2ρ. This method moves particle a with a velocity that is close to the average velocity in its neighborhood.
Time-step Δt is calculated according to the Cour-ant-Friedrichs-Lewy condition, the forcing terms and the viscous diffusion terms (monaGhan, 1989), so Δt is equal to:
Δt = CFL · min(Δtf , Δtcv);
with:
where |fa| is the magnitude of the force per unit of mass for particle a, and Δtcv combines the Courant and the viscous time-step controls and CFL is the Courant number. In this work CFL = 0.4 has been used.
Equations (7), (9) and (13) are updated in time using a symplectic time integration algorithm (LEIM-
KHULER et alii, 1996). The values of density and par-ticle position are calculated at the middle of the time step n+1/2 as:
where t = nΔt. Pressure, pa n+1/2, is calculated using the
equation of state (11). In the second stage the accelera-tion dva
n+1/2/dt gives the velocity and hence the posi-tion at the end of the time step:
At the end of the time step dρan+1/ dt is calculated
using the updated values of va n+1 and ra
n+1.The discretization of solid boundary conditions
is still an open problem in SPH models. In this work the “dynamic boundary particles” method is adopted (cReSPo et alii, 2007). This method guarantees that complex domains can be easily discretized and leads to a good compromise between accuracy and compu-tational costs. The boundaries are discretized by a set
where v is the velocity vector and ρ is the density. Discretizing the▼v by means of the SPH interpolation Equation (6) becomes:
where▼aWab is the gradient of the kernel function. The summation of Equation (7) is over all the particles with-in the region of compact support of the kernel function.
The momentum conservation equation in a con-tinuum field is:
where p is the pressure and Θ is the dissipative term.In SPH notation, Equation (8) can be written as:
in which pa and ρa are respectively the pressure and density for the particle a (same thing goes for the par-ticle b) and πab is the artificial viscosity (MONAGHAN, 1994) defined as follows:
with:
In Eq. (10) rab= ra- rb, vab= va− vb being rk and vk
the position and the velocity corresponding to particle k (a or b); cab (ca+ cb)/2, η2=0.01h2, αv is a free param-eter that needs to be tuned. In this work the value of αv=
0.2 is adopted.In the SPH method the fluid is simulated as weak-
ly compressible using the following equation of state (batcheloR, 1974) which connects pressure p and density ρ:
where B can be written as:
in which ρ0 is the reference density (1000 kg/m3), c0 is the speed of sound at the reference density, p is the pressure and γ is a dimensionless parameter taken equal to 7. In the numerical scheme the speed of sound c0 is conveniently reduced with respect to its physical value to obtain reasonable time steps (according to the Courant-Friedrichs-Lewy condition). In order to keep
(7)
(8)
(9)
(10)
(12)
(11)
(13)

R. VACONDIO, S. PAGANI, P. MIGNOSA & R. GENEVOIS
448
International Conference Vajont 1963-2013. Thoughts and analyses after 50 years since the catastrophic landslide Padua, Italy - 8-10 October 2013
Similarly, the shape of the slide body after the fall has been reconstructed by intersecting the post-slide topography (obtained from Lidar survey data) with the surface obtained by subtracting the volume of the slide from the pre-slide topography (Fig. 1).
Once defined the shape of the rockslide body, the XYZ coordinates of the barycenter in the pre-slide configuration bpre has been calculated discretizing the entire volume of the slide by means of N parallelepi-ped columns with a regular squared base Δx = Δy = 5 m and variable height d. Assuming constant density for the entire mass, the following expression holds:
where Vtot is the total volume of the slideand xi is the vector of coordinates of the center of mass of the i-th parallelepiped. The coordinates of the barycenter of the rockslide mass after the event, bpost, was obtained in a similar way. It follows that the distance between the two centers of gravity db is equal to 326 m.
In order to define the movement of the slide from the initial to the final configuration, we made the fol-lowing assumptions (ciabatti, 1964; datei, 2005):- the entire mass is concentrated in the barycenter
of the slide;- the barycenter moved from bpre to bpost along a cir-
cular arc with radius R (which needs to be defined);- the axis of rotation is normal to the vertical plane
containing the position of the two centers of gravity.On the basis of the previous assumptions it fol-
lows that the equation in the 3D space of the rotation axis (and so the entire movement of the rockslide, as-sumed as a rigid body) depends only on the value of the radius R. In other words, once R is defined, the coordinate vector of the i-th point of the mass slide
of solid particles that satisfy the same equations of the fluid ones (Equation (7) and (9)), but their position is not calculated using Equation (13) as for the fluid particles. The boundary particles which describe the Vajont valley do not modify their position during the simulation, whereas the boundary particles which dis-cretize the landslide body are moved according to the velocity assigned to the slide.
KINEMATICS OF THE ROCKSLIDERecent and current researches, carried out at
theGeosciences Department (University of Padova, Italy), focus on the relationships between the land-slide mass before and after the failure event. In par-ticular, the obtained results show that the volume of the slid mass is just a little bit higher than that of the original in-situ mass, the difference being appar-ently in the range of inevitable errors due to the low accuracy of the pre-failure maps.
Besides, the shape of the sliding surface has been generally assumed as a "chair" shape (SuPeRchi, 2011), but the difference between the real shape and that of the corresponding circular arc has been consid-ered by many Authors negligible.
GEOMETRY OF THE SLIDE BODYThe 3D geometry of the sliding surface was re-
cently reconstructed by SuPeRchi (2011) and biStacchi (2013, present Conference) (see Fig. 1) by analyzing the pre- and post- slide maps and through seismic sections and boreholes stratigraphy interpretation. In the present work the 3D shape of the rockslide body before the fall (Fig. 2) has been defined by intersecting the pre-slide topographical map of Semenza et alii (1965) with the sliding surface (SuPeRchi, 2011). In such way the vol-ume of the rockslide was estimated of about 310·106 m3.
Fig. 1 - Sliding surface 3D view (with the sliding sur-face in red)
Fig. 2 - Three-dimensional representation of the body rockslide and the valley of the Vajont
(14)

3D SPH NUMERICAL SIMULATION OF THE WAVE GENERATED BY THE VAJONT ROCKSLIDE
Italian Journal of Engineering Geology and Environment - Book Series (6) www.ijege.uniroma1.it © 2013 Sapienza Università Editrice
449
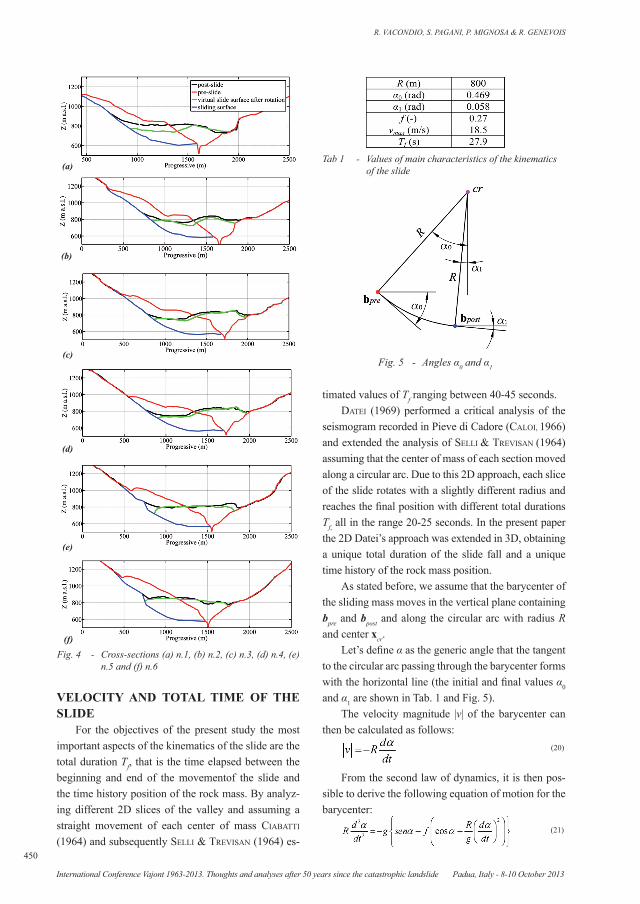
L2 (R) is equal to 800 m, which correspond to the rotation axis shown in Fig. 3. The value of R herein obtained substantially agrees with those obtained by DATEI (1969) analizing different sections of the slide (830 - 912 m).
In Figure 3 the traces of six cross-sections of the Vajont valley are drawn. The cross sections are then plotted in Fig. 4 with the following information:- the shape of the valley before the slide (Semenza
et alii, 1965 - red line);- the sliding surface (SuPeRchi, 2011 - blue line);- the real shape of the valley after the slide
(black line);- the virtual surface of the slide obtained accor-
ding to the procedure previously described (gre-en line).From Fig. 4 it can be appreciated that the green
line reasonably superimposes with the black one. This means that the assumed rotational movement is able to reproduce the post-slide configuration of the val-ley starting from the pre-slide configuration. Hence the assumption of considering the rockslide as a rigid object which rotates around an axis is confirmed. The differences between virtual and real topographies are not negligible only in section 1, which is the one closer to the dam. This suggests that in this zone the hypothesis that the landslide is representable as a rigid body is not fully verified.
at the end of the movement xirot is defined as follows:
where xipre and xcr are, respectively, the coordinate
vectors of the i-th point before the slide and of the in-tersection point between the vertical plane containing bpre and bpost and the rotation axis of the slide. In (15) A and B are defined as:
with:,
.
The xcr vector can be calculated from the follow-ing equation:
xcr= a-1 x’cr+ bpre
with x’cr defined as:
where
Starting from the pre- configuration of the valley and rotating the rockslide mass from the initial to the final position, the virtual post- configuration of the valley is reconstructed. This can be compared against the real topography obtained on the basis of post-slide surveys. The L2 norm of the differences of the eleva-tions of the two surfaces can be calculated as follows:
where zirot is the elevation of the i-th point of the vir-
tual surface obtained by rotating the body of the slide from the initial to the final position, and zi
pos the eleva-tion of the same point in the real post-slide topogra-phy. The value of the radius R has been defined by minimizing the norm of Equation (19).
The value of the radius R which minimizes the
Fig. 3 - Plan traces of some cross-sections shown on the bathymetry of the valley before 1963 . The track of the rotational axis is also shown
(15)
(16)
(17)
(18)
(19)
R. VACONDIO, S. PAGANI, P. MIGNOSA & R. GENEVOIS
450
International Conference Vajont 1963-2013. Thoughts and analyses after 50 years since the catastrophic landslide Padua, Italy - 8-10 October 2013
VELOCITY AND TOTAL TIME OF THE SLIDE
For the objectives of the present study the most important aspects of the kinematics of the slide are the total duration Tf, that is the time elapsed between the beginning and end of the movementof the slide and the time history position of the rock mass. By analyz-ing different 2D slices of the valley and assuming a straight movement of each center of mass CIABATTI
(1964) and subsequently SELLI & TREVISAN (1964) es-
timated values of Tf ranging between 40-45 seconds.DATEI (1969) performed a critical analysis of the
seismogram recorded in Pieve di Cadore (CALOI, 1966) and extended the analysis of SELLI & TREVISAN (1964) assuming that the center of mass of each section moved along a circular arc. Due to this 2D approach, each slice of the slide rotates with a slightly different radius and reaches the final position with different total durations Tf, all in the range 20-25 seconds. In the present paper the 2D Datei’s approach was extended in 3D, obtaining a unique total duration of the slide fall and a unique time history of the rock mass position.
As stated before, we assume that the barycenter of the sliding mass moves in the vertical plane containing bpre and bpost and along the circular arc with radius R and center xcr.
Let’s define α as the generic angle that the tangent to the circular arc passing through the barycenter forms with the horizontal line (the initial and final values α0
and α1 are shown in Tab. 1 and Fig. 5).The velocity magnitude |v| of the barycenter can
then be calculated as follows:
From the second law of dynamics, it is then pos-sible to derive the following equation of motion for the barycenter:
Fig. 4 - Cross-sections (a) n.1, (b) n.2, (c) n.3, (d) n.4, (e) n.5 and (f) n.6
Tab 1 - Values of main characteristics of the kinematics of the slide
Fig. 5 - Angles α0 and α1
(a)
(b)
(c)
(d)
(e)
(f)
(20)
(21)

3D SPH NUMERICAL SIMULATION OF THE WAVE GENERATED BY THE VAJONT ROCKSLIDE
Italian Journal of Engineering Geology and Environment - Book Series (6) www.ijege.uniroma1.it © 2013 Sapienza Università Editrice
451
ably influence the main characteristics of the flow are the maximum velocity magnitude of the slide as well as its total duration Tf.
The values calculated in the previous section (Tf = 27.9 s and vmax= 18.5 m/s) were adopted in the very first simulation. However the maximum run-up obtained by the numerical model signifi-cantly underestimates the historical one reported by SEMENZA et alii (1965). This can be explained by considering that the Equation (22) has been ob-tained by making significant simplifications of the physical phenomenon. For example the total mass of the slide was concentrated in the barycenter, and thus the effect of the forces exerted on the sliding surface by the valley have been schematized by a time-constant friction coefficient. Moreover the ef-fect of the water body on the rockslide movement was also neglected.
For these reasons, it was decided to simulate dif-ferent total durations of the slide, modifying the ve-locity magnitude accordingly.
After some trials, the best results were obtained with a total duration of the slide (Tf) equal to 17 sec-onds, which corresponds to a maximum velocity vmax
equal to 30 m/s.In the following the main results of this simulation
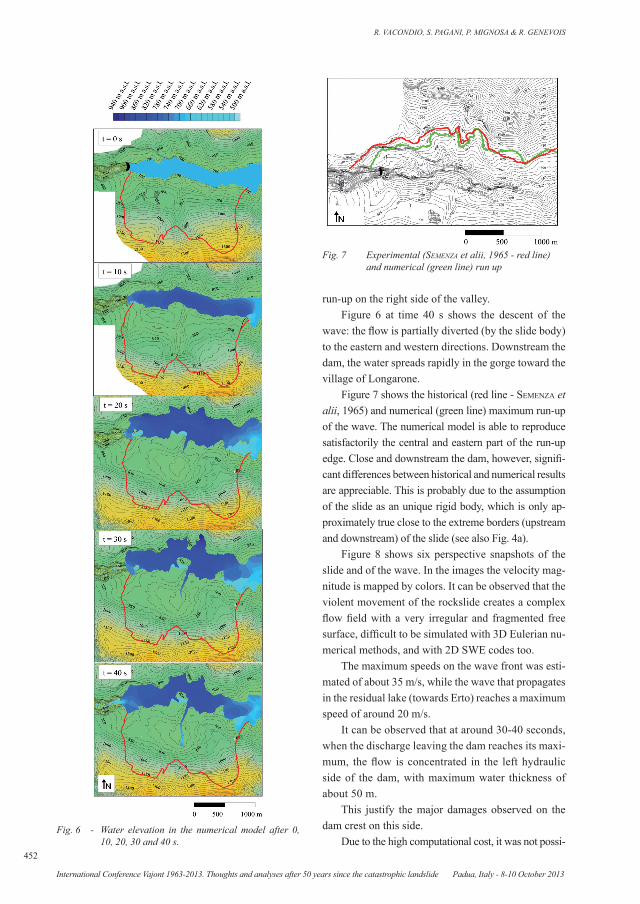
were described. Figure 6 shows the plan snapshots of the free surface elevation with a time interval of 10 s, starting from the beginning of the slide movement. After 10 seconds the water already starts to overflow the dam, mainly in the right side of the valley. After 20 seconds the slide movement has already stopped, while the wave front continues to rise the north side of the Vajont valley. The flow begins to divide into four portions: I) one overtops the dam and moves into the Vajont gorge towards the Piave Valley (west), II) the central part continues to climb the right side of the valley (north), III) a small part moves south retracing the valley furrow of Massalezza, and IV) a consistent part propagates toward Erto (east).
At t = 30 seconds the wave reaches the maximum
where f is the friction coefficient and g is the gravity acceleration. We remark that the Equation (21) is ob-tained assuming that the mass moves from the initial to the final position with a positive velocity (dα / dt <0) and also that the force exerted by the water mass on the rockslide body is negligible.
With simple algebraic manipulation on Equation (21), the following differential equation can be ob-tained (DATEI, 1969):
The term -f (dα/dt)2 is due to the centrifugal force and is from here on neglected because of its small con-tribution (datei, 1969).
Equation (22) can be integrated imposing that that at t=0 α=α0 and at t=Tf α=α1 and also that dα/dt=0 both at t=0 and T=ft. After some algebra (datei, 1969) the velocity magnitude |v| time his-tory can be expressed as:
where αmax is the angle at which the velocity reaches its maximum and it can be calculated as follows:
The time Tf at which the barycenter reaches its final position and hence the slide mass stops can be calculated as:
The maximum magnitude of the velocity vmax is obtained as:
In Table 1 the values of f, vmax and Tf obtained by applying the previous equations are reported.
NUMERICAL SIMULATIONS AND RE-SULTS
The initial water elevation in the lake was set at the historical value of the day of the event (about 700 m a.s.l.). The three-dimensional domain (valley slopes, slide and water bodies) was then discretized into cubic cells of side Δx equal to 5 m and with a smoothing length h = 1.5 Δx, leading to the number of particles reported in Table 2.
A preliminary sensitivity analysis of the numerical model has shown that the parameters which remark- Tab. 2 - Number of particles of the model
(22)
(23)
(24)
(25)
R. VACONDIO, S. PAGANI, P. MIGNOSA & R. GENEVOIS
452
International Conference Vajont 1963-2013. Thoughts and analyses after 50 years since the catastrophic landslide Padua, Italy - 8-10 October 2013
Fig. 7 Experimental (Semenza et alii, 1965 - red line) and numerical (green line) run up
run-up on the right side of the valley.Figure 6 at time 40 s shows the descent of the
wave: the flow is partially diverted (by the slide body) to the eastern and western directions. Downstream the dam, the water spreads rapidly in the gorge toward the village of Longarone.
Figure 7 shows the historical (red line - Semenza et alii, 1965) and numerical (green line) maximum run-up of the wave. The numerical model is able to reproduce satisfactorily the central and eastern part of the run-up edge. Close and downstream the dam, however, signifi-cant differences between historical and numerical results are appreciable. This is probably due to the assumption of the slide as an unique rigid body, which is only ap-proximately true close to the extreme borders (upstream and downstream) of the slide (see also Fig. 4a).
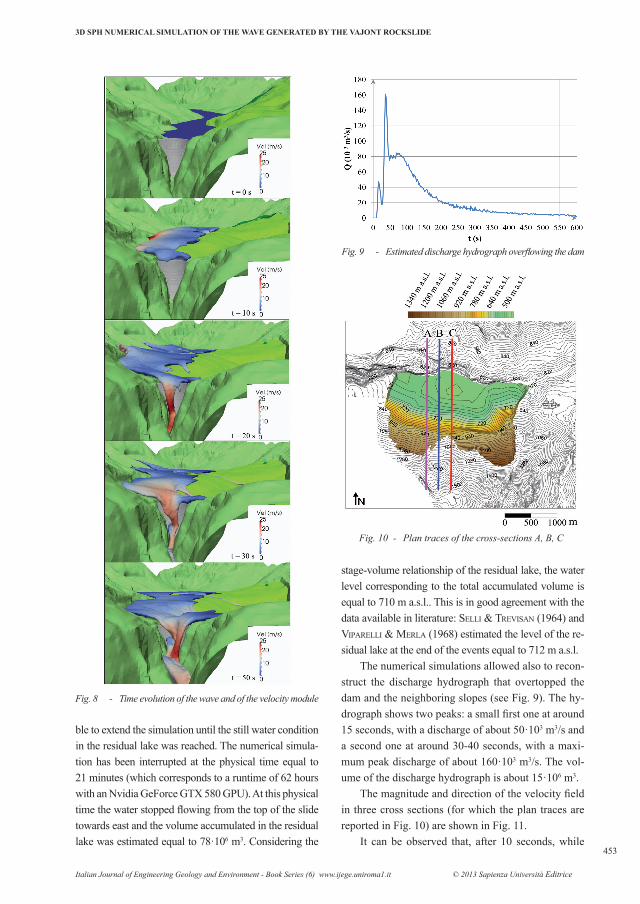
Figure 8 shows six perspective snapshots of the slide and of the wave. In the images the velocity mag-nitude is mapped by colors. It can be observed that the violent movement of the rockslide creates a complex flow field with a very irregular and fragmented free surface, difficult to be simulated with 3D Eulerian nu-merical methods, and with 2D SWE codes too.
The maximum speeds on the wave front was esti-mated of about 35 m/s, while the wave that propagates in the residual lake (towards Erto) reaches a maximum speed of around 20 m/s.
It can be observed that at around 30-40 seconds, when the discharge leaving the dam reaches its maxi-mum, the flow is concentrated in the left hydraulic side of the dam, with maximum water thickness of about 50 m.
This justify the major damages observed on the dam crest on this side.
Due to the high computational cost, it was not possi-Fig. 6 - Water elevation in the numerical model after 0,
10, 20, 30 and 40 s.
3D SPH NUMERICAL SIMULATION OF THE WAVE GENERATED BY THE VAJONT ROCKSLIDE
Italian Journal of Engineering Geology and Environment - Book Series (6) www.ijege.uniroma1.it © 2013 Sapienza Università Editrice
453
stage-volume relationship of the residual lake, the water level corresponding to the total accumulated volume is equal to 710 m a.s.l.. This is in good agreement with the data available in literature: Selli & tReviSan (1964) and viPaRelli & meRla (1968) estimated the level of the re-sidual lake at the end of the events equal to 712 m a.s.l.
The numerical simulations allowed also to recon-struct the discharge hydrograph that overtopped the dam and the neighboring slopes (see Fig. 9). The hy-drograph shows two peaks: a small first one at around 15 seconds, with a discharge of about 50·103 m3/s and a second one at around 30-40 seconds, with a maxi-mum peak discharge of about 160·103 m3/s. The vol-ume of the discharge hydrograph is about 15·106 m3.
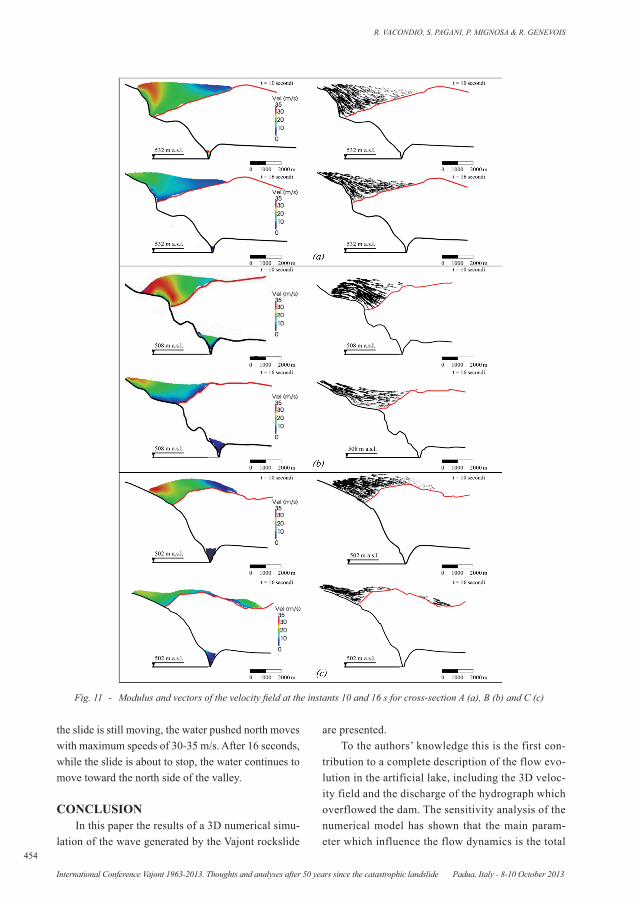
The magnitude and direction of the velocity field in three cross sections (for which the plan traces are reported in Fig. 10) are shown in Fig. 11.
It can be observed that, after 10 seconds, while
ble to extend the simulation until the still water condition in the residual lake was reached. The numerical simula-tion has been interrupted at the physical time equal to 21 minutes (which corresponds to a runtime of 62 hours with an Nvidia GeForce GTX 580 GPU). At this physical time the water stopped flowing from the top of the slide towards east and the volume accumulated in the residual lake was estimated equal to 78·106 m3. Considering the
Fig. 8 - Time evolution of the wave and of the velocity module
Fig. 9 - Estimated discharge hydrograph overflowing the dam
Fig. 10 - Plan traces of the cross-sections A, B, C
R. VACONDIO, S. PAGANI, P. MIGNOSA & R. GENEVOIS
454
International Conference Vajont 1963-2013. Thoughts and analyses after 50 years since the catastrophic landslide Padua, Italy - 8-10 October 2013
the slide is still moving, the water pushed north moves with maximum speeds of 30-35 m/s. After 16 seconds, while the slide is about to stop, the water continues to move toward the north side of the valley.
CONCLUSIONIn this paper the results of a 3D numerical simu-
lation of the wave generated by the Vajont rockslide
are presented.To the authors’ knowledge this is the first con-
tribution to a complete description of the flow evo-lution in the artificial lake, including the 3D veloc-ity field and the discharge of the hydrograph which overflowed the dam. The sensitivity analysis of the numerical model has shown that the main param-eter which influence the flow dynamics is the total
Fig. 11 - Modulus and vectors of the velocity field at the instants 10 and 16 s for cross-section A (a), B (b) and C (c)

3D SPH NUMERICAL SIMULATION OF THE WAVE GENERATED BY THE VAJONT ROCKSLIDE
Italian Journal of Engineering Geology and Environment - Book Series (6) www.ijege.uniroma1.it © 2013 Sapienza Università Editrice
455
late the propagation of the wave in the Vajont gorge, downstream the dam and in the Piave valley.
ACKNOWLEDGEMENTSWe are grateful to Dr. Alejandro, C. Crespo and
Mr. Jose M. Dominguez for the suggestions about the Dualsphysics code. We also want to thank Dr. Laura Superchi for providing the initial data of the slide. The High Perfomance Computing facilities where provid-ed by the CINECA inter-university consortium.
duration of the fall. In order to correctly reproduce the maximum historical run-up a total duration of the slide movement equal to 17 s is required.
The comparison between the results of the nu-merical simulation and the data available in literature shows that the numerical scheme is able to reproduce, together with the maximum run-up, also the level in the residual lake after the event.
The numerical results can be adopted in future works as an upstream boundary condition to simu-
REFERENCESbatcheloR G.K (1974) - Introduction to Fluid Dynamics. Cambridge University Press, UK.boSa S. & Petti M. (2010) - Shallow water numerical model of the wave generated by the Vajont landslide. Environmental
Modelling & Software, 26 (4): 406-418.caloi P. (1966) - L’evento del Vajont nei suoi aspetti geodinamici. Istituto Nazionale di Geofisica, Roma.ciabatti M. (1964). - La dinamica della frana del Vajont. Giornale di Geologia, 32: 139-160.cReSPo A.J.C., Gómez-GeSteiRa M. & dalyRymPle R.A. (2007) - Boundary conditions generated by dynamic particles in SPH
methods. Computers, Materials & Continua, 5: 173-184.cReSPo A.J.C., Gómez-GeSteiRa M. & dalyRymPle R.A. (2008) - Modeling dam-break behavior over a wet bed by a SPH
technique. Journal of Waterway, Port, Coastal and Ocean Engineering, 134: 313-320.cReSPo A.J.C, dominGuez J.m., baRReiRo A., Gómez-GeSteiRa M. & RoGeRS B.D. (2011) - GPUs, a New Tool of Acceleration in
CFD: Efficiency and Reliability on Smoothed Particle Hydrodynamics Methods. PLoS ONE, 6: e20685.dalyRymPle R.A. & RoGeRS B.D. (2006) - Numerical modeling of water waves with the SPH method. Coastal Engineering, 53:
141-147.datei C. (1969) - Su alcune questioni di carattere dinamico relative ad un eccezionale scoscendimento di un ammasso roccioso.
Memorie della Accademia Patavina, 89-108, Padova.datei C. (2005) - Vajont. La storia idraulica. Cortina, Padova.eRiSmann t.h. & abele G. (2001) - Dynamics of rockslides and rockfall. Springer-Verlag, Berlin-Heidelberg-New York, .Berlin.GenevoiS R. & GhiRotti m. (2005) - The 1963 Vaiont Landslide. Giornale di Geologia Applicata, 1: 41-52.GinGold R.A. & monaGhan J.J. (1977) - Smoothed particle hydrodynamics. Theory and application to non-spherical stars.
Monthly Notices of the Royal Astronomical Society, 181: 375-389.Gómez-GeSteiRa m. & dalyRymPle R. (2004) - Using a 3D SPH method for wave impact on a tall structure. Journal of Waterway,
Port, Coastal and Ocean Engineering, 130: 63-69.hendRon a.J. & Patton F.D. (1985) - The Vajont slide, a geotechnical analysis based on new geologic observations of the failure
surface. Engineering Geology, 24: 479-491.leimkuhleR b.J., Reich S. & Skeel R.d. (1996) - Integration Methods for Molecular dynamic IMA Volume in Mathematics and
its application. Springer.monaGhan J.J. (1989) - On the problem of penetration in particle methods. Journal of Computational Physics, 82: 1-15.monaGhan J.J. (1994) - Simulating free surface flows with SPH. Journal of Computational Physics, 110: 399-406.mülleR L. (1961) - Talsperre Vajont. 15° Baugeologischer Bericht: Die Felsgleitung im Bereich Toc. Unpublished technical
Report for S.A.D.E, Venezia.mülleR L. (1987a) - The Vajont catastrophe - A personal review. Engineering Geology, 24: 423 444.mülleR L. (1987b) - The Vajont slide. Engineering Geology, 24: 513 527.Semenza e., RoSSi d. & Giudici F. (1965) - Carte geologiche del versante settentrionale del Monte Toc e zone limitrofe, prima e
dopo il fenomeno di scivolamento del 9 ottobre 1963”. Scala 1:5000. Istituto di Geologia dell’Università di Padova, Padova.Selli R. & tReviSan l. (1964) - Caratteri e interpretazione della Frana del Vajont. Giornale di Geologia, 32: 1-154.Semenza E. (2001) - La storia del Vajont raccontata dal geologo che ha scoperto la frana. Tecomproject Ed. Multimediale, Ferrara.
R. VACONDIO, S. PAGANI, P. MIGNOSA & R. GENEVOIS
456
International Conference Vajont 1963-2013. Thoughts and analyses after 50 years since the catastrophic landslide Padua, Italy - 8-10 October 2013
Semenza e. & melidoRo G. (1992) - Proceedings of the meeting on the 1963 Vajont landslide. University of Ferrara, Ferrara.SuPeRchi L. (2011) - The Vajont rockslide: new techniques and tradizional method to re-evaluate the catastrophic event. Ph.D
thesis XXIV ciclo, Ph.D School in Earth Sciences, Università di Padova.viPaRelli m. & meRla G. (1968) - L'onda di piena seguita alla frana del Vajont. Atti dell’Accademia Pontaniana, 15.Wendland H. (1995) - Piecewiese polynomial, positive definite and compactly supported radial functions of minimal degree.
Advances in Computational Mathematics, 4: 389-3.