3d spectroscopy of bcds:inferring the star formation activity ismael martínez delgado in...
TRANSCRIPT

3D spectroscopy of BCDs:Inferring the Star
Formation Activity
Ismael Martínez Delgado
In collaboration with: G. Tenorio-Tagle, C. Muñoz-Tuñón,
A. Moiseev & L.M. Cairós
Granada, 2 March 2007
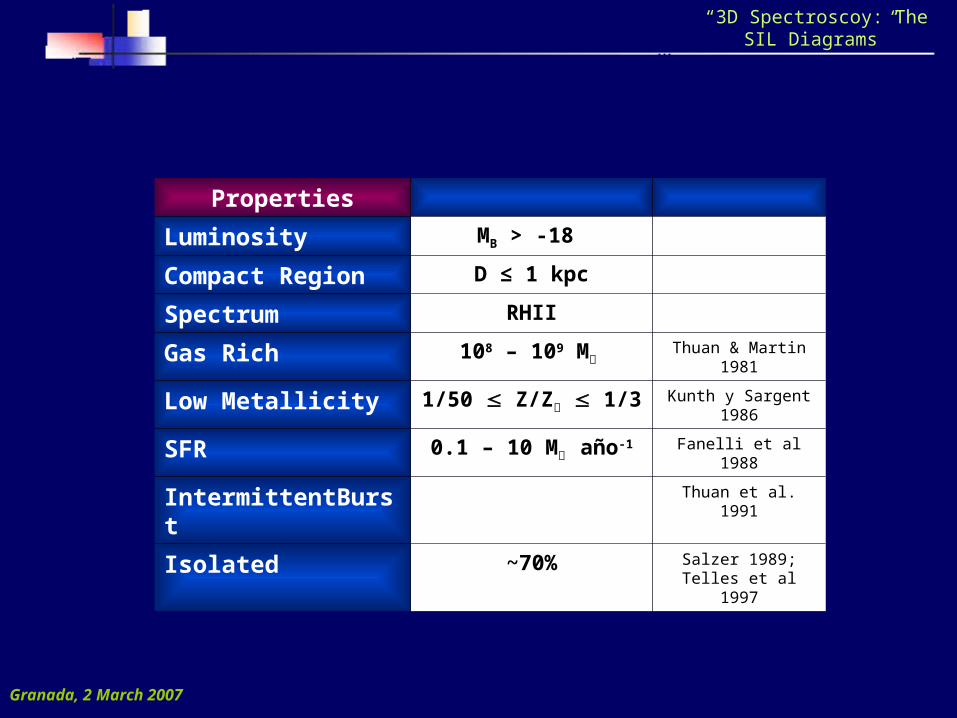
“3D Spectroscoy: The SIL Diagrams”
Properties
Luminosity MB > -18
Compact Region D ≤ 1 kpc
Spectrum RHII
Gas Rich 108 – 109 M๏ Thuan & Martin
1981
Low Metallicity 1/50 Z/Z๏ 1/3 Kunth y Sargent 1986
SFR 0.1 – 10 M๏ año-1 Fanelli et al 1988
IntermittentBurst
Thuan et al. 1991
Isolated ~70% Salzer 1989; Telles et al 1997

Big Telescope Alta-azimuthal (BTA)
Diameter 6m
Instrument SCORPIO-IFP
Spatial Resolution 0.7 " /pixel
Spectral Resolution 0.7 Å
Spectral Range 0.13 Å
Finnese 17
No. of spectral channel 32-40
Seeing > 1.5 "
Granada, 2 March 2007
“3D Spectroscoy: The SIL Diagrams”
ObservationsObservations

Ipeak (a.u.)
σ (km s-1)
λc (Å)
Single gaussian fit profile to the emission lines.
Metodology
Mrk 600
Main Parameters
Intensity at the peak, Ipeak
Central Wavelength, λc
Velocity Dispersion, σ
Granada, 2 March 2007
“3D Spectroscoy: The SIL Diagrams”

NGC604
Previous Work:
Shells, Filements, Bubbles
Nuclear regions
Muñoz-Tunón et al 1996 Granada, 2 March 2007
“3D Spectroscoy: The SIL Diagrams”

NGC604
The Sigma-Intensity-Lambda (SIL) diagrams:
I. Martínez-Delgado et al, AJ, June 2007
Muñoz-Tunón et al 1996 Granada, 2 March 2007
“3D Spectroscoy: The SIL Diagrams”

x (“)
y (
“)

x (“)
y (
“)
σ=33.2 km s-1
σ=33.0 km s-1
I. Martínez-Delgado, submitted to AJ (105-106 M ๏)

x (“)
y (
“)
σ=57.4 km s-1
σ=61.7 km s-1

x (“)
y (
“)
σ=19.3 km s-1
σ=7.3 km s-1
I. Martínez-Delgado et al, submitted to AJ (~104 M๏ )


σ=63.4 km s-1
σ=57.2 km s-1
I. Martínez-Delgado, submitted to AJ (105-106 M ๏)
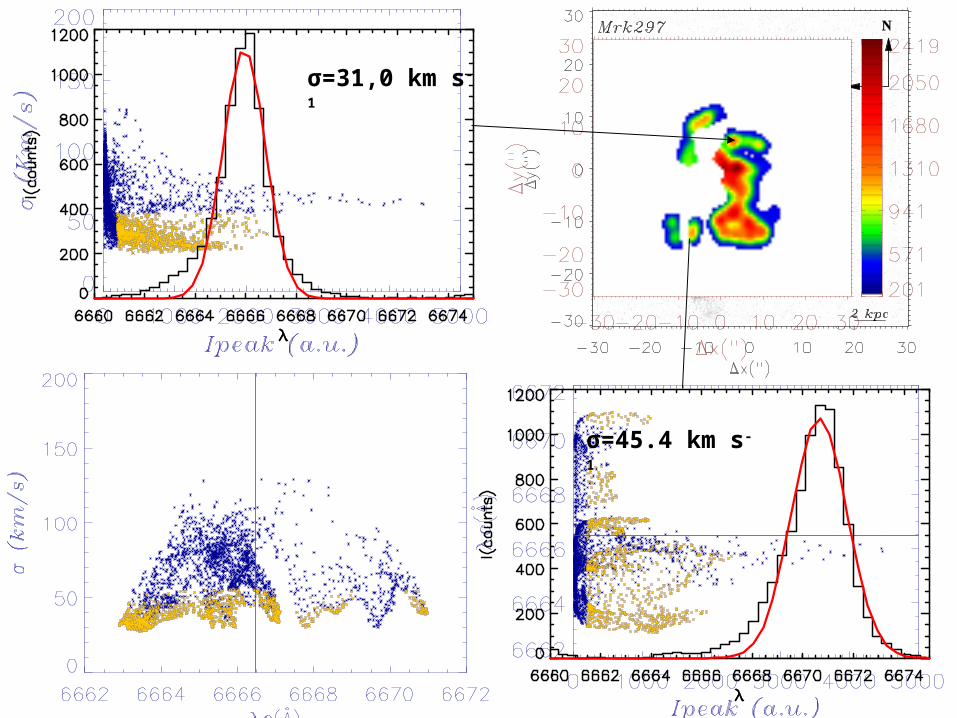
σ=31,0 km s-1
σ=45.4 km s-1
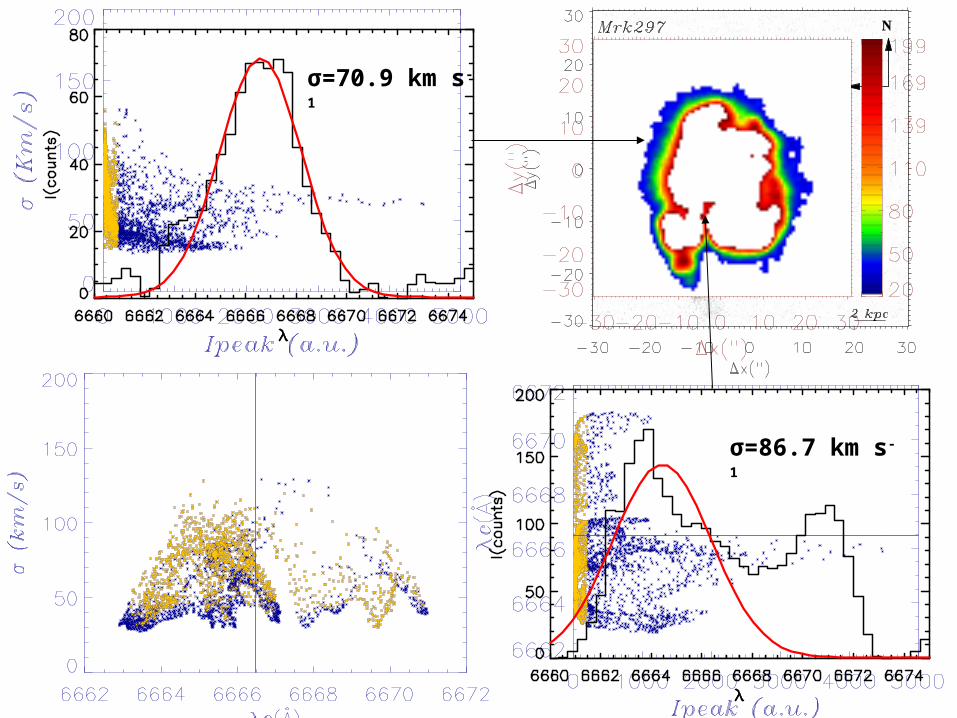
σ=70.9 km s-1
σ=86.7 km s-1


Galaxy - Galaxy Collision
Alloin & Duflot (1979) is a colliding system between two disk galaxies, one in the NW and the other in the SE
Taniguchi et al (1991) A co-planar radial penetration collision between two disk galaxies
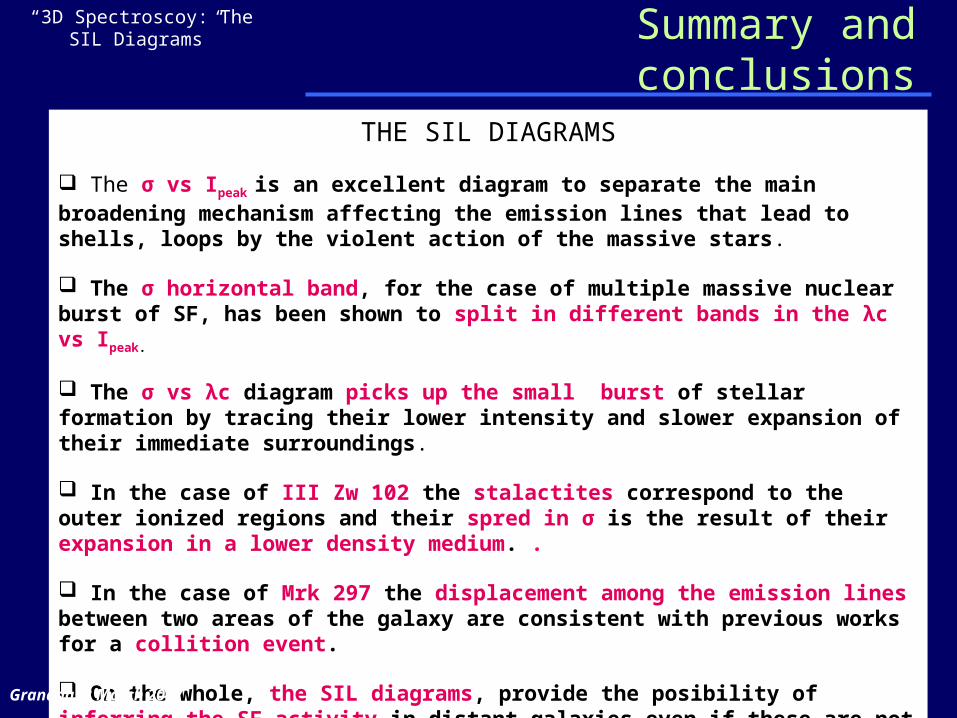
THE SIL DIAGRAMS
The σ vs Ipeak is an excellent diagram to separate the main broadening mechanism affecting the emission lines that lead to shells, loops by the violent action of the massive stars.
The σ horizontal band, for the case of multiple massive nuclear burst of SF, has been shown to split in different bands in the λc vs Ipeak.
The σ vs λc diagram picks up the small burst of stellar formation by tracing their lower intensity and slower expansion of their immediate surroundings.
In the case of III Zw 102 the stalactites correspond to the outer ionized regions and their spred in σ is the result of their expansion in a lower density medium. .
In the case of Mrk 297 the displacement among the emission lines between two areas of the galaxy are consistent with previous works for a collition event.
On the whole, the SIL diagrams, provide the posibility of inferring the SF activity in distant galaxies even if these are not spacially resolved by means of 3D spectroscopy.
Granada, 2 March 2007
“3D Spectroscoy: The SIL Diagrams” Summary and
conclusions

3D spectroscopy of BCDs:Inferring the Star
Formation Activity
Ismael Martínez Delgado
In collaboration with: G. Tenorio-Tagle, C. Muñoz-Tuñón, A. Moiseev & L.M. Cairós