3d seismic for design and derisking of dual geothermal ... · methodology is based on the use of 3d...
TRANSCRIPT

3D seismic for design and derisking of dual geothermal boreholesin sedimentary sequences and new prospects in the Paris Basin(Adapted methodology using petroleum industry techniques)Yvon Drouiller1,*, Franck Hanot2, Eric Gillot3, Jean-Charles Ferran3, and Loic Michel3
1 GWS-Consulting, 54-B chemin de Chantemerle, 74320 Sevrier, France2 CDP-Consulting, 7 boulevard Chanzy, 41000 Blois, France3 CGG, 27 avenue Carnot, 91341 Massy Cedex, France
Received: 2 February 2018 / Accepted: 20 December 2018
Abstract. The use of existing geological and structural maps, previous 2D seismic profiles, boreholes andcorrelation models between these data is sufficient to understand basin structure and thermal systems on aregional scale. However, this is not sufficient on a scale of a geothermal site to be sure of the hydraulic connec-tivity (or of the presence of a permeability barrier) between two boreholes 1.5 or 2 km apart.To ensure that there is enough hydraulic connectivity, it is necessary to understand the controls on the networkof fractures which affects the aquifer (fracture permeability) and the physical properties of the rock, namely theporosity and clay content in order to obtain a matrix permeability.The latest generation of broadband (six octaves) 3D seismic reflection will provide the following information:the similarity attribute will give an accurate structural map of the fault network at the seismic resolution and,in many cases, at a higher resolution than seismic; seismic velocity anisotropy analysis techniques will make itpossible to visualize a 3D volume of information on the fracture network [Michel et al. (2013) Application ofAzimuthal Seismic Inversion for Shale Gas Reservoir – Proceedings of the 11th SEGJ International Symposium,Yokohama]; acoustic impedance inversion or petrophysical inversion techniques will predict the porositythroughout the whole volume of the aquifer from a porosity log recorded in a pilot-hole. It allows a real 3D map-ping of predicted porosity inside the aquifer much more reliably than from modelling alone.These seismic techniques were initially developed for petroleum exploration and development. They haverapidly progressed throughout the last decade, both in acquisition, processing and interpretation with newmethodologies and high-performance softwares. They are efficient for modelling reservoirs to be produced.And, consequently, they can be used for geothermal applications as data to design dual deviated drillings withhorizontal drains in carbonate and clastic reservoirs – not only for new projects, but also to revisit old ones toimprove their performance or develop another reservoir.Broadband 3D seismic will secure the exploration of Triassic sandstones which stay an interesting prospect fordeep geothermal projects.New prospects are proposed in the Paris Basin: Regional faults overlap the substratum. Inside faulted zones,hydrothermal circulations arriving by convection at the top of granitic basement could be geothermal objec-tives, as in the Alsace Upper Rhine Graben.A production pilot site is suggested to test superimposed aquifers and a regional fault and, at the same time,two different architectures of boreholes doublets: horizontal drains for aquifers and deviated wells for crossinga regional fault.The first site that will use this approach could be instrumented and used as an experiment with a small additionof measurements and sensors, thus becoming a showcase for geothermal energy in France. The objective of thisexperiment would be to determine the transit time, the heating time of the re-injected water and the circulationspeed to define the optimal direction, spacing and length of drains, and also, to realize the thermal modelling ofthe site for different options.
* Corresponding author: [email protected]
This is an Open Access article distributed under the terms of the Creative Commons Attribution License (http://creativecommons.org/licenses/by/4.0),which permits unrestricted use, distribution, and reproduction in any medium, provided the original work is properly cited.
Oil & Gas Science and Technology - Rev. IFP Energies nouvelles 74, 32 (2019) Available online at:� Y. Drouiller et al., published by IFP Energies nouvelles, 2019 ogst.ifpenergiesnouvelles.fr
https://doi.org/10.2516/ogst/2018106
REGULAR ARTICLEREGULAR ARTICLE

1 Thermal systems for deep geothermics
During the last 35 years in France, geothermal boreholeshave been drilled in Dogger limestones of the Paris Basinand in the granitic basement of the Alsace Upper RhineGraben, i.e. in two different contexts because of their geol-ogy and thermodynamic situation.
The research project of Soultz in the Alsace UpperRhine Graben demonstrated that natural circulationsexisted in fractured and weathered granite, particularly inthe upper part of the basement [1]. Water is circulating ver-tically by convection inside fractures. The consequence ofthis observation is important. Top basement is becomingthe geothermal resource which obliges to target faults atthe top basement to get a good flow rate (Fig. 1).
The second conclusion of the Soultz research project con-cerns the sedimentary layers above the basement. The heatflow propagates upwards by conduction [1]. It’s the reason ofthe temperature decrease up to the ground surface.
Geothermal production will be different in both cases:
d In the basement fractured and weathered granite,faults with hydrothermal circulations will be searchedfor.
d In the sedimentary layers, the fracture network will beoperated inside porous and permeable reservoirs.
In the Paris Basin, the deepest boreholes have beendrilled by oil industry to investigate Dogger limestonesand Triassic sandstones. Ante-Triassic basement has beendrilled in many boreholes. Temperatures have been regis-tered in the sedimentary basin. They indicate also a naturalconductive thermal transfer.
2 Borehole architecture
For geothermal targets in France, more than thirty deepgeothermal boreholes have been drilled vertically or withstrong deviations up to 60�/vertical to produce the Doggerlimestones in the Paris Basin and the granitic basement inAlsace.
However, flows pumped from sedimentary aquifers withthis boreholes geometry do not systematically reach theminimum flow rate of 300 m3/h.
The first horizontal geothermal boreholes have beendrilled in 2017 in the town of Cachan, close to Paris. Theyhave been drilled along the same vertical section, in oppo-site directions, in the Dogger limestones. A good water flowrate of 400 m3/h has been obtained. It validates the hori-zontal drains design. That provides better results than ver-tical boreholes [2]. Although the hydraulic system is open,direct flow between these two drains is to be feared becausethey are too close.
A new methodology is proposed hereafter to designboreholes geometry for geothermal doublets/triplets tooptimize their location inside stratified aquifers. Themethodology is based on the use of 3D seismic calibratedby measurements in a pilot-hole. It is for all deep reservoirs,at any depth:
d LIMESTONES as Dogger limestones in the ParisBasin.
d SANDSTONES as Triassic fluviatile sandstones.
2.1 Arguments to revise the geometry of geothermalboreholes
In sedimentary layers, the aim is to obtain the desired flowsduring pumping and re-injecting.
2.1.1 Mode of water flow at the reservoir
The geometry of the boreholes inside the reservoir is of greatimportance for the water flow when it passes from the reser-voir rock into the borehole.
By examining the geometry of the boreholes in the aqui-fer, whether vertical, deflected at 30� or 60� to the vertical,we see that the flow of water is always radial and turbulent(Figs. 2 and 3a). This geometry is not adapted to horizontallayers.
Stratification, irregular layer thickness, clay jointsstrata, as well as fracturing, vertical variations of porosityand permeability from one layer to another, are all factorswhich constrain the flow of the water along the layers insidethe aquifer.
Thus, stratification, matrix porosity and fracturinginteract strongly in fluid flows within aquifers.
Approaching the borehole, the pressure decreases, andthe speed of water flow increases. The flow becomesturbulent.
This radial flow explains the low flow rates obtained anda part of the corrosion problems in the casings.
2.1.2 Advantages of horizontal drains
In the case of horizontal drains (Fig. 3b), the current flowlines become radial in a vertical plane which is perpendicu-lar to the horizontal drain.
Therefore, in the horizontal plane, the current linesfollow the stratification and the flow is laminar, regularand slower than in the case of vertical drilling.
The advantages of horizontal drains1 compared tovertical drilling are numerous:
1. Reduced water and gas coning because of reduceddrawdown in the reservoir for a given production rate,thereby reducing the remedial work required in thefuture.
2. Increased production rate because of the greater well-bore length exposed to the pay zone.
3. Reduced pressure drops around the wellbore.4. Lower fluid velocities around the wellbore.5. A general reduction in sand production (in sand-
stones) and in rock parts (in limestones) from a com-bination of Items 3 and 4.
6. Larger and more efficient drainage pattern leading toincreased overall reserves recovery.
1 http://petrowiki.org/Fluid_flow_in_horizontal_wells
Y. Drouiller et al.: Oil & Gas Science and Technology - Rev. IFP Energies nouvelles 74, 32 (2019)2

All these advantages lead to prefer horizontal drains forthe exploitation of a stratified reservoir.
2.2 Architecture proposed for doublet and tripletof geothermal boreholes in sedimentary layers
Sedimentary layers, and consequently reservoirs, are devel-oped in sub-horizontal directions during the sedimentation.After the compaction phenomena, they keep more or lessthis geometry. Their dip is generally low as in the ParisBasin.
To exploit the aquifers with a geothermal objective, theproposed architecture conforms to the classical distance of1–3 km between horizontal drains of the producer andinjector boreholes inside the reservoir.
Figure 4 shows an example of sophisticated architectureof boreholes (triplet) which becomes possible when a betterknowledge of the reservoir is available. Cold water isinjected into a different compartment. And a third drainallows to inject or to produce hot water, giving the operatorboth options depending on the season and the needs of theheating and cooling network.
For the methodology which is described hereafter, bore-holes will be drilled in three steps:
d Pilot hole drilled to register logs (density, sonic, Ver-tical Seismic Profile [VSP]) from the platform to thebottom for time-depth conversion of the seismic 3Dand logs to know rock properties of the reservoir(Gamma-ray, porosity Neutron, resistivity, etc.).
d Horizontal drain of the producer borehole: cementa-tion of the Pilot bottom hole until the KOP-2, devia-tion to arrive into the reservoir with the direction ofthe producer drain. And then, drilling of the horizon-tal drain.
d Injector borehole (and eventually the second injector/producer borehole), drilled entirely in one phase withtwo KOP (Kick-Off Points) for two deviations.
2.3 Continuous logs for a better calibrationof the seismic dataset
To design horizontal wells in thin layers (limestone or sand-stone), a good precision of converted seismic data in depthis required. Softwares for building a synthetic trace give thisrequired precision if the borehole measurements are preciseand continuous.
In other words, to avoid a bad calibration of the seismicdataset and, consequently, a bad time-depth conversion ofthe 3D seismic tainted with high uncertainty, continuouslogs are necessary on the whole length of the borehole forthe Sonic and the Density.
The aim is to obtain a synthetic seismogram withoutartefacts due to the lack of measurements at the casingshoes and changes in the diameter of the borehole.
To do this, it is necessary to make a ‘‘pocket’’ of about15 m (depending on the total length of the measurementtools and the position of the sensors on each tool) tohave common measurements in both runs of logs. With
Fig. 1. Thermal profiles in boreholes at Soultz, in the upper Rhine graben [1].
Y. Drouiller et al.: Oil & Gas Science and Technology - Rev. IFP Energies nouvelles 74, 32 (2019) 3

this method, Sonic and Density logs recorded from tworuns can be concatenated and then combined properly(Fig. 5).
The pocket is simple to do. Drillers have to locate eachcasing shoe at 15 m above the bottom hole. Cement willplug the entire borehole bottom and then will go upbetween the casing and the formation. The drilling duringthe following phase will destroy the column of cement belowthe casing shoe. And the following log run won’t see anycement during the measurements.
A VSP survey over the reservoir interval and above itwould complete the calibration of the well to the surfaceseismic image.
3 3D seismic to design a geothermal doublet(or triplet) of boreholes
The methodology is based on the latest petroleum tech-niques which have progressed significantly since 2010 [3].
Detailed seismic-reflection images of reservoirs are anessential pre-requisite to assess the feasibility of geothermalprojects and to reduce the risk associated with expensivedrilling programs [4].
Specificity of deep geothermal programs, technical andeconomic at the same time, requires to customize andadapts acquisition, processing and interpretation of the3D seismic dataset to the targets for:
Fig. 2. Type of flow in the aquifer depending on the geometry of the borehole.
Fig. 3. Comparison of flows in a vertical borehole (a) and in a horizontal drain (b).
Y. Drouiller et al.: Oil & Gas Science and Technology - Rev. IFP Energies nouvelles 74, 32 (2019)4

d Inventorying all aquifer reservoirs of the sedimentaryseries between the topographic surface and the grani-tic basement.
d Mapping the fault network (Fig. 8).d Characterizing each reservoir, whether carbonated or
clastic, to know all the petrophysical characteristics(porosity, clay content, fracturing, etc.).
d Checking hydraulic connectivity between the twodrains, absence of faults in the panel, sufficient poros-ity and absence of permeability barriers.
d Positioning the two horizontal drains (one for pump-ing, the other for reinjection of water) inside the aqui-fer reservoir in the most suitable areas.
3.1 Previous seismic works
During the 80’s and 90’s, a lot of 2D seismic profiles havebeen acquired in France, particularly in the Paris Basinand the Rhine Graben. Their frequency spectrum of thevibrator source was 10–90 Hz to 8–130 Hz with many teststo increase the frequency content.
At this time, source capabilities did not permit toemit low frequencies. The quality of 2D seismic profileshas been improved by good static corrections in Tertiaryand cretaceous chalk. And many structures have beenfound.
The research project called ‘‘Dogger 1991–1993’’allowed to test vibro-seismic with some 2D profiles, a 3Dseismic (16 km2) and a VSP between Villeperdue and Fon-taine-au-Bron fields. The goal was to describe a thin reser-voir (30 m) at a depth of 1850 m.
The objective of these tests was to obtain at the reser-voir level a minimum of 100 Hz in the frequency spectrumto get a sufficient vertical resolution (Fig. 6b). At that time,it was not technically possible to push the band passtowards low end frequencies. Now it would be possible toacquire broadband seismic with more octaves, hence highervertical resolution.
However, Figure 6 demonstrates that variations of veloc-ity and acoustic impedance are corresponding to variationsof POROSITY inside the ‘‘Dalle Nacree’’ reservoir whichis used for geothermal projects in the Paris Basin [5, 6].
The PICOREF program (2003–2009) was located in thesouth-eastern part of Paris Basin, in South Champagne dis-trict. Its aim was to select and characterize appropriate siteswhere a pilot-scale storage of carbon dioxide (CO2) couldeventually be carried out.
For this project, 750 km of 2D seismic lines have beenreprocessed and 450 km of new 2D seismic lines have beenacquired. The geological characterization of the Sector hasbeen as exhaustive as possible, with all these seismic linesand the collection of a complete well-data base (146 oilwells).
This survey is a good example for characterizing sedi-mentary formations potentially rich in aquifer units, atthe same scale as geothermal projects: first at the regionalscale, then on dedicated sites [7, 8].
3.2 Broadband 3D seismic (up to six-octaves)
Among the latest generation of exploration techniques, theso-called ‘‘broadband’’ 3D seismic currently delivers the
Fig. 4. Example of architecture of boreholes with horizontal drains inside the reservoir. The better knowledge of the reservoir allowsto inject cold water in a different structural panel or, in opposite, in the same structural panel.
Y. Drouiller et al.: Oil & Gas Science and Technology - Rev. IFP Energies nouvelles 74, 32 (2019) 5

highest resolution seismic images (frequency spectrum2–128 Hz covering at least six octaves – Fig. 7). The highquality of the images enables a 3D mapping of the faultswith the greatest precision ever achieved (Fig. 8).
The characteristics and benefits of six-octave bandwidthseismic (offshore and onshore) are determined by:
Wavelet: With more than six octaves of bandwidth, theseismic wavelet becomes sharp and impulsive, and withsufficient low-frequency content (down to 2.5 Hz), sidelobes are minimized [9].Low-frequency texture: Low frequencies pick out subtleand gradual acoustic impedance variations and give geo-logic layers a distinctive signature. Vertical resolution isimproved.Ease and accuracy of interpretation: The characteristicsof the broadband wavelet facilitate processing and inter-pretation by removing interference from side lobes andtherefore simplifying seismic images and revealing moresubtle details [9].
Seismic artefacts which were often existing in the three-octaves seismic of the 90’s, disappeared mostly.
In addition, automated horizon picking has been shownto be quicker (more data driven with fewer manual
interventions) and more accurate, and horizon amplitudeextractions are cleaner and less noisy.
Deep imaging: Low frequencies are less affected byattenuation and help to image deep targets and areasbeneath absorbing formations and complex overburdens.AVO and inversion: Seismic inversion benefits from theextended low-frequency bandwidth [10]. This leads tomore accurate and quantitative results which have alarger dynamic range and a more realistic stratigraphicdistribution and that match well-log measurementsmore closely [9].
3.2.1 Onshore broadband seismic
The onshore broadband seismic has different constraintsthat offshore seismic because the image bandwidth is lim-ited by the interplay of coherent noise, sampling, near-sur-face effects, and our ability to increasing source and receiverdensity.
When arrays are reduced to a single element, we end upwith single-source, single-sweep, single-receiver acquisitionwhich brings further acquisition efficiencies. On the subsur-face imaging side, we observe that high-density, long-offset,wide-azimuth surveys recorded with single source and single
Fig. 5. Process for obtaining continuous logs at the casing shoe levels.
Y. Drouiller et al.: Oil & Gas Science and Technology - Rev. IFP Energies nouvelles 74, 32 (2019)6

Fig. 6. Reservoir ‘‘Dalle Nacree’’: Variations of velocity and acoustic impedance explain POROSITY variations on Sonic log (a), 2Dseismic profile (b) and 3D vibro-seismic horizon slice (c), Variations of POROSITY on an inverted seismic section (d) – PICOREFproject made in 1991–1993 by DHYCA to promote oil exploration in the Paris Basin [4].
Y. Drouiller et al.: Oil & Gas Science and Technology - Rev. IFP Energies nouvelles 74, 32 (2019) 7

receivers provide a notably high signal-to-noise ratio andfine resolution from very shallow to deep across all reservoirlevels [11].
The use of dense single source, single sweep and singlereceivers yields the following benefits:
d Higher productivity from independent single vibratorsthat may shot simultaneously.
d More accurate azimuthal measurements in case of fullazimuth acquisition.
d Improved coherent noise attenuation.d Improved near-surface model and surface-consistent
processing thanks to denser spatial sampling (smallbin size) and shorter near offset traces (statics, decon-volution, etc.).
d High signal-to-noise ratio and minimal acquisitionfootprint.
d Optimal imaging at all target depths.
Low frequencies provide a range of benefits fromimproved seismic interpretation in general to deep imagingand more quantitative inversion results. The preferredonshore source is vibroseis, particularly for high-productiv-ity operations on dense source grids [9].
A new generation of high-sensitivity geophones(83 V/m/s vs. 20 V/m/s), is now available with a naturalfrequency of 5 Hz. These are specifically designed for sin-gle-sensor application and provide excellent low-frequencyrecording.
Figure 7 (courtesy of PDO) shows an onshore example.It compares the three-octaves seismic of the 90’s with thelast generation six-octaves broadband seismic. Lowest twooctaves (2–8 Hz) and the highest octave (64–128 Hz) give
detailed geological information and improve greatly seismicimaging.
Acquisition parameters must be determined finely to getthe best 3D seismic dataset for several geothermal projectspossible in the same area, from a shallow depth (800 m) tothe top of basement (for EGS projects).
Processing is also a key step that cannot be neglected.We assist nowadays to the development of fast automatic‘‘real-time’’ processing even in straight in the doghouse.This product may be interesting for QC purposes, but inno case taken as a final product. Quick and dirty processingof data in processing centre can also be a project killer. Pro-cessing has to be done by experienced geophysicists with astrong geological background and in good interconnectionwith the Client Geoscientists Team.
3.3 P-waves only or three-components registeredin the dataset?
The choice of the type of data which will be registered isa key decision: one (PP waves) or three (PS waves)components.
Until now, P-waves are registered classically in 3Dseismic dataset for oil exploration. And three-components(P-waves and S-waves) are seldom used to get petrophysicaland mechanical parameters inside reservoirs.
The benefits of PS-wave and converted-waves arenumerous in exploration seismic:
d enhanced near-surface resolution,d improved lithologic characterization,d mechanical properties,d anisotropy.
Fig. 7. Onshore 3D seismic acquisition: Progress realized with the six octaves Broadband technique – 2–128 Hz (a), courtesy of PDO,single vibrator (b) and wireless geophones for use on urban sites (c), courtesy of Sercel.
Y. Drouiller et al.: Oil & Gas Science and Technology - Rev. IFP Energies nouvelles 74, 32 (2019)8

Presently, new three components MEMS sensors allowto register P-waves and converted waves for a 3D-seismicacquisition.
Whatever the estimation of fracture orientation andfracture density as well as understanding the stress stateof the subsurface is of great importance in geothermalexploration, difficulties appear for each step of a 3D seismic:
d Challenging field logistics (e.g., increased number ofchannels compared to 1-C surveys).
d A different processing of converted waves compared toP-waves. Difficult registration of PS time (longer) intoPP time (shorter).
d Difficulties in interpreting the resultant PS-waveimages [12].
d And then, an additional cost.
For geothermal projects, P-waves and PS-waves will beused at least in the pilot hole with a VSP profile to imagethe reservoir.
3.4 Information given by 3D seismic
P-waves seismic-reflection techniques allow to investigategeothermal reservoirs by providing:
d The necessary high-resolution fault and fracture char-acterization in all the sedimentary layers, from groundto basement top.
d The geometry and stratigraphy of all layers andreservoirs.
d The sedimentological interpretation and the geometryof geobodies.
d The reservoir characterization, etc.
Seismic attributes are used to visualize this informationextracted from the 3D seismic dataset. They are quantitiesthat can be derived from seismic data in order to extractstructural and lithological information of the subsurface[13, 14].
3.4.1 Structural information
Figure 8 shows two examples of structural maps obtainedfrom two different 3D seismic datasets: the first one is theresult of the interpretation by picking horizons; the secondis the result of a similarity attribute applied on seismicdataset along an interpreted horizon. This similarity mapshows faults and fractures at different scales.
This attribute can be applied to the whole volume of thereservoir. The network of small fractures can be appreciatedto evaluate the hydraulic connectivity and the fracture per-meability in the prospective zone.
The knowledge of the fractures network allows to locatehorizontal drains into the reservoir by proceeding in severalsteps:
d Avoid faults, so that the two drains are in the samestructural panel, if a hydraulic connectivity is desired.
d Or use faults to separate two parts of a reservoir for adifferent thermal objective.
d Then, look for diaclases (fractures without displace-ments) within the panel because they promote aso-called ‘‘fracture’’ permeability.
Fig. 8. Structural information obtained in a 3D seismic (mapping and similarity attribute), compared with a fractured limestoneoutcrop (on the right).
Y. Drouiller et al.: Oil & Gas Science and Technology - Rev. IFP Energies nouvelles 74, 32 (2019) 9

3.4.2 Stratigraphic and sedimentological information
Geometrical attributes are used in stratigraphic and sedi-mentological interpretation. They confirm the continuityof layers and locate unconformities and faults. They evaluatealso dip, azimuth and curvature of the interpreted horizons.
If the amplitude 3D seismic dataset is transformed inacoustic impedance (true or relative impedance) domain,geobodies and lithological limits are directly visualized.The sedimentological interpretation becomes easier becauseimpedance changes are corresponding directly to the litho-logical interfaces. It’s a way to better know the reservoirbefore drilling.
3.4.3 Lithological information and physical parameters
Physical attributes have a direct link to physical parame-ters in the subsurface and are generally used for the charac-terization of lithology and reservoirs [15].
3.4.3.1 Carbonate reservoirsCarbonate reservoirs are notoriously heterogeneous.
Using Broadband 3D-seismic and inversion techniques(either petrophysical or acoustic impedance), it will be pos-sible to extrapolate the pilot-hole porosity measurements inthe entire volume of the aquifer covered by 3D seismic.Thus, a true 3D mapping of porosity is obtained through-out the reservoir volume.
The example of Figure 9 is a carbonated reservoir fromoffshore Brazil. Each layer (five in this case), permeable ornot, is characterized by a map which shows POROSITYvariations along the interpreted horizon [16].
The comparison between Figures 9 and 6 shows thegreat progress of the seismic interpretation softwares duringthe last 20 years. Images quality improved hugely.
The result is more accurate and reliable than a mod-elling from 2D seismic profiles that remains interpretativeand influenced by the parameters chosen for the interpola-tion that may give hazardous results in the space betweenthe 2D seismic profiles.
3.4.3.2 Clastic reservoirsClastic deposition environments, including river deposits,though they look particularly complex, are easier to inter-pret due to the presence of typical figures (channel, levees,etc.) and to a lighter footprint by diagenesis.
In the Paris Basin, the Triassic sandstones (Chaunoyand Donnemarie formations) are fluviatile [17], as theBuntsandstein sandstones in the Upper Rhine graben.
The circulation of fluids within such reservoirs is influ-enced by many factors:
d Sedimentation mode.d Deposit geometry.d Sedimentary discontinuities.d Compaction and diagenesis.d Tectonics, etc.
Precise prediction of reservoir quality in clastic systemsis a key challenge for exploration and exploitation of thesereservoirs.
For these purposes, 3D-seismic six octaves is the toolthat will allow to:
d Locate the sandstone deposits that will be thickenough, continuous and extended for the desiredpurpose.
d Determine the type of clastic deposit (fluviatile, wind,marine, progradation, beach, delta, channels, etc.).
d Characterize each selected reservoir with a 3D map-ping of the porosity and the clay content.
d Check the hydraulic connectivity between two pointsin the survey area.
The extension of sandstone deposits such as a fluvialsystem is visualized very well in a 3D seismic on the hori-zon-slices (Figs. 10 and 11a), but more difficult on the ver-tical sections (Fig. 11b).
Figure 12 is an onshore example to show the anisotropyand the porosity at the base of a clastic reservoir (Nimr).Data are extracted from seismic dataset by stratigraphicinversion. The interest of this figure is to show that porosi-ties distribution can be very different in two superposedreservoirs. Characterization of the sandstone reservoir willbegin during the pilot-hole drilling with the complete coringof the reservoir. Then, 3D seismic is transformed usingpetrophysical or acoustic impedance inversion techniquesto obtain a 3D mapping of the porosity and clay content.
3.5 Survey steps of a geothermal site
This methodology, using last generation of petroleum tech-niques for a better knowledge of the reservoir before drillinginvestments, changes the survey process of geothermal sites.It is adapted to the specific case of geothermal doublets ofboreholes.
3.5.1 The choice of the site, first step
The use of deep geothermal energy is first decided based oneconomic criteria, namely the needs of the customer andusers in a well-defined place.
The feasibility of the project in this location will bebased on existing data on the targeted aquifers, i.e. wellsand regional 2D seismic profiles.
These data enable, with regional modelling, to roughlysize the project, but do not allow the final design of geother-mal boreholes.
Thus, the porosity measured in the nearest borehole,often more than 10 km away, gives a regional indication,but cannot be used for the implantation of horizontal drainsbecause the variations of porosity inside the limestone canbe very large and can change locally, from one layer toanother, but also laterally inside the same layer.
3.5.2 Process for the study of the site and designof horizontal drains
The study of the site is of great importance to better char-acterize the subsurface target zone (especially the faults net-work) and successfully perform the geothermal project.
Y. Drouiller et al.: Oil & Gas Science and Technology - Rev. IFP Energies nouvelles 74, 32 (2019)10

Fig. 9. Carbonate Reservoir (Brazil Offshore): Seismic section (a), initial porosity model (b) and maps (c) showing lateral evolutionof the porosity in the different reservoirs and intermediate impermeable layers obtained by petrophysical inversion of the 3D seismicdataset [16].
Y. Drouiller et al.: Oil & Gas Science and Technology - Rev. IFP Energies nouvelles 74, 32 (2019) 11

Reducing the risk of having insufficient flows for thegeothermal operator will be achieved through a series ofmeasurements acquired and interpreted over the drillingtarget area.
The overall methodology (Fig. 13) can follow the follow-ing steps:
d Acquisition of a high-resolution broadband 3D seismic(i.e. with a frequency spectrum of six octaves sweep-ing the frequencies 2–128 Hz) after having adaptedthe parameters to the geological target, using VSPresults in the nearest borehole. The acquisition of anew 3D seismic image is worth the investment onlyif the acquisition relies on the latest high productivitytechniques. Those techniques enable affordable acqui-sition of high-resolution data, thus avoiding mimick-ing the narrow bandwidth and low trace densityparameters used for the vintage acquisitions fromthe 80s.
d Tailored processing, including geological modelling ofstatic corrections, preserved amplitude processing,interpolation, densification and time-to-additionmigration.
d Interpretation of 3D seismic in time – Structural map-ping of the site at the reservoir level using similarityattribute and analysis results of seismic azimuthalanisotropy.
d Design of the pilot-hole.d Drilling of the pilot-hole crossing the deepest objective
reservoir.d Recording of logs and VSP in pilot-hole.d Time-depth conversion of the 3D seismic dataset.d 3D mapping of porosity by using the technique of
inversion of acoustic impedance (with seismic 3D).d Design of the doublet of deviated boreholes with their
horizontal drains in the most porous zones, by makingsure of the hydraulic connectivity between the twodrains, or of hydraulic barriers, depending of the ther-mal model used for the exploitation of the site.
In this methodology, the pilot-hole is a key deliverable(Fig. 14), enabling the recording of the logs (GR, density,sonic, porosity, resistivity, and diameter) and the VSP.Logs and VSP are the key information required to success-fully complete the time-to-depth conversion of the 3D seis-mic and the 3D mapping of the aquifer porosity (Fig. 15).
The combination of 3D seismic and VSP will enablestudying all high-potential geothermal aquifers, locatedbetween the topographic surface and the metamorphicand/or granitic basement.
Each aquifer could be equipped with independent dou-blet of geothermal boreholes, using the same 3D seismicdataset.
Fig. 10. Examples of fluvial systems which can be observed in3D seismic (Courtesy of Eliis).
Fig. 11. Horizon-slice (a) showing the fluvial system visible onthe section (b) [18].
Y. Drouiller et al.: Oil & Gas Science and Technology - Rev. IFP Energies nouvelles 74, 32 (2019)12

Fig. 12. Onshore Gas Play in North Oman: Clastic reservoir with higher anisotropy at the base (Nmir horizon). Porosity map ofAmin horizon (a), anisotropic gradient and tangential weakness of Amin horizon (b), seismic section with both horizons(c), anisotropic gradient and tangential weakness of Nmir horizon (d) [19].
Y. Drouiller et al.: Oil & Gas Science and Technology - Rev. IFP Energies nouvelles 74, 32 (2019) 13

3.6 To conclude on the need to use 3D seismicin deep geothermal projects
The methodology using broadband 3D seismic and pilot-hole with VSP and logging is valid, whatever the depth ofthe reservoir, for:
d Carbonated aquifers as Dogger limestones in the ParisBasin.
d Clastic aquifers as the Triassic in the Paris Basin orthe Upper Rhine graben.
d The recovery of existing geothermal doublets to addhorizontal drains and perform better the site with lessmaintenance in the future.
But also, to map big faults at the top of a graniticbasement.
Modern 3D seismic (Frequency spectrum: at least sixoctaves) offers a set of tools that allow the geothermal oper-ator to have a much greater confidence on the properties ofthe geothermal site at the reservoir level than classical mod-elling and simple interpolation between wells. Applying the
Fig. 13. Process for the survey of geothermal doublets/triplets before drilling investments.
Y. Drouiller et al.: Oil & Gas Science and Technology - Rev. IFP Energies nouvelles 74, 32 (2019)14

technique is worth the effort in order to reduce the riskbefore the large investments of drilling and surfaceinstallation.
Modern 3D seismic gives the Design Office essentialinformation to develop the project, including:
d 3D network of faults with structural maps.d Inventory of aquifers usable in geothermal energy,
between the topographic surface and the graniticand/or metamorphic basement.
d Knowledge of the internal structure of each carbonateand/or clastic reservoir (seismic stratigraphy for thedelineation of lithological bodies, 3D porosity and claymaps, etc.).
d Checking of hydraulic connectivity and/or hydraulicbarrier between the pumping and re-injecting drains.
to allow the installation of horizontal drains in the bestzones of the reservoir or in different structural panels.
In other words, seismic tools are perfectly suited to thestudy of geothermal sites and adapted for derisking geother-mal projects in sedimentary locations where the seismicimaging is fair to good.
3.6.1 Recovery of existing sites
The recovery of old doublets may be possible to preservethe initial investment:
d Either to improve their performance in the samereservoir,
d Or to develop another reservoir in the sedimentaryseries.
The recovery of old geothermal sites may need addi-tional information on the reservoir to repair old boreholesor to locate new drains in best porous and permeable zones.
A customized solution between a VSP and a small 3Dseismic dataset to investigate around the site could be bet-ter and less expensive to understand the origin of the prob-lems that led to the recovery of the project.
3.6.2 Neighbour licences
In addition, neighbouring license operators will be able tojointly acquire a unique 3D seismic, not only to reducethe financial cost, but also to avoid interferences betweenneighbouring doublets on the base of the same physicaldataset of the reservoir.
4 Geothermal prospects in the Paris Basin
In the Paris Basin, four aquifers (Albian, Neocomian, Dog-ger and sandstone Triassic) are identified until now for deepgeothermal energy in the Mesozoic series [16].
Fig. 14. Example of a geothermal triplet with horizontal drains inside the reservoir. The porosity map (simulation here) characterizesthe reservoir in each side of the fault. The better knowledge of the reservoir allows to inject cold water in a different structural panel.The third drain allows to inject or to produce hot water, giving the operator both options depending on the season and the needs of theheating and cooling network.
Y. Drouiller et al.: Oil & Gas Science and Technology - Rev. IFP Energies nouvelles 74, 32 (2019) 15

Presently, Albian, Neocomian and Dogger aquifers areexploited by geothermal projects.
4.1 Geological aspects to consider
The Dogger of the Paris Basin shows in the current zone ofexploitation a relative homogeneity, except for the varia-tions related to the depositional environments or the diage-nesis. It appears relatively isopaque at the regional scale, inthe centre of the basin.
The story is more complicated below: during the Lias,the synsedimentary activity of the major faults varies thethickness from single to double over small distances.
The Triassic deposits are developing towards the Eastwith, in particular, the Buntsandstein sandstones whosethickness can reach 400 m in Lorraine and in the Rhenangraben. This formation is reduced very quickly towardsthe West, to disappear in Champagne and to be taken inrelay by the sandstone facies of Keuper.
These Triassic reservoir formations, well known by oilindustry geoscientists (Gres de Chaunoy, Donnemarie sand-stone, etc.), have a limited extension and are the lateralequivalents of the marly and salt facies of Keuper. Unlikethe Dogger, their presence, their thickness and their faciesare linked to regional faults which have most often sub-meridian directions (Saint-Martin de Bossenay, Etampes,Saint Germain, etc.) or Armorican directions (Bray, Mal-noue, Seine, etc.).
In the central area of the Paris Basin, seismic is the onlytool to highlight the faults pattern that guides the distribu-tion of these reservoirs. Some areas, poorly recognized atthat time, are of interest especially with the axis of theSeine, from Paris to Rouen, as well as the Northern faultof the Pays de Bray considering the replay of this regionalfault and the existence towards Picardy with a basal detri-tal bevel of the Triassic.
4.1.1 Ante-Mesozoic substratum
Under the Triassic, following a logic of distribution closeenough, develops the Permian. Of sedimentary origin,locally disturbed by volcanic episodes, it corresponds mostof the time to continental deposits in which shales predom-inate, but also with sandstone facies. Their thickness canexceed 1000 m in the syncline of Sarreguemines.
Other scattered basins of medium size exist such as:
d The basin of Brie, poorly recognized by seismic anddrilling.
d The basin of Contres in the South of the Loire river.
Some small scattered basins associated with faults aredistributed in the West and the North of the Paris area:
d The Coulommes basin associated with the Bray fault.d The basin of Saint Maur in line with the anticline of
Margny-les-Compiegne.
Fig. 15. Porosity map (simulation here) used to locate the three horizontal drains in the most porous and permeable zones. Note therole of the fault that separates two non-communicating thermal zones: hot and cold zones.
Y. Drouiller et al.: Oil & Gas Science and Technology - Rev. IFP Energies nouvelles 74, 32 (2019)16

d The Vernon basin on the Seine fault.
The Carboniferous is present on the outskirts of theParis Basin, in the East beyond the Marne rift, south ofthe Loire rift in relation to the meridian faults of the MassifCentral and to the north of the Variscan front underlinedby the ‘‘Midi’’ fault.
With maps of gravimetry anomalies (Fig. 16) and mag-netometry, 235 boreholes (Tab. 1 and Fig. 17) and seismicsections, J. Baptiste [20] has built the structural and litho-logic map of the Ante-Mesozoic substratum (Fig. 18). Thismap is covering the southern part of the Paris basin, fromBrittany in the West to Vosges mountains in the East.All the basin centre was mapped, including the thickestpart in the south-East of Paris.
The Carboniferous Coalfields of northern France rest onkarstified limestones known as Dinantian. The latter is ageothermal resource in Belgium (Saint-Ghislain) and fur-ther north in the Netherlands. In France, it can representmedium and high energy targets in the Hauts-de-France,on the outskirts of the Nord-Pas-de-Calais coalfields, butalso further south in Picardy with large overlaps.
4.1.2 Seismic profile ECORS ‘‘North of France’’and processing progress
Indeed, the seismic profile Ecors ‘‘North of France’’,recorded in 1983 and recently reprocessed by CDP-Consulting, illustrates the deep structuring. This profile,228 km long from Dreux to Cambrai, is crossing the majorfaults (Seine fault, Bray fault). It shows their deep set andtheir relationship with the tangential faults emerging in theNorth of France. It demonstrates that these major faultsare crustal faults.
The exploitation of these data is a guide to better under-stand the deep hydrothermal circulations.
This reprocessing is a progress. It shows the way toresolve an old problem of reflection seismic multiples whichmade it difficult to see clearly the Palaeozoic and the grani-tic basement in the centre of the basin.
New generation seismic sections (six octaves), better cal-ibrations with the wells (continuous logs, synthetic andVSP) and a suitable processing sequence would improvethe basement image and would make it possible to defineprospective zones near large cities.
4.2 Prospects to explore
Deeper targets may be considered, particularly with theTriassic or even the Permo-Carboniferous and thebasement.
These deep sedimentary targets are associated withmajor faults that affect their distribution, thickness, faciesand fracturing.
4.2.1 Triassic sandstones are still a prospectin the Paris Basin
Triassic sandstones are not yet explored and stay today ageothermal prospect. Some boreholes (Acheres 1, Pontoise)
have drilled them with geothermal objectives, but theyencountered low porosities and permeabilities.
A dedicated exploration is needed for this prospect.
4.2.2 Regional faults, a new geothermal prospectin the Paris Basin
In the intracratonic Basin of Paris, regional faults overlapthe substratum. Inside faulted zones, hydrothermal circula-tions arriving by convection at the top of granitic basementcould be geothermal objectives, as in the Alsace UpperRhine Graben.
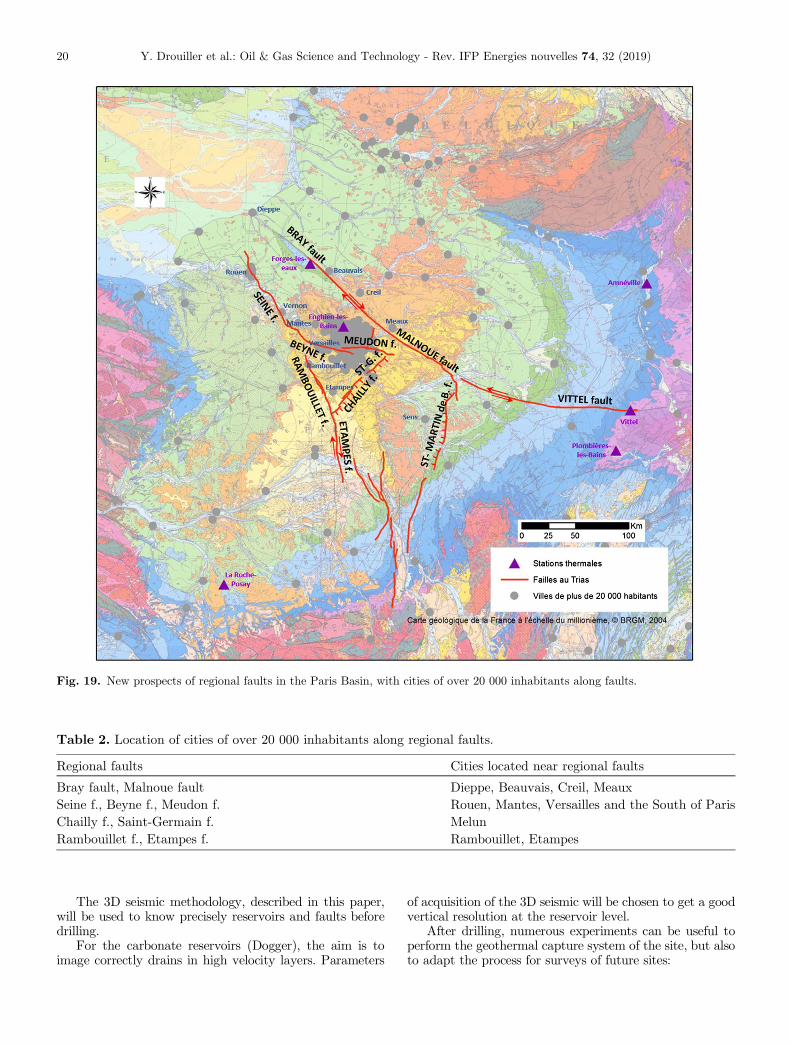
Regional faults are organised as a pull-apart (Fig. 19)which explains the deepening of the basin during Lias andTriassic. A pull-apart is defined classically by four orthogo-nal faults: two strike-slip faults to expand and two normalfaults to extend the layers in the concerned area.
This pull-apart is not regular because of re-using oldfaults which have replayed several times, but we can distin-guish the four directions of main faults:
d The East-West main fault: In the North, the East-West main fault is formed by Bray fault, Malnouefault and Vittel fault. These three faults are strike slipfaults and are well visible on the gravimetry map,from the Channel to the Vosges mountains (Fig. 16).
d Along these regional faults, two thermal stations(Forges-les-Eaux in the West, Vittel in the East)underline a geothermal interest.
d North-South main faults: A second system of majorfaults, with a North-South direction, are relaying fromRouen to Nevers: Seine fault, Rambouillet fault, Etam-pes fault, Sully fault, Sancerre fault, Sancoins fault.
d The Etampes fault is a dextral strike slip fault.d NE-SW normal faults: Chailly and Saint-Germain
faults present a NE-SW direction and limit at theNW the pull-apart.
d NNE-SSW normal faults: St-Martin-de-Bossenayfault and Perreuse fault present a NNE-SSW directionand limit the pull-apart at the South-East.
The pull-apart is corresponding to the thickest Mesozoicsequences and the area of most of petroleum discoveries.
Hydrothermal circulations are expected along the majorfaults as the thermal stations (Forges-les-Eaux and Vittel)suggest.
The aim is to capture water-flows coming from faultedzones in the Palaeozoic and granitic basement.
Indeed, it is important to image the deepest faults thatare mostly very old basement faults, reactivated during thePermo-Carboniferous, Triassic and Liassic sediment deposi-tions. The detritic reservoir facies are generally located nearthe faults, laterally passing to clays or even evaporites.
The Cities located near regional faults (Tab. 2) could beinterested by this deep geothermal resource.
4.3 Suggestion for a production pilot site to testsuperimposed aquifers and a regional fault
In France, there is no experimental site for deep geothermalin sedimentary sequences. To reduce costs, an industrial site
Y. Drouiller et al.: Oil & Gas Science and Technology - Rev. IFP Energies nouvelles 74, 32 (2019) 17

for heat production could be used for a series ofexperiments.
The best site in the Paris Basin would integrate thefour aquifers (Albian, Neocomian, Dogger and sandstone
Triassic) and a regional fault which is overlapping thegranitic basement. Two types of well architecture wouldbe drilled: horizontal drains for aquifers and deviated wellsfor crossing the regional fault.
Fig. 16. Gravity map (Bouguer anomaly) of France modified by adding of selected regional faults (in red) [20].
Table 1. Short list of wells which have drilled Palaeozoic basement in the Paris Basin, mainly metamorphic.
Well name Geological age Lithology TD meter
Trois Fontaines 102 Scythian Metamorphic 1937Chaunoy 001 Paleozoic Schist 2515Pays de Bray 101 Gneiss 1082Saint Martin de Bossenay 001 Sinemurian Quartzite 2681Le Teich 2 Paleozoic Schist 3464Soudron 001 Paleozoic Quartzose sandstone 2503Saint Just Sauvage 1 Norian Mica schist 3073Courdemanges 1 Paleozoic Schist 2135Charmottes 001 Paleozoic Schist 3000Saint Germain Laxis 1 Paleozoic Schist 2424Vulaines 01 Gabbro 3057Vert le Grand 001 Paleozoic Mica schist 2209Maincy 001 Paleozoic Mica schist 2420Ivry 101D Paleozoic Mica schist 2430La Chandeliere 1D Paleozoic Gneiss 1656L’Orme 1D Paleozoic Quartizite 1897La Croix Blanche 1D Paleozoic Quartizite 2125
Y. Drouiller et al.: Oil & Gas Science and Technology - Rev. IFP Energies nouvelles 74, 32 (2019)18
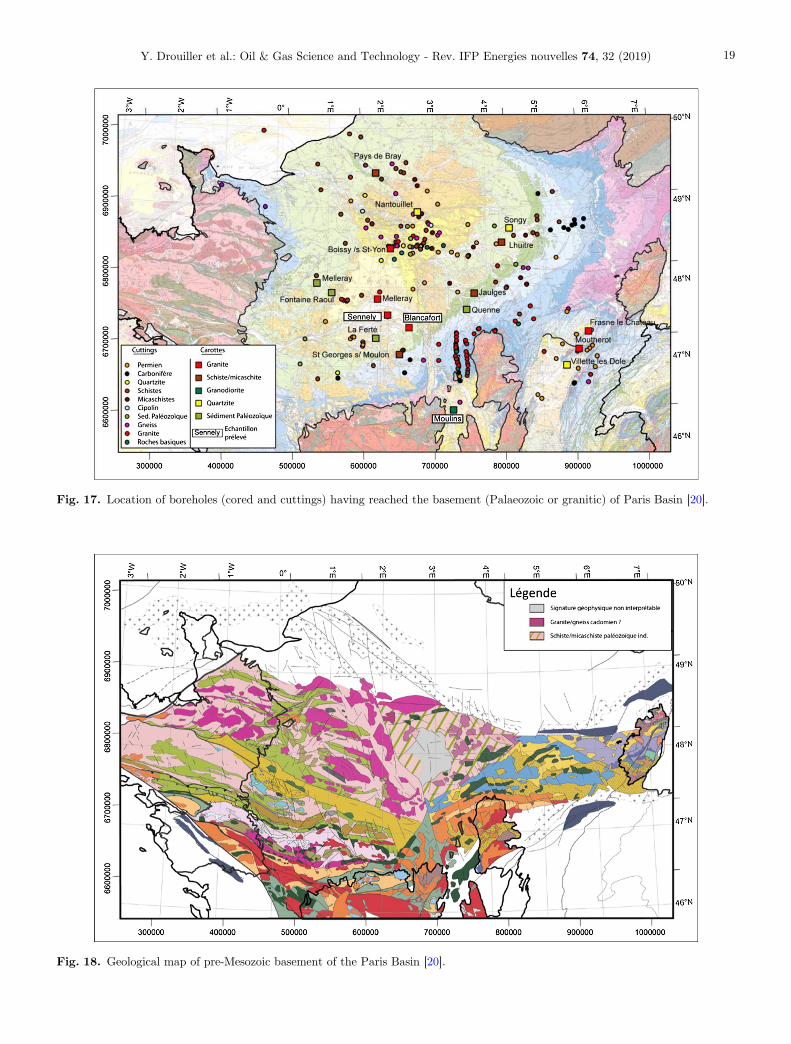
Fig. 17. Location of boreholes (cored and cuttings) having reached the basement (Palaeozoic or granitic) of Paris Basin [20].
Fig. 18. Geological map of pre-Mesozoic basement of the Paris Basin [20].
Y. Drouiller et al.: Oil & Gas Science and Technology - Rev. IFP Energies nouvelles 74, 32 (2019) 19
The 3D seismic methodology, described in this paper,will be used to know precisely reservoirs and faults beforedrilling.
For the carbonate reservoirs (Dogger), the aim is toimage correctly drains in high velocity layers. Parameters
of acquisition of the 3D seismic will be chosen to get a goodvertical resolution at the reservoir level.
After drilling, numerous experiments can be useful toperform the geothermal capture system of the site, but alsoto adapt the process for surveys of future sites:
Fig. 19. New prospects of regional faults in the Paris Basin, with cities of over 20 000 inhabitants along faults.
Table 2. Location of cities of over 20 000 inhabitants along regional faults.
Regional faults Cities located near regional faults
Bray fault, Malnoue fault Dieppe, Beauvais, Creil, MeauxSeine f., Beyne f., Meudon f. Rouen, Mantes, Versailles and the South of ParisChailly f., Saint-Germain f. MelunRambouillet f., Etampes f. Rambouillet, Etampes
Y. Drouiller et al.: Oil & Gas Science and Technology - Rev. IFP Energies nouvelles 74, 32 (2019)20

d Permeability and flow measurements.d Fault and Fracture permeability at different scales.d Matrix porosity: The actual porosity of the rock
matrix can be measured on cores which have beensampled while drilling. But coring is expensive.
d Another way to get this information could be the real-time automatic analysis of cuttings by modern toolssuch as RoqSCAN. This tool allows to supplementthe core data and to validate economically. Thismethod is more attractive than the coring, becauseallowing to control the drilling and to optimize thecompletions of the horizontal drain [21].
d Comparison of measured porosity with the predictive3D maps realized by the technique of the 3D seismicinversion.
d This comparison will make the method reliable andassess the risk reduction compared to the old methodwithout 3D seismic.
d Clay content in clastic reservoirs.d Transit time between drains.d Temperature measurements.d Modelling of critical parameters.d Calculation of the better distance between drains
(horizontal or deviated).d Thermal modelling of the site, etc.
The thermal modelling is specific of both the site andthe geothermal project. It cannot be extrapolated simplyto another site. It is depending of the geology, characteris-tics of each aquifer, faults and fracturing, thermal condi-tions of the site and exploited water-flows.
A general process would be interesting to precise thebest conditions of site, the best technology and the less-risked methodology for future projects.
Acknowledgments. The authors thank Denis Mougenot, PierreUngemach and the anonymous referees for their very usefulremarks.
References
1 Genter A., Evans K., Cuenot N., Fritsch D., Sanjuan B.(2010) Contribution of the exploration of deep crystallinefractured reservoir of Soultz to the knowledge of enhancedgeothermal systems (EGS), C. R. Geosci. 342, 7–8, 502–516.doi: 10.1016/j.crte.2010.01.006.
2 Ungemach P., Antics M., Lalos P., Borozdina O.,Foulquier L., Papachristou M. (2011) Geomodelling and wellarchitecture, key issues to sustainable reservoir development,Proceedings, Thirty-Sixth Workshop on GeothermalReservoir Engineering, January 31–February 2, StanfordUniversity, Stanford, California. SGP-TR-191.
3 Saleh A., El Fiki A., Rodriguez J.M., Laroche S., CastorK.Y., Marin D., Bianchi T., Bertrand P., Herrmann P. (2017)A step change in seismic imaging quality in Western Desert ofEgypt – An acquisition case study, 79th EAGE Conference &Exhibition, 12–15 June 2017, Paris, France.
4 Schmelzbach C., Greenhalgh S., Reiser F., Girard J.F,Bretaudeau F., Capar L., Bitri A. (2016) Advanced seismicprocessing/imaging techniques and their potential for
geothermal exploration, Interpretation 4, 4, SR1–SR18. doi:10.1190/INT-2016-0017.1. www.researchgate.net.
5 Mougenot D., Layotte P. (1996) Imagerie sismique d’unreservoir carbonate: le Dogger du Bassin Parisien, OilGas Sci. Technol. - Rev. IFP Energies nouvelles 51, 4, 451–496.
6 Mougenot D. (1999) Seismic imaging of a carbonate reservoir:the Dogger of the Villeperdue oil field, Paris Basin, France,Pet. Geosci. 5, 75–82.
7 Brosse E., Badinier G., Blanchard F., Caspard E., CollinP.Y., Delmas J., Dezayes C., Dreux R., Dufournet A., DurstP., Fillacier S., Garcia D., Grataloup S., Hanot F., HasanovV., Houel P., Kervevan C., Lansiart M., Lescanne M., MenjozA., Monnet M., Mougin P., Nedelec B., Poutrel A., RachezX., Renoux P., Rigollet C., Ruffier-Meray V., Saysset S.,Thinon I., Thoraval A., Vidal-Gilbert S. (2010) Selection andcharacterization of geological sites able to host a pilot-scaleCO2 storage in the Paris Basin (GeoCarbone-PICOREF), OilGas Sci. Technol. - Rev. IFP Energies nouvelles 65, 3,375–403.
8 Delmas J., Brosse E., Houel P. (2010) Petrophysical proper-ties of the middle Jurassic carbonates in the PICOREF sector(South Champagne, Paris Basin, France), Oil Gas Sci.Technol. – Rev. IFP Energies nouvelles 65, 3, 405–434.
9 Denis M., Brem V., Pradalie F., Moinet F., Retailleau M.,Langlois J., Bai B., Taylor R., Chamberlain V., Frith I.(2013) Can land broadband seismic be as good as marinebroadband? The Leading Edge 32, 1382–1388.
10 Michel L., Lafet Y., Sablon R., Russier D., Hanumantha R.(2012) Variable-depth streamer – Benefits for rock propertyinversion, 74th Conference and Exhibition, 4–7 June,Copenhagen, Denmark, EAGE.
11 Seeni S., Zaki H., Setiyono K., Snow J., Leveque A.,Guerroudj M., Sampanthan S. (2011) Ultra high-density fullwide-azimuth processing using digital array forming, 73rdConference and Exhibition, 23 May, Dukhan Field, Qatar,EAGE. Extended Abstracts, F006.
12 Stewart R., Gaiser E., Brown R., Lawton C. (2003)Converted-wave seismic exploration: Applications, Geo-physics 68, 1, 40–57. doi: 10.1190/1.1543193.
13 Chopra S., Marfurt K.J. (2005) Seismic attributes – Ahistorical perspective, Geophysics 70, 5, 3SO–28SO. doi:10.1190/1.2098670.
14 Chopra S., Marfurt K.J. (2007) Seismic attributes forprospect identification and reservoir characterization, Soci-ety of Exploration Geophysicists and European Associationof Geoscientists and Engineers, p. 481.
15 Brown A.R. (1996) Seismic attributes and their classification,The Leading Edge, 15, 10, 1090–1090. doi: 10.1190/1.1437208.
16 Coleou T., Allo F., Colnard O., Machecler I., Dillon L.,Schwedersky G., Nunes C., De Abreu E., Colpaert A.,van Wijngaarden A.J. (2012) Petrophysical seismic inversionover an offshore carbonate field, 74th EAGE Conference &Exhibition incorporating SPE EUROPEC 2012, 4–7 June2012, Copenhagen, Denmark.
17 Bouchot V., Bader A.G., Bialkowski A., Bonte D.,Bourgine B., Caritg S., Castillo C., Dezayes C., Gabalda S.,Guillou-Frottier L., Haffen S., Hamm V., Kervevan C.,Lopez S., Peter-Borie M. (2012) CLASTIQ-2 – Programmede recherche sur les ressources geothermales des reservoirsclastiques en France (Bassin de Paris et fosse Rhenan).Rapport final BRGM/RP-61472-FR.
Y. Drouiller et al.: Oil & Gas Science and Technology - Rev. IFP Energies nouvelles 74, 32 (2019) 21

18 Ortiz-Karpf A. (2016) Bathymetric and substrate controls onsubmarine mass-transport emplacement processes and chan-nel-levee complex evolution, PhD Thesis, University of Leeds,Leeds, England, p. 237.
19 Scholten-Vissinga M. (2014) QI workflow to identify sweetspots in the tight Amin Gas Play in North Oman, SecondEAGE Workshop on Rock Physics – Rock Physics: Integra-tion & Beyond, 12–14 January 2014, Muscat, Oman.
20 Baptiste J. (2016) Cartographie structurale et lithologique dusubstratum du Bassin parisien et sa place dans la chaınevarisque de l’Europe de l’Ouest - Approches combinees:geophysiques, petrophysiques, geochronologiques et modeli-sations 2D, These de Doctorat, Univ. d’Orleans, p. 374.
21 Oliver G., Spence G., Davis A., Stolyarov S., GadzhimirzaevD., Ackley B., Lipp C. (2016) Advanced cuttings analysisprovides improved completion design, efficiency and wellproduction, First Break 34, 69–76.
Y. Drouiller et al.: Oil & Gas Science and Technology - Rev. IFP Energies nouvelles 74, 32 (2019)22