3d radiative transfer modelling of fire impacts on a two-layer savanna system
TRANSCRIPT
Remote Sensing of Environment 115 (2011) 1866–1881
Contents lists available at ScienceDirect
Remote Sensing of Environment
j ourna l homepage: www.e lsev ie r.com/ locate / rse
3D radiative transfer modelling of fire impacts on a two-layer savanna system
M.I. Disney a,b,⁎, P. Lewis a,b, J. Gomez-Dans a,b,c, D. Roy d, M.J. Wooster b,c, D. Lajas e
a Department of Geography, University College London, Gower Street, London, WC1E 6BT, UKb NERC National Centre for Earth Observation (NCEO) UKc Department of Geography, King's College London, Strand, London, WC2R 2LS, UKd Geographic Information Science Center of Excellence, South Dakota State University, Brookings, SD 57007, USAe ESA-ESTEC, P. O. BOX 299, NL-2200 AG, Noordwijk, The Netherlands
⁎ Corresponding author at: Department of GeographGower Street, London, WC1E 6BT, UK. Tel.: +44 20 7679
E-mail address: [email protected] (M.I. Disne
0034-4257/$ – see front matter © 2011 Elsevier Inc. Aldoi:10.1016/j.rse.2011.03.010
a b s t r a c t
a r t i c l e i n f oArticle history:Received 18 October 2010Received in revised form 11 March 2011Accepted 12 March 2011Available online 9 April 2011
Keywords:BurnSavannaVegetationMCRT3D modellingRadiative transferFire impact
We present a new, detailed three dimensional (3D) approach to modelling the pre- and post-fire reflectanceof a two-layer savanna systemmodelled as heterogeneous overstory (tree) and understory (grass) layers. Themodels were developed from detailed field measurements of structural and radiometric properties made atexperimental burn plots with varying canopy cover in the Kruger National Park, South Africa. The modelswere used to simulate 400–2500 nm spectral reflectance at 10–500 m spatial scale for various viewing andsolar geometry configurations. The model simulations closely matched pre-fire and post-fire ground-based,helicopter and satellite remote sensing observations (all r2 valuesN0.95 except one post-fire case). The largestdiscrepancies between modelled and observed reflectances occurred typically at wavelengths greater than1200 nm for the post-fire simulations. The modelling results indicate that representation of overstory andunderstory structure and scattering properties are required to represent the burn signal in a typical savannasystem. The described 3D modelling approach enables separation of the scattering contributions of thedifferent scene components and is suited to testing and validating fire impact assessment algorithms atlocations where the difficulty of obtaining both pre- and post-fire observations is a severe constraint.
y, University College London,0592; fax: +44 20 7679 0565.y).
l rights reserved.
© 2011 Elsevier Inc. All rights reserved.
1. Introduction
Savanna ecosystems, land with grass and either scattered trees oran open canopy of trees, are important because of their widespreadcoverage, dynamics (particularly response to rainfall) and theecosystem services they provide (Asner et al., 2004; Hill & Hanan,2010; Sankaran et al., 2005; Skarpe, 1992). Fire is of particular interestin savanna ecosystems as it is thought to play a major role in creatingand maintaining these ecosystems (Bond et al., 2005; Bond & Keeley,2005; Higgins et al., 2000; Sankaran et al., 2007); it has a rapid anddynamic response to both short- and longer-term climate variabilityin terms of phenology and biomass accumulation (Sankaran et al.,2005); it is significantly linked to, and with consequences for,anthropogenic activities (Archibald et al., 2009; Frost, 1999); and ithas various feedbacks to the climate and carbon cycle via combustionof biomass and release of green house gases and aerosols into theatmosphere, changes in surface albedo and vegetation productivity(Denman et al., 2007; Jin & Roy, 2005; Van der Werf et al., 2003, 2004,2010).
Significant effort has been directed at measuring and modellingthe impacts of fire, and incorporating these impacts into broader
understanding of the feedback between the carbon cycle and climate insavanna ecosystems (Hanan et al., 1998). However, efforts to quantifythe impacts of fire are hampered by its highly dynamic and ephemeralnature. This is especially the case in savanna ecosystemswhere fires arepredominantly surface fires burning grasses and shrubs that canpropagate rapidly under hot, windy and low-humidity dry seasonconditions (Govender et al., 2006; Pereira, 2003; Yates et al., 2008). Firetends to remove material from the overstory and/or understory,transform live leaf and woody material into char and ash, and mayalso expose the underlying soil (Pereira et al., 2004; Roy & Landmann,2005; Trigg et al., 2005; Trigg & Flasse, 2001).Vegetation fires typicallyproduce predominantly dark black char, the primary by-productfollowing pyrolisis of volatiles, rather than white mineral ash that isonly produced under complete or near complete combustion (Roy et al.,2010; Smith et al., 2005; Smith & Hudak, 2005; Trigg & Flasse, 2000).
Satellite data have been used to monitor fire at regional to globalscale for more than two decades using algorithms that detect thelocation of active fires at the time of satellite overpass (Giglio et al.,2003, 2009; Roberts et al., 2009), and in the last decade using burnedarea mapping algorithms that map the spatial extent of the areasaffected by fires (Roy et al., 2008; Roy & Justice, 2007). More recently,researchers have attempted to use satellite data to characterize fireproperties (Archibald et al., 2010a; Lentile et al., 2006), and tounderstand the interaction between fire, climate and anthropogenicactivities (Archibald et al., 2010b).
1867M.I. Disney et al. / Remote Sensing of Environment 115 (2011) 1866–1881
Satellite fire impact detection algorithmstypically exploit thepersistent (days to weeks) impact of the fire on the surface, usuallyby detecting changes in the observed surface reflectance over time,particularly in the visible and NIR (Roy et al., 2002, 2005; Smith et al.,2005; Trigg & Flasse, 2001). Many detection methods use empiricalspectral indices that respond to the relative changes in reflectance invarious parts of the spectrum (in the visible and NIR in particular)(e.g. Giglio et al., 2009; Tansey et al., 2008). However, thresholdingspectral indices into burned and unburned classes requires localcalibration and may be difficult to generalise spatially (Roy et al.,2006). For time-varying measures there is also the additional issue ofvariability introduced by varying view and illumination angle. Forexample, in southern Africa savanna ecosystems variations inreflectance due to angular sampling may in some cases be greaterthan the reflectance change induced by fire (Roy et al., 2002;Stroppiana et al., 2003). Methods have been developed to exploitexpectations of the surface angular variation for detecting fireimpacts, such as the MODIS burned-area algorithm (Rebelo, 2005;Roy et al., 2002, 2005, 2008). However, to enable systematic globalapplication, simplified model approaches must be used. The MODISalgorithmfor example, uses linear kernel-driven BRDF modelsdeveloped for the MODIS BRDF/albedo product (Schaaf et al., 2002;Wanner et al., 1995).
The prevailing characteristics of fire impacts are of great interest toscientists and ecosystem managers as they can have an importantimpact on carbon emissions and post-fire vegetation regeneration.Various field-based measures of fire impact have been developed,from estimates of amount of material consumed, species mortalityand the likely differential impact on ecosystem response post-fire(Key & Benson, 2006; Lentile et al., 2006). Although these measuresmay not always be amenable directly to optical remote sensing (Royet al., 2006), various efforts have been made to parameterise andassess fire impacts using optical wavelength satellite data, particularlythrough the use of the normalized burn ratio (NBR), the differencebetween near-infrared (NIR) and middle-infrared (MIR) reflectancedivided by their sum(Brewer et al., 2005; Cocke et al., 2005; De Santis& Chuvieco, 2009; Epting et al., 2005; Karau & Keane, 2010; VanWagtendonk et al., 2004).
Here, we develop a detailed 3D modelling approach to use as a‘virtual laboratory’ (Prusinkiewicz, 1998; Widlowski et al., 2007). Thisapproach explicitly defines the 3D location of each scattering elementin the canopy down to the leaf and twig level. Although such a modelis time-consuming to develop, it has three key benefits. First, itrequires minimal assumptions about canopy structure and istherefore ideally suited to understanding how canopy structural andspectral properties impact the resulting signal. Second, the model canbe directly used to explore the effectiveness of a proposed model offire impact. Here we use a relatively simple approach within the‘virtual laboratory’, replacing grass plants explicitly with charredmaterial under a 3D overstory, to directly match field observations. Ifsome more complex impact were observed e.g. that leaves below aparticular height were removed, or that branches below a certain size/order were charred or consumed, this could be easily implemented.Third, a practical difficulty inassessing any approach to estimating fireimpacts from remotely sensed data is the problem of obtaining bothpre- and post-fire measurements. Once a detailed model of the sortproposed here has been developed, it can be used to simulate pre- andpost-fire observations at arbitrary spatial scales and angularconfigurations.
While there are various ways of modelling fire impacts usingradiative transfer (RT) models, difficulties can arise in translatingobserved changes in canopy structure into RT model parameterisa-tions. The impacts of fire on vegetation are a combination of (coupled)structural and radiometric (spectral) effects, with the relativeimportance of these effects being determined both by the nature ofthe canopy and the type of fire. Simplified RT approaches are
attractive for modelling fire impacts due to their ease of use andsmall requirement for parameterising information. The major advan-tage of simplified approaches is that they can then often be appliedwidely and rapidly. However, the simpler the model, the moredifficult it becomes to represent observed heterogeneity and/or tounderstand the complex interplay of structure on the signal (Pinty etal., 2004). For example, to represent the savanna fires of the kind weconsider herewhere a spatially heterogeneous understory is almost ortotally removed and the (strongly shadowing), highly-clumpedoverstory is not affected at all, the parameters of an heterogeneousRT representation, even of multiple layers, would represent someapproximate ‘effective’ property which may be difficult to measure inpractice (Disney et al., 2004; Pinty et al., 2006).
Various recent efforts have beenmade to develop RTmodels of fireimpacts. Pereira et al. (2004) used a simplified geometric-optics RTapproach to simulatemiombowoodlands and explore the detection ofunderstory burns. This model considered only the 3D structure of theoverstory canopy, using simple geometric crown shapes (ellipsoids),while the understory signal was represented as a uniform backgroundspectral response. They concluded that the detectability of understoryburns was largely insensitive to stand structure and viewing andillumination geometry and dependedmainly on the age of the burnedarea. In this case, even the overstory model structural parameterswere essentially ‘equivalent’ parameters, representing the combinedimpact of the real overstory and understory 3D structure on themodelled signal. Chuvieco et al. (2006) used amore realistic two-layerRT model to relate fire impacts to the composite burn index (CBI), byconsidering each layer as homogeneous, with different LAI, above asoil sub-surface. They modelled the impact of changes in soilreflectance (mixture of char and pre-fire soil signal), foliagereflectance (a linear mixture of green and brown leaf spectra) andchanges in overstory and understory leaf cover. They concluded thatin the SWIR and visible regions, the correlation between CBI andreflectance was positive, as the main effect of fire was removal ofgreen vegetation and water. In the NIR, the correlation was negative,as the main effect of fire was reduction of LAI. De Santis and Chuvieco(2007) compared these RT simulations with field measurements, andnoted model limitations due to the effects of dead leaf litter andvertical layering prevalent in the Mediterranean systems theyconsidered.De Santis et al. (2009) coupled separate leaf and canopyRT models in a modified CBI (GeoCBI)to include some account ofcanopy structure by considering the fractional cover of each canopylayer. This approach provided an improvement over CBI in relatingspectral reflectance to fire impact. There has also been work onexamining the impact of leaf and canopy properties on areassusceptible to burning (Bowyer & Danson, 2004; De Santis &Chuvieco, 2007, 2009), and how such methods can be used formapping fireimpacts (De Santis et al., 2010). In all these cases, the RTmodels are still relatively simple, for practical reasons (speed ofapplication). In particular they tend to consider homogeneousvegetation, which, even if layered, will not account for an overstorythat is typically unaffected by fire, or 3D spatial heterogeneity.
Recent work has shown that highly-detailed realistic RT modelsare particularly useful for benchmarking and testing simpler models(Widlowski et al., 2007, 2008) and for understanding the implicationsofmodel assumptions and observational limitations (temporal, spatialand spectral sampling). Here, we develop a detailed 3D model for useas a ‘virtual laboratory’, representing a two-layer savanna systemcomposed of a mixed tree canopy with a variable grass under-storybased on extensive fieldmeasurements of canopy properties. Weimplement amodel of fire impact and demonstrate that themodel cansimulate pre- and post-fire canopy reflectance at a range of scalesthrough comparison with field-measured and satellite observations.We discuss the utility of this approach for understanding the canopysignal in this environment and for testing and benchmarking modelsof fire impact.
1868 M.I. Disney et al. / Remote Sensing of Environment 115 (2011) 1866–1881
2. Materials and methods
2.1. Study area
Structural and radiometric measurements were made in KrugerNational Park (KNP), South Africa, over a 2-week period in the late dryseason, October-November 2008. The KNP is a protected savannaecosystem covering a range of elevation and precipitation/climaticgradients with tree/grass dynamics dominated by fire and herbivory.Mean annual rainfall varies from around 350 mm in the north toaround 750 mm in the south, but with significant inter-annualprecipitation variability (van Wilgen et al., 2004).
Measurements were made at Skukuza (25.1097 S, 31.4172E) andPretoriuskop (25.1639 S, 31.234E), both sited at long-term fire ecologyexperimental plots in the KNP (van Wilgen et al., 2000, 2004).Coordination with the KNP fire ecology experiment staff meant that theprescribed fires could be lit under controlled conditions and measure-ments made efficiently pre- and post-fire (an unusual and advantageoussituation in fire remote sensing research). Two plots of 300m2, no morethan 1 km apart, were measured at each site;Skukuza Napi andN'watwishaka (SNA, SNW); Pretoriuskop Kambeni and Numbi (PKA,PNU). At the time of the prescribed burning themajority of the vegetationwas senescent and approximately 5% and 30% of the vegetation wasgreen/photosynthetically active inSkukuzaandPretoriuskop respectively.
The plots at Pretoriuskop are characterised by higher precipitationand lower grazing pressure than those at Skukuza and hence havemuch more dense vegetation. Two plots were measured at each site,Skukuza Napi and N'watwishaka (SNA, SNW); Pretoriuskop Kambeniand Numbi (PKA, PNU). The Skukuza plots are dominated by shallow-rooted deciduous Combretum species, in particular Combretumapiculatum (Red Bushwillow), Combretumhereroensis (Russet Bush-willow) andCombretumzeyheri (Mixed Bushwillow). These treesmakeup a significant part of the total biomass, even though many of themlie horizontally after being felled by young elephants (pers. comm. N.Govender, SANParks). The Combretum species continue to grow evenafter being felled, often sprouting vertically. The remaining vegetationis made up of dry grasses of the order of 0.5-1 m in height, and a smallnumber of large, dense green Marula (Sclerocaryabirrea) trees. TheSclerocarya are deep rooted and hence act as a hydraulic and nutrientpump and remain green year-round, unlike the Combretum. Grazinglawns within the plots i.e. flattened grass caused by animalencroachment, act to prevent fire spread as the flattened grass onlyburns partially or not at all. The Pretoriuskop plots are dominated byTerminaliasericea (Silver cluster-leaf), a moderately large shrub-liketree (up to 4-5 m high), mixedwith Combretum. The level of herbivoryismuch lower and the Terminalia do not regrow after being felled.This,combined with higher precipitation results in generally higher grassand litter fuel loads. The Skukuza woody, grass and litter fuel loadswere measured as 0.085, 0.25 and 0.13 kg m-2 respectively. ThePretoriuskop woody, grass and litter fuel loads were measured as0.013, 0.55 and 0.14 kg m-2 respectively. Skukuza plots had moderateamounts of exposed soil (10-30% by surfacearea), much more so thanthe Pretoriuskop plots (b5%), with the soil being highly reflectivesandy material in all cases.
2.2. Prescribed fires
The prescribed fires in the Skukuza plots were set on 31/10/2008 at09:45 GMT (SNA) and 13:00 (SNW). The Pretoriuskop fires were set on03/11/2008 at 09:00 (PKU) and 12:00 (PNU). Backfires were lit on thedownwind sideof the plotsfirst, before headfireswere lit on the upwindside some 10–15 minutes later. Areas remaining unburned were relitwithin 30 minutes. Pre- and post-fire fuel load measurements showedthat around 90-95% of the standing grass and 96% of the litter wasburned in the Skukuza plots, and 100% of the grass and litter wereburned in the Pretoriuskop plots.In both cases the overstory was not
affected, a situation common to a range of arid African savanna fires(Archibald & Bond, 2003; Bond & Archibald, 2003).
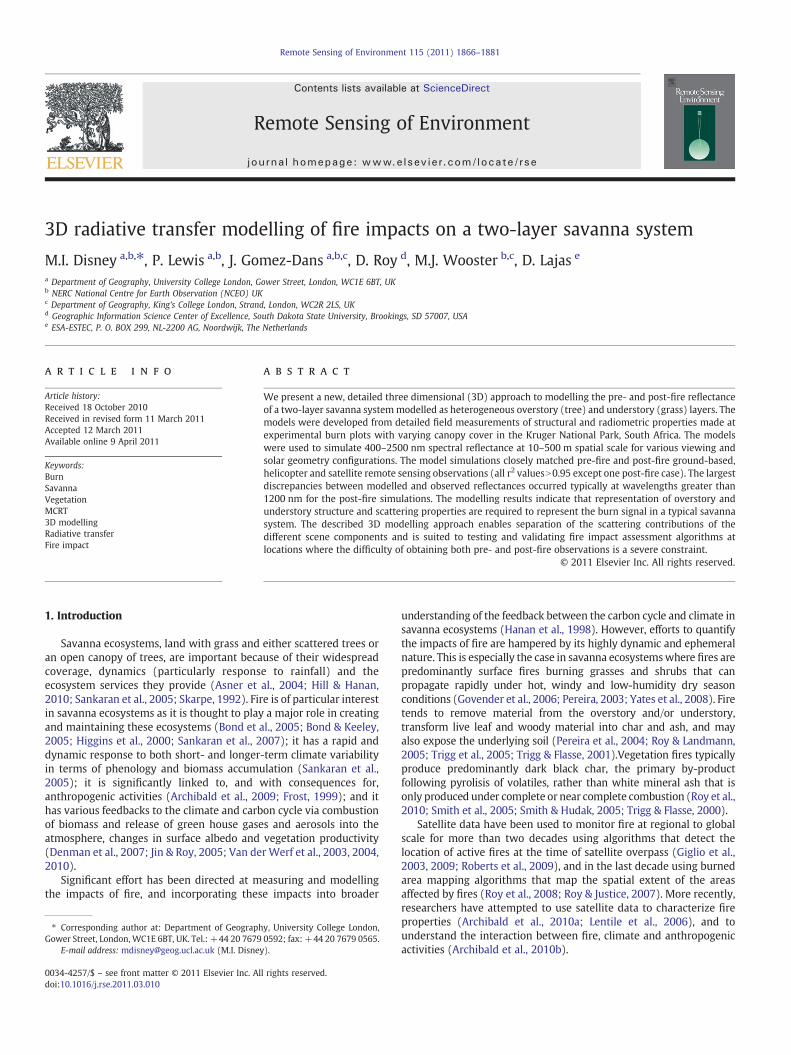
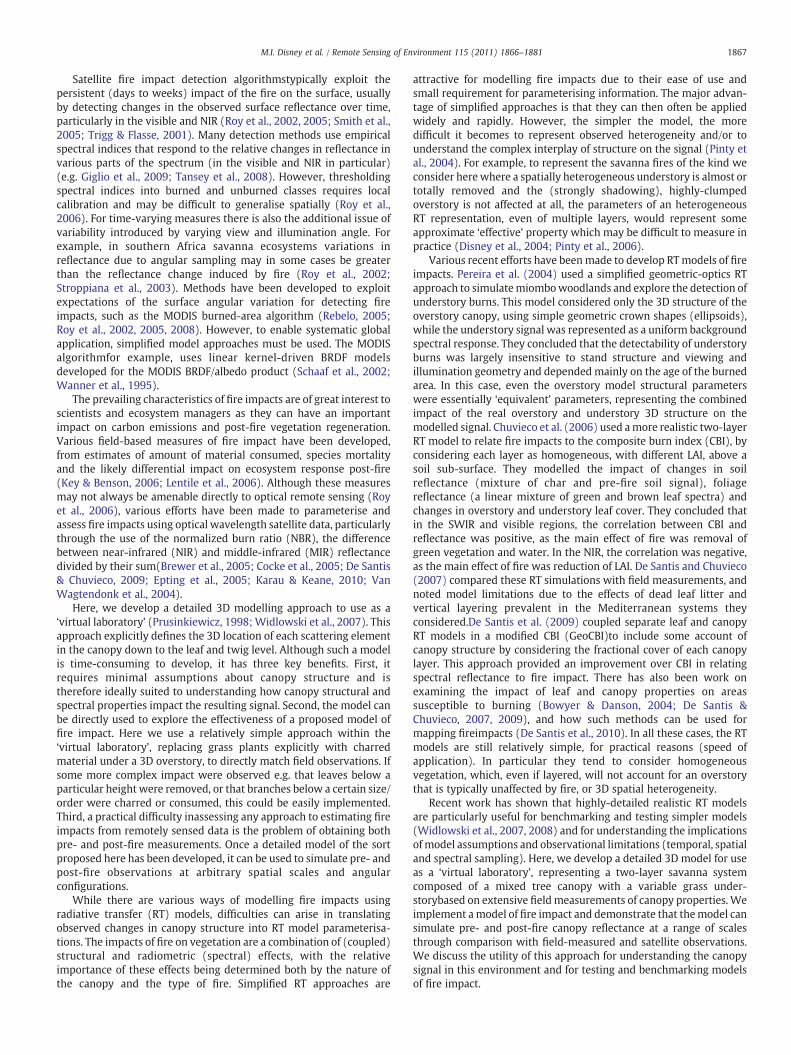
Fig. 1 shows an aerial image of one plot from each site. The firebreaks between plots are clearly-visible due to the bright exposed soil.The patches of dense and sparse vegetation, and the paths created byanimal encroachment are maintained both before and after burning.The predominant impact of fire is the darkening of the backgrounddue to the burning of the dense grass understory, plus some exposureof bright background soil in the sparser Skukuza plots. Fig. 2 illustratesthe contrast in density of over- and understory between the Skukuzaand Pretoriuskop sites.
2.3. Field measurements
At each plot a range of pre- and post-fire structural andradiometric measurements of the tree-dominated overstory andgrass understory were made to enable the development and testingof the 3D models. Every effort was made to collect the radiometricmeasurements under stable atmospheric conditions, either clearskies, or completely overcast skies. These measurements are de-scribed below.
2.4. Structural measurements
In each plot,multiple 100 m transects weremarked along the longerdimension of the plot, separated by 50m laterally. Measurements weremade of tree height, diameter-at-breast height (DBH), crown size ofevery tree within 1 m horizontally either side of the transects,representing an area of 600m2 in each plot. The number of fallen treeswas also recorded in each transect. Measurements are summarised inTable 1. The leaf area index (LAI) wasmeasured at 10 m intervals alongeach transect using two LAI2000 (LI-COR Bioscience, Lincoln, NE, USA)instruments in master-slave mode, one situated outside the plot in aclearing. The LAI was recorded above and below the understory at eachpoint to allow separation of overstory and understory LAI. Whereillumination conditionswere not overcast, a 90° solar occlusion lens capwas used on both instruments. All measurements within the canopyweremadewith the sun behind the user. Fig. 3 shows histograms of theLAImeasurements in eachplot. ThemeanLAI valueswere1.02 (1σ0.51)and 2.81 (1σ 1.16) at Skukuza and Pretoriuskop respectively.
At each LAI measurement location, upward-looking hemiphotoswere taken using a Canon EOS5D camera with Sigma 8 mm F3.5 EX DGCircular fisheye lens (180° field-of-view). Hemiphotos were takenabove (at a height of 1.5 m) and below (0.2 m) the understory, to enableseparation of overstory and understory LAI and gap fraction. Hemi-photos were processed using the CanEYE software (INRA, Avignon,http://147.100.66.194/can_eye). Following Warren-Wilson (1959) andRoss (1981), the CanEYE algorithm assumes a random spatialdistribution of infinitely small leaves. A Poisson model for relating thegap probability P0(θv, ϕv) at view zenith angle θv and azimuth angle ϕv
respectively, to the theoretical contact frequency N(θv, ϕv) (i.e. thenumber of contacts a ray of light would make with vegetation asfunction of penetration through the canopy), was used as:
P0 θv;ϕvð Þ = e−N θv ;ϕvð Þ = e−G θv ;ϕvð ÞLAI =cos θvð Þ ð1Þ
where G(θv, ϕv) is the leaf projection function i.e. the mean projectionof a unit foliage area. Eq. (1) assumes that G(θv, ϕv) is independent ofheight h in the canopy. Following Nilson (1971), the gap probabilitycan be shown to be exponentially related to LAI, even in cases wherethe turbid medium assumption underlying the Poisson model is notmet, through the inclusion of a canopy clumping parameter λ0 (b1)describing the non-random nature of the canopy structure i.e.
P0 θv;ϕvð Þ = e−λ0G θv ;ϕvð ÞLAI =cos θvð Þ ð2Þ
Fig. 1. Top row: pre-fire plots at Skukuza Napi (left) and Pretoriuskop Numbi (right). Bottom row: the same plots post-fire.
1869M.I. Disney et al. / Remote Sensing of Environment 115 (2011) 1866–1881
In this case the effective LAIeff estimated from indirect (hemiphoto)methods, is thenλ0LAItrue,where “true” LAI is thatmeasurable directly e.g.via destructive sampling. The hemiphotomeasurements are summarisedin Table 2. Estimatesweremade of the density of grass plants in each plot(plants per unit area), ranging from 21–43 m-2 across all plots.
2.4.1. Radiometric measurements
2.4.1.1. Scene components.Measurements of the spectral reflectance ofthe various canopy components (leaf, bark, soil, dry grass, burned leaf,burned bark, char, ash) were made using an ASD FieldSpec ProSpectroradiometer (ASD Inc., Boulder, CO, USA). For componentreflectance measurements the ASD was used with a contact probe(soil and bark), or with a leaf clip attachment. The probe was placedagainst the target (or in the leaf clip) and the reflectance recordedrelative to that of a calibrated white spectralon reflectance panel
Fig. 2. Examples of contrast between plots. Left: SNA plot, showing relatively low density ofseen in the image); right: the PNU plot showing the much denser, taller coverage of Combr
(calibrated by the NERC Field Spectroscopy Facility, University ofEdinburgh, www.fsf.nerc.ac.uk).
2.4.1.2. Understory bidirectional reflectance. Two intensive sets ofdirectional reflectance measurements were made in each of theSkukuza and Pretoriuskop plots. A 3x3m area of unburned grass wasmeasured in each plot under clear sky conditions, using the ASD FSProSpectroradiometer on a 1.5 boommounted 1.5 m above the top of thegrass canopy, with an 8° field-of-view (FOV) foreoptic. Multiplemeasurements weremade at view zenith angles of 0°, 30° and 60° intoand across the solar principal plane.
2.4.1.3. Top-of-canopy (TOC) reflectance. TOC reflectance measure-ments were made using two ASD instruments in dual radiance/irradiance mode, one on the ground and one mounted on a helicopterflying at an altitude of 100-150 m. The ground-based instrument wasmounted on a tripod within 500 m of both plots at each site, with an
primarily Combretum species, dry grass and shrub cover (the disc pasture meter can beetum and taller grass.

Table 1Tree structural measurements from all four plots.
Site,Transect
No. in transect,no. fallen
Height(mean, σ), m
Crown diameter(mean, σ), m
Tree density(ha-1)
SNA 29, 10 4.25, 0.875 2.76, 1.14 600-850SNW 29, 15 3.92, 1.13 3.27, 1.53 700-750PKA 46, 1 5.21, 1.76 2.79, 0.96 1100-1200PNU 65, 2 5.91, 2.55 2.78, 1.24 1600-1700
Table 2Summary of gap fraction, LAItrue and LAIeff derived from analysis of hemiphotos.
Site Gap fraction (mean, σ) LAItrue LAIeff
SNW upward (BELOW) 0.78, 0.05 0.98 0.42SNW upward (ABOVE) 0.94, 0.05 0.22 0.18SNW postfire, upward (ABOVE) 0.96, 0.03 0.14 0.08SNA prefire, upward (BELOW) 0.81, 0.06 0.77 0.31SNA prefire, upward (ABOVE) 0.93, 0.06 0.09 0.06SNA postfire, upward (ABOVE) 0.94, 0.03 0.09 0.06PKA prefire upward (BELOW) 0.60, 0.04 1.70 0.42PKA prefire upward (ABOVE) 0.93, 0.02 0.22 0.14PKA postfire, upward (ABOVE) 0.93, 0.05 0.16 0.12PNU prefire, upward (BELOW) 0.73, 0.05 1.01 0.44PNU prefire, upward (ABOVE) 0.90, 0.04 0.28 0.22PNU postfire, upward (ABOVE) 0.92, 0.03 0.20 0.06
1870 M.I. Disney et al. / Remote Sensing of Environment 115 (2011) 1866–1881
8°FOV foreoptic viewing the central region of a calibrated whitespectralon Lambertian reflectance panel to measure downwellingirradiance. The helicopter mounted ASD instrument used a 5°foreoptic mounted on a 1.3 m boom. Measurements were madewith both instruments at 1 Hz, collecting near-continuous estimatesof the radiance and irradiance over the target sites. Helicopter flightswere made at an altitude of 100-150 m a.g.l. (footprint of 9-13 m)intransects along the length of the site separated by about 20 m, flyingat a velocity of approximately 15ms-1, with each plot being measuredover a 20 minute period. The ASD clocks were synchronised prior toeach flight and using the GPS time-stamp information, the closestradiance and irradiance pairs in time were matched, and post-processed to reflectance using the instrument and reference panelcalibration information. Post-fire measurements were made at allplots as soon as smouldering had stopped, although in thePretoriuskop post-fire case, smoke/haze was still visible duringpost-fire measurements. Table 3 summarises the collection of TOCreflectance data.
2.4.1.4. Satellite data. The multi-angular, spectral and spatial proper-ties of CHRIS-PROBA make it ideally-suited for this application,despite its limited coverage and availability. Pre-fire CHRIS-PROBAdata were collected on 11/08/2008 in full-spectrummode 1 (www1),i.e. in 62 wavebands from 415.8 nm to 1007.5 nm, with a (nominal)36 m footprint. Only three view angles were collocated over themeasured fire plots and these data were geometrically and atmo-spherically corrected to surface reflectance using the CHRIS-Box 1.5add-on for the ESA BEAM 4.7 Toolbox (Guanter et al., 2005; www2).Persistent cloud cover precluded any useful post-fire CHRIS-PROBAacquisitions.
MODIS nadir BRDF-adjusted reflectance 500 m data (NBAR, Schaafet al., 2002) values were obtained at the locations of active firessufficiently hot/large to be sensed by the 1 km MODIS active firedetection product (Giglio et al., 2003). The plot fires were too small(~3 ha) to be identified by the MODIS active fire product. Instead,locations within a 10 km radius of the Skukuza and Pretoriuskop plotsand within one month either side of the field measurement dates
Fig. 3. Histograms of the LAI values recorded along transects in each of the two sites.
where 1 kmMODIS active fires were detectedwere considered. In thisway 224 pre- and post-fire MODIS 500 m NBAR pixels for twoseparate fire-affected areas were selected, identified as having burnedby the MODIS active fire product on 6/9/2008 (97 pixels centred on31.35, -25.21) and 14/9/2008 (127 pixels, centred on 31.30, -25.23).The areas covered by the MODIS pixels generally had very similar treeand understory cover to the burn sites.
To compare the angular variation of MODIS observations with 3Dsimulations, daily MODIS reflectance data were collected for the centralpixels of the two fire-affected areas described above. MODIS griddedTERRA (MOD09GA) and AQUA (MYD09GA) data were collected for a21-day period either side of the fire date and filtered to remove cloudand haze-contaminated pixels based on the QA values and on visualinspection of the image quicklooks. The resulting data contained 6observations pre- and post-fire for the 6/9/2008 fire-affected area, and8 pre- and 5 post-fire observations for the 14/9/2008 fire fire-affectedarea respectively. The angular configurations of these observationswerenot ideal for BRDF comparisons as the relative azimuth between theview and illumination vectors was between 50-65° and so far from thesolar principle plane (relative azimuth close to 0° or 180°) whereangular variations due to shadowing are at a maximum.
2.5. Model generation
Using the information from the field measurements, 3D tree andgrass models were generated to produce 3D savanna scene models of100×100 m extent. 3Dmodel canopies covering a range of vegetationdensity (tree and grass LAI) were produced to match the range of fieldmeasurements, over a soil understory using measured soil reflectanceproperties. In all cases where plant models re located within thescenes, a uniform random distribution is used.
2.5.1. Overstory canopy objectsFor the Combretum, Sclerocaryaand Terminaliastructure, Onyx-
TREE© software (www.onyx.com) was used. This software has beenused to simulate the structure of deciduous broadleaf canopies forsimulation of various remote sensing signals (Disney et al., 2009,2010). Tree structure was generated by using examples of existing
Table 3Summary of helicopter flight times and sun angles.
Plot Pre-fireacquisition
Pre-fire sun angles(zen°; az°)
Post-fireacquisition
Post-fire sun angles(zen°; az°)
SNA 29/10/0809:33–10:13
32-24; 76-66 31/10/0812:10–12:34
12-16; 329-310
SNW 29/10/0810:22–10:45
22-18; 65-53 31/10/0812:38–13:17
17-24; 307-292
PKA 29/10/0811:57–12:07
12-13; 344-333 03/11/0814:31–15:09
40-49; 276-271
PNU 29/10/0812:08–12:30
13-16; 333-314 03/11/0815:41–16:20
56-65; 268-264
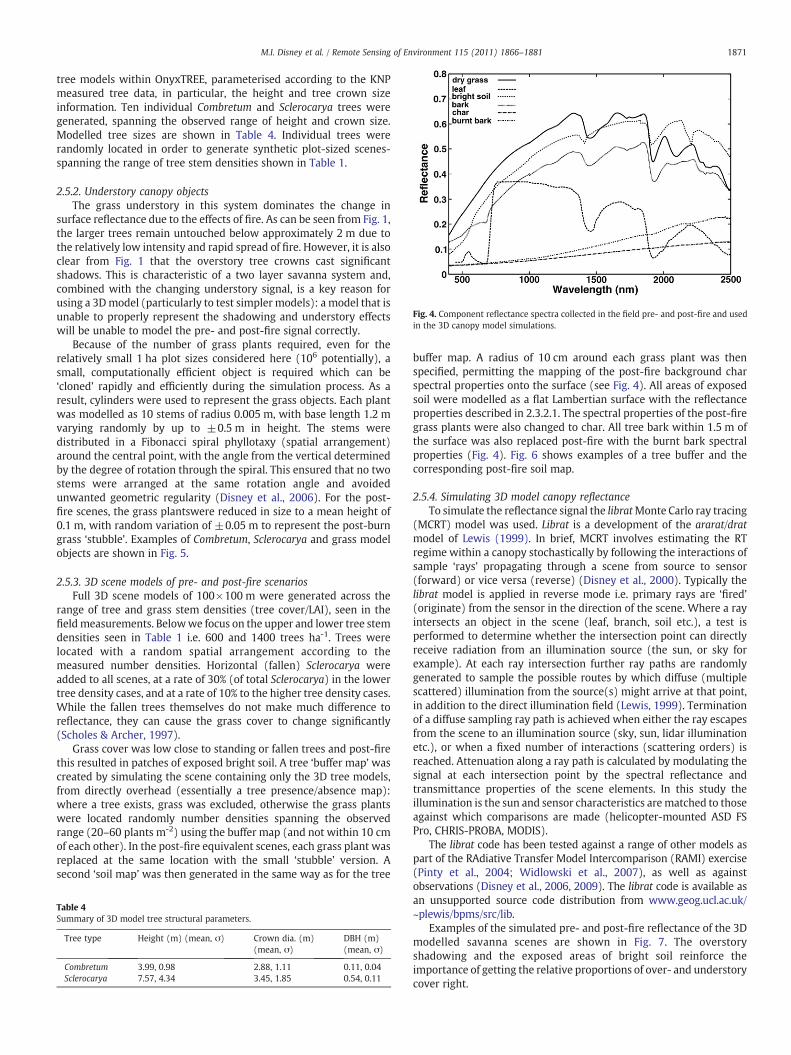
Fig. 4. Component reflectance spectra collected in the field pre- and post-fire and usedin the 3D canopy model simulations.
1871M.I. Disney et al. / Remote Sensing of Environment 115 (2011) 1866–1881
tree models within OnyxTREE, parameterised according to the KNPmeasured tree data, in particular, the height and tree crown sizeinformation. Ten individual Combretum and Sclerocarya trees weregenerated, spanning the observed range of height and crown size.Modelled tree sizes are shown in Table 4. Individual trees wererandomly located in order to generate synthetic plot-sized scenes-spanning the range of tree stem densities shown in Table 1.
2.5.2. Understory canopy objectsThe grass understory in this system dominates the change in
surface reflectance due to the effects of fire. As can be seen from Fig. 1,the larger trees remain untouched below approximately 2 m due tothe relatively low intensity and rapid spread of fire. However, it is alsoclear from Fig. 1 that the overstory tree crowns cast significantshadows. This is characteristic of a two layer savanna system and,combined with the changing understory signal, is a key reason forusing a 3Dmodel (particularly to test simpler models): a model that isunable to properly represent the shadowing and understory effectswill be unable to model the pre- and post-fire signal correctly.
Because of the number of grass plants required, even for therelatively small 1 ha plot sizes considered here (106 potentially), asmall, computationally efficient object is required which can be‘cloned’ rapidly and efficiently during the simulation process. As aresult, cylinders were used to represent the grass objects. Each plantwas modelled as 10 stems of radius 0.005 m, with base length 1.2 mvarying randomly by up to ±0.5 m in height. The stems weredistributed in a Fibonacci spiral phyllotaxy (spatial arrangement)around the central point, with the angle from the vertical determinedby the degree of rotation through the spiral. This ensured that no twostems were arranged at the same rotation angle and avoidedunwanted geometric regularity (Disney et al., 2006). For the post-fire scenes, the grass plantswere reduced in size to a mean height of0.1 m, with random variation of ±0.05 m to represent the post-burngrass ‘stubble’. Examples of Combretum, Sclerocarya and grass modelobjects are shown in Fig. 5.
2.5.3. 3D scene models of pre- and post-fire scenariosFull 3D scene models of 100×100 m were generated across the
range of tree and grass stem densities (tree cover/LAI), seen in thefieldmeasurements. Belowwe focus on the upper and lower tree stemdensities seen in Table 1 i.e. 600 and 1400 trees ha-1. Trees werelocated with a random spatial arrangement according to themeasured number densities. Horizontal (fallen) Sclerocarya wereadded to all scenes, at a rate of 30% (of total Sclerocarya) in the lowertree density cases, and at a rate of 10% to the higher tree density cases.While the fallen trees themselves do not make much difference toreflectance, they can cause the grass cover to change significantly(Scholes & Archer, 1997).
Grass cover was low close to standing or fallen trees and post-firethis resulted in patches of exposed bright soil. A tree ‘buffer map’ wascreated by simulating the scene containing only the 3D tree models,from directly overhead (essentially a tree presence/absence map):where a tree exists, grass was excluded, otherwise the grass plantswere located randomly number densities spanning the observedrange (20–60 plants m-2) using the buffer map (and not within 10 cmof each other). In the post-fire equivalent scenes, each grass plant wasreplaced at the same location with the small ‘stubble’ version. Asecond ‘soil map’ was then generated in the same way as for the tree
Table 4Summary of 3D model tree structural parameters.
Tree type Height (m) (mean, σ) Crown dia. (m)(mean, σ)
DBH (m)(mean, σ)
Combretum 3.99, 0.98 2.88, 1.11 0.11, 0.04Sclerocarya 7.57, 4.34 3.45, 1.85 0.54, 0.11
buffer map. A radius of 10 cm around each grass plant was thenspecified, permitting the mapping of the post-fire background charspectral properties onto the surface (see Fig. 4). All areas of exposedsoil were modelled as a flat Lambertian surface with the reflectanceproperties described in 2.3.2.1. The spectral properties of the post-firegrass plants were also changed to char. All tree bark within 1.5 m ofthe surface was also replaced post-fire with the burnt bark spectralproperties (Fig. 4). Fig. 6 shows examples of a tree buffer and thecorresponding post-fire soil map.
2.5.4. Simulating 3D model canopy reflectanceTo simulate the reflectance signal the libratMonte Carlo ray tracing
(MCRT) model was used. Librat is a development of the ararat/dratmodel of Lewis (1999). In brief, MCRT involves estimating the RTregime within a canopy stochastically by following the interactions ofsample ‘rays’ propagating through a scene from source to sensor(forward) or vice versa (reverse) (Disney et al., 2000). Typically thelibrat model is applied in reverse mode i.e. primary rays are ‘fired’(originate) from the sensor in the direction of the scene. Where a rayintersects an object in the scene (leaf, branch, soil etc.), a test isperformed to determine whether the intersection point can directlyreceive radiation from an illumination source (the sun, or sky forexample). At each ray intersection further ray paths are randomlygenerated to sample the possible routes by which diffuse (multiplescattered) illumination from the source(s) might arrive at that point,in addition to the direct illumination field (Lewis, 1999). Terminationof a diffuse sampling ray path is achieved when either the ray escapesfrom the scene to an illumination source (sky, sun, lidar illuminationetc.), or when a fixed number of interactions (scattering orders) isreached. Attenuation along a ray path is calculated by modulating thesignal at each intersection point by the spectral reflectance andtransmittance properties of the scene elements. In this study theillumination is the sun and sensor characteristics arematched to thoseagainst which comparisons are made (helicopter-mounted ASD FSPro, CHRIS-PROBA, MODIS).
The librat code has been tested against a range of other models aspart of the RAdiative Transfer Model Intercomparison (RAMI) exercise(Pinty et al., 2004; Widlowski et al., 2007), as well as againstobservations (Disney et al., 2006, 2009). The librat code is available asan unsupported source code distribution from www.geog.ucl.ac.uk/~plewis/bpms/src/lib.
Examples of the simulated pre- and post-fire reflectance of the 3Dmodelled savanna scenes are shown in Fig. 7. The overstoryshadowing and the exposed areas of bright soil reinforce theimportance of getting the relative proportions of over- and understorycover right.
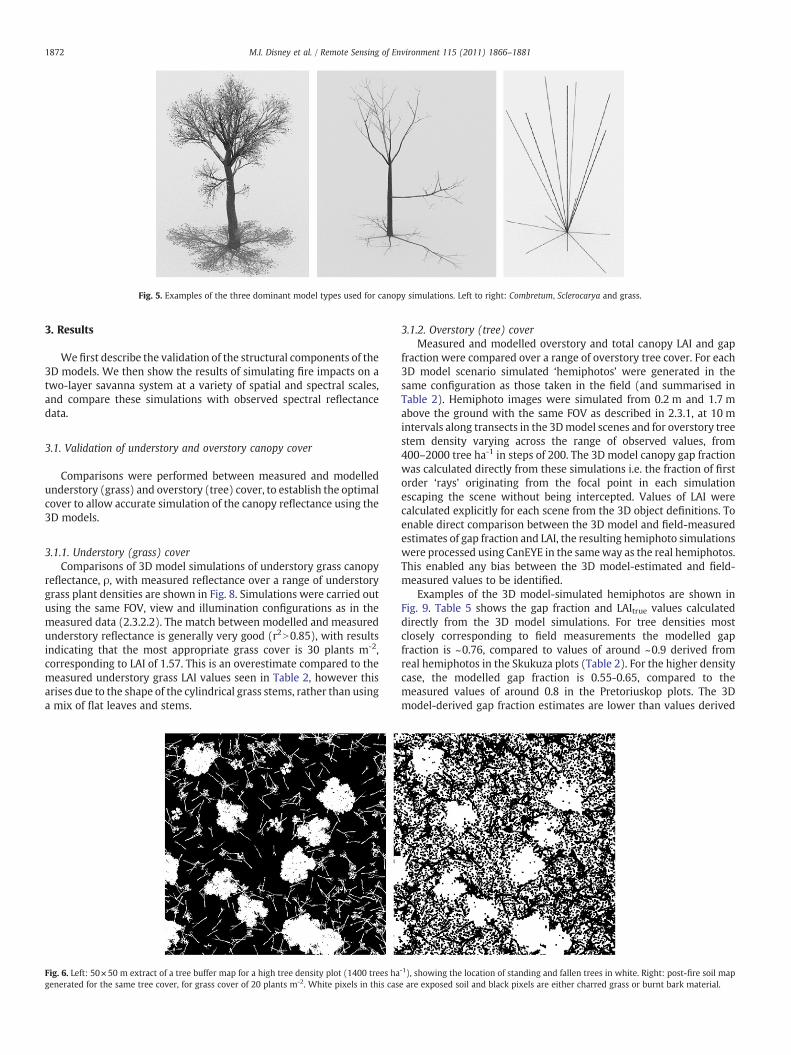
Fig. 5. Examples of the three dominant model types used for canopy simulations. Left to right: Combretum, Sclerocarya and grass.
1872 M.I. Disney et al. / Remote Sensing of Environment 115 (2011) 1866–1881
3. Results
We first describe the validation of the structural components of the3D models. We then show the results of simulating fire impacts on atwo-layer savanna system at a variety of spatial and spectral scales,and compare these simulations with observed spectral reflectancedata.
3.1. Validation of understory and overstory canopy cover
Comparisons were performed between measured and modelledunderstory (grass) and overstory (tree) cover, to establish the optimalcover to allow accurate simulation of the canopy reflectance using the3D models.
3.1.1. Understory (grass) coverComparisons of 3D model simulations of understory grass canopy
reflectance, ρ, with measured reflectance over a range of understorygrass plant densities are shown in Fig. 8. Simulations were carried outusing the same FOV, view and illumination configurations as in themeasured data (2.3.2.2). The match between modelled and measuredunderstory reflectance is generally very good (r2N0.85), with resultsindicating that the most appropriate grass cover is 30 plants m-2,corresponding to LAI of 1.57. This is an overestimate compared to themeasured understory grass LAI values seen in Table 2, however thisarises due to the shape of the cylindrical grass stems, rather than usinga mix of flat leaves and stems.
Fig. 6. Left: 50×50 m extract of a tree buffer map for a high tree density plot (1400 trees hagenerated for the same tree cover, for grass cover of 20 plants m-2. White pixels in this cas
3.1.2. Overstory (tree) coverMeasured and modelled overstory and total canopy LAI and gap
fraction were compared over a range of overstory tree cover. For each3D model scenario simulated ‘hemiphotos’ were generated in thesame configuration as those taken in the field (and summarised inTable 2). Hemiphoto images were simulated from 0.2 m and 1.7 mabove the ground with the same FOV as described in 2.3.1, at 10 mintervals along transects in the 3Dmodel scenes and for overstory treestem density varying across the range of observed values, from400–2000 tree ha-1 in steps of 200. The 3D model canopy gap fractionwas calculated directly from these simulations i.e. the fraction of firstorder ‘rays’ originating from the focal point in each simulationescaping the scene without being intercepted. Values of LAI werecalculated explicitly for each scene from the 3D object definitions. Toenable direct comparison between the 3D model and field-measuredestimates of gap fraction and LAI, the resulting hemiphoto simulationswere processed using CanEYE in the sameway as the real hemiphotos.This enabled any bias between the 3D model-estimated and field-measured values to be identified.
Examples of the 3D model-simulated hemiphotos are shown inFig. 9. Table 5 shows the gap fraction and LAItrue values calculateddirectly from the 3D model simulations. For tree densities mostclosely corresponding to field measurements the modelled gapfraction is ~0.76, compared to values of around ~0.9 derived fromreal hemiphotos in the Skukuza plots (Table 2). For the higher densitycase, the modelled gap fraction is 0.55-0.65, compared to themeasured values of around 0.8 in the Pretoriuskop plots. The 3Dmodel-derived gap fraction estimates are lower than values derived
-1), showing the location of standing and fallen trees in white. Right: post-fire soil mape are exposed soil and black pixels are either charred grass or burnt bark material.
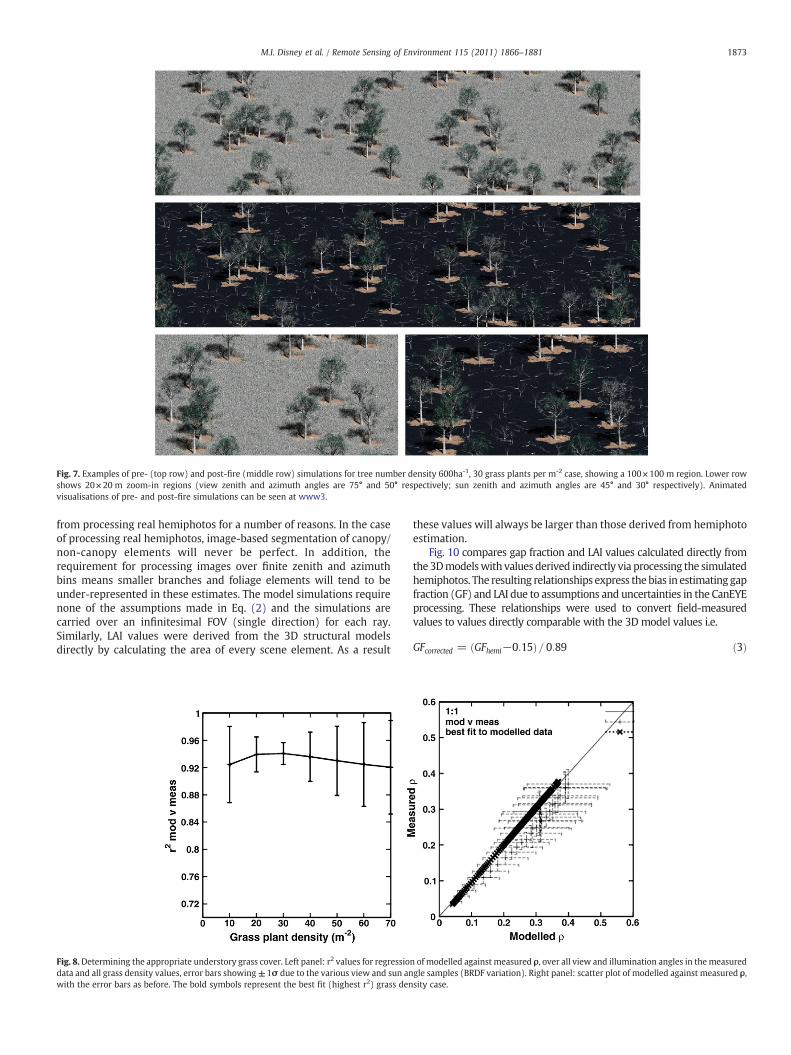
Fig. 7. Examples of pre- (top row) and post-fire (middle row) simulations for tree number density 600ha-1, 30 grass plants per m-2 case, showing a 100×100 m region. Lower rowshows 20×20 m zoom-in regions (view zenith and azimuth angles are 75° and 50° respectively; sun zenith and azimuth angles are 45° and 30° respectively). Animatedvisualisations of pre- and post-fire simulations can be seen at www3.
1873M.I. Disney et al. / Remote Sensing of Environment 115 (2011) 1866–1881
from processing real hemiphotos for a number of reasons. In the caseof processing real hemiphotos, image-based segmentation of canopy/non-canopy elements will never be perfect. In addition, therequirement for processing images over finite zenith and azimuthbins means smaller branches and foliage elements will tend to beunder-represented in these estimates. The model simulations requirenone of the assumptions made in Eq. (2) and the simulations arecarried over an infinitesimal FOV (single direction) for each ray.Similarly, LAI values were derived from the 3D structural modelsdirectly by calculating the area of every scene element. As a result
Fig. 8.Determining the appropriate understory grass cover. Left panel: r2 values for regressiodata and all grass density values, error bars showing±1σ due to the various view and sun anwith the error bars as before. The bold symbols represent the best fit (highest r2) grass den
these values will always be larger than those derived from hemiphotoestimation.
Fig. 10 compares gap fraction and LAI values calculated directly fromthe 3Dmodelswith values derived indirectly via processing the simulatedhemiphotos. The resulting relationships express the bias in estimating gapfraction (GF) and LAI due to assumptions and uncertainties in the CanEYEprocessing. These relationships were used to convert field-measuredvalues to values directly comparable with the 3D model values i.e.
GFcorrected = GFhemi−0:15ð Þ= 0:89 ð3Þ
n of modelled against measured ρ, over all view and illumination angles in themeasuredgle samples (BRDF variation). Right panel: scatter plot of modelled against measured ρ,sity case.

Fig. 9. Top row: 3D model-simulated upward-looking ‘hemiphotos’ for grass density 30m-2 and tree density 1200ha-1, below (left) and above (right) the understory canopyrespectively. Bottom row: hemiphotos taken in the PKA plot where measured tree density was ~1200ha-1.
1874 M.I. Disney et al. / Remote Sensing of Environment 115 (2011) 1866–1881
and
LAIcorrected = LAIhemi + 0:05ð Þ= 0:79 ð4Þ
Corrected field-estimated overstory LAI values for the Skukuza plotsrange from 0.14-0.42, corresponding to the model tree density of400–800 ha-1; for the Pretoriuskop plots, overstory LAI ranges from0.33-0.63, corresponding to model tree density of 700–1400 trees ha-1.Consequently, tree number densities of 600 and 1000 ha-1 were used inthe Skukuza and Pretoriuskop pre- and post-fire reflectance simulationsrespectively.
Table 5Variation of gap fraction and LAItrue as a function of tree density derived directly fromthe 3D models. Those marked in bold show the values of tree density measured in theSkukuza (low density) and Pretoriuskop (high density) plots.
Tree density (ha-1) Gap fraction (mean, 1σ) LAItrue
400 0.85, 0.08 0.17600 0.80, 0.07 0.27800 0.72, 0.08 0.351000 0.67, 0.09 0.441200 0.68, 0.11 0.531400 0.57, 0.12 0.611600 0.53, 0.07 0.711800 0.49, 0.16 0.802000 0.42, 0.08 0.89
3.1.3. Scene componentsIn Fig. 11 examples of the angular variation of 3D model scene
scattering components are shown, for the grass plant densitiescorresponding to the Skukuza and Pretoriuskop plots. Results areshown for the sunlit scene scattering components only which willtend to dominate the scattering. In the pre-fire case (left panel) themodelledSkukuzascene is dominated by the sunlit soil due to the lowunderstory and overstory cover, particularly at view angles close tonadir. The fraction of sunlit soil falls with increasing view angle awayfrom nadir, while the sunlit understory fraction rises correspondinglyto the point where they are approximately equal. For the modelled-Pretoriuskop scene, sunlit soil only exceeds sunlit understory at nadir.As view zenith angle increases away from nadir, the fraction of sunlitunderstory stays approximately constant, while the sunlit soildecreases to near zero. This indicates that pre-fire scene scatteringis dominated by the soil and understory reflectance.
In the post-fire case (right panel of Fig. 11), both modelled scenesare dominated by the fraction of charredmaterial, either soil with charmapped onto it or charred grass. The lack of understory vegetationcover also manifests itself as a generally reduced view angledependence, although for the Pretoriuskop scene the sunlit crownincreases at the expense of the sunlit char, due to tree shadowing. Thesingle scattered (first order) signal is simply the sum of theproportions of each sunlit scene component multiplied by theirrespective reflectance properties. This emphasises the need to get thefraction of grass cover correctly parameterised to represent the burnsignal. This also suggests that the result of grass cover being removed
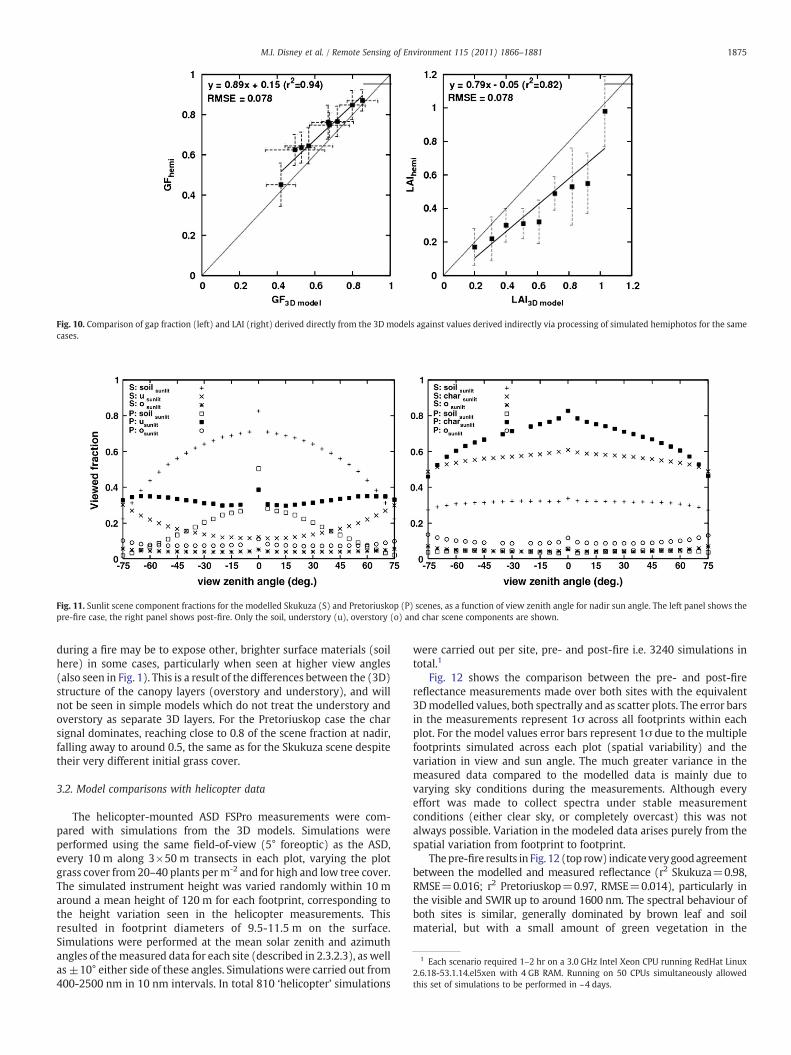
Fig. 10. Comparison of gap fraction (left) and LAI (right) derived directly from the 3D models against values derived indirectly via processing of simulated hemiphotos for the samecases.
Fig. 11. Sunlit scene component fractions for the modelled Skukuza (S) and Pretoriuskop (P) scenes, as a function of view zenith angle for nadir sun angle. The left panel shows thepre-fire case, the right panel shows post-fire. Only the soil, understory (u), overstory (o) and char scene components are shown.
1 Each scenario required 1–2 hr on a 3.0 GHz Intel Xeon CPU running RedHat Linux2.6.18-53.1.14.el5xen with 4 GB RAM. Running on 50 CPUs simultaneously allowedthis set of simulations to be performed in ~4 days.
1875M.I. Disney et al. / Remote Sensing of Environment 115 (2011) 1866–1881
during a fire may be to expose other, brighter surface materials (soilhere) in some cases, particularly when seen at higher view angles(also seen in Fig. 1). This is a result of the differences between the (3D)structure of the canopy layers (overstory and understory), and willnot be seen in simple models which do not treat the understory andoverstory as separate 3D layers. For the Pretoriuskop case the charsignal dominates, reaching close to 0.8 of the scene fraction at nadir,falling away to around 0.5, the same as for the Skukuza scene despitetheir very different initial grass cover.
3.2. Model comparisons with helicopter data
The helicopter-mounted ASD FSPro measurements were com-pared with simulations from the 3D models. Simulations wereperformed using the same field-of-view (5° foreoptic) as the ASD,every 10 m along 3×50 m transects in each plot, varying the plotgrass cover from 20–40 plants per m-2 and for high and low tree cover.The simulated instrument height was varied randomly within 10 maround a mean height of 120 m for each footprint, corresponding tothe height variation seen in the helicopter measurements. Thisresulted in footprint diameters of 9.5-11.5 m on the surface.Simulations were performed at the mean solar zenith and azimuthangles of themeasured data for each site (described in 2.3.2.3), as wellas ±10° either side of these angles. Simulations were carried out from400-2500 nm in 10 nm intervals. In total 810 ‘helicopter’ simulations
were carried out per site, pre- and post-fire i.e. 3240 simulations intotal.1
Fig. 12 shows the comparison between the pre- and post-firereflectance measurements made over both sites with the equivalent3Dmodelled values, both spectrally and as scatter plots. The error barsin the measurements represent 1σ across all footprints within eachplot. For the model values error bars represent 1σ due to the multiplefootprints simulated across each plot (spatial variability) and thevariation in view and sun angle. The much greater variance in themeasured data compared to the modelled data is mainly due tovarying sky conditions during the measurements. Although everyeffort was made to collect spectra under stable measurementconditions (either clear sky, or completely overcast) this was notalways possible. Variation in the modeled data arises purely from thespatial variation from footprint to footprint.
Thepre-fire results in Fig. 12 (top row) indicate verygoodagreementbetween the modelled and measured reflectance (r2 Skukuza=0.98,RMSE=0.016; r2 Pretoriuskop=0.97, RMSE=0.014), particularly inthe visible and SWIR up to around 1600 nm. The spectral behaviour ofboth sites is similar, generally dominated by brown leaf and soilmaterial, but with a small amount of green vegetation in the
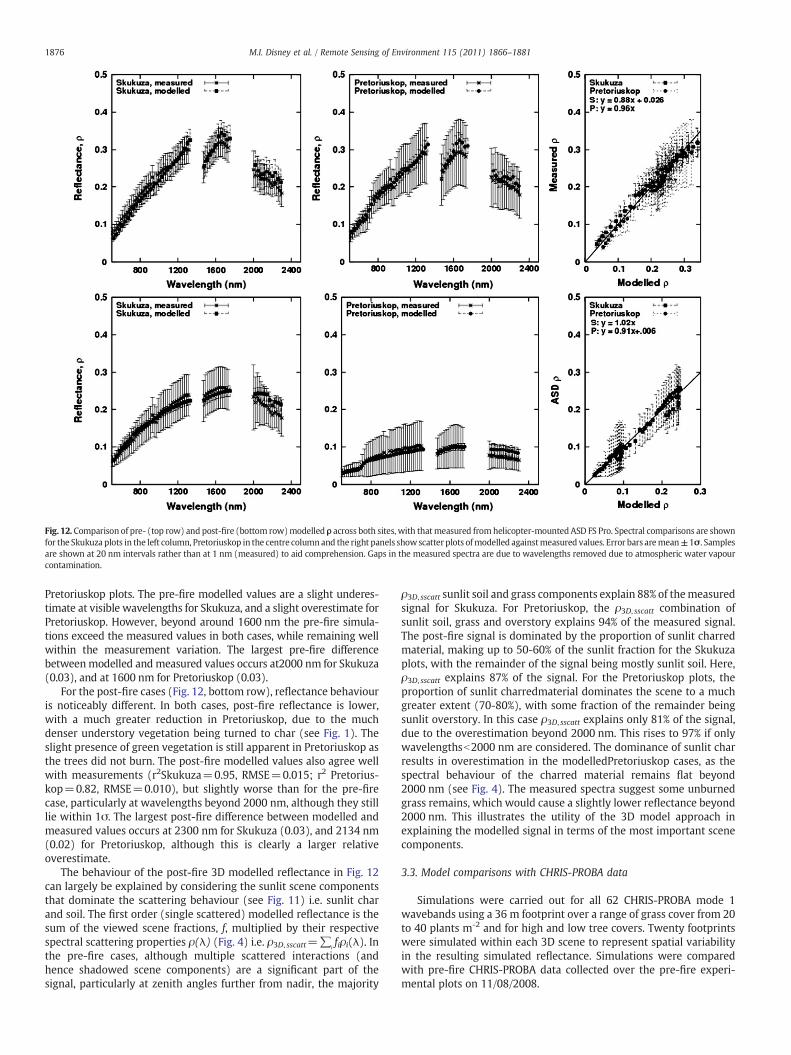
Fig. 12. Comparison of pre- (top row) and post-fire (bottom row)modelled ρ across both sites, with thatmeasured fromhelicopter-mounted ASD FS Pro. Spectral comparisons are shownfor the Skukuza plots in the left column, Pretoriuskop in the centre columnand the right panels showscatter plots ofmodelled againstmeasured values. Error bars aremean±1σ. Samplesare shown at 20 nm intervals rather than at 1 nm (measured) to aid comprehension. Gaps in the measured spectra are due to wavelengths removed due to atmospheric water vapourcontamination.
1876 M.I. Disney et al. / Remote Sensing of Environment 115 (2011) 1866–1881
Pretoriuskop plots. The pre-fire modelled values are a slight underes-timate at visible wavelengths for Skukuza, and a slight overestimate forPretoriuskop. However, beyond around 1600 nm the pre-fire simula-tions exceed the measured values in both cases, while remaining wellwithin the measurement variation. The largest pre-fire differencebetweenmodelled and measured values occurs at2000 nm for Skukuza(0.03), and at 1600 nm for Pretoriuskop (0.03).
For the post-fire cases (Fig. 12, bottom row), reflectance behaviouris noticeably different. In both cases, post-fire reflectance is lower,with a much greater reduction in Pretoriuskop, due to the muchdenser understory vegetation being turned to char (see Fig. 1). Theslight presence of green vegetation is still apparent in Pretoriuskop asthe trees did not burn. The post-fire modelled values also agree wellwith measurements (r2Skukuza=0.95, RMSE=0.015; r2 Pretorius-kop=0.82, RMSE=0.010), but slightly worse than for the pre-firecase, particularly at wavelengths beyond 2000 nm, although they stilllie within 1σ. The largest post-fire difference between modelled andmeasured values occurs at 2300 nm for Skukuza (0.03), and 2134 nm(0.02) for Pretoriuskop, although this is clearly a larger relativeoverestimate.
The behaviour of the post-fire 3D modelled reflectance in Fig. 12can largely be explained by considering the sunlit scene componentsthat dominate the scattering behaviour (see Fig. 11) i.e. sunlit charand soil. The first order (single scattered) modelled reflectance is thesum of the viewed scene fractions, f, multiplied by their respectivespectral scattering properties ρ(λ) (Fig. 4) i.e. ρ3D, sscatt=∑
ifiρi(λ). In
the pre-fire cases, although multiple scattered interactions (andhence shadowed scene components) are a significant part of thesignal, particularly at zenith angles further from nadir, the majority
ρ3D, sscatt sunlit soil and grass components explain 88% of themeasuredsignal for Skukuza. For Pretoriuskop, the ρ3D, sscatt combination ofsunlit soil, grass and overstory explains 94% of the measured signal.The post-fire signal is dominated by the proportion of sunlit charredmaterial, making up to 50-60% of the sunlit fraction for the Skukuzaplots, with the remainder of the signal being mostly sunlit soil. Here,ρ3D, sscatt explains 87% of the signal. For the Pretoriuskop plots, theproportion of sunlit charredmaterial dominates the scene to a muchgreater extent (70-80%), with some fraction of the remainder beingsunlit overstory. In this case ρ3D, sscatt explains only 81% of the signal,due to the overestimation beyond 2000 nm. This rises to 97% if onlywavelengthsb2000 nm are considered. The dominance of sunlit charresults in overestimation in the modelledPretoriuskop cases, as thespectral behaviour of the charred material remains flat beyond2000 nm (see Fig. 4). The measured spectra suggest some unburnedgrass remains, which would cause a slightly lower reflectance beyond2000 nm. This illustrates the utility of the 3D model approach inexplaining the modelled signal in terms of the most important scenecomponents.
3.3. Model comparisons with CHRIS-PROBA data
Simulations were carried out for all 62 CHRIS-PROBA mode 1wavebands using a 36 m footprint over a range of grass cover from 20to 40 plants m-2 and for high and low tree covers. Twenty footprintswere simulated within each 3D scene to represent spatial variabilityin the resulting simulated reflectance. Simulations were comparedwith pre-fire CHRIS-PROBA data collected over the pre-fire experi-mental plots on 11/08/2008.

1877M.I. Disney et al. / Remote Sensing of Environment 115 (2011) 1866–1881
Fig. 13 shows modelled and measured angular reflectance (BRDF)variation for the pre-fire case, over multiple experimental plots.Fig. 14 shows the spectral variation of model simulations andmeasured CHRIS-PROBA reflectance, as well as scatterplots for eachof the three pre-fire CHRIS-PROBA scenes. The spectral agreement isgenerally very good (r2 0.98 in all cases; RMSE=0.025, 0.037 and0.022 for the three angles respectively). The modelled and measuredangular reflectance fits the expectation of a largely shadow-dominated downward bowl-shaped BRDF i.e. decreasing reflectancewith increasing zenith angle away from nadir (Li & Strahler, 1992),albeit weakly-varying. There is a slight over-estimation of the modelvalues at shorter wavelengths (maximum ~0.02 at 505 nm), andslight under-estimation at longer wavelengths (~ −0.09 at 954 nm).
3.4. Model comparisons with MODIS data
Spectral comparisons between 3D model-simulated and pre- andpost-fire MODIS NBAR are shown in Fig. 15. Fig. 16 shows an angularcomparison between the 3D model simulations and the daily MODISreflectance observations. The model simulations were carried out atthe same view and illumination configurations as those in the MODISdata using a pixel size of 500 m, with spatial variability represented byrandomly jittering the simulated footprint across the 3D scenes,providing 20 instances of simulated MODIS reflectance per scene. Forthe MODIS daily reflectance data, observations were binned by zenithangle in 2° steps and simulations performed for all sun angles in eachbin. The resulting 3D model values were a mean across the differentinstances and sun angles.
The spectral comparison of 3D simulations with the MODIS NBARdata illustrated in Fig. 15 shows that modelled and measured valuesgenerally agree well, particularly in the visible part of the spectrum,with r2 values of 0.98 for thepre-fire case (RMSE=0.022, zero biasand offset i.e. model underestimate of 0.016) and 0.95 for the post-firecase (RMSE=0.021, bias of 0.1 and offset of−0.013). For the pre-firecase, the model values are always a slight underestimate, with anabsolute difference of 0.002-0.005 in the visible and beyond 1650 nm,and a difference of 0.04 in the NIR (840 nm). For the post-fire case, themodel values slightly overestimate in the visible by 0.005, underes-timate in the NIR by 0.03 at 1240 nm before becoming a slightoverestimate again of 0.02 at the longest waveband, 2220 nm. Thegenerally close agreement across the spectrum as illustrated by thescatter plots.
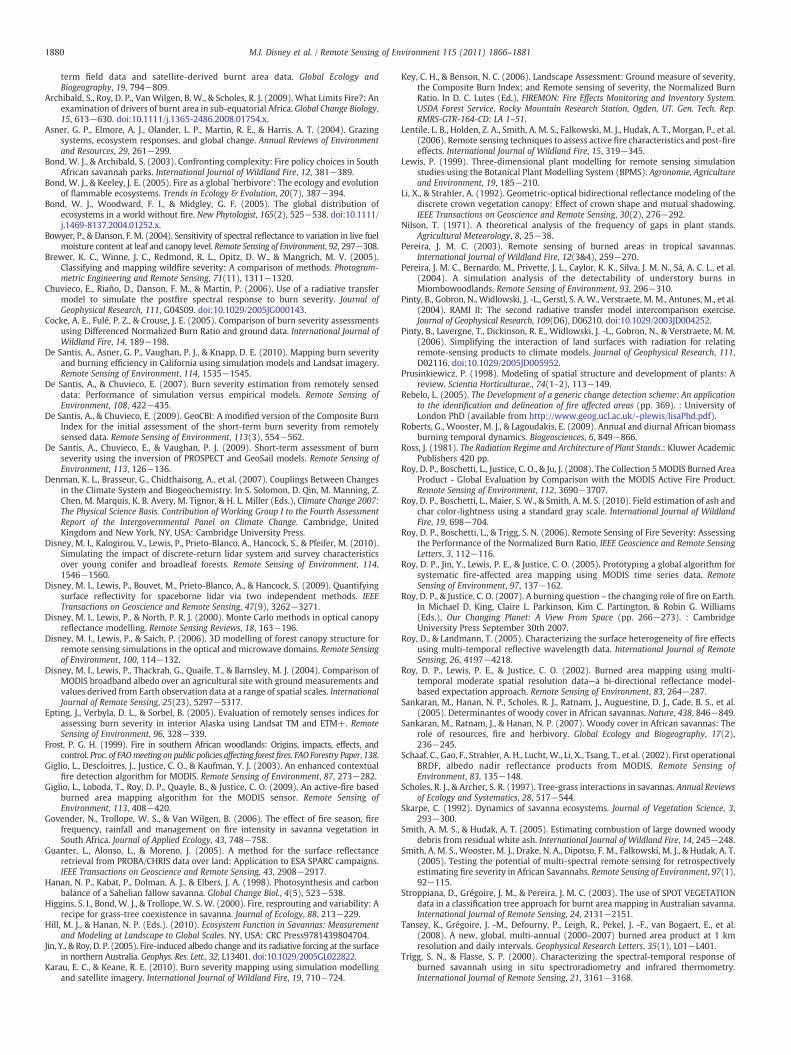
Fig. 16 shows the angular comparison of 3D model-simulatedvalues with MODIS daily reflectance observations as a function ofview angle, pre- and post-fire, for the central pixels of the two
Fig. 13. Comparison of modelled and observed angular reflectance from CHRIS-PROBAon 11/08/2009. Pre-fire cases are shown at 648 nm (visible red) and 849.3 nm (NIR).
separate fires described in 2.3.2.4. The angular signal, such as it is, isquite weak. This is likely to be a result of the relatively small numberof samples and the lack of principle plane sampling. There is a slightincrease of reflectance with view zenith angle in the NIR for the pre-fire case, which is not present post-fire, in addition to the generalreduced brightness in the post-fire case. The 3D model simulationsagree well with the MODIS observations in all cases, with only onetwo cases lying outside the 1σ range (pre-fire red, view zenith 58°;post-fire NIR, view zenith 40°). The observed behaviour is consistentwith a scene dominated by volume scattering (increasing reflectancewith view angle in the NIR due to increased path), unlike the pre-fireCHRIS-PROBA observations. These differences are likely to be due tospatial scale, as the impact of shadowing will tend to decrease withincreasing scale much beyond the size (height, width) of shadowingobjects on the surface, trees in this case.
4. Discussion
The results presented above demonstrate the ability of thedeveloped 3D models to represent the pre- and post-fire signal of atwo-layer savanna system, across a range of understory and overstorycovers. The difficulty of assessing the amount and structural veracityof 3Dmodel cover was overcome by carefully matching the 3Dmodel-derived overstory and understory canopy properties to field mea-surements: canopy LAI and gap fraction in the case of the overstory;simulated BRDF in the case of the understory. These modelcomparisons required making a range of field structural andradiometric measurements across various canopy densities inexperimental fire plots. For the overstory, we used 3D modelsimulations to quantify the bias arising from comparing model-estimated canopy structural parameters derived indirectly from realhemiphotos with those derived directly from the 3D models. This wasdone by simulating hemiphotos, which were then processed in thesame way as real hemiphotos collected in the field. We have usedCanEYE to process hemiphotos here, but the same method could beapplied with any of the hemiphoto processing tools currently in use.
In order to test the radiometric performance of the 3D models, wecompared the model simulated reflectance to range of spectral andangular measurements, including: helicopter-mounted hyperspectraldata at ~10 m scale across the 400–2500 nm range; CHRIS-PROBAmeasurements at ~36 m scale, in 62 wavebands from 415–1007 nm;and MODIS measurements at ~500 m scale in seven bands from490–2220 nm. These measurements encompass the range of remotesensing scales that are typically available. The angular and spectral pre-and post-fire behaviour is consistent between scales i.e. increasingreflectance across the visible and SWIR, with a peak between 1200-1600 nm, followed by reduction at longer wavelengths. The post-firecase follows a very similar pattern,with a loweroverall reflectance andaless pronouncedpeakat slightly longerwavelengths. Although there arekey regions of the spectrum where the burn signal is manifested moststrongly, empirical spectral indices such as NBR/ΔNBRmay be relativelyinsensitive to fires of the type seen here due to the similar spectralcontrast pre- and post-fire in the NIR andMIR regions (Roy et al., 2006).However these properties are difficult tomeasure in practice for reasonsoutlined above, andwe suggest that themodellingmethodswe presentmay help.
It is noticeable that the CHRIS-PROBA sensor with a maximumwavelength at 1007 nm misses the part of the spectrum where thelargest differences between pre- and post-fire signal occurred, bothmeasured and modelled (N1200 nm). This would also be true for othersensors, such as the ESA MERIS instrument that has a longestwavelength of 900 nm. However, the angular signal can help todistinguish pre- and post-fire cases, as has been shown by Roy et al.(2002). The resultswe showhere indicatewhy this is of particular use ina two-layer savanna system, where the 3D canopy structure resulted ina strong angular signal. The 3D model results are (unsurprisingly)
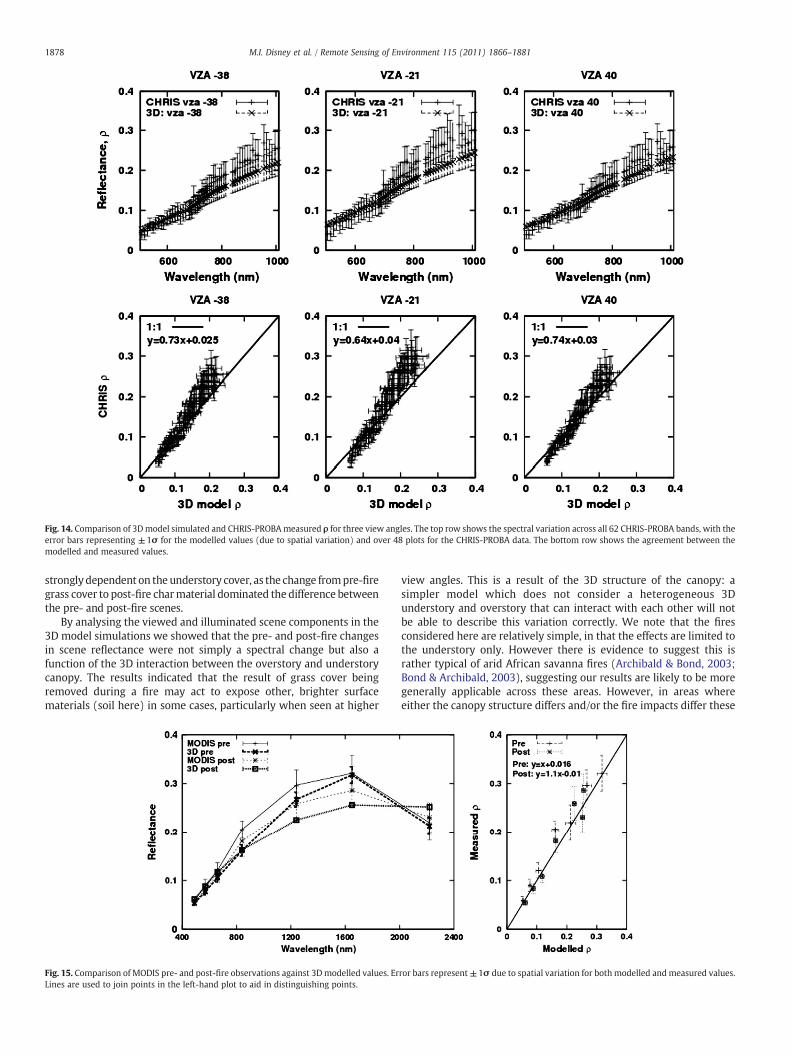
Fig. 14. Comparison of 3Dmodel simulated and CHRIS-PROBAmeasured ρ for three view angles. The top row shows the spectral variation across all 62 CHRIS-PROBA bands, with theerror bars representing ±1σ for the modelled values (due to spatial variation) and over 48 plots for the CHRIS-PROBA data. The bottom row shows the agreement between themodelled and measured values.
1878 M.I. Disney et al. / Remote Sensing of Environment 115 (2011) 1866–1881
stronglydependent on the understory cover, as the change frompre-firegrass cover to post-fire charmaterial dominated the difference betweenthe pre- and post-fire scenes.
By analysing the viewed and illuminated scene components in the3D model simulations we showed that the pre- and post-fire changesin scene reflectance were not simply a spectral change but also afunction of the 3D interaction between the overstory and understorycanopy. The results indicated that the result of grass cover beingremoved during a fire may act to expose other, brighter surfacematerials (soil here) in some cases, particularly when seen at higher
Fig. 15. Comparison of MODIS pre- and post-fire observations against 3Dmodelled values. ErLines are used to join points in the left-hand plot to aid in distinguishing points.
view angles. This is a result of the 3D structure of the canopy: asimpler model which does not consider a heterogeneous 3Dunderstory and overstory that can interact with each other will notbe able to describe this variation correctly. We note that the firesconsidered here are relatively simple, in that the effects are limited tothe understory only. However there is evidence to suggest this israther typical of arid African savanna fires (Archibald & Bond, 2003;Bond & Archibald, 2003), suggesting our results are likely to be moregenerally applicable across these areas. However, in areas whereeither the canopy structure differs and/or the fire impacts differ these
ror bars represent±1σ due to spatial variation for both modelled andmeasured values.
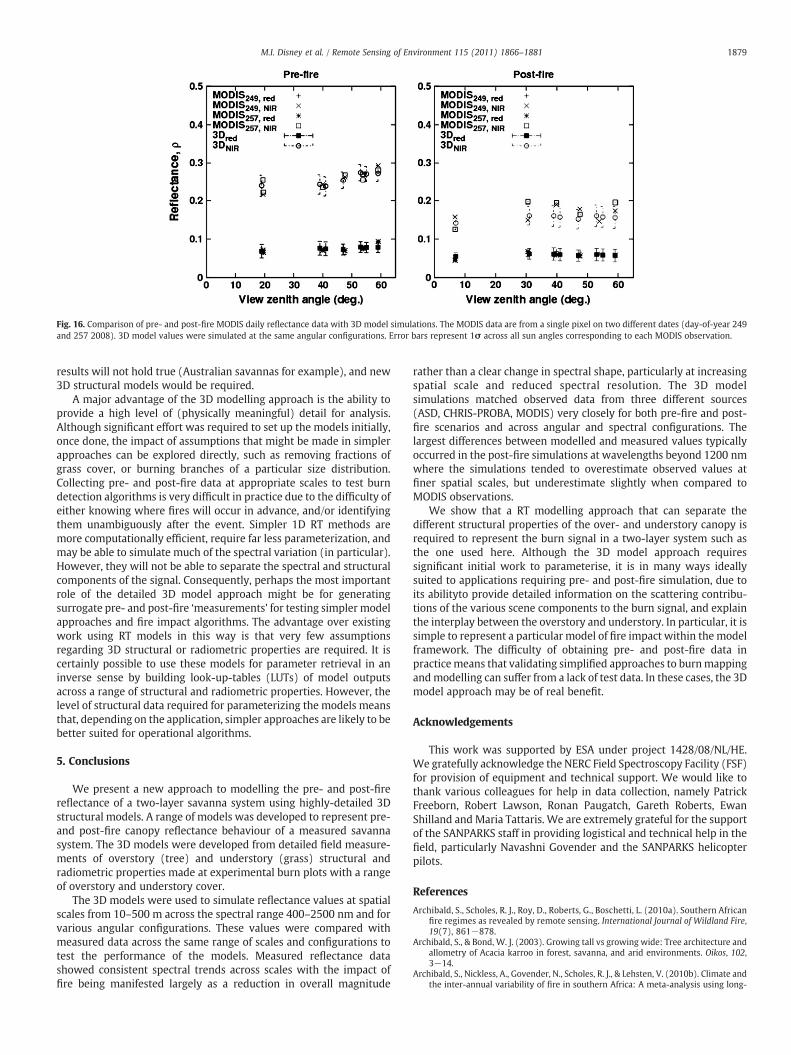
Fig. 16. Comparison of pre- and post-fire MODIS daily reflectance data with 3D model simulations. The MODIS data are from a single pixel on two different dates (day-of-year 249and 257 2008). 3D model values were simulated at the same angular configurations. Error bars represent 1σ across all sun angles corresponding to each MODIS observation.
1879M.I. Disney et al. / Remote Sensing of Environment 115 (2011) 1866–1881
results will not hold true (Australian savannas for example), and new3D structural models would be required.
A major advantage of the 3D modelling approach is the ability toprovide a high level of (physically meaningful) detail for analysis.Although significant effort was required to set up the models initially,once done, the impact of assumptions that might be made in simplerapproaches can be explored directly, such as removing fractions ofgrass cover, or burning branches of a particular size distribution.Collecting pre- and post-fire data at appropriate scales to test burndetection algorithms is very difficult in practice due to the difficulty ofeither knowing where fires will occur in advance, and/or identifyingthem unambiguously after the event. Simpler 1D RT methods aremore computationally efficient, require far less parameterization, andmay be able to simulate much of the spectral variation (in particular).However, they will not be able to separate the spectral and structuralcomponents of the signal. Consequently, perhaps the most importantrole of the detailed 3D model approach might be for generatingsurrogate pre- and post-fire ‘measurements' for testing simpler modelapproaches and fire impact algorithms. The advantage over existingwork using RT models in this way is that very few assumptionsregarding 3D structural or radiometric properties are required. It iscertainly possible to use these models for parameter retrieval in aninverse sense by building look-up-tables (LUTs) of model outputsacross a range of structural and radiometric properties. However, thelevel of structural data required for parameterizing the models meansthat, depending on the application, simpler approaches are likely to bebetter suited for operational algorithms.
5. Conclusions
We present a new approach to modelling the pre- and post-firereflectance of a two-layer savanna system using highly-detailed 3Dstructural models. A range of models was developed to represent pre-and post-fire canopy reflectance behaviour of a measured savannasystem. The 3D models were developed from detailed field measure-ments of overstory (tree) and understory (grass) structural andradiometric properties made at experimental burn plots with a rangeof overstory and understory cover.
The 3D models were used to simulate reflectance values at spatialscales from 10–500 m across the spectral range 400–2500 nm and forvarious angular configurations. These values were compared withmeasured data across the same range of scales and configurations totest the performance of the models. Measured reflectance datashowed consistent spectral trends across scales with the impact offire being manifested largely as a reduction in overall magnitude
rather than a clear change in spectral shape, particularly at increasingspatial scale and reduced spectral resolution. The 3D modelsimulations matched observed data from three different sources(ASD, CHRIS-PROBA, MODIS) very closely for both pre-fire and post-fire scenarios and across angular and spectral configurations. Thelargest differences between modelled and measured values typicallyoccurred in the post-fire simulations at wavelengths beyond 1200 nmwhere the simulations tended to overestimate observed values atfiner spatial scales, but underestimate slightly when compared toMODIS observations.
We show that a RT modelling approach that can separate thedifferent structural properties of the over- and understory canopy isrequired to represent the burn signal in a two-layer system such asthe one used here. Although the 3D model approach requiressignificant initial work to parameterise, it is in many ways ideallysuited to applications requiring pre- and post-fire simulation, due toits abilityto provide detailed information on the scattering contribu-tions of the various scene components to the burn signal, and explainthe interplay between the overstory and understory. In particular, it issimple to represent a particular model of fire impact within the modelframework. The difficulty of obtaining pre- and post-fire data inpracticemeans that validating simplified approaches to burnmappingandmodelling can suffer from a lack of test data. In these cases, the 3Dmodel approach may be of real benefit.
Acknowledgements
This work was supported by ESA under project 1428/08/NL/HE.We gratefully acknowledge the NERC Field Spectroscopy Facility (FSF)for provision of equipment and technical support. We would like tothank various colleagues for help in data collection, namely PatrickFreeborn, Robert Lawson, Ronan Paugatch, Gareth Roberts, EwanShilland and Maria Tattaris. We are extremely grateful for the supportof the SANPARKS staff in providing logistical and technical help in thefield, particularly Navashni Govender and the SANPARKS helicopterpilots.
References
Archibald, S., Scholes, R. J., Roy, D., Roberts, G., Boschetti, L. (2010a). Southern Africanfire regimes as revealed by remote sensing. International Journal of Wildland Fire,19(7), 861−878.
Archibald, S., & Bond, W. J. (2003). Growing tall vs growing wide: Tree architecture andallometry of Acacia karroo in forest, savanna, and arid environments. Oikos, 102,3−14.
Archibald, S., Nickless, A., Govender, N., Scholes, R. J., & Lehsten, V. (2010b). Climate andthe inter-annual variability of fire in southern Africa: A meta-analysis using long-
1880 M.I. Disney et al. / Remote Sensing of Environment 115 (2011) 1866–1881
term field data and satellite-derived burnt area data. Global Ecology andBiogeography, 19, 794−809.
Archibald, S., Roy, D. P., Van Wilgen, B. W., & Scholes, R. J. (2009). What Limits Fire?: Anexamination of drivers of burnt area in sub-equatorial Africa. Global Change Biology,15, 613−630. doi:10.1111/j.1365-2486.2008.01754.x.
Asner, G. P., Elmore, A. J., Olander, L. P., Martin, R. E., & Harris, A. T. (2004). Grazingsystems, ecosystem responses, and global change. Annual Reviews of Environmentand Resources, 29, 261−299.
Bond, W. J., & Archibald, S. (2003). Confronting complexity: Fire policy choices in SouthAfrican savannah parks. International Journal of Wildland Fire, 12, 381−389.
Bond, W. J., & Keeley, J. E. (2005). Fire as a global `herbivore': The ecology and evolutionof flammable ecosystems. Trends in Ecology & Evolution, 20(7), 387−394.
Bond, W. J., Woodward, F. I., & Midgley, G. F. (2005). The global distribution ofecosystems in a world without fire. New Phytologist, 165(2), 525−538. doi:10.1111/j.1469-8137.2004.01252.x.
Bowyer, P., & Danson, F. M. (2004). Sensitivity of spectral reflectance to variation in live fuelmoisture content at leaf and canopy level. Remote Sensing of Environment, 92, 297−308.
Brewer, K. C., Winne, J. C., Redmond, R. L., Opitz, D. W., & Mangrich, M. V. (2005).Classifying and mapping wildfire severity: A comparison of methods. Photogram-metric Engineering and Remote Sensing, 71(11), 1311−1320.
Chuvieco, E., Riaño, D., Danson, F. M., & Martin, P. (2006). Use of a radiative transfermodel to simulate the postfire spectral response to burn severity. Journal ofGeophysical Research, 111, G04S09. doi:10.1029/2005JG000143.
Cocke, A. E., Fulé, P. Z., & Crouse, J. E. (2005). Comparison of burn severity assessmentsusing Differenced Normalized Burn Ratio and ground data. International Journal ofWildland Fire, 14, 189−198.
De Santis, A., Asner, G. P., Vaughan, P. J., & Knapp, D. E. (2010). Mapping burn severityand burning efficiency in California using simulation models and Landsat imagery.Remote Sensing of Environment, 114, 1535−1545.
De Santis, A., & Chuvieco, E. (2007). Burn severity estimation from remotely senseddata: Performance of simulation versus empirical models. Remote Sensing ofEnvironment, 108, 422−435.
De Santis, A., & Chuvieco, E. (2009). GeoCBI: A modified version of the Composite BurnIndex for the initial assessment of the short-term burn severity from remotelysensed data. Remote Sensing of Environment, 113(3), 554−562.
De Santis, A., Chuvieco, E., & Vaughan, P. J. (2009). Short-term assessment of burnseverity using the inversion of PROSPECT and GeoSail models. Remote Sensing ofEnvironment, 113, 126−136.
Denman, K. L., Brasseur, G., Chidthaisong, A., et al. (2007). Couplings Between Changesin the Climate System and Biogeochemistry. In S. Solomon, D. Qin, M. Manning, Z.Chen, M. Marquis, K. B. Avery, M. Tignor, & H. L. Miller (Eds.), Climate Change 2007:The Physical Science Basis. Contribution of Working Group I to the Fourth AssessmentReport of the Intergovernmental Panel on Climate Change. Cambridge, UnitedKingdom and New York, NY, USA: Cambridge University Press.
Disney, M. I., Kalogirou, V., Lewis, P., Prieto-Blanco, A., Hancock, S., & Pfeifer, M. (2010).Simulating the impact of discrete-return lidar system and survey characteristicsover young conifer and broadleaf forests. Remote Sensing of Environment, 114,1546−1560.
Disney, M. I., Lewis, P., Bouvet, M., Prieto-Blanco, A., & Hancock, S. (2009). Quantifyingsurface reflectivity for spaceborne lidar via two independent methods. IEEETransactions on Geoscience and Remote Sensing, 47(9), 3262−3271.
Disney, M. I., Lewis, P., & North, P. R. J. (2000). Monte Carlo methods in optical canopyreflectance modelling. Remote Sensing Reviews, 18, 163−196.
Disney, M. I., Lewis, P., & Saich, P. (2006). 3D modelling of forest canopy structure forremote sensing simulations in the optical and microwave domains. Remote Sensingof Environment, 100, 114−132.
Disney, M. I., Lewis, P., Thackrah, G., Quaife, T., & Barnsley, M. J. (2004). Comparison ofMODIS broadband albedo over an agricultural site with ground measurements andvalues derived from Earth observation data at a range of spatial scales. InternationalJournal of Remote Sensing, 25(23), 5297−5317.
Epting, J., Verbyla, D. L., & Sorbel, B. (2005). Evaluation of remotely senses indices forassessing burn severity in interior Alaska using Landsat TM and ETM+. RemoteSensing of Environment, 96, 328−339.
Frost, P. G. H. (1999). Fire in southern African woodlands: Origins, impacts, effects, andcontrol. Proc. of FAOmeeting on public policies affecting forest fires. FAO Forestry Paper, 138.
Giglio, L., Descloitres, J., Justice, C. O., & Kaufman, Y. J. (2003). An enhanced contextualfire detection algorithm for MODIS. Remote Sensing of Environment, 87, 273−282.
Giglio, L., Loboda, T., Roy, D. P., Quayle, B., & Justice, C. O. (2009). An active-fire basedburned area mapping algorithm for the MODIS sensor. Remote Sensing ofEnvironment, 113, 408−420.
Govender, N., Trollope, W. S., & Van Wilgen, B. (2006). The effect of fire season, firefrequency, rainfall and management on fire intensity in savanna vegetation inSouth Africa. Journal of Applied Ecology, 43, 748−758.
Guanter, L., Alonso, L., & Moreno, J. (2005). A method for the surface reflectanceretrieval from PROBA/CHRIS data over land: Application to ESA SPARC campaigns.IEEE Transactions on Geoscience and Remote Sensing, 43, 2908−2917.
Hanan, N. P., Kabat, P., Dolman, A. J., & Elbers, J. A. (1998). Photosynthesis and carbonbalance of a Sahelian fallow savanna. Global Change Biol., 4(5), 523−538.
Higgins, S. I., Bond, W. J., & Trollope, W. S. W. (2000). Fire, resprouting and variability: Arecipe for grass-tree coexistence in savanna. Journal of Ecology, 88, 213−229.
Hill, M. J., & Hanan, N. P. (Eds.). (2010). Ecosystem Function in Savannas: Measurementand Modeling at Landscape to Global Scales. NY, USA: CRC Press9781439804704.
Jin, Y., & Roy, D. P. (2005). Fire-induced albedo change and its radiative forcing at the surfacein northern Australia. Geophys. Res. Lett., 32, L13401. doi:10.1029/2005GL022822.
Karau, E. C., & Keane, R. E. (2010). Burn severity mapping using simulation modellingand satellite imagery. International Journal of Wildland Fire, 19, 710−724.
Key, C. H., & Benson, N. C. (2006). Landscape Assessment: Ground measure of severity,the Composite Burn Index; and Remote sensing of severity, the Normalized BurnRatio. In D. C. Lutes (Ed.), FIREMON: Fire Effects Monitoring and Inventory System.USDA Forest Service, Rocky Mountain Research Station, Ogden, UT. Gen. Tech. Rep.RMRS-GTR-164-CD: LA 1–51.
Lentile, L. B., Holden, Z. A., Smith, A. M. S., Falkowski, M. J., Hudak, A. T., Morgan, P., et al.(2006). Remote sensing techniques to assess active fire characteristics and post-fireeffects. International Journal of Wildland Fire, 15, 319−345.
Lewis, P. (1999). Three-dimensional plant modelling for remote sensing simulationstudies using the Botanical Plant Modelling System (BPMS). Agronomie, Agricultureand Environment, 19, 185−210.
Li, X., & Strahler, A. (1992). Geometric-optical bidirectional reflectance modeling of thediscrete crown vegetation canopy: Effect of crown shape and mutual shadowing.IEEE Transactions on Geoscience and Remote Sensing, 30(2), 276−292.
Nilson, T. (1971). A theoretical analysis of the frequency of gaps in plant stands.Agricultural Meteorology, 8, 25−38.
Pereira, J. M. C. (2003). Remote sensing of burned areas in tropical savannas.International Journal of Wildland Fire, 12(3&4), 259−270.
Pereira, J. M. C., Bernardo, M., Privette, J. L., Caylor, K. K., Silva, J. M. N., Sá, A. C. L., et al.(2004). A simulation analysis of the detectability of understory burns inMiombowoodlands. Remote Sensing of Environment, 93, 296−310.
Pinty, B., Gobron, N., Widlowski, J. -L., Gerstl, S. A. W., Verstraete, M. M., Antunes, M., et al.(2004). RAMI II: The second radiative transfer model intercomparison exercise.Journal of Geophysical Research, 109(D6), D06210. doi:10.1029/2003JD004252.
Pinty, B., Lavergne, T., Dickinson, R. E., Widlowski, J. -L., Gobron, N., & Verstraete, M. M.(2006). Simplifying the interaction of land surfaces with radiation for relatingremote-sensing products to climate models. Journal of Geophysical Research, 111,D02116. doi:10.1029/2005JD005952.
Prusinkiewicz, P. (1998). Modeling of spatial structure and development of plants: Areview. Scientia Horticulturae., 74(1–2), 113−149.
Rebelo, L. (2005). The Development of a generic change detection scheme: An applicationto the identification and delineation of fire affected areas (pp. 369). : University ofLondon PhD (available from http://www.geog.ucl.ac.uk/~plewis/lisaPhd.pdf).
Roberts, G., Wooster, M. J., & Lagoudakis, E. (2009). Annual and diurnal African biomassburning temporal dynamics. Biogeosciences, 6, 849−866.
Ross, J. (1981). The Radiation Regime and Architecture of Plant Stands.: Kluwer AcademicPublishers 420 pp.
Roy, D. P., Boschetti, L., Justice, C. O., & Ju, J. (2008). The Collection 5MODIS Burned AreaProduct - Global Evaluation by Comparison with the MODIS Active Fire Product.Remote Sensing of Environment, 112, 3690−3707.
Roy, D. P., Boschetti, L., Maier, S. W., & Smith, A. M. S. (2010). Field estimation of ash andchar color-lightness using a standard gray scale. International Journal of WildlandFire, 19, 698−704.
Roy, D. P., Boschetti, L., & Trigg, S. N. (2006). Remote Sensing of Fire Severity: Assessingthe Performance of the Normalized Burn Ratio. IEEE Geoscience and Remote SensingLetters, 3, 112−116.
Roy, D. P., Jin, Y., Lewis, P. E., & Justice, C. O. (2005). Prototyping a global algorithm forsystematic fire-affected area mapping using MODIS time series data. RemoteSensing of Environment, 97, 137−162.
Roy, D. P., & Justice, C. O. (2007). A burning question – the changing role of fire on Earth.In Michael D. King, Claire L. Parkinson, Kim C. Partington, & Robin G. Williams(Eds.), Our Changing Planet: A View From Space (pp. 266−273). : CambridgeUniversity Press September 30th 2007.
Roy, D., & Landmann, T. (2005). Characterizing the surface heterogeneity of fire effectsusing multi-temporal reflective wavelength data. International Journal of RemoteSensing, 26, 4197−4218.
Roy, D. P., Lewis, P. E., & Justice, C. O. (2002). Burned area mapping using multi-temporal moderate spatial resolution data—a bi-directional reflectance model-based expectation approach. Remote Sensing of Environment, 83, 264−287.
Sankaran, M., Hanan, N. P., Scholes, R. J., Ratnam, J., Auguestine, D. J., Cade, B. S., et al.(2005). Determinantes of woody cover in African savannas. Nature, 438, 846−849.
Sankaran, M., Ratnam, J., & Hanan, N. P. (2007). Woody cover in African savannas: Therole of resources, fire and herbivory. Global Ecology and Biogeography, 17(2),236−245.
Schaaf, C., Gao, F., Strahler, A. H., Lucht, W., Li, X., Tsang, T., et al. (2002). First operationalBRDF, albedo nadir reflectance products from MODIS. Remote Sensing ofEnvironment, 83, 135−148.
Scholes, R. J., & Archer, S. R. (1997). Tree-grass interactions in savannas. Annual Reviewsof Ecology and Systematics, 28, 517−544.
Skarpe, C. (1992). Dynamics of savanna ecosystems. Journal of Vegetation Science, 3,293−300.
Smith, A. M. S., & Hudak, A. T. (2005). Estimating combustion of large downed woodydebris from residual white ash. International Journal of Wildland Fire, 14, 245−248.
Smith, A. M. S., Wooster, M. J., Drake, N. A., Dipotso, F. M., Falkowski, M. J., & Hudak, A. T.(2005). Testing the potential of multi-spectral remote sensing for retrospectivelyestimating fire severity in African Savannahs. Remote Sensing of Environment, 97(1),92−115.
Stroppiana, D., Grégoire, J. M., & Pereira, J. M. C. (2003). The use of SPOT VEGETATIONdata in a classification tree approach for burnt area mapping in Australian savanna.International Journal of Remote Sensing, 24, 2131−2151.
Tansey, K., Grégoire, J. -M., Defourny, P., Leigh, R., Pekel, J. -F., van Bogaert, E., et al.(2008). A new, global, multi-annual (2000–2007) burned area product at 1 kmresolution and daily intervals. Geophysical Research Letters, 35(1), L01−L401.
Trigg, S. N., & Flasse, S. P. (2000). Characterizing the spectral-temporal response ofburned savannah using in situ spectroradiometry and infrared thermometry.International Journal of Remote Sensing, 21, 3161−3168.
1881M.I. Disney et al. / Remote Sensing of Environment 115 (2011) 1866–1881
Trigg, S. N., & Flasse, S. P. (2001). An evaluation of different bi-spectral spaces fordiscriminating burned shrub-savannah. International Journal of Remote Sensing, 13,2641−2647.
Trigg, S. N., Roy, D. P., & Flasse, S. P. (2005). An in situ study of the effects of surfaceanisotropy on the remote sensing of burned savannah. International Journal of RemoteSensing, 26, 4869−4876.
Van der Werf, G. R., Randerson, J. T., Collatz, G. J., & Giglio, L. (2003). Carbon emissionsfrom tropical and subtropical ecosystems. Global Change Biology, 9, 547−562.
Van derWerf, G. R., Randerson, J. T., Collatz, G. J., Giglio, L., Kasibhatla, P. S., et al. (2004).Continental-scale partitioning of fire emissions during the 1997 to 2001 El Niño/LaNiña period. Science, 303(5654), 73−76.
Van der Werf, G. R., Randerson, J. T., Giglio, L., Collatz, G. J., Mu, M., Kasibhatla, et al. (2010).Global fire emissions and the contribution of deforestation, savanna, forest, agricultural,and peat fires (1997–2009). Atmospheric Chemistry and Physics Discussions, 10,16153−16230.
Van Wagtendonk, J. W., Root, R. R., & Key, C. H. (2004). Comparison of AVIRIS andLandsat ETM+detection capabilities for burn severity. Remote Sensing ofEnvironment, 92, 397−408.
van Wilgen, B. W., Biggs, H. C., O'Regan, S., & Mare, N. (2000). A fire history of thesavanna ecosystems in the Kruger National Park, South Africa between 1941 and1996. South African Journal of Science, 96, 167−178.
van Wilgen, Govender, N., Biggs, H. C., Ntsala, D., & Funda, X. N. (2004). Response ofsavanna fire regimes to changing fire-management policies in a large Africannational park. Conservation Biology, 18, 1533−1540.
Wanner, W., Li, X., & Strahler, A. H. (1995). On the derivation of kernels for kernel-drivenmodels of bidirectional reflectance. Journ. Geophys. Res., 100(D10), 21,077−21,089.doi:10.1029/95JD02371.
Warren-Wilson, J. (1959). Analysis of the spatial distribution of foliage by two-dimensionalpoint quadrats. New Phytologist, 58, 92−101.
Widlowski, J. -L., Robustelli,M., Disney,M. I., Gastellu-Etchegorry, J. -P., Lavergne, T., Lewis, P.,et al. (2008). The RAMI On-line model checker (ROMC): A web-based benchmarkingfacility for canopy reflectancemodels. Remote Sensing of Environment, 112, 1144−1150.
Widlowski, J. -L., Taberner, M., Pinty, B., Bruniquel-Pinel, D., Disney, M. I., Fernandes, R.,et al. (2007). The third RAdiation transfer Model Intercomparison (RAMI) exercise:Documenting progress in canopy reflectance models. Journal of Geophys. Research(Atmospheres), 112, D09111. doi:10.1029/2006JD007821.
Yates, C. P., Edwards, A. C., & Russell-Smith, J. (2008). Big fires and their ecologicalimpacts in Australian savannas: Size and frequency matters. International Journal ofWildland Fire, 17, 768−781.
Internet
www1: http://www.chris-proba.org.uk/mission/bandsets2.htmlwww2: http://www.brockmann-consult.de/cms/web/beam/welcomewww3: http://www.geog.ucl.ac.uk/~mdisney/3Dmovies