3d printed radar lenses with anti-reflective structures
TRANSCRIPT

designs
Article
3D Printed Radar Lenses withAnti-Reflective Structures
Ross J. Friel * , Maria Gerling-Gerdin, Emil Nilsson and Björn P. Andreasson *
School of Information Technology, Halmstad University, PO Box 823, 301 18 Halmstad, Sweden;[email protected] (M.G.-G.); [email protected] (E.N.)* Correspondence: [email protected] (R.J.F.); [email protected] (B.P.A.)
Received: 1 May 2019; Accepted: 5 June 2019; Published: 11 June 2019�����������������
Abstract: Background: The purpose of this study was to determine if 3D printed lenses withwavelength specific anti-reflective (AR) surface structures would improve beam intensity and thusradar efficiency for a Printed Circuit Board (PCB)-based 60 GHz radar. This would have potential forimproved low-cost radar lenses for the consumer product market. Methods: A hyperbolic lens wasdesigned in 3D Computer Aided Design (CAD) software and was then modified with a wavelengthspecified AR structure. Electromagnetic computer simulation was performed on both the ‘smooth’and ‘AR structure’ lenses and compared to actual 60 GHz radar measurements of 3D printed polylacticacid (PLA) lenses. Results: The simulation results showed an increase of 10% in signal intensity ofthe AR structure lens over the smooth lens. Actual measurement showed an 8% increase in signalof the AR structure lens over the smooth lens. Conclusions: Low cost and readily available FusedFilament Fabrication (FFF) 3D printing has been shown to be capable of printing an AR structurecoated hyperbolic lens for millimeter wavelength radar applications. These 3D Printed AR structurelenses are effective in improving radar measurements over non-AR structure lenses.
Keywords: radar; 3D printing; lenses; anti-reflective coatings; millimeter wave radar; simulation;additive manufacturing; quasi-optics
1. Introduction
The research, development and application of radar with respect to the consumer market hasgreatly expanded over the last 10 years [1]. This is a step change from radar traditionally being acostly technology area best suited to military, aerospace, nautical and scientific measurement areas tonow being applied, more and more, to autonomous vehicles [2], smart cities [3] and personal healthmonitoring devices [4]. Radar is now a key technology for these areas, and the maximization of signalstrength is paramount to the correct and optimal operation of devices, with sub-optimal operationpotentially resulting in incorrect measurement, mis-information and safety failures.
Through the application of quasi-optical techniques, lenses can be designed and utilized tomaximize the signal intensity by focusing an incident wave onto the radar antenna area [5,6]. Due tothe diverse setups, frequencies, geometries and subsequent focal point changes encountered in theconsumer market, a new bespoke lens manufactured with a specific curve, radius and thickness istypically needed for each new product or situation. Traditional techniques for this lens manufactureare often expensive due to the bespoke nature of the design, its complex geometry and a lack ofoff-the-shelf components. This expense is acceptable for some areas; however, in the consumer marketthis can make the device prohibitively expensive.
3D printing (also known as Additive Manufacturing (AM)) is a range of manufacturing technologiesthat are directly driven by digital design information without the need for additional tooling orfixturing [7]. The technologies build components layer by layer using different techniques and materials
Designs 2019, 3, 28; doi:10.3390/designs3020028 www.mdpi.com/journal/designs

Designs 2019, 3, 28 2 of 11
to create the final 3D components. The most common low-cost 3D printing technique is Fused FilamentFabrication (FFF) in which a thermoplastic filament material is heated and extruded through a nozzlethat selectively deposits material for the specific geometry desired. This allows for complex, bespokegeometries to be readily produced out of materials suitable for millimeter wavelengths, and previousworks have exploited this for the production of radar lenses [8–14].
These previous studies have shown success; however, as optimal signal qualities are desired,further improvements are sought. A method of improvement for signal transmission through lenses isvia the use of anti-reflective (AR) coatings. An AR coating causes destructive interference in reflectedwaves and constructive interference in waves entering the lens. This AR coating can either be throughthe application of a thin layer or graded structure with a different refractive index material or, as oftenfound in nature, through the use of wavelength defined physical surface structures [15]. Previouswork has used 3D printed components with varied fill volumes to edit the refractive index of thestructure [16]; less fill density increases the contained volume of air, shifting the refractive index of thematerial closer to or further away from 1 (up to the refractive index of the building material at 100%fill density). Similar work has utilized internal geometry variation as a means of achieving gradedpermittivity to reduce reflection [17]. Lens surface structural elements to reduce lens reflectivity havebeen shown to increase the signal level for THz and millimeter wave applications [10,18]. Finally,the use of chirped structures to achieve focusing for dielectric waveguides produced via 3D Printinghas also been successfully demonstrated [19].
The main aim of this work was to utilize 3D printing to create a bespoke radar lens with awavelength specific AR surface structure to increase the signal intensity received by a consumer60 GHz radar emitter and receiver device. This work successfully showed that an 8% increase in signalintensity was attained through the application of the AR structure to the lens surface.
2. Materials and Methods
2.1. Lens Design and Fabrication
The lens in this work was for the future application to the monitoring of vital signs using 60 GHzradar [12] with specific design requirements for a 50 mm diameter 10 λ lens. The material chosen forthe 3D printing of the lenses was polylactic acid (PLA), that was shown in a previous investigation tohave a relative permittivity (εr) of 2.74 at 60 GHz and thus a refractive index of 1.655 (n) at 60 GHz [13].In addition to being suitable for comparison with a previous study by the authors, the choice of materialwas purposefully restricted to PLA from the same manufacturing batch number to remove any signalchanges that may have been associated with a change in material as opposed to the AR structures. Thereis likely a significant effect on the signal and focus characteristics of the lens based on the material usedand this will be investigated in further work currently being performed by the authors. A change inthe refractive index of the material (such as would occur by changing to an alternative polymer) wouldrequire a change in the lens geometry if a meaningful comparison was to be performed. The designedlens was created using the hyperbolic lens equation shown below (Equation (1)) [20]:
t(r) =f
n + 1
√
1 +n + 1n− 1
×
(rf
)2
− 1
(1)
where t(r) is the thickness referenced from the lens apex, dependent on the radius r (−0.025–0.025 m),n = 1.655 and f is the focal length (0.050 m). This expression was used with SolidWorks 2017 3DComputer Aided Design (CAD) software to create a sketch curve from x = 0 to x = 25 mm which wasthen fully revolved around x = 0 to create the 50 mm diameter 3D lens model shown in Figure 1.

Designs 2019, 3, 28 3 of 11
Designs 2019, 3, x FOR PEER REVIEW 3 of 12
Figure 1. 3D model of the smooth lens used in this study.
AR structures can be produced in different geometries [21] and for this work a method of using wavelength matched cuboidal ridges, a standard AR method from optical design, was utilized as a first approach and benchmark for the work. To investigate if anti-reflective structures could successfully be produced by FFF that were suitable for 60 GHz frequency (i.e., λ = 5.00 mm), suitable height flat faced cuboid structures were modelled on the lens surface. The height of the structures was determined by the following equation (2): ℎ = 𝜆4 × √𝑛 (2)
Where h is the wall height of the structure and n is the refractive index (1.655). The structures
were then added to the surface of the lens ensuring the underlying lens geometry was not changed. This gave an AR structure height of 0.97 mm. Through iterative experimentation utilizing the FFF equipment (detailed later in this section), it was found that a gap of 0.4 mm between adjacent AR structures was repeatable whilst maintaining the gap along the full structure length. It was also determined that an AR structure width of 0.8mm was sufficient to prevent structural failure during manufacture. The final designed structures that were successfully able to be 3D printed are shown in Figure 2.
Figure 1. 3D model of the smooth lens used in this study.
AR structures can be produced in different geometries [21] and for this work a method of usingwavelength matched cuboidal ridges, a standard AR method from optical design, was utilized as a firstapproach and benchmark for the work. To investigate if anti-reflective structures could successfully beproduced by FFF that were suitable for 60 GHz frequency (i.e., λ = 5.00 mm), suitable height flat facedcuboid structures were modelled on the lens surface. The height of the structures was determined bythe following Equation (2):
h =λ
4×√
n(2)
where h is the wall height of the structure and n is the refractive index (1.655). The structures were thenadded to the surface of the lens ensuring the underlying lens geometry was not changed. This gavean AR structure height of 0.97 mm. Through iterative experimentation utilizing the FFF equipment(detailed later in this section), it was found that a gap of 0.4 mm between adjacent AR structures wasrepeatable whilst maintaining the gap along the full structure length. It was also determined that anAR structure width of 0.8 mm was sufficient to prevent structural failure during manufacture. The finaldesigned structures that were successfully able to be 3D printed are shown in Figure 2.
The FFF 3D printing equipment chosen for creating the lenses was a Flashforge Guider II(FlashForge Corporation, Zhejiang, China). This equipment and PLA building material were chosenfirstly as a way of building upon previous research by the authors [12,13], and secondly as a choicethat represents commonly available FFF 3D printing equipment and material. Suitable processingparameters were identified through the prior experiences of the team and through path findingexperimental work; approx. 50 lenses both with and without AR coatings were manufactured to assessthe AR structure dimensions and print settings that were optimal for this study. The determinedoptimal settings were:
• A raft was enabled to prevent curvature of the lens’s flat face during production.• To ensure accuracy, ‘high print accuracy’ settings were used: a 0.12 mm layer height (0.20 mm for
first layer) a print speed of 50 mm/s and a travel speed of 70 mm/s.• To ensure that the refractive index of the material did not vary throughout the lens structure, 100%
infill (hexagon fill pattern with combined infill every 2 layers) was chosen.• For PLA material, an extrusion temperature of 220 ◦C was used with a 50 ◦C platform temperature
that was found to be high enough to minimize temperature-induced distortions during production.This was coupled with automatic cooling fan control to further improve build accuracy.
• A 0.4 mm aperture brass extrusion nozzle was utilized for all fabrication. The .stl files requiredfor the 3D printing process were generated within the SolidWorks software directly from the 3Dmodels using the following tessellation settings:
◦ A binary file type.

Designs 2019, 3, 28 4 of 11
◦ A deviation tolerance of 0.0043 mm.◦ An angular tolerance of 0.5◦.
Designs 2019, 3, x FOR PEER REVIEW 4 of 12
Figure 2. Dimensions of the designed lenses (a) showing diameter and apex height and (b) a close-up of the AR structure for the AR structure lens. (c) shows an isometric view of both lenses (blue lens = smooth, red lens = AR structure).
The FFF 3D printing equipment chosen for creating the lenses was a Flashforge Guider II (FlashForge Corporation, Zhejiang, China). This equipment and PLA building material were chosen firstly as a way of building upon previous research by the authors [12,13], and secondly as a choice that represents commonly available FFF 3D printing equipment and material. Suitable processing parameters were identified through the prior experiences of the team and through path finding experimental work; approx. 50 lenses both with and without AR coatings were manufactured to assess the AR structure dimensions and print settings that were optimal for this study. The determined optimal settings were: • A raft was enabled to prevent curvature of the lens’s flat face during production. • To ensure accuracy, ‘high print accuracy’ settings were used: a 0.12 mm layer height (0.20 mm
for first layer) a print speed of 50 mm/s and a travel speed of 70 mm/s. • To ensure that the refractive index of the material did not vary throughout the lens structure,
100% infill (hexagon fill pattern with combined infill every 2 layers) was chosen. • For PLA material, an extrusion temperature of 220 °C was used with a 50 °C platform
temperature that was found to be high enough to minimize temperature-induced distortions during production. This was coupled with automatic cooling fan control to further improve build accuracy.
• A 0.4 mm aperture brass extrusion nozzle was utilized for all fabrication. The .stl files required for the 3D printing process were generated within the SolidWorks software directly from the 3D models using the following tessellation settings:
o A binary file type. o A deviation tolerance of 0.0043 mm. o An angular tolerance of 0.5°.
For the build setup and generation of the tool path G code, FlashPrint 3.25.1 64 bit version was used (FlashForge Corporation, Zhejiang, China). To check for any inherent lens properties that may be a result of the FFF building process characteristics, the lenses were manufactured in different
Figure 2. Dimensions of the designed lenses (a) showing diameter and apex height and (b) a close-upof the AR structure for the AR structure lens. (c) shows an isometric view of both lenses (blue lens =
smooth, red lens = AR structure).
For the build setup and generation of the tool path G code, FlashPrint 3.25.1 64 bit version was used(FlashForge Corporation, Zhejiang, China). To check for any inherent lens properties that may be a resultof the FFF building process characteristics, the lenses were manufactured in different rotations and indifferent locations of the building table (however, all lenses were manufactured with the ‘flat’ surface ontothe building table, to maximize geometrical accuracy and remove the need for supporting structures).
The material for part fabrication was a white pigmented ECO Super Premium 1.75 mm diameterPLA filament (1 kg spool, 3306362, Creative Tools, Halmstad, Sweden). To minimize any potentialmaterial changes from ‘as produced’, the building material was maintained in a temperature andhumidity-controlled environment and protected from exposure to Ultraviolet (UV) light sources.The fabricated lenses were stored in sealed containers and measured within 3 days of fabrication toavoid any potential degradation issues with the PLA material.
Using the aforementioned designs, equipment, material and settings, six smooth lenses and sixAR structure lenses were fabricated for intensity measurements. To hold the lenses in place during themeasurements, a holding frame was designed that would ensure that it did not function as part of thefocusing system and thus contribute to measurements. The holder was designed to ensure a smallinterference fit with the produced lenses so that they were mechanically held in place with the flat facein line and parallel to the holder face.
2.2. FEKO Simulation
To verify the ‘smooth’ and ‘AR structure’ lens designs prior to fabrication, they weresimulated using FEKO (Altair Engineering Inc., Troy, MI, USA) electromagnetic simulation software.The simulation numerically computed the near-field, at 60 GHz after the lens component, to verifythe focal length and intensity. The FEKO simulations are based on the Method of Moments (MoM)

Designs 2019, 3, 28 5 of 11
and the lens (smooth and AR structure) models were converted in SolidWorks to the universal InitialGraphics Exchange Specification (IGES) file type and then imported into FEKO. For simulation theexcitation source was a plane wave. The dielectric constant was set to εr = 2.74 to match the PLAbuilding material, and the conductivity of the PLA was set to zero.
The focal point of the simulated lenses was defined as the position where the maximum intensityvalue of the electric field occurred, after the apex of the lens, based on the near-field results. The focallength was then recorded as the distance between the lens apex and the focal point. The holder for thelens was not included in the simulation as it was not part of the focusing system.
2.3. Radar Setup and Intensity Measurement
The radar setup was the same as in previous work by the authors [13] with the exception ofutilizing a lens holder that did not contribute to the focusing design (see Figure 3). The lens was placedin front of the radar emitter at the specified focal position (50 mm). The lens refracts the incidentelectromagnetic wave by reducing the speed of propagation through the refractive material (PLA).The measurement, described in Figure 3, uses a Printed Circuit Board (PCB) radar sensor, a lens holderand a trihedral metallic radar reflector. The smooth lenses (six) and the AR structure lenses (six) weremeasured using the same setup and distances. The measurement was a measure of the radar responsewith comparison between the smooth and AR version to determine if the AR structure had the designedeffect on the signal intensity; the actual reflectivity from the lens surface was not measured. The reasonfor this is that the improvement of the lens efficiency was considered of greatest importance for an enduser application and thus was the focus of this study.
Designs 2019, 3, x FOR PEER REVIEW 6 of 12
the 3D printed lenses were measured and averaged over ten radar sweeps. The lenses were re-measured after rotation along the radar beam axis to monitor any potential polarization effects.
Figure 3. Schematic of the experimental setup for intensity measurements using the 3D printed lenses: (a) view from behind the radar device towards the reflector (not shown), (b) view from the front of the radar device towards the detector (shown), (c) representation of the lens focusing effect from the emitter to the reflector and vice-versa (lens shown in holder).
3. Results
3.1. Lens Fabrication
The lenses were successfully fabricated and examples are shown in Figure 4. There were surface artefacts on all of the smooth and AR structure lenses caused by over extrusion and tool paths. These artefacts were not removed from the lenses for intensity measurement to ensure that they were the 3D printed lenses that were measured and not manually modified lenses. These artefacts were found on all lenses with their general location the same; however, the specific shape and location varied from lens to lens with no consistency observed. Across the build plate and in multiple orientations the artefacts were consistently found but there was no consistency found in the shape and exact location.
Figure 3. Schematic of the experimental setup for intensity measurements using the 3D printed lenses:(a) view from behind the radar device towards the reflector (not shown), (b) view from the front ofthe radar device towards the detector (shown), (c) representation of the lens focusing effect from theemitter to the reflector and vice-versa (lens shown in holder).

Designs 2019, 3, 28 6 of 11
The reflector was placed in a fixed position at 1450 mm from the radar emitter surface as determinedby the end use target considerations; both the lens diameter and the reflector dimensions were keptat or below 10 wavelengths (i.e., 50 mm). The measurement setup was chosen to maintain the farfield approximation.
At the beginning of the evaluation of the smooth and AR structured lenses, a smooth lens wasfixed within the holder and height alignment of the radar, lens and reflector was performed using alaser level. The radar was then connected and driven via MATLAB and a laptop (the MATLAB codeand radar device are proprietary technologies). The radar sensor and lens were micrometer (precisionof 10/100 µm) adjusted to maximize the signal intensity. The radar sensor has millimeter accuracy,and a target detection resolution of approximately 2.5 cm. The intensity measurements for each of the3D printed lenses were measured and averaged over ten radar sweeps. The lenses were re-measuredafter rotation along the radar beam axis to monitor any potential polarization effects.
3. Results
3.1. Lens Fabrication
The lenses were successfully fabricated and examples are shown in Figure 4. There were surfaceartefacts on all of the smooth and AR structure lenses caused by over extrusion and tool paths. Theseartefacts were not removed from the lenses for intensity measurement to ensure that they were the 3Dprinted lenses that were measured and not manually modified lenses. These artefacts were found onall lenses with their general location the same; however, the specific shape and location varied fromlens to lens with no consistency observed. Across the build plate and in multiple orientations theartefacts were consistently found but there was no consistency found in the shape and exact location.Designs 2019, 3, x FOR PEER REVIEW 7 of 12
Figure 4. Image showing lenses on the 3D printer building bed (a) and examples of the smooth (b) and AR structure (c) lenses with inherent surface artefacts.
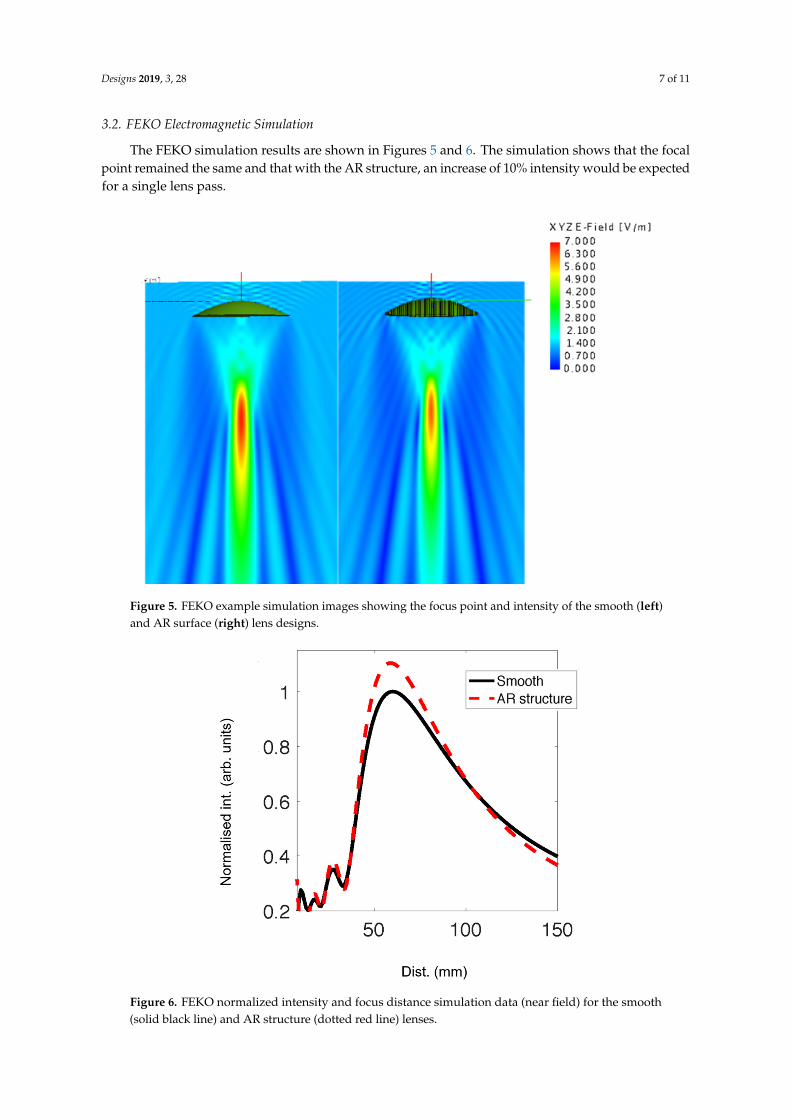
3.2. FEKO Electromagnetic Simulation
The FEKO simulation results are shown in Figure 5 and Figure 6. The simulation shows that the focal point remained the same and that with the AR structure, an increase of 10% intensity would be expected for a single lens pass.
Figure 4. Image showing lenses on the 3D printer building bed (a) and examples of the smooth (b) andAR structure (c) lenses with inherent surface artefacts.
Designs 2019, 3, 28 7 of 11
3.2. FEKO Electromagnetic Simulation
The FEKO simulation results are shown in Figures 5 and 6. The simulation shows that the focalpoint remained the same and that with the AR structure, an increase of 10% intensity would be expectedfor a single lens pass.Designs 2019, 3, x FOR PEER REVIEW 8 of 12
Figure 5. FEKO example simulation images showing the focus point and intensity of the smooth (left) and AR surface (right) lens designs.
Figure 6. FEKO normalized intensity and focus distance simulation data (near field) for the smooth (solid black line) and AR structure (dotted red line) lenses.
Figure 5. FEKO example simulation images showing the focus point and intensity of the smooth (left)and AR surface (right) lens designs.
Designs 2019, 3, x FOR PEER REVIEW 8 of 12
Figure 5. FEKO example simulation images showing the focus point and intensity of the smooth (left) and AR surface (right) lens designs.
Figure 6. FEKO normalized intensity and focus distance simulation data (near field) for the smooth (solid black line) and AR structure (dotted red line) lenses.
Figure 6. FEKO normalized intensity and focus distance simulation data (near field) for the smooth(solid black line) and AR structure (dotted red line) lenses.

Designs 2019, 3, 28 8 of 11
3.3. Intensity Measurement
The intensity of the received signal clearly increased in maximum magnitude when replacing asmooth lens with an AR structure lens. Maximum average intensity for six smooth lenses was measuredto be 22.2 ± 0.91 and for six AR structure lenses to be 24.0 ± 0.54 (all lenses were manufactured inthe same batch). This showed an average of 8% increase in signal strength from the radar reflector.The uncertainty in these figures is the mean absolute error from the measurement. Figure 7a showsrepresentative data that was collected.
Designs 2019, 3, x FOR PEER REVIEW 9 of 12
3.3. Intensity Measurement The intensity of the received signal clearly increased in maximum magnitude when replacing a
smooth lens with an AR structure lens. Maximum average intensity for six smooth lenses was measured to be 22.2 ± 0.91 and for six AR structure lenses to be 24.0 ± 0.54 (all lenses were manufactured in the same batch). This showed an average of 8% increase in signal strength from the radar reflector. The uncertainty in these figures is the mean absolute error from the measurement. Figure 7 (a) shows representative data that was collected.
(a) (b)
Figure 7. (a) Representative data collected with the radar reflected from the radar reflector through a smooth lens (solid, black line) and an AR structure lens (dashed, red line); (b) Magnification around the maximum intensity, the position of the radar reflector, including bars indicating the mean absolute error of the respective measurements, (solid black line = smooth; dashed red line for AR structure).
4. Discussion
4.1. Lens Fabrication
Lenses were successfully fabricated using the settings determined in the method section. Previous works [8–10,12,13] have shown the fabrication of hyperbolic lenses to be achievable; however, this is the first instance where wavelength-matched AR structures were also 3D printed. FFF 3D printing was shown to be capable of producing AR structures of sufficiently small dimensions for 60 GHz application.
Artefacts from the manufacturing process (i.e., they are not present in the .stl or G code files) were identified on the surface of all smooth and AR lenses. This highlights that the process control is being pushed beyond its limits, for this particular setup, which results in additional material in certain locations. There was no consistency found in the exact shape and amount of these artefacts and during intensity measurements, the lens variability was within the error margins for the whole batch of the lenses (apart from one significant outlier (discussed in section 4.2)). The actual effect of these artifacts will be further assessed in a future study.
Future work will investigate other FFF machines to further elucidate any surface artefacts and to try and reduce the separation distance and thickness of the AR structure as this should, theoretically, improve the effectiveness of the AR coating and increase the signal intensity.
For this study, the material and fabrication parameters were kept constant; however, future work will investigate the effects of machine parameters, crystallinity, composition and refractive index of different materials on the signal specifics.
4.2. FEKO Simulation and Intensity Measurement
The increase in intensity for the simulated focal point was 10% with AR structure and the increase in measured intensity for the radar reflector peak was 8%. The reason for the larger increase
Figure 7. (a) Representative data collected with the radar reflected from the radar reflector through asmooth lens (solid, black line) and an AR structure lens (dashed, red line); (b) Magnification around themaximum intensity, the position of the radar reflector, including bars indicating the mean absoluteerror of the respective measurements, (solid black line = smooth; dashed red line for AR structure).
4. Discussion
4.1. Lens Fabrication
Lenses were successfully fabricated using the settings determined in the method section. Previousworks [8–10,12,13] have shown the fabrication of hyperbolic lenses to be achievable; however, this isthe first instance where wavelength-matched AR structures were also 3D printed. FFF 3D printing wasshown to be capable of producing AR structures of sufficiently small dimensions for 60 GHz application.
Artefacts from the manufacturing process (i.e., they are not present in the .stl or G code files)were identified on the surface of all smooth and AR lenses. This highlights that the process control isbeing pushed beyond its limits, for this particular setup, which results in additional material in certainlocations. There was no consistency found in the exact shape and amount of these artefacts and duringintensity measurements, the lens variability was within the error margins for the whole batch of thelenses (apart from one significant outlier (discussed in Section 4.2)). The actual effect of these artifactswill be further assessed in a future study.
Future work will investigate other FFF machines to further elucidate any surface artefacts and totry and reduce the separation distance and thickness of the AR structure as this should, theoretically,improve the effectiveness of the AR coating and increase the signal intensity.
For this study, the material and fabrication parameters were kept constant; however, future workwill investigate the effects of machine parameters, crystallinity, composition and refractive index ofdifferent materials on the signal specifics.
4.2. FEKO Simulation and Intensity Measurement
The increase in intensity for the simulated focal point was 10% with AR structure and the increasein measured intensity for the radar reflector peak was 8%. The reason for the larger increase shown by

Designs 2019, 3, 28 9 of 11
the simulation is twofold. Firstly, the simulation works with idealized conditions with no losses inthe material and an AR structure matching exactly the design, without any manufacturing anomalies.Secondly, the measured signal has to pass through the lens twice since the radar PCB both emits andcollects the radar sweep.
In the actual measurement, where the radar beam passes twice through the radar, a certain amountof radiation is reflected at each passing of the radar. Given that the initial intensity that the lensaperture could collect is I0, a fraction n0 is passed through the lens, yielding an intensity of I0n0 behindthe lens. After reflection from the radar target, approximately the same fraction passes the lens againand the intensity collected by the radar is then I0n0
2. If we improve the losses due to reflection by theAR structure, the transmission coefficient would increase slightly to n1, yielding a returned intensityof I0n1
2 at the receiving antennas of the radar. Comparing the collected intensities at the radar withsmooth lenses and AR structured lenses gives an increase of 8%, which is illustrated in Equation (3).
1.08 =I0
I0
n12
n02 ⇔n1
n0= 1.04 (3)
By this argumentation, the measured intensity-increase of 8% on the collected radar data couldamount to a 4% actual increase for the transmission of a single lens passing of the radar beam. The meanabsolute error shown above and presented as error bars in Figure 7 indicates that a 4% increase in signalwould be detectable since the error bars would not overlap significantly. Using the same reasoning theexpected improvement given by the FEKO simulation results would be 1.12, or 1.21 (i.e., a 21% increasein signal when the radar beam passes twice (1.1 × 1.1) through the lens–emission and target reflection).The simulation utilizes perfect conditions and materials; therefore, 21% indicates a maximum thresholdfor the signal increase that is attainable from the specified lens design with the AR structure. This is aconsiderable improvement on 8% and motivates further study by the authors into the cause of thediscrepancies between simulation and actual measurement.
The data collected on the six different smooth lenses have a mean absolute error approx. 70% largerthan the data collected on the six different lenses with AR structures. This is due to data collected fromone specific smooth lens showing considerably higher intensity than the other smooth lenses; almostas high an intensity as the lenses with AR structures. The smooth lens with the outlying intensity wasnevertheless included in the measurement set for completeness. Repeated measurements performedat a later time still indicated that this lens yields higher intensity, which might be explained by theinherent variability of the 3D printing process across the building platform.
Future investigation will utilize different AR structures for comparison to those used in this studyto determine the potential effect of this on the intensity of the signal obtained.
Author Contributions: R.J.F.: Investigation, methodology; formal analysis; writing—original draft preparation,writing—review and editing; M.G.-G.: Conceptualization, investigation, methodology; formal analysis;writing—original draft preparation, writing—review and editing; E.N.: Conceptualization, investigation, methodology;formal analysis; writing—review and editing, funding acquisition; B.P.A.: Conceptualization, investigation,methodology; formal analysis; writing—original draft preparation, writing—review and editing; supervision;project administration.
Funding: This research was funded by the Knowledge Foundation (KK-stiftelsen) of Sweden, grant number2016/0303, awarded to B.P.A.
Conflicts of Interest: The authors declare no conflict of interest. The funders had no role in the design of thestudy; in the collection, analyses, or interpretation of data; in the writing of the manuscript, or in the decision topublish the results.

Designs 2019, 3, 28 10 of 11
References
1. Evans, R.J.; Farrell, P.M.; Felic, G.; Duong, H.T.; Le, H.V.; Li, J.; Li, M.; Moran, W.; Skafidas, E. Consumerradar: Opportunities and challenges. In Proceedings of the 2014 11th European Radar Conference, Rome, Italy,8–10 October 2014; IEEE: New York, NY, USA, 2014; pp. 5–8.
2. Dickmann, J.; Klappstein, J.; Hahn, M.; Appenrodt, N.; Bloecher, H.L.; Werber, K.; Sailer, A. Automotive radarthe key technology for autonomous driving: From detection and ranging to environmental understanding.In Proceedings of the 2016 IEEE Radar Conference (RadarConf), Philadelphia, PA, USA, 2–6 May 2016; IEEE:New York, NY, USA, 2016; pp. 1–6.
3. Sánchez-Oro, J.; Fernández-López, D.; Cabido, R.; Montemayor, A.S.; Pantrigo, J.J. Urban Traffic Surveillancein Smart Cities Using Radar Images; Springer: Berlin/Heidelberg, Germany, 2013; pp. 296–305.
4. Diraco, G.; Leone, A.; Siciliano, P. A Radar-Based Smart Sensor for Unobtrusive Elderly Monitoring inAmbient Assisted Living Applications. Biosensors 2017, 7, 55. [CrossRef] [PubMed]
5. Goldsmith, P.F. Quasi-optical techniques. Proc. IEEE 1992, 80, 1729–1747. [CrossRef]6. Piksa, P.; Zvanovec, S.; Cerny, P. Elliptic and Hyperbolic Dielectric Lens Antennas in mm-Waves.
Radioengineering 2011, 20, 270–275.7. Goulas, A.; Friel, R.J. Laser sintering of ceramic materials for aeronautical and astronautical applications.
Laser Addit. Manuf. 2017, 373–398. [CrossRef]8. Paolella, A.C.; Fisher, C.D.; Corey, C.; Foster, D.; Silva-Saez, D. 3-D Printed Millimeter-Wave Lens Systems at
39 GHz. IEEE Microw. Wirel. Components Lett. 2018, 28, 464–466. [CrossRef]9. Lacombe, E.; Gianesello, F.; Bisognin, A.; Lacombe, E.; Luxey, C.; Bisognin, A.; Titz, D.; Gulan, H.; Zwick, T.;
Costa, J.; et al. Low-cost 3D-printed 240 GHz plastic lens fed by integrated antenna in organic substratetargeting sub-THz high data rate wireless links. In Proceedings of the 2017 IEEE International Symposium onAntennas and Propagation & USNC/URSI National Radio Science Meeting, San Diego, CA, USA, 9–14 July 2017;IEEE: New York, NY, USA, 2017; pp. 5–6.
10. Yi, H.; Qu, S.W.; Ng, K.B.; Chan, C.H.; Bai, X. 3-D Printed Millimeter-Wave and Terahertz Lenses with Fixedand Frequency Scanned Beam. IEEE Trans. Antennas Propag. 2016, 64, 442–449. [CrossRef]
11. Ratni, B.; de Lustrac, A.; Piau, G.P.; Burokur, S.N. 3D printed gradient index dielectric metasurface for beamsteering applications. In Proceedings of the 2017 11th European Conference on Antennas and Propagation (EUCAP),Paris, France, 19–24 March 2017; IEEE: New York, NY, USA, 2017; pp. 3402–3404.
12. Ernst, R.; Nilsson, E.; Viberg, P.-A. 60GHz vital sign radar using 3D-printed lens. In Proceedings of the 2016IEEE SENSORS, Orlando, FL, USA, 30 October–3 November 2016; IEEE: New York, NY, USA, 2016; pp. 1–3.
13. Hagström, A.L.; Vass, L.A.M.; Liu, F.; Gerling, M.; Karlsson, P.O.; Nilsson, E.; Andreasson, B.P. An iterativeapproach to determine the refractive index of 3D printed 60GHz PLA lenses. In Proceedings of the LoughboroughAntennas & Propagation Conference 2018 (LAPC 2018), Loughborough, UK, 12–13 November 2018; IET: London,UK, 2018.
14. Pourahmadazar, J.; Denidni, T.A. Towards Millimeter-wavelength: Transmission-Mode Fresnel-Zone PlateLens Antennas using Plastic Material Porosity Control in Homogeneous Medium. Sci. Rep. 2018, 8, 5300.[CrossRef] [PubMed]
15. Han, Z.W.; Wang, Z.; Feng, X.M.; Li, B.; Mu, Z.Z.; Zhang, J.Q.; Niu, S.C.; Ren, L.Q. Antireflective surfaceinspired from biology: A review. Biosurf. Biotribol. 2016, 2, 137–150. [CrossRef]
16. Ransom, P.; Larimore, Z.; Jensen, S.; Mirotznik, M.S. Fabrication of wideband antireflective coatings usingfused deposition modelling. Electron. Lett. 2016, 52, 352–354. [CrossRef]
17. Larimore, Z.; Jensen, S.; Parsons, P.; Good, B.; Smith, K.; Mirotznik, M. Use of space-filling curves for additivemanufacturing of three dimensionally varying graded dielectric structures using fused deposition modeling.Addit. Manuf. 2017, 15, 48–56. [CrossRef]
18. Qu, S.W.; Yi, H.; Chan, C.H.; Ng, K.B. Low-cost discrete dielectric terahertz lens antenna using 3D printing.In Proceedings of the 2014 IEEE Conference on Antenna Measurements & Applications (CAMA), Antibes Juan-les-Pins,France, 16–19 November 2014; IEEE: New York, NY, USA, 2014; pp. 1–3.
19. Jahn, D.; Weidenbach, M.; Becker, L.; Lehr, J.; Busch, S.F.; Monnai, Y.; Balzer, J.C.; Koch, M. 3D printedchirped dielectric waveguide for focusing applications. In Proceedings of the 2016 41st International Conferenceon Infrared, Millimeter, and Terahertz waves (IRMMW-THz), Copenhagen, Denmark, 1 December 2016; IEEE:New York, NY, USA, 2016; pp. 1–2.

Designs 2019, 3, 28 11 of 11
20. Gulkis, P.; Kollberg, S.; Winnesser, E.; Kaufmann, G. Quasi-Optical Techniques. In Coherent Detectionat Millimeter Wavelengths and Their Applications, Les Houches Series; Encrenaz, G., Laurent, P., Gulkis, C.,Kollberg, S., Winnesser, E., Eds.; Nova Science Publishers: Hauppauge, New York, NY, USA, 1991.
21. Busse, L.E.; Frantz, J.A.; Shaw, L.B.; Aggarwal, I.D.; Sanghera, J.S. Review of antireflective surface structureson laser optics and windows. Appl. Opt. 2015, 54, 303. [CrossRef] [PubMed]
© 2019 by the authors. Licensee MDPI, Basel, Switzerland. This article is an open accessarticle distributed under the terms and conditions of the Creative Commons Attribution(CC BY) license (http://creativecommons.org/licenses/by/4.0/).